A Home for Everyone. San Joaquin Valley Housing Preferences and Opportunities to 2050 ARTHUR C. NELSON
|
|
|
- Ernest Melton
- 5 years ago
- Views:
Transcription


1 A Home for Everyone San Joaquin Valley Housing Preferences and Opportunities to 2050 ARTHUR C. NELSON
2 Council of Infill Builders The Council of Infill Builders is a 501(c)(3) nonprofit corporation of real estate professionals committed to improving California through infill development. Infill development revitalizes neighborhoods and communities, provides transportation choices, creates viable close-knit, mixed-use areas, reduces greenhouse gas emissions, and improves the overall economy. Our organization seeks to educate the public and decision-makers about these benefits by conducting and supporting research on market-based solutions for healthy, prosperous and convenient communities. The Council of Infill Builders is pleased to present this report as a contribution to the scholarship on infill development in California. We hope that this scholarship and data will inform the decision-making process related to growth and development and lead to improved outcomes for California s cities and counties. For more information: councilofinfillbuilders.org staff@councilofinfillbuilders.org This report is available online: councilofinfillbuilders.org/resources/valley-housing.html
3 A Home for Everyone San Joaquin Valley Housing Preferences and Opportunities to 2050 Arthur C. Nelson, Ph.D., FAICP Prepared for the Council of Infill Builders editing + design: Dave Davis January 23, 2013
4 What s Inside Executive Summary Major Trends Facing the San Joaquin Valley Support for Transportation Options and Preservation of Farmland and Open Spaces 2. Housing Preferences, or What Valley Residents Want Market Demand and Market Viability for Attached and Detached Housing 4. Space-Occupying Jobs and Nonresidential Space Redevelopment 5. A Strategy to Implement the Scenario Toward a New San Joaquin Valley APPENDICES: DATA TABLES FOR VALLEY COUNTIES A. Fresno County B. Kern County C. Kings County D. Madera County E. Merced County F. San Joaquin County G. Stanislaus County H. Tulare County Endnotes References This report is available online: councilofinfillbuilders.org/reports/valley-housing.html


5 Executive Summary People are coming to the San Joaquin Valley. California s fastest-growing region will grow in household population by 72% over the next four decades, from 3.8 million in 2010 to 6.6 million in That growth will require creating homes for nearly 700,000 new households. If future decision-making followed past trends, Valley leaders would accommodate most of this growth through large-lot, low-density, single-family homes: approximately 90% of the average annual residential permits issued in the Valley during were for single-family homes. In addition, the past model of decision-making would enable the conversion of hundreds of thousands of acres of farmland to development to accommodate the millions of new residents. As a recent report from the American Farmland Trust found, Valley cities and counties are on pace at current trends to convert nearly 600,000 acres of irreplaceable farmland by 2050, resulting in lost economic value of $100-$190 billion. San Joaquin Stanislaus Merced Madera Fresno Kings Tulare Kern The San Joaquin Valley s Eight Counties SJ VALLEY HOUSING PREFERENCES AND OPPORTUNITIES TO

6 But that growth scenario presumes the housing market of the future looks like the housing market of the past. This report challenges that assumption. By analyzing the latest economic and demographic trends facing the Valley, it finds that market trends are fostering a renaissance for the region's cities and towns with more demand for walkable neighborhoods and homes closer to jobs and transit. The housing market of the future should therefore look noticeably different from business-as-usual development of the past. The Valley s leaders are currently engaged in a planning process to adopt growth and transportation plans for the next several decades as part of implementation of Senate Bill 375, California s Sustainable Communities and Climate Protection Act (Steinberg, 2008), which will culminate in October This study highlights forces of change including economic and financial trends, rising energy prices, and new population dynamics that will influence the future of the San Joaquin Valley. The forces of change give rise to the importance of planning for future generations by expanding housing options and choices. While many of the changes ahead are unclear, we can make choices today that build more sustainable communities, resilient in the area of change and offering residents a high quality of life. Patrick Kelly, AICP, Planning Manager, City of Modesto 2 A HOME FOR EVERYONE
7 The Council of Infill Builders therefore presents this report to help Valley residents and leaders plan for the new growth in ways that can improve and strengthen communities and quality of life. The report analyzes realestate trends and opportunities and poses a Scenario for the future growth of the San Joaquin Valley and its eight counties to CHANGING DEMAND IN THE VALLEY This report s key finding based on consumer preference data and economic trends is that the majority of future demand for new homes in the Valley will be for apartments, townhomes and small-lot, single family homes in walkable neighborhoods. This report builds upon a 2012 study prepared for the Fresno Council of Governments on behalf all of the Valley s regional agencies by The Concord Group. That study projected that up to 45% of all new occupied residential units built between 2010 and 2050 should be attached units such as apartments and townhomes in order to meet market demand by Using that data, this report analyzes likely demand for different types of detached, single-family housing units providing Valley leaders and residents with a broader assessment of housing supply and demand in the Valley. Preference surveys for the entire San Joaquin Valley, as well as a recent a consumer survey for Kern County, indicate that by 2050 up to 48% of the total housing demand will be for single-family homes on smaller lots (6,000 square feet or less). But only 5% of the current supply of single-family homes in the Valley are on small lots. Therefore, Valley leaders will need to build potentially all new single-family homes to 2050 on small lots to meet projected market demand. Economic and financial trends may also encourage Valley residents to reduce commutes and live in mixed-use, walkable communities. Rising gasoline prices and increasing traffic congestion may motivate people to live closer to their jobs. Between 2002 and late 2012, for example, gasoline prices rose by more than 10% per year compounded, or four times faster than inflation. If Valley leaders implement the strategy outlined in this report, the region s homes of the future will consume less farmland and be more connected to vibrant, walkable neighborhoods a trend driven both by consumer demand and economic changes. SJ VALLEY HOUSING PREFERENCES AND OPPORTUNITIES TO
8 THE VALLEY IS NOT PREPARED FOR NEW HOUSING TRENDS While this report finds that residents may increasingly demand apartments, townhomes and single family homes in walkable neighborhoods, the overwhelming majority of existing housing supply in the valley is single-family homes on larger lots. Valley communities may already have about as many existing homes on larger lots (those over 6,000 square feet) in 2010 as they need by While these homes may have met demand in the past, emerging markets appear to prefer different housing options, and Valley leaders should adjust planning and zoning regulations accordingly. The Scenario presented in this report suggests that Valley decision-makers can better match supply and demand by ensuring that all new detached units feature small-lot configurations in walkable communities. Figure A indicates the current 2010 supply and projected 2050 demand for attached (apartments, townhomes and condominiums), smaller-lot, walkable single-family detached homes, and large-lot conventional singlefamily homes ( all other lots ). By comparing current supply to future demand, Figure A reveals the nature of future demand for these broad housing types. Valley residents and leaders would therefore be wise to anticipate these changes and plan for them. Several Valley cities have already begun this process. For example, the City of Turlock recently amended its general plan to include a housing mix that looks substantially different from past patterns but very similar to the Scenario. HOW THE VALLEY CAN ADDRESS THE CHALLENGE To address these coming changes, Valley leaders can substantially reshape the region by accommodating a large share of new growth through the infill and mixed-use redevelopment of existing nonresidential areas. Much of the current developed urban footprint in the Valley is in low-density configurations along major corridors and in urban centers. Almost all nonresidential development outside Valley downtowns is built at a floor-area-ratio (FAR) of less than 0.20, meaning that at least 80% of the land on which these This report found that the majority of future demand for new homes in the Valley will be for apartments, townhomes and small-lot, single family homes in walkable neighborhoods. Valley communities may already have about as many existing homes on larger lots (those over 6,000 square feet) in 2010 as they need by A HOME FOR EVERYONE
9 Thousands Supply 2010 Demand 2050 New Homes to Meet Demand Attached Small Lot All Other Lots Figure A. Supply of Occupied Units by Housing Type (2010), Demand by 2050, and Additional Homes to Meet Projected Demand for structures sit is used for parking, loading, storage or other non-structural uses, a highly unsustainable and extremely inefficient land-use development model. With only minor changes to zoning and development regulations to facilitate a mix of uses, cities and counties can accommodate substantially more housing, commercial and retail activity along these corridors and centers without compromising parking needs. The result would be more efficient use of land supporting these activities, less new farmland to be developed, and facilities that can be provided at less cost per unit of development served. SJ VALLEY HOUSING PREFERENCES AND OPPORTUNITIES TO
10 This report finds that nearly all nonresidential growth, as well as all new attached residential demand, could be accommodated through the infill and redevelopment of existing low-density areas, substantially reducing pressure to develop new farmland. In addition to seizing infill and redevelopment opportunities, Valley leaders should require that any new communities are mixed-use and connected to existing centers. They can develop public-private-nonprofit partnerships to take advantage of emerging market opportunities. Elected officials and planners in the Valley will have to balance competing demands to make decisions about the future of their communities. This report seeks to inform this process by highlighting the dual, mutually reinforcing opportunities to provide a mix of housing types to meet the needs of a diverse new market while also helping to preserve one of the valley s most prized natural and economic resources its irreplaceable farmlands. Ultimately, Valley leaders can accomplish both objectives with the support of local residents, businesses and supportive state policies. Coincidentally and through an entirely independent analysis, the City of Turlock concluded in its recently adopted general plan that only 55% of housing growth needs to be single-family, thereby correcting the overproduction of single-family units (83%) that occurred during the last housing boom. By the end of the planning period, the city will have a market-based housing mix that provides more affordable housing opportunities to meet the needs of a growing and changing community. Debbie Whitmore, Deputy Director, Development Services, City of Turlock 6 A HOME FOR EVERYONE

11 Major Trends Facing the San Joaquin Valley People are coming to the San Joaquin Valley. California s fastest-growing region will grow in household population by 72% over the next four decades, from 3.8 million in 2010 to 6.6 million in That growth will require creating homes for nearly 700,000 new households. If the past is any indication of future decision-making, most of this growth will be accommodated in large-lot, low-density, single-family homes: approximately 90% of building permits over the past decade in the Valley have been issued for this kind of housing. Hundreds of thousands of acres of farmland will be converted to development to accommodate the millions of new residents. As a recent report from the American Farmland Trust (Unger and Thompson 2013) found, Valley cities and counties are converting their irreplaceable farmland resources to development at an alarming rate. If current trends continue, nearly 600,000 acres of farmland will be permanently converted by 2050, resulting in lost economic value of $100-$190 billion. The Valley s leaders are currently engaged in a planning process to adopt growth and transportation plans for the next several decades as part of SJ VALLEY HOUSING PREFERENCES AND OPPORTUNITIES TO
12 Table A. Household Population Projections for the San Joaquin Valley New Household White, non- Hispanic All Other Total New Majority Year Population Hispanic All Races Races Majority Share ,848,803 1,451,451 1,820, ,015 2,397,352 62% ,513,592 1,199,020 2,548, ,907 3,314,572 73% ,557, ,319 3,583,472 1,038,566 4,622,038 83% ,632, ,408 4,592,912 1,310,467 5,903,379 89% ,789 (252,431) 728, , , % % 17% -17% 40% 33% 38% ,708,554 (516,132) 1,763, ,551 2,224, % % 44% -36% 97% 80% 93% ,783,984 (722,043) 2,772, ,452 3,506, % % 72% -50% 152% 127% 146% ---- * Figures more than 100% indicate white, non-hispanic population reductions are offset by growth in the New Majority. Figures may not sum due to rounding. Source: Adapted from The Planning Center (2012) based on the sum of individual counties. implementation of Senate Bill 375, California s Sustainable Communities and Climate Protection Act (Steinberg, 2008), which will culminate in October The Council of Infill Builders therefore presents this report to help Valley residents and leaders plan for the new growth in ways that can improve and strengthen communities and quality of life. The report analyzes real estate trends and opportunities and poses a Scenario for the future growth of the San Joaquin Valley s eight counties to Table A shows the growth projected for the San Joaquin Valley as a whole as developed by The Planning Center. 1 It includes projections of the household population as well as projections for white non-hispanics, Hispanics of all races, all other people, and the total New Majority household population (comprised of Hispanics of all races plus Asians, African Americans, Native Americans and others), including their share, over the period 2010 to The table also details the changes in household population from 2010 to 2020, 2035 and (Figures for the eight individual counties are available in the appendices.) 8 A HOME FOR EVERYONE
13 While the San Joaquin Valley will grow substantially, it will also become much more diverse as the white non-hispanic population actually declines while Hispanics of all races become an even more dominant ethnic group. Although many other changes are also occurring, three are highlighted here: tighter home mortgage financing, lagging incomes and rising gasoline prices. These, plus overall demographics, become key factors that need to be considered when projecting housing demand. TIGHTER MORTGAGE FINANCING The Great Recession of was caused in large part by the bursting of the housing bubble in the middle 2000s. Banks and other financial institutions were closed, home equity saw its biggest decline since the start of the Great Depression, and millions of homes were foreclosed or sold short to avoid foreclosure. Numerous policy changes have come in the wake of this financial disaster. One of the changes is more rigorous analysis of prospective borrowers, often leading to higher credit scores to qualify. Another is that down payment requirements are increasing. This may affect home ownership rates substantially. In 2011, for instance, about two-thirds of American households were living in homes either owned outright or with a mortgage, and about two-thirds of those with a mortgage put less than 20% down. The National Association of Home Builders worries that requiring 20% down would disqualify about 5 million potential home buyers, 2 and this, in turn, would reduce the nation s home ownership rate to about 60% from the 2010 level of about 65%. 3 Consumers also appear to be changing their attitudes about buying homes. Cunningham (2009) of the National Foundation for Credit Counseling summarizes results of a 2009 survey it commissioned: The lack of confidence in consumers ability to buy a home, improve their current housing situation, or trust homeownership to provide a significant portion of their wealth sends a strong message about the impact of the housing crisis. It appears that whether a person was directly affected or not, Americans attitudes toward homeownership have shifted. (2009: 1) The survey also found that: 1. Almost one-third of those surveyed representing about 72 million people do not think they will ever be able to afford to buy a home % of those who once purchased a home, but no longer own it, do not think they will ever be able to afford to buy another one. SJ VALLEY HOUSING PREFERENCES AND OPPORTUNITIES TO
14 3. Of those who still own a home, 31% do not think they will ever be able to buy another home (upgrade from an existing home, buy a vacation home, etc.). Home ownership in the United States and California peaked in the mid-2000s and has declined since. It is expected to continue to fall in the coming years with the only question being how much lower. LAGGING INCOME Since the end of World War II, Americans have enjoyed consistently rising incomes. Between 1953 (the earliest year available) and 2000, median household income rose nearly 2.5 times in constant dollars. 4 Inflationadjusted median household income in 2010, however, was 6% lower than in In its projections of future jobs, data from the California Employment Development Department indicate that the mean annual salary of all occupations in the state will remain about the same between 2010 and Projections for the San Joaquin Valley over the period 2008 to 2018 are similar. 6 Stagnating incomes will moderate the ability of households to buy homes. RISING ENERGY COSTS Since the end of World War II, home ownership in the U.S. rose steadily, going from 55% in to 69% in A key reason was the vast supply of inexpensive land available for home building outside cities. Another reason was cheap gasoline: the cost of driving to work and other destinations was low. Since 2000, energy prices have been rising steadily in real terms. Locations far away from work, shopping and other destinations are more expensive because of rising vehicle fuel costs. From 2002 to 2012, the national average price of a gallon of gasoline rose more than 10% per year (compounded). At this rate, gasoline prices may approach $8 per gallon by 2020 and perhaps more than $15 per gallon by While higher gasoline prices may be offset by more fuel-efficient vehicles, they tend to be more expensive than conventional vehicles. Steadily increasing gasoline prices will dampen the attractiveness of suburban fringe and exurban areas for home buying. On the other hand, homes closer to jobs and services are usually more expensive to purchase. As a consequence, consumers may demand more rental housing in areas that require less driving. 10 A HOME FOR EVERYONE

15 KEY FINDINGS These trends, plus the demographic changes outlined below, result in a housing market of the future that has little in common with the past. The ability to buy homes in the future may not be as easy as it was during the housing bubble of the 2000s. Higher mortgage underwriting standards plus higher down payments may mean lower home ownership rates in 2020, 2035 and 2050 than in 2010, which was already lower than Prospective buyers may also become more cautious in the future than the past in assuming their homes will appreciate in value. Incomes in 2020 may not be higher than in 2010, which were lower in real terms than Gasoline prices are rising several times faster than inflation and this may affect decision-making about where to live and buy probably to 2020 and beyond. SJ VALLEY HOUSING PREFERENCES AND OPPORTUNITIES TO


16 Professor Dowell Myers of the University of Southern California also identifies key demographic trends that will lead to more attached housing demand, as well as demand for smaller homes perhaps on smaller lots in the decades to come. Some key findings, along with their implications for the Scenario include: 9 The period from the late 2000s into the 2020s and perhaps beyond will see resurgence in the demand for attached housing, especially rental apartments. Baby boomers will sell off their homes between 2015 and Growing areas may be able to absorb many of the suburban homes that these seniors will sell off, but the result is that demand for new, especially large-lot suburban homes may be dampened. The market may return to the housing norms seen from the 1960s into the 1980s. They included a larger share of rental housing and apartment construction than subsequent eras. Those norms also included higher down payments for homes. As will be seen in the next several chapters, there are also emerging market preferences for new communities along with and infill/redevelopment that integrate different land uses, provide mixed-housing options, and enhance accessibility to key destinations through multiple modes of transportation. The overall effect of these factors may be substantially more demand than in the recent past for smaller homes on smaller lots, more rental units through new construction, and the conversion of owner-occupied homes into rental units, including accessory dwelling units. 12 A HOME FOR EVERYONE
; and that nearly all the demand for new detached residential units will be for lots")

17 PERSPECTIVES The Scenario presented in this report makes the case that all new attached residential and nonresidential development could be directed to infill and redevelopment of existing developed areas; that about 45% of all new housing demand will be for attached options (apartments, townhouses, condominiums); and that nearly all the demand for new detached residential units will be for lots of 6,000 square feet or less. This is based on a number of key perspectives: 1. The demographic profile of the San Joaquin Valley is changing dramatically. The Valley is projected to add nearly 3 million people by 2050, most of whom will what may be termed the New Majority, comprised of Hispanics of all races plus Asians, African Americans, Native Americans and others. In contrast, the white non-hispanic population is projected to fall by more than 700,000. Because New Majority households own homes at a lower rate than white non- Hispanic households, their population increase may impact on the demand for owner-occupied homes. 2. There will be a larger market for substantially more attached products, especially rental apartments. There will also be a bigger market for substantially more smaller detached homes on smaller lots. The region has historically under-delivered higher-density housing, particularly for renter households. The Concord Group, report prepared for Fresno County Council of Governments SJ VALLEY HOUSING PREFERENCES AND OPPORTUNITIES TO

18 3. The place where most of this redevelopment could occur will be outside downtowns and in suburban communities, especially along commercial corridors. They are also composed mostly of low-rise structures at relatively low FARs. Infill and redevelopment creates important benefits. It revitalizes neighborhoods and communities, provides the opportunity to expand transportation choices, enhances viable close-knit, mixed-use areas, reduces greenhouse gas emissions, and improves the overall economy (Nelson 2013). Unfortunately, because local governments have been stripped of key redevelopment powers, large-scale infill and redevelopment may be more difficult, at least in early years of the Scenario. However, the Legislature appears poised to re-establish the core functions of redevelopment, albeit updated with a focus on meeting the state's environmental goals. 4. Much of the rest of the demand for new development should be in new communities and other developments near existing urban and suburban centers that include mixed uses, such as mixedresidential options connected to the centers. The Scenario begins by reviewing emerging San Joaquin Valley citizen support for transportation options as well as the preservation of farmland and open spaces. These preferences can help to explain emerging market preference for more mixed-use development with more attached and small-lot detached home options than in the past. 14 A HOME FOR EVERYONE

19 1.Support for Transportation Options and Preservation of Farmland and Open Spaces Estimates of support for transportation options and for preserving farmland and other open spaces presented here are based on the Kern Council of Governments annual Community Survey, most recently for 2012, but also including historic surveys for reference. For the past several years, the Kern Council of Governments (COG) has used Godbe Research (2012) to gauge opinions of county residents. The Kern County survey is an opinion survey as opposed to a stated preference survey, the distinction between which will be made later. The Kern County survey has the largest sample size and is the longestrunning of any survey in the San Joaquin Valley. It is assumed that views of Kern County residents are reasonably consistent with those of the San Joaquin Valley as a whole. Later in this report, comparisons will be made between the Kern County survey with subsamples of San Joaquin Valley and Central Valley respondents to statewide and national surveys, and a market analysis by The Concord Group, that will demonstrate the reasonableness of this assumption. SJ VALLEY HOUSING PREFERENCES AND OPPORTUNITIES TO
20 Table 1.1. Support for Transit, Sidewalk, Bike Lanes, and Alternatives to Driving Alone among All Respondents Not important to extremely important Expanding local bus services % 5% 20% 27% 41% 68% % 5% 20% 28% 39% 67% Improving public transportation to other cities % 5% 18% 28% 44% 72% % 8% 17% 27% 43% 70% Maintaining and improving sidewalks and bike lanes % 6% 14% 33% 45% 78% % 5% 20% 27% 43% 70% Providing public transportation, carpooling and other alternatives to driving alone % 6% 18% 31% 41% 72% 2009* 4% 7% 21% 30% 38% 68% * Question was not asked in Figures may not sum due to rounding. Source: Adapted from Godbe Research (2012). The 2012 edition was based on a telephone survey of 1,201 residents gauging (a) overall opinions of the quality of life, (b) the importance of issues related to future quality of life, and (c) housing options. Because the survey has been conducted for several years, many questions have been asked regularly over the years. This allows for tracking of changes in opinions over time. Because of its large size, the survey also provides the opportunity to understand how opinions vary by demographic group. Finally, because almost all growth in the San Joaquin Valley to 2050 is projected to be attributable to the Hispanic population, the tables below summarize survey results for all respondents as well as Hispanic respondents. SUPPORT FOR TRANSPORTATION OPTIONS The survey asked respondents four questions relating to their support for transit, sidewalks, bike lanes, and providing alternatives to driving alone from the late 2000s to The results are reported in Table 1.1. The 2012 Godbe Research survey shows that support for: Expanding local bus service increased from 67% (2008) to 68%. Improving public transportation to other cities increased from 70% (2008) to 72%. 16 A HOME FOR EVERYONE
21 Table 1.2. Support for Transit, Sidewalk, Bike Lanes and Alternatives to Driving Alone among Hispanic and Non-Hispanic Respondents in 2012 Not important to extremely important Preference Non-Hispanic Respondents Expanding local bus services 7% 9% 24% 25% 34% 58% ---- Improving public transportation to other cities 7% 8% 21% 27% 35% 63% ---- Maintaining and improving sidewalks and bike lanes 3% 8% 18% 32% 39% 71% ---- Providing public transportation, carpooling and other alternatives to driving alone 7% 8% 21% 31% 33% 64% Hispanic Respondents Difference Expanding local bus services 4% 2% 16% 29% 44% 73% +25% Improving public transportation to other cities 2% 2% 16% 28% 52% 80% +27% Maintaining and improving sidewalks and bike lanes 1% 3% 9% 35% 50% 85% +20% Providing public transportation, carpooling and other alternatives to driving alone 1% 4% 14% 31% 49% 80% +26% * Figures may not sum due to rounding. Source: Adapted from Godbe Research (2012). Maintaining and improving sidewalks and bike lanes increased from 70% (2008) to 78%. Providing public transportation, carpooling, and other alternatives to driving alone increased from 68% (2009) to 72%. Assuming Kern County respondents attitudes about transportation are reasonably comparable to those of San Joaquin Valley residents as a whole, one may conclude that two-thirds or more of them would support efforts to expand alternatives to driving alone. Table 1.2 compares the level of support for alternatives to driving alone among non-hispanic (mostly white) and Hispanic respondents. In every case, Hispanic residents support for alternatives to driving alone exceeded those of non-hispanics by 20% to 27%. About eight in ten Hispanic residents would support more options to driving alone. SJ VALLEY HOUSING PREFERENCES AND OPPORTUNITIES TO
22 Table 1.3. Support for Farmland and Open Space Preservation among All Respondents Not important to extremely important Year Preventing the loss of farm land to residential and commercial development % 5% 15% 28% 48% 76% % 5% 20% 28% 39% 67% Preserving open spaces and native animal habitats % 5% 17% 28% 47% 75% % 8% 17% 27% 43% 70% * Figures may not sum due to rounding. Source: Adapted from Godbe Research (2012). With Hispanics projected to account for most of the new growth in the San Joaquin Valley, their preferences should be an important consideration for long-range transportation planning and investment. SUPPORT FOR FARMLAND AND OPEN SPACE PRESERVATION Table 1.3 shows the level of support for preserving farmland and open space for all respondents for 2008 and 2012, while Table 1.4 compares support between Hispanic and non-hispanic respondents for The level of support for farmland preservation among all residents has increased from two-thirds to three-quarters, while support for open space preservation has increased from 70% to three-quarters. Support for farmland and open space preservation is higher among Hispanics than non-hispanics, as seen in Table 1.4. As Hispanics are a substantial source of labor for the agricultural industry, one explanation may be that they are more concerned than others about losing the agricultural land base. Table 1.5 shows that over the period 1990 to 2008, about a quarter million acres of agricultural land were taken out of production, mostly through conversion to urban development. 10 The rate of loss is equivalent to 0.22 acres of farmland per new resident, or more than three-quarters of an acre per new household. At this rate, development could reduce the inventory of farmland in the San Joaquin Valley by another 600,000 acres by A HOME FOR EVERYONE
23 Table 1.4. Support for Farmland and Open Space Preservation among Hispanic and Non-Hispanic Respondents in 2012 Not important to extremely important Preference Non-Hispanic Respondents Preventing the loss of farm land to residential and commercial development 5% 3% 14% 27% 49% 76% ---- Preserving open spaces and native animal habitats 5% 8% 19% 29% 40% 70% ---- Hispanic Respondents Difference Preventing the loss of farm land to residential and commercial development 4% 5% 8% 28% 54% 82% +8% Preserving open spaces and native animal habitats 2% 3% 14% 27% 54% 81% +16% * Figures may not sum due to rounding. Source: Adapted from Godbe Research (2012). Table 1.5. Change in Agricultural Land , with Trend to 2050 Land Type Change % Change High Quality Farmland 5,671,987 5,228,902 (443,085) -8% Farmland of Local Importance 327, , ,290 50% Grazing Land 4,844,267 4,875,106 30,839 1% Agricultural Land Total 10,844,163 10,595,207 (248,956) -2% Population 2,742,000 3,885,963 1,143,963 42% Land Change per Capita Population ,632, Population Change ,746, Trend Agricultural Land Change (597,780) ---- * Figures may not sum due to rounding. Source: Adapted from Unger and Thompson (2013). SJ VALLEY HOUSING PREFERENCES AND OPPORTUNITIES TO


24 KEY FINDINGS Two key findings emerge from the Kern COG Community Survey that may be applicable to the San Joaquin Valley as a whole: More than two-thirds of all residents support transportation options such as adding buses, providing public transportation including expanded transit between cities, improving sidewalks and bike lanes, carpooling, and other alternatives to driving alone. Compared to non-hispanic residents, Hispanic residents express substantially more support for these options. Three quarters of all residents and eight in ten Hispanic residents support farmland and open space preservation, a significant trend considering that the supply of agricultural land fell by about onequarter of an acre per new resident from 1990 to At this pace, the Valley could lose 600,000 acres of productive farmland by A HOME FOR EVERYONE
 to establish the emerging market preference for attached, small-lot and all other detached-lot options.")
25 2.Housing Preferences, or What Valley Residents Want This chapter uses the Kern COG 2012 Community Survey along with a 2004 survey by the Public Policy Institute of California (PPIC) and a 2011 survey by the National Association of Realtors (NAR) to establish the emerging market preference for attached, small-lot and all other detached-lot options. KERN COG 2012 COMMUNITY SURVEY Using the Kern COG survey, Table 2.1 shows that the level of support for developing a variety of housing options, including townhouses, condominiums and apartments, has increased from about half in 2008 to about two-thirds in However, the differences of support among Hispanic and non- Hispanic respondents are stark. Table 2.2 shows that about half of non-hispanic respondents supported expanding housing options in the 2012 survey, while nearly eight in ten Hispanic respondents did. As most of the projected population growth in the San Joaquin Valley will be comprised of Hispanic households, policymakers should consider their level of support for expanding attached housing options. 11 SJ VALLEY HOUSING PREFERENCES AND OPPORTUNITIES TO
26 Table 2.1. Support for Developing a Variety of Housing Options among All Respondents Not important to extremely important Year Developing a variety of housing options, including apartments, townhouses and condominiums % 7% 19% 32% 34% 66% % 12% 27% 23% 29% 52% * Figures may not sum due to rounding. Source: Adapted from Godbe Research (2012). Table 2.2. Support for Developing a Variety of Housing Options among Hispanic and Non-Hispanic Respondents in 2012 Not important to extremely important Preference Non-Hispanic Respondents Developing a variety of housing options, including apartments, townhouses and condominiums 11% 10% 24% 27% 27% 53% ---- Hispanic Respondents Difference Developing a variety of housing options, including apartments, townhouses and condominiums 5% 3% 14% 37% 41% 78% +46% * Figures may not sum due to rounding. Source: Adapted from Godbe Research (2012). 22 A HOME FOR EVERYONE
. Apartment.")

27 Another question related to the kinds of housing options respondents wanted to have. The choices were: Single-family home with a small yard. Single-family home with a large yard. Townhouse or condominium. A building with offices and stores on the first floor and condominiums on the upper floors (shortened to condominiums in mixed-use buildings in the tables below). Apartment. It is important to note that respondents were not told the size range of a small or large yard, so their responses are in the context of what they perceive as small or large yards. This is common in surveys of this type. In the case of Kern County, most of the single-family detached homes sit on lots ranging between 6,000 and 10,000 square feet; this is the county s typical lot size. Although survey developers do not know whether respondents occupying homes on typical lots consider their yards to be small or large, they assume respondents would consider small yards to be smaller than their present lot. As a general guide, the cities of Merced and Modesto define small lots as 3,000 square feet or less. Assuming Kern COG survey respondents perceive a small lot to be 6,000 square feet or less would seem to err on the side of overstatement. Respondents could answer definitely yes, yes or no to every option, creating the possibility that any given respondent could answer the same way for each. This is not a stated-preference question based on tradeoffs, only an indication of support for each housing option. SJ VALLEY HOUSING PREFERENCES AND OPPORTUNITIES TO
28 Table 2.3. Support for Housing Options, Yes + Definitely Change Change Residential Type Year Yes in Yes No in No Single-family home with a small yard % +20% 21% -38% % % ---- Single-family home with a large yard % 0% 15% 0% % % ---- Townhouse or condominium % +30% 47% -19% % % ---- Condominiums in mixed-use buildings % +33% 71% -9% Apartment % % % +21% 65% -8% % % ---- * Figures may not sum due to rounding. Source: Adapted from Godbe Research (2012). Table 2.3 shows support for housing options between 2008 and Some key trends are evident: Support for having the single-family home with a large-yard option stayed the same for both yes and no answers. Support for the single-family home with a small-yard option rose 20%, gaining share from those not wanting that option. Support for having the townhouse or condominium option rose by 30%, gaining share from those not wanting that option. Support for having the condominium in a mixed-use building option rose by 33%, gaining share from those not wanting that option. Support for having the apartment option rose by 21%, gaining share from those not wanting that option. While the support for having the single-family home on a large lot remains the strongest among the options, that support has not changed as support for expanding other options has increased substantially. This is consistent with preferences seen in Tables 2.1 and A HOME FOR EVERYONE
29 Table 2.4. Support for Housing Options among Hispanic and Non-Hispanic Respondents Yes + Definitely Definitely Residential Type Yes Yes Yes No Non-Hispanic Single-family home with a small yard 41% 35% 76% 23% Single-family home with a large yard 62% 20% 82% 17% Townhouse or condominium 20% 28% 48% 49% Condominiums in mixed-use buildings 11% 19% 30% 69% Apartment 12% 19% 31% 68% Hispanic Single-family home with a small yard 47% 32% 80% 20% Single-family home with a large yard 67% 20% 87% 12% Townhouse or condominium 23% 33% 56% 43% Condominiums in mixed-use buildings 9% 17% 26% 73% Apartment 13% 25% 37% 62% * Figures may not sum due to rounding. Source: Adapted from Godbe Research (2012). Table 2.4 shows the level of support for these options among Hispanic and non-hispanic respondents in the 2012 survey. While Hispanic respondents supported the single-family home with large-lot option more than non- Hispanic respondents (87% to 82%), more of them also supported most other options than non-hispanic respondents (80% support for a single-family home on a small lot compared to 76%, 56% support for townhouse or condominium compared to 48%, and 37% support for apartments compared to 31%). Recall that the Kern COG s Community Survey did not explicitly require respondents to make choices between housing options. Instead, respondents could technically give definitely yes and yes answers to several housing types and many did. 12 However, by normalizing responses with respect to the pool of all responses within the same survey group, one can create a continuum showing the normalized share of respondents favoring each choice. This adjustment is provided in Table 2.5 for the detached, condominium and townhouse, and apartment options. 13 SJ VALLEY HOUSING PREFERENCES AND OPPORTUNITIES TO
30 Table 2.5. Normalized Preferences for Detached and Attached Units Residential Type All Non-Hispanic Hispanic Single-family home with a small yard 31% 32% 31% Share of detached 48% 48% 48% Single-family home with a large yard 34% 34% 33% Share of detached 52% 52% 52% Total Detached 65% 67% 64% Townhouse or condominium 21% 20% 21% Share of attached 60% 61% 60% Apartment 14% 13% 14% Share of attached 40% 39% 40% Total Attached 35% 33% 36% * Figures may not sum due to rounding. Source: Adapted from Godbe Research (2012). Table 2.6. Preferences for Neighborhood, Home and Mixed-Use Features Area Central Valley California Nation Own or rent an apartment or townhouse, 37% 39% 63% and have an easy walk to shops and restaurants and have a shorter commute to work Own or rent a detached, single-family house, 63% 61% 62% and have to drive to shops and restaurants and have a longer commute to work Source: Adapted from NAR (2011). 26 A HOME FOR EVERYONE
31 The results show that normalized preferences are for 65% detached and 35% attached units with minor variation among the respondent subsets. Notably, however, the split between small- and large-lot options is roughly even at 48% and 52% respectively, with little variation between respondent subsets. For the townhouse/condominium and apartment options, the split is 60% and 40%, again with little variation among respondent subsets. As will be seen below, these results are consistent with the NAR and PPIC surveys. They are also consistent with The Concord Group's market analysis of the San Joaquin Valley that will be reviewed in the next chapter. NATIONAL ASSOCIATION OF REALTORS COMMUNITY PREFERENCE SURVEY In 2011, the National Association of Realtors commissioned a national poll to ascertain preferences of respondents between options. Theirs was a stated preference survey (as opposed to an opinion survey), where respondents are given only two choices from which they must pick one. Stated preference surveys, also called forced choice surveys, are used in market analysis to gauge the direction of consumers given roughly opposite choices. One of the NAR s questions is pertinent to this Scenario. It asks respondents to indicate their preference between owning or renting an apartment or townhouse and having an easy walk to shops and restaurants and a shorter commute to work, or owning or renting a detached, single-family house and having to drive to shops and restaurants and a longer commute to work. Because it was a national survey, only a subset of respondents representing the Central Valley (comprised of both the Sacramento and San Joaquin valleys) was of reasonable size for analysis. Table 2.6 shows that 37% of Central Valley respondents would choose the attached-unit option while 63% of respondents would choose the detachedunit option. Figures for California and the nation are comparable. The figure is also remarkably close to the normalized choice for attached options (35%) from the Kern COG Community Survey. PUBLIC POLICY INSTITUTE OF CALIFORNIA SURVEY In 2004, the Public Policy Institute of California (PPIC) conducted a survey asking many of the questions used in the 2011 NAR survey. Unlike the NAR survey, there are enough respondents from this survey to reasonably represent the San Joaquin Valley. Three questions are relevant here. They pertain to the trade-off between small and large lots with respect to (a) short SJ VALLEY HOUSING PREFERENCES AND OPPORTUNITIES TO
32 Table 2.7. Preference for Lot Size and Accessibility to Destinations Trade-off San Joaquin Valley 1A. Would you choose to live in a small home with a small backyard if it means you have a short commute to work OR 48% 1B. Would you choose to live in a large home with a large backyard even if it means you would have a long commute? 52% 2A. Would you choose to live in a mixed-use neighborhood if it means you can walk to stores, schools, and services OR 41% 2B. Would you choose to live in a residential-only neighborhood, even if it means you have to drive to stores, schools, and services? 59% 3A. Would you choose to live in a neighborhood where single-family homes are close together if it means you could walk to parks and outdoor recreation OR 42% 3B. Would you choose to live in a neighborhood where single-family homes are far apart even if it means you have to drive to parks and outdoor recreation? 58% Source: Adapted from PPIC (2004). or long commutes, 14 (b) walking or driving to stores, schools and services, and (c) walking or driving to parks and outdoor recreation. The results are reported in Table 2.7. If all response levels are given equal weight, 15 about 44% of San Joaquin Valley respondents would choose the small-lot option. Although this assumes certain attributes associated with the small lot, the responses are roughly consistent with the normalized small-lot preference indicated from the Kern COG Community Survey. It should be noted that there are many reasons a household chooses to live where they do. Households trade off housing space, tenure and type with respect to location based on the time, distance and transportation costs to such destinations as working, shopping, recreation, and friends and family. A household with multiple wage earners makes even more complex tradeoff decisions. The Kern County, NAR and PPIC survey results thus need to be interpreted in the context of preferences, all other things being equal. 28 A HOME FOR EVERYONE


33 KEY FINDINGS Several key inferences emerge from these surveys: Nearly eight in ten Hispanic residents want expanded housing options compared to about half of non-hispanic residents. While all respondents want the option to live in single-family homes with large yards, an increasing share also want options expanded to include single-family homes with small yards, townhouses and condominiums, condominiums in mixed-use buildings, and apartments. With the exception of condominiums in mixed-use buildings, it also appears that Hispanic respondents support more housing options than non-hispanic respondents. The Kern COG Community Survey indicates that 65% of respondents prefer detached residential options and 35% prefer attached ones. This result is consistent with the NAR 2011 survey showing that 63% preferred detached options and 37% preferred attached ones for the Central Valley. It is also consistent with The Concord Group s projection of the market demand for new residential units constructed to 2050 (see Chapter 3). Among detached units, the PPIC 2004 survey shows that an average of 44% with a range of 42% to 48% of San Joaquin Valley respondents would prefer the small-lot option into the future. The normalized figure for the small-lot preference based on the Kern COG Community Survey is 48%. Based on these surveys and considering changing economic, housing finance, demographic and other factors, the Scenario thus assumes the following distribution of housing units by type in 2050: 35% attached % small lot (6,000 square feet and less) % all other lot. SJ VALLEY HOUSING PREFERENCES AND OPPORTUNITIES TO

34 3.Market Demand and Market Viability for Attached and Detached Housing In 2012, The Concord Group provided the San Joaquin Valley with its projections of the market demand for higher density housing as well as for detached units in five-year increments to It also projected the market viability for owner-occupied units. This chapter summarizes both analyses but, for Scenario purposes, it focuses on the market viability analysis. Table 3.1 reports projections by The Concord Group of the market demand for occupied flats (apartments), townhouses and detached homes for the San Joaquin Valley over the periods 2010 to 2020, 2035, and A HOME FOR EVERYONE
35 Table 3.1. Distribution of Residential Units Based on Market Demand Projections Flats Townhouses (10 or more <10 units/ Total Attached Detached Period Total units/acre) acre) Attached Share Detached Share ,186, , , ,795 29% 781,291 71% ,292, , , ,188 32% 882,304 68% Change ,406 39,579 29,814 69,393 41% 101,013 59% ,619, , , ,134 32% 1,034,714 68% Change , ,333 76, ,339 41% 253,423 59% ,882, , , ,215 34% 1,183,843 66% Change , , , ,420 42% 402,552 58% * Figures may not sum due to rounding. Source: Adapted from The Concord Group (2012). In short, The Concord Group estimates that there will be a demand for 695,971 new occupied housing units between 2010 and Of this, flats will comprise 170,718 units, townhouses 122,702 units, and detached homes 402,552 units. Together, the market demand for flats and townhouses comprises 42% of the entire demand for new units. If these units are built, the share of occupied attached units in the San Joaquin Valley will increase from 30% in 2010 to 34% in The Concord Group indicates, however, that market demand and market viability may differ. While the market may demand certain kinds of products, developers may be unable to produce those products at prices the market can afford. Recognizing this dynamic, The Concord Group projects that 45,992 households may want to own homes, but may not be able to afford them. 17 The Scenario thus apportions those 45,992 households into rental units in the following proportions: market viable rental flats (69%) and townhouse units (31%). SJ VALLEY HOUSING PREFERENCES AND OPPORTUNITIES TO
36 Table 3.2. Scenario Distribution of Residential Units Based on Market Viability Projections Flats Townhouses (10 or more <10 units/ Total Attached Detached Period Total units/acre) acre) Attached Share Detached Share ,186, , , ,795 29% 781,291 71% ,292, , , ,140 34% 857,352 66% Change ,406 65,456 28,889 94,345 55% 76,061 45% ,619, , , ,086 33% 1,012,763 67% Change , ,210 75, ,291 47% 231,472 53% ,882, , , ,167 35% 1,161,892 65% Change , , , ,372 45% 380,601 55% * Figures may not sum due to rounding here or from individual counties data in the appendices. Source: Adapted from The Concord Group (2012) by assigning non-viable market demand owner-occupied units to rental flats and townhouses as noted in text. Table 3.2 shows the effect of this adjustment for each of the time periods. This is called the Scenario distribution of residential units based on The Concord Group s viability projections. The Scenario results in a 45%/55% share of new occupied attached units to detached units over the period 2010 to 2050; this is a slightly higher share of new occupied attached units than under the market demand projections (42%). Most of the difference occurs in the first time period, , reflecting continued recovery from the Great Recession combined with stagnating incomes. During this period, attached units would comprise 55% of the share of new occupied unit construction. Under the Scenario, occupied attached units will increase to about 35% of the share of all occupied units. This is similar to the normalized results from the Kern COG Community Survey indicating that 35% preferred attached housing options over detached ones. It is also comparable to preference estimates generated from the PPIC and NAR surveys. In effect, the Kern County, PPIC and NAR surveys, as well as The Concord Group market analysis, come to about the same conclusion. The Concord Group s market demand projections estimate that 402,552 new occupied detached units will need to be built between 2010 and Based on viability demand adjustments, the Scenario shows detached home demand will be about 5% less than this, or 380,601 units. While The Concord Group was not asked to apportion new occupied detached unit demand by lot size, this Scenario performs that analysis. 32 A HOME FOR EVERYONE
37 Table 3.3. Distribution of Detached Homes by Lot Size Share of Lot Size Fresno Kern Merced Total Detached Small (<6k sq.ft.) 33,580 23,145 6,147 62,872 14% Typical (6k sq.ft. to 20k sq.ft.) 153, ,065 38, ,637 77% Estate (20k sq.ft. to 5 acres) 19,300 21,262 1,360 41,922 9% Total (5 acres and less) 206, ,472 46, , * Figures may not sum due to rounding. Source: Fresno, Kern and Merced county assessors. Table 3.4. Apportionment of New Occupied Units Built between Small and All Other Lots to 2050 Type Supply 2010 Demand 2050 Scenario 2050 Small Lot 133, , ,609 All Other Lots 712, , ,670 Total Detached 845,680 1,226,279 1,226,279 * Figures may not sum due to rounding. Table 3.3 shows the 2012 distribution of lots in Fresno, Kern and Merced counties based on data provided to the author. 18 For these counties, homes on lots ranging from more than 6,000 square feet to 20,000 square feet account for 77% of all detached lots under 5 acres (lots over 5 acres are excluded from this analysis because they represent a completely different market). Small lots, those of 6,000 square feet or less, comprise about 14% of the supply in these three counties. The Scenario conservatively assumes that about 15% of all detached lots in the other San Joaquin Valley counties in 2010 are on small lots (an overstatement). Table 3.4 allocates new occupied detached residential unit demand between small and all other lots to Based on the Scenario, the only way for developers to meet the projected demand for small-lot homes in 2050 may be for them to build nearly all new, occupied detached homes to 2050 on small lots. SJ VALLEY HOUSING PREFERENCES AND OPPORTUNITIES TO
38 Table 3.5. Scenario for the San Joaquin Valley Based on Market Viable Housing Distribution, Attached All Other Detached Time Period Total Flat Townhouse Attached Share Small Lot Lots Detached Share ,186, , , ,795 29% 133, , ,680 71% ,356, , , ,140 32% 209, , ,741 68% Change ,406 65,456 28,889 94, , , Change % 14% 44% 15% 28% % 0% 9% ,619, , , ,086 33% 364, ,670 1,077,152 67% Change , ,210 75, , , , Change % 36% 85% 39% 59% % 0% 27% ,882, , , ,167 35% 513, ,670 1,226,280 65% Change , , , , , , Change % 59% 130% 63% 93% % 0% 45% ---- * Figures may not sum due to rounding. Source: Adapted from The Concord Group (2012) by assigning the difference between market demand and market viable units to rental viable flat and townhouse units proportionate to their 2050 rental viability distribution. Small lot is defined as 6,000 square feet or less. 34 A HOME FOR EVERYONE


39 Table 3.5 uses the market viability projections to generate the Scenario for the San Joaquin Valley, including occupied flat, townhouse, small-lot and all other lot units to The Scenario assumes no net change in the number of units on all other lots so that by 2050 market demand for those units would just about equal supply. KEY FINDINGS By 2050, the share of occupied new residential units by major type would need to be as follows to meet the market viability projections of demand: About 315,000 new occupied attached residential units would be needed, including 194,000 flats and 122,000 townhouses. If this occurs, attached units will comprise 35% of the total supply of occupied units about what Kern County, PPIC and NAR surveys found and consistent with the market analysis conducted by The Concord Group. About 380,000 new occupied detached units would be needed, bringing the total of occupied detached units to about 1.2 million occupied homes. Based on preference surveys focusing on the San Joaquin Valley, about 25% to 30% of all occupied residential units in 2050 may need to be on small lots, with the balance of 35% to 40% on all other lots. The Scenario assumes that all new detached residential units will be built on small lots (6,000 square feet or less). Nonetheless, there will be some new demand for detached units on larger lots in niche markets as well as to replace large-lot homes that are redeveloped into mixed-used and/or higher-density residential projects. Still, the Scenario shows that potentially the only way to meet the demand for homes on small lots in 2050 is if nearly all new occupied detached homes built to 2050 are on small lots. SJ VALLEY HOUSING PREFERENCES AND OPPORTUNITIES TO

40 4.Space-Occupying Jobs and Nonresidential Space Redevelopment Developers will not build all new homes on open space and agricultural land. In fact, a large share of new attached homes will probably go where they can maximize their convenience and efficiency, such as along commercial corridors and centers. Many of those attached homes can be part of the redevelopment of nonresidential space already built in those corridors and centers. This chapter estimates the volume of nonresidential space existing in 2010 that will be replaced and/or repurposed recycled to As will be seen, the equivalent of more than all nonresidential space that existed in 2010 will be recycled by Because the recycling process also applies to new nonresidential space that will be needed to 2050, this chapter also identifies the kinds of jobs that occupy nonresidential space, estimates the total number of workers (fulltime and part-time) who will occupy that space, and projects the space supported by those to 2020, 2035 and The recycling process should thus accommodate new and replaced nonresidential space, as well as a large share of new attached residential homes. 36 A HOME FOR EVERYONE
41 SPACE-OCCUPYING EMPLOYMENT The focus of this analysis is on those jobs that need to be housed in built space, such as stores, offices, schools and the like. Natural-resource jobs, such as farming, fishing and mining, do not usually require built space. Construction workers, who build the spaces people occupy, usually do not have space of their own; rather they move from job to job. Not addressed are military jobs because, although they certainly occupy space, the planning and development of that space is mostly beyond the influence of local governments. The relevant jobs that occupy space can be loosely organized into four broad land-use groups: industrial, office, retail and institutional. SPACE-OCCUPYING EMPLOYMENT PROJECTIONS Since the 1980s, no federal agency has projected employment over the long term and few commercial services do. Woods & Poole Economics has been making these kinds of projections for decades; this Scenario uses its projections of full-time and part-time jobs. NONRESIDENTIAL SPACE PROJECTIONS In most urbanized areas, nonresidential space accounts for a third or more of the built environment and up to half or more of the taxable value. 19 Estimating employment-based space needs can be complex and fraught with uncertainties about how technology influences the use of space in the future. The need for nonresidential space may be declining because of such factors as working at home, telecommuting, Internet retailing, and even office hotelling where workers never have an assigned work area, but use space when needed based on the task and the need to be in an office. Whether these factors increase the efficiency with which space is used, and result in less space needed in the future, is uncertain. For example, working at home accounts for a very small share of workers despite its growing prevalence (Nelson 2013). Telecommuting does not necessarily reduce office space needs. Telecommuters may work from home part of a day or some days of the week but still have an office. Office hotelling applies only to workers who travel and need places to function on the road but does this mean they need less space than if working in a permanent office or cubicle? Or does it mean more space is needed to meet their office needs when aggregated across several locations? Internet retailing is growing but may plateau as people tend to prefer the tactile and social aspects of shopping. SJ VALLEY HOUSING PREFERENCES AND OPPORTUNITIES TO

42 A decade of advances in telecommuting, office and retailing technologies has not reduced overall nonresidential space needs. In fact, the trend seems to be toward increasing square feet per person. Total nonindustrial space in the U.S. averaged 233 square feet per person in 1992 and 246 square feet per person in While the nonresidential space needs per capita may be increasing over time, the actual needs per worker have not changed much (Nelson 2004). While analysts debate how small office-worker stations will become, principally because of electronic filing and interactions that do not require meeting spaces, they have not reached a consensus. For one thing, productive people still need space to work in, and office buildings still need halls, meeting rooms, restrooms, lobbies and so forth. Office buildings are also adding exercise space, day care facilities and space for other activities. On the whole, total space per office worker does not seem to have changed much over the past few decades (Nelson 2013). To estimate space needs per worker, the Scenario uses the total square feet of space for each category of activities reported by the U.S. Department of Energy s Commercial Buildings Energy Consumption Survey for 2003 (Energy Information Administration 2005) and the Manufacturing Energy Consumption Survey for 2006 (Energy Information Administration 2009) and divided that space by workers in each activity group for the respective years. The result is the average square feet per worker for all workers in the industrial and nonindustrial categories reported in Table 4.1. These figures are applied to Woods & Poole Economics (2011) projections of workers in each of the four employment groups and aggregated into a total amount of space that is estimated to be supported by the economy valleywide. 38 A HOME FOR EVERYONE
 (years) Industrial Utilities 300 50 Manufacturing 900 50")
43 Table 4.1. U.S. Space Consumed per Industrial and Nonindustrial Worker Average Square Feet Structure Per Worker Depreciation Land Use (square feet) (years) Industrial Utilities Manufacturing Transportation & Warehousing 1, Wholesale Trade 1, Nonindustrial Office & Office-Based Services Education and the Arts Lodging/Food Service Retail Trade Health Care * Space includes all occupied areas such as work spaces, lobbies, conference rooms, assembly areas, hallways, elevator shafts, etc.; collateral service functions such as cafeterias, theaters, exercise and day care; and vacant space. Figures are rounded. Sources: Nonindustrial space estimated from CBECS (Energy Information Administration 2005) and industrial space estimated from CBECS and MECS (Energy Information Administration 2009). Depreciation of buildings adapted from Marshall & Swift (2012). SJ VALLEY HOUSING PREFERENCES AND OPPORTUNITIES TO
44 Years Retail Office Warehouse Education Nonres. Homes Figure 4.1. Life Span of Major Building Types Source: Arthur C. Nelson, based on Commercial Buildings Energy Consumption Survey. These projections show that, between 2010 and 2020, the San Joaquin Valley may need to add nearly 90 million square feet to the inventory of nonresidential space that the market appears to have supported in 2010 (Table 4.2). The net increase in nonresidential space may rise to nearly 300 million square feet in 2035 (Table 4.3) and nearly 600 million square feet by 2050 (Table 4.4). Policymakers should consider, however that nonresidential space wears out and is not as durable as residential space. The typical residential unit can last easily 150 years and perhaps several decades more (Nelson 2013). In contrast, the typical nonresidential space lasts on average around 40 to 45 years, as illustrated in Figure 4.1. Over time, nonresidential space will need to be recycled through demolition, rebuilding or repurposing in ways that renew the structure for different kinds of uses than for which it was originally built. The speed with which nonresidential structures are recycled depends on two major factors: the rate of depreciation of the building and the rate of appreciation of the land on which it sits. Buildings depreciate at widely varying rates. Depreciation for most kinds of low-rise properties ranges from about 30 to 60 years. 21 But this assumes the structure is used until its intended purpose has run its course. 40 A HOME FOR EVERYONE
45 Table 4.2. Nonresidential Space Development and Redevelopment, Total Space Built Space Space Net Change Space Space as Jobs Jobs Change Supported Supported in Space Replaced Built Share of Percent Space County (1,000s)(1,000s) (1,000s) (millions sf) (millions sf) (millions sf) (millions sf) (millions sf) in 2010 Fresno % % Kern % % Kings % % Madera % % Merced % % San Joaquin % % Stanislaus % % Tulare % % San Joaquin Valley 1,343 1, % % * Figures may not sum due to rounding. Source: Arthur C. Nelson (2013). SJ VALLEY HOUSING PREFERENCES AND OPPORTUNITIES TO
46 Table 4.3. Nonresidential Space Development and Redevelopment, Total Space Built Space Space Net Change Space Space as Jobs Jobs Change Supported Supported in Space Replaced Built Share of Percent Space County (1,000s)(1,000s) (1,000s) (millions sf) (millions sf) (millions sf) (millions sf) (millions sf) in 2010 Fresno % % Kern % % Kings % % Madera % % Merced % % San Joaquin % % Stanislaus % % Tulare % % San Joaquin Valley 1,343 1, % 720 1, % ** Figures may not sum due to rounding. Source: Arthur C. Nelson (2013). 42 A HOME FOR EVERYONE
47 Table 4.4. Nonresidential Space Development and Redevelopment, Total Space Built Space Space Net Change Space Space as Jobs Jobs Change Supported Supported in Space Replaced Built Share of Percent Space County (1,000s)(1,000s) (1,000s) (millions sf) (millions sf) (millions sf) (millions sf) (millions sf) in 2010 Fresno % % Kern % % Kings % % Madera % % Merced % % San Joaquin % % Stanislaus % % Tulare % % San Joaquin Valley 1,343 2,381 1,038 77% 720 1, , % * Figures may not sum due to rounding. Source: Arthur C. Nelson (2013). SJ VALLEY HOUSING PREFERENCES AND OPPORTUNITIES TO
48 90% Building Value 80% 70% 60% 50% 40% 30% Building Share Land Share 20% 10% 0% Building Life (years) Figure 4.2. Conversion Timing of Nonresidential Buildings * Timing is based on structure depreciation (building share line) and land value appreciation (land share line). Source: Arthur C. Nelson. In dynamic metropolitan areas, few building owners use nonresidential structures for their intended purpose through the expected useful life of the building. As the structure depreciates, land value usually appreciates, and at some point the land is worth more than the structure. The structure s owner may see a better return on investment by recycling the land use. Consider how the recycling decision is made. Assume the structure has a depreciable life of 50 years, which is a common period for nonresidential, low-rise structures. Suppose that when the structure is built, about 80% of the total property value is in the structure itself and 20% is in the land. Suppose also that the average annual appreciation of land (after inflation) is 1%. A 50-year structure depreciating at 2% annually with land appreciating at 1% annually (compounded) roughly the national average annual rate of growth will be worth less than the land in about the 33rd year. This is illustrated in Figure A HOME FOR EVERYONE


49 Typically about the 25th year, if not before, the property owner begins to consider demolishing and building a new structure, or renovating the existing structure to serve a higher and better use. This is called recycling. However, the developer often defers the actual moment of recycling until market forces justify the cost of demolition and reinvestment. Because of building depreciation and land value appreciation, the equivalent of the entire nonresidential stock in the U.S. is recycled about every 40 years. 22 (This is adjusted to consider historically significant and multifloor structures that may survive centuries.) This analysis assumes that the average life of all nonresidential structures will be about 40 years. Certainly, some structures such as cheaply built bigbox stores may become ripe for recycling after just 15 years or so, while Class-A, high-rise office buildings may last a century or longer. The overall effect of building depreciation and land value appreciation is that more than 200 million square feet or about 30% of the stock of nonresidential buildings existing in the San Joaquin Valley in 2010 will become opportunities for redevelopment by Nearly 700 million square feet, or nearly all the nonresidential stock existing in 2010, will become opportunities for redevelopment by Approximately 900 million square feet, or 1.2 times more than the equivalent of all space existing in 2010, will become opportunities for redevelopment by 2050 principally because hundreds of millions of square feet built after 2010 will be recycled yet again. SJ VALLEY HOUSING PREFERENCES AND OPPORTUNITIES TO


50 KEY FINDINGS The next three tables estimate space-occupying jobs, the net change to the inventory of all nonresidential space, the volume of space that is estimated to be recycled, and the total space that is estimated to be built, rebuilt, renovated or in other ways recycled for all counties in the San Joaquin Valley and the Valley as a whole for the periods 2010 to 2020, 2035 and Key findings are: The San Joaquin Valley jurisdictions will need to increase their inventory of nonresidential space by about 600 million square feet between 2010 and 2050, or about 80% more than existed in A much larger amount, about 900 million square feet, will be recycled between 2010 and For the San Joaquin Valley as a whole, it is estimated that nearly 1.5 billion square feet of nonresidential space will be built or recycled between 2010 and This is more than twice the amount of all nonresidential space that existed in A HOME FOR EVERYONE

51 5.A Strategy to Implement the Scenario The Scenario does not offer specific land-use planning or design guidance, but it does provide key findings needed to guide those and related activities. These findings lead to a strategy to address the Scenario, which is outlined here. A substantial share of all new nonresidential and residential development may occur on existing nonresidential development sites especially along corridors and at activity centers. Outside of downtowns, these areas are typically dominated by one- and two-floor structures that comprise twothirds of the nonresidential structures in metropolitan areas. 23 Those structures are also at very low floor-area-ratios (FAR). FAR is a measure of land-use intensity; it relates total building square footage to total land area. For example, a structure of 10,000 square feet sitting on a parcel of 50,000 square feet has an FAR of About three-quarters of all nonresidential parcels throughout the San Joaquin Valley outside of downtowns have an FAR of less than 0.20, which means 80% of the land area is used for parking, loading, storage and other non-structural purposes. SJ VALLEY HOUSING PREFERENCES AND OPPORTUNITIES TO
52 By 2020, about 25,000 acres of this land may provide opportunities for redevelopment rising to about 80,000 acres by By 2050, more than 100,000 acres of these low-far sites may become opportunities for redevelopment. In some cases, they may provide opportunities twice, as structures with short, useful lives may replace current structures and become replaced themselves. The redevelopment opportunities presented by commercial corridors is largely under-appreciated by both the public and private sectors across the nation. Public-private-nonprofit partnerships can be formed to leverage all of their resources to facilitate emerging market demand. After all, much of the land uses along these corridors have attributes making them ideal candidates for redevelopment: 1. They are already flat and reasonably well-drained, so this part of the development process is largely finished. 2. Almost all of these sites sit along major highways with four or more lanes often with wide rights-of-way. Because they are along multi-lane corridors that connect urban and suburban centers, many of these corridors are transit-ready for such options as bus rapid transit, street car and light rail. 3. Large-scale utilities run along those major highways and are easily accessed for upgrading if needed. As they age, these utilities will need to be replaced. The conundrum facing local governments is whether to approve new greenfield development where initial utility capital costs are low, or brace for the upgrades of major utility infrastructure along built-out corridors that would have to be done anyway, probably by 2050, and at lower long-term cost per unit of service delivery. Prudent fiscal management would seem to favor the latter investment decision. 4. Prior development approvals have already committed these sites to nonresidential, higher-density residential, and/or mixed land uses. 5. These sites have motivated owners interested in maximizing their profit. The motivated owner is important because he or she can help overcome the typical impediments to redevelopment, which include the inability to assemble multiple, small ownerships; to gain the confidence of owners that it is in their best interest to redevelop; and to acquire clear title. 48 A HOME FOR EVERYONE
53 6. As these sites age, the deterioration of structures compromises the value of nearby residential property. 7. Those neighbors may be motivated to deflect development pressure away from their neighborhoods into these aging commercial sites, especially if they have a constructive say in how they are redeveloped. In other words, potential NIMBYs (not-in-my-backyard) may become YIMBYs (yes-in-my-backyard) if they appreciate that their property value increases when blighted, aging corridors and centers are renewed. Research shows that redevelopment of sites along such corridors can achieve FARs of 0.50 to These higher FARs maximize land-use intensity at a low cost per square foot of structure, and provide adequate on-site parking, especially if there are smart parking designs that share parking among activities or tuck-under parking options that avoid building parking structures (see Dunham-Jones and Williamson 2009). Mixed uses represent one of the key design opportunities possible in achieving FARs of more than 0.50 is mixed uses which can reduce and internalize vehicle trips (see Ewing and Cervero 2010). The Scenario thus outlines a strategy whereby potentially all attached residential and nonresidential development is attracted to commercial corridors and centers. Table 5.1 shows the change in floor-area-ratio between 2010 and 2020, to 2035, and then to 2050 if all new space-occupying jobs and all new attached residential units were built in existing commercial corridors and centers. It is assumed that attached residential units will average 1,500 square feet, which includes common areas in the case of multi-family structures. For those respective periods, the FAR would rise from an assumed 0.20 to 0.27, then to 0.36, and finally to Research shows that such a strategy will yield important benefits (Nelson 2013). In addition to making more transportation options feasible, vehicles miles traveled per person and greenhouse emissions will be reduced substantially (Ewing, et al. 2007), a key goal of SB 375. This strategy will also revitalize neighborhoods and communities and improve the overall economy. SJ VALLEY HOUSING PREFERENCES AND OPPORTUNITIES TO
54 Table 5.1. Change in Floor-Area-Ratio in the San Joaquin Valley when Accommodating All Space- Occupying Jobs and All New Attached Residential Units in Existing Commercial Corridors and Centers Metric Figure Space Supported ,000, Space Supported ,000,000 Attached Dwellings ,345 Assumed Attached Dwelling Size 1,500 Attached Dwelling Space 140,000,000 Total Space ,000,000 FAR factor 1.31 Assumed FAR FAR Space Supported ,000,000,000 Attached Dwellings ,291 Assumed Attached Dwelling Size 1,500 Attached Dwelling Space 300,000,000 Total Space ,300,000,000 FAR factor 1.81 Assumed FAR FAR Space Supported ,351,988,474 Attached Dwellings ,372 Assumed Attached Dwelling Size 1,500 Attached Dwelling Space 473,058,000 Total Space ,825,046,474 FAR factor 2.53 Assumed FAR FAR * Figures may not sum due to rounding. 50 A HOME FOR EVERYONE

 while retaining their")
55 Table 5.1 shows that, technically, all new nonresidential and attached residential development can occur as infill and redevelopment of existing developed nonresidential areas. There are some qualifications and cautionary observations that can reduce redevelopment opportunities, however. For instance, preserving historically and culturally significant structures and places may be necessary to preserve community character. Nonetheless, many older structures sit on larger tracts of land that can be redeveloped, and older structures can be repurposed (from warehousing to office or residential) while retaining their historical and architectural character. 24 Low-intensity parcels may not be candidates for redevelopment at a density that could support walkable, mixed-use, transit-oriented neighborhoods. In most metropolitan areas, land values increase over time at least in proportion to population growth; and the higher the land value, the more intensively land needs to be used to justify the cost of acquiring the property and redeveloping it. Indeed, a major roadblock to timely redevelopment is uncertainty by property owners about when to redevelop, usually erring on the side of caution, so that redevelopment is deferred perhaps longer than may be efficient. Public officials and planners should be proactive in identifying those parcels that may become ripe for redevelopment within various time frames, especially between 2010 and 2050, and even beyond. SJ VALLEY HOUSING PREFERENCES AND OPPORTUNITIES TO
56 Despite their potential, other factors may also make it challenging to recycle nonresidential centers and corridors in the short term in some situations: Land ownership in most centers and along many corridors has been subdivided and sold to a number of different owners, often as small parcels; assembly will be a challenge. Many areas may be difficult to attract new development because of crime and declining property values, at least in the short term. In the short term, it may be more expensive to develop these nonresidential sites than it will be to develop new greenfield projects. One obstacle is the more complex permitting and regulatory process for redevelopment, when compared to greenfield development. Urban infrastructure problems will be expensive to fix and require bonding sources, which will be problematic, considering State and local agencies credit ratings. State and local policies will need to support infill and redevelopment efforts to accommodate future demand. Otherwise, the current regulatory and financial incentives unfairly benefit greenfield development. An overall strategy would not only seek to maximize infill and redevelopment opportunities but also facilitate new communities with mixed uses, including mixed-residential options connected by multiple modes of transportation to existing urban and suburban centers and corridors. 25 Public-private-nonprofit partnerships will be needed to take advantage of emerging market opportunities to implement such a combined strategy. The State of California needs to be a key partner, especially by enabling local governments to facilitate infill and redevelopment A HOME FOR EVERYONE

57 Toward a New San Joaquin Valley As the population in the rest of California expands by about a quarter between 2010 and 2050, the number of San Joaquin Valley residents will increase by nearly three-quarters. Population growth will be primarily attributable to the New Majority as the number of white non-hispanics is projected to fall. Because of emerging economic conditions, income growth may stagnate, and indeed median household income may fall in real terms between 2010 and If Valley leaders wish to sustain the region s agricultural economy, they must minimize further conversion of farmland to urban uses. At the same time, the market demand for housing seems to be changing. The demand for attached options appears to be increasing and may require twice as many apartments, condominiums and townhouses in 2050 as existed in Yet attached owner-occupied options such as townhouses and condominiums may be too costly per square foot than detached homes, at least for the foreseeable future. Moreover, the market for attached homes may be dominated by rental apartments. A larger change is poised to occur among detached homes. As household incomes stagnate or even fall, the demand for detached homes on small lots (6,000 square feet or less) may dominate the market. SJ VALLEY HOUSING PREFERENCES AND OPPORTUNITIES TO
58 Three different surveys suggest that at least 40% of the current demand for detached homes is for small lots, with much of this attributable to New Majority households. As the New Majority increases its market share, it seems likely that the demand for small lot homes will increase. Already in Kern County, small lots may account for nearly half of the demand for new detached homes, based on the Kern COG 2012 survey. Public officials, developers, planners and citizens seem generally aware of these emerging trends. The challenge is to adjust land-use controls and infrastructure investments to accommodate this change. In addition, hundreds of millions of square feet of existing nonresidential buildings are in urban and suburban centers and along commercial corridors at very low intensities, and they are aging quickly. The Scenario estimates that nearly 900 million square feet will be recycled and that there will be a net increase of 600 million square feet to the nonresidential inventory between 2010 and Recycled and net new space may be twice the space existing in As space is recycled and new space added, the land-use intensity can increase from an average of an estimated 0.20 in 2010 to about 0.50 in 2050 without sacrificing parking. If so, technically all new nonresidential development and all new attached housing demand could occur through infill and redevelopment of urban and suburban centers and commercial corridors. Many Valley planners indicate that targeting a large share of this development to these existing developed areas could be feasible as an effective long-term strategy for policymakers. Such a strategy would revitalize neighborhoods and communities, provide transportation choices, create viable close-knit, mixed-use areas, reduce greenhouse gas emissions, and improve the overall economy. The combination of growth and aging nonresidential stock provides cities and counties in the San Joaquin Valley with the kind of opportunities to reshape development patterns that many other regions across America would envy. For the most part, local and regional governments in the Valley are positioning themselves to take advantage of them. However, as the State has stripped local governments of many powers they need to reshape the built landscape, they need new legislation to reinvent redevelopment authorities in ways that can move California toward achieving the goals of SB 375. Ultimately, the San Joaquin Valley will only be able to take full advantage of the changing market with a concerted, multi-level effort to focus California's resources and priorities on the homes and businesses of the future. 54 A HOME FOR EVERYONE
59 Appendices The following appendices include data for each of the San Joaquin Valley s eight counties. Each county appendix include three tables: A. County Demographic Changes, B. County Market Viable Housing Distribution, C. Change in Floor-Area-Ratio in County when Accommodating All Space-Occupying Jobs and All New Attached Residential Units in Existing Commercial Corridors and Centers SJ VALLEY HOUSING PREFERENCES AND OPPORTUNITIES TO
60 Appendix A. Fresno County Table A.1. Fresno County Demographic Changes, New White, non- Hispanic All Other Total New Majority Year Population Hispanic All Races Races Majority Share , , , , ,998 65% ,059, , , , ,210 74% ,272, , , ,894 1,070,981 82% ,487, ,100 1,004, ,374 1,328,818 87% ,713 (48,499) 153,335 43, , % % 16% -16% 35% 27% 33% ,890 (103,093) 362, , , % % 40% -34% 82% 63% 77% ,398 (145,422) 561, , , % % 63% -48% 127% 99% 119% ---- * Figures may not sum due to rounding. Source: Adapted from The Planning Center (2012). Table A.2. Fresno County Market Viable Housing Distribution, Attached Small All Other Detached Time Period Total Attached Share Lots Lots Detached Share , ,464 34% 33, , ,730 66% , ,920 37% 49, , ,514 63% Change ,240 20, , , Change % 12% 19% % 0% 8% , ,473 37% 83, , ,387 63% Change ,666 41, , , Change % 29% 39% % 0% 24% , ,238 38% 113, , ,048 62% Change ,092 64, , , Change % 47% 61% % 0% 39% ---- * Figures may not sum due to rounding. Source: Adapted from The Concord Group (2012) by assigning the difference between market demand and market viable units to rental viable flat and townhouse units proportionate to their 2050 rental viability distribution. 56 A HOME FOR EVERYONE
61 Table A.3. Change in Floor-Area-Ratio in Fresno County when Accommodating All Space- Occupying Jobs and All New Attached Residential Units in Existing Commercial Corridors and Centers Metric Figure Space Supported ,000, Space Supported ,000,000 Attached Dwellings ,456 Assumed Attached Dwelling Size 1,500 Attached Dwelling Space 31,000,000 Total Space ,000,000 FAR factor 1.28 Assumed FAR FAR Space Supported ,000,000 Attached Dwellings ,009 Assumed Attached Dwelling Size 1,500 Attached Dwelling Space 62,000,000 Total Space ,000,000 FAR factor 1.69 Assumed FAR FAR Space Supported ,000,000 Attached Dwellings ,774 Assumed Attached Dwelling Size 1,500 Attached Dwelling Space 97,000,000 Total Space ,000,000 FAR factor 2.09 Assumed FAR FAR * Figures may not sum due to rounding. SJ VALLEY HOUSING PREFERENCES AND OPPORTUNITIES TO
62 Appendix B. Kern County Table B.1. Kern County Demographic Changes, New White, non- Hispanic All Other Total New Majority Year Population Hispanic All Races Races Majority Share , , ,144 87, ,296 57% , , , , ,862 68% ,204, , , , ,850 76% ,472, ,959 1,027, ,802 1,244,566 81% ,254 (42,312) 166,219 33, , % % 20% -13% 42% 38% 42% ,418 (77,136) 398,742 80, , % % 50% -24% 102% 93% 100% ,435 (95,835) 636, , , % % 84% -30% 163% 149% 160% ---- * Figures may not sum due to rounding. Source: Adapted from The Planning Center (2012). Table B.2. Kern County Market Viable Housing Distribution, Attached Small All Other Detached Time Period Total Attached Share Lots Lots Detached Share ,446 71,855 27% 23, , ,591 73% , ,903 33% 28, , ,569 67% Change ,026 29, , , Change % 13% 40% % 0% 3% , ,156 35% 55, , ,387 65% Change ,097 54, , , Change % 32% 76% % 0% 17% , ,426 35% 92, , ,190 65% Change ,170 70, , , Change % 52% 98% % 0% 35% ---- * Figures may not sum due to rounding. Source: Adapted from The Concord Group (2012) by assigning the difference between market demand and market viable units to rental viable flat and townhouse units proportionate to their 2050 rental viability distribution. 58 A HOME FOR EVERYONE
63 Table B.3. Change in Floor-Area-Ratio in Kern County when Accommodating All Space- Occupying Jobs and All New Attached Residential Units in Existing Commercial Corridors and Centers Metric Figure Space Supported ,000, Space Supported ,000,000 Attached Dwellings ,048 Assumed Attached Dwelling Size 1,500 Attached Dwelling Space 44,000,000 Total Space ,000,000 FAR factor 1.47 Assumed FAR FAR Space Supported ,000,000 Attached Dwellings ,301 Assumed Attached Dwelling Size 1,500 Attached Dwelling Space 81,000,000 Total Space ,000,000 FAR factor 2.12 Assumed FAR FAR Space Supported ,000,000 Attached Dwellings ,571 Assumed Attached Dwelling Size 1,500 Attached Dwelling Space 106,000,000 Total Space ,000,000 FAR factor 2.89 Assumed FAR FAR * Figures may not sum due to rounding. SJ VALLEY HOUSING PREFERENCES AND OPPORTUNITIES TO
64 Appendix C. Kings County Table C.1. Kings County Demographic Changes, New White, non- Hispanic All Other Total New Majority Year Population Hispanic All Races Races Majority Share ,295 53,879 73,630 3,786 77,416 51% ,685 49, ,662 3, ,471 59% ,119 45, ,942 3, ,871 66% ,247 43, ,126 4, ,138 70% ,390 (4,665) 29, ,055 74% % 19% -9% 39% 1% 38% ,824 (8,631) 69, ,455 79% % 46% -16% 94% 4% 90% ,952 (10,770) 108, ,722 73% % 75% -20% 147% 6% 140% ---- * Figures may not sum due to rounding. Source: Adapted from The Planning Center (2012). Table C.2. Kings County Market Viable Housing Distribution, Attached Small All Other Detached Time Period Total Attached Share Lots Lots Detached Share ,214 12,749 29% 4,766 26,699 31,465 71% ,503 17,134 35% 5,670 26,699 32,369 65% Change ,289 4, Change % 12% 34% % 0% 3% ,950 22,670 39% 8,581 26,699 35,280 61% Change ,736 9, , , Change % 31% 78% % 0% 12% ,395 25,476 38% 14,220 26,699 40,919 62% Change ,181 12, , , Change % 50% 100% % 0% 30% ---- * Figures may not sum due to rounding. Source: Adapted from The Concord Group (2012) by assigning the difference between market demand and market viable units to rental viable flat and townhouse units proportionate to their 2050 rental viability distribution. 60 A HOME FOR EVERYONE
65 Table C.3. Change in Floor-Area-Ratio in Kings County when Accommodating All Space- Occupying Jobs and All New Attached Residential Units in Existing Commercial Corridors and Centers Metric Figure Space Supported ,000, Space Supported ,000,000 Attached Dwellings ,385 Assumed Attached Dwelling Size 1,500 Attached Dwelling Space 7,000,000 Total Space ,000,000 FAR factor 1.45 Assumed FAR FAR Space Supported ,000,000 Attached Dwellings ,921 Assumed Attached Dwelling Size 1,500 Attached Dwelling Space 15,000,000 Total Space ,000,000 FAR factor 2.05 Assumed FAR FAR Space Supported ,000,000 Attached Dwellings ,727 Assumed Attached Dwelling Size 1,500 Attached Dwelling Space 19,000,000 Total Space ,000,000 FAR factor 2.70 Assumed FAR FAR * Figures may not sum due to rounding. SJ VALLEY HOUSING PREFERENCES AND OPPORTUNITIES TO
66 Appendix D. Madera County Table D.1. Madera County Demographic Changes, New White, non- Hispanic All Other Total New Majority Year Population Hispanic All Races Races Majority Share ,932 57,380 77,097 7,455 84,552 56% ,077 52, ,697 7, ,297 66% ,683 48, ,072 8, ,717 74% ,138 47, ,283 9, ,795 78% ,145 (4,600) 36, ,745 88% % 23% -8% 47% 2% 43% ,751 (8,414) 87,975 1,190 89,165 91% % 57% -15% 114% 16% 105% ,206 (10,037) 140,186 2, ,243 83% % 93% -17% 182% 28% 168% ---- * Figures may not sum due to rounding. Source: Adapted from The Planning Center (2012). Table D.2. Madera County Market Viable Housing Distribution, Attached Small All Other Detached Time Period Total Attached Share Lots Lots Detached Share ,117 8,888 20% 5,477 30,752 36,229 80% ,260 15,105 29% 6,403 30,752 37,155 71% Change ,143 6, Change % 16% 70% % 0% 3% ,490 20,351 32% 12,387 30,752 43,139 68% Change ,648 11, , , Change % 26% 129% % 0% 19% ,723 23,884 32% 20,087 30,752 50,839 68% Change ,606 14, , ,610 Change % 66% 169% % 0% 40% ---- * Figures may not sum due to rounding. Source: Adapted from The Concord Group (2012) by assigning the difference between market demand and market viable units to rental viable flat and townhouse units proportionate to their 2050 rental viability distribution. 62 A HOME FOR EVERYONE
67 Table D.3. Change in Floor-Area-Ratio in Madera County when Accommodating All Space- Occupying Jobs and All New Attached Residential Units in Existing Commercial Corridors and Centers Metric Figure Space Supported ,000, Space Supported ,000,000 Attached Dwellings ,217 Assumed Attached Dwelling Size 1,500 Attached Dwelling Space 9,000,000 Total Space ,000,000 FAR factor 1.48 Assumed FAR FAR Space Supported ,000,000 Attached Dwellings ,463 Assumed Attached Dwelling Size 1,500 Attached Dwelling Space 17,000,000 Total Space ,000,000 FAR factor 2.05 Assumed FAR FAR Space Supported ,000,000 Attached Dwellings ,996 Assumed Attached Dwelling Size 1,500 Attached Dwelling Space 22,000,000 Total Space ,000,000 FAR factor 3.05 Assumed FAR FAR * Figures may not sum due to rounding. SJ VALLEY HOUSING PREFERENCES AND OPPORTUNITIES TO
68 Appendix E. Merced County Table E.1. Merced County Demographic Changes, New White, non- Hispanic All Other Total New Majority Year Population Hispanic All Races Races Majority Share ,577 81, ,256 35, ,978 66% ,222 66, ,797 38, ,360 75% ,067 52, ,965 43, ,633 82% ,233 40, ,943 49, ,834 87% ,645 (14,737) 55,541 2,841 58, % % 17% -18% 42% 8% 35% ,490 (29,165) 138,709 7, , % % 47% -36% 104% 22% 87% ,656 (41,200) 217,687 14, ,856 99% % 76% -50% 163% 40% 137% ---- * Figures may not sum due to rounding. Source: Adapted from The Planning Center (2012). Table E.2. Merced County Market Viable Housing Distribution, Attached Small All Other Detached Time Period Total Attached Share Lots Lots Detached Share ,352 20,161 25% 6,147 53,044 59,191 75% ,758 29,374 31% 11,340 53,044 64,384 69% Change ,406 9, , , Change % 18% 46% % 0% 9% ,098 38,468 33% 24,586 53,044 77,630 67% Change ,746 18, , , Change % 46% 91% % 0% 31% ,440 49,238 36% 36,158 53,044 89,202 64% Change ,088 29, , , Change % 74% 144% % 0% 51% ---- * Figures may not sum due to rounding. Source: Adapted from The Concord Group (2012) by assigning the difference between market demand and market viable units to rental viable flat and townhouse units proportionate to their 2050 rental viability distribution. 64 A HOME FOR EVERYONE
69 Table E.3. Change in Floor-Area-Ratio in Merced County when Accommodating All Space- Occupying Jobs and All New Attached Residential Units in Existing Commercial Corridors and Centers Metric Figure Space Supported ,000, Space Supported ,000,000 Attached Dwellings ,213 Assumed Attached Dwelling Size 1,500 Attached Dwelling Space 14,000,000 Total Space ,000,000 FAR factor 1.50 Assumed FAR FAR Space Supported ,000,000 Attached Dwellings ,307 Assumed Attached Dwelling Size 1,500 Attached Dwelling Space 27,000,000 Total Space ,000,000 FAR factor 2.08 Assumed FAR FAR Space Supported ,000,000 Attached Dwellings ,077 Assumed Attached Dwelling Size 1,500 Attached Dwelling Space 44,000,000 Total Space ,000,000 FAR factor 3.08 Assumed FAR FAR * Figures may not sum due to rounding. SJ VALLEY HOUSING PREFERENCES AND OPPORTUNITIES TO
70 Appendix F. San Joaquin County Table F.1. San Joaquin County Demographic Changes, New White, non- Hispanic All Other Total New Majority Year Population Hispanic All Races Races Majority Share , , , , ,217 62% , , , , ,771 75% , , , , ,387 86% ,186,031 62, , ,731 1,123,419 93% ,352 (60,202) 97,094 84, , % % 18% -24% 40% 47% 43% ,246 (126,924) 238, , , % % 47% -52% 97% 115% 105% ,895 (183,307) 375, , , % % 77% -75% 154% 182% 165% ---- * Figures may not sum due to rounding. Source: Adapted from The Planning Center (2012). Table F.2. San Joaquin County Market Viable Housing Distribution, Attached Small All Other Detached Time Period Total Attached Share Lots Lots Detached Share ,941 52,026 24% 24, , ,915 76% ,699 63,204 25% 48, , ,496 75% Change ,758 11, , , Change % 16% 21% % 0% 14% ,192 83,380 28% 80, , ,813 72% Change ,251 31, , , Change % 40% 60% % 0% 34% , ,952 29% 112, , ,736 71% Change ,746 51, , , Change % 65% 100% % 0% 54% ---- * Figures may not sum due to rounding. Source: Adapted from The Concord Group (2012) by assigning the difference between market demand and market viable units to rental viable flat and townhouse units proportionate to their 2050 rental viability distribution. 66 A HOME FOR EVERYONE
71 Table F.3. Change in Floor-Area-Ratio in San Joaquin County when Accommodating All Space- Occupying Jobs and All New Attached Residential Units in Existing Commercial Corridors and Centers Metric Figure Space Supported ,000, Space Supported ,000,000 Attached Dwellings ,178 Assumed Attached Dwelling Size 1,500 Attached Dwelling Space 17,000,000 Total Space ,000,000 FAR factor 1.26 Assumed FAR FAR Space Supported ,000,000 Attached Dwellings ,354 Assumed Attached Dwelling Size 1,500 Attached Dwelling Space 47,000,000 Total Space ,000,000 FAR factor 1.80 Assumed FAR FAR Space Supported ,000,000 Attached Dwellings ,926 Assumed Attached Dwelling Size 1,500 Attached Dwelling Space 78,000,000 Total Space ,000,000 FAR factor 2.43 Assumed FAR FAR * Figures may not sum due to rounding. SJ VALLEY HOUSING PREFERENCES AND OPPORTUNITIES TO
72 Appendix G. Stanislaus County Table G.1. Stanislaus County Demographic Changes, New White, non- Hispanic All Other Total New Majority Year Population Hispanic All Races Races Majority Share , , ,738 64, ,415 52% , , ,438 84, ,296 65% , , , , ,514 78% , , , , ,068 87% ,783 (43,098) 101,700 20, , % % 16% -18% 50% 31% 46% ,743 (94,356) 249,315 49, , % % 40% -39% 124% 77% 112% ,706 (139,947) 390,015 80, , % % 65% -58% 193% 125% 177% ---- * Figures may not sum due to rounding. Source: Adapted from The Planning Center (2012). Table G.2. Stanislaus County Market Viable Housing Distribution, Attached Small All Other Detached Time Period Total Attached Share Lots Lots Detached Share ,220 31,357 23% 15,898 88, ,863 77% ,478 45,352 30% 17,161 88, ,126 70% Change ,258 13, , , Change % 11% 45% % 0% 1% ,756 53,033 30% 34,758 88, ,723 70% Change ,536 21, , , Change % 30% 69% % 0% 18% ,058 73,860 28% 76, , ,198 72% Change ,434 36, , , Change % 55% 98% % 0% 43% ---- * Figures may not sum due to rounding. Source: Adapted from The Concord Group (2012) by assigning the difference between market demand and market viable units to rental viable flat and townhouse units proportionate to their 2050 rental viability distribution. 68 A HOME FOR EVERYONE
73 Table G.3. Change in Floor-Area-Ratio in Stanislaus County when Accommodating All Space- Occupying Jobs and All New Attached Residential Units in Existing Commercial Corridors and Centers Metric Figure Space Supported ,000, Space Supported ,000,000 Attached Dwellings ,762 Assumed Attached Dwelling Size 1,500 Attached Dwelling Space 12,000,000 Total Space ,000,000 FAR factor 1.25 Assumed FAR FAR Space Supported ,000,000 Attached Dwellings ,961 Assumed Attached Dwelling Size 1,500 Attached Dwelling Space 33,000,000 Total Space ,000,000 FAR factor 1.74 Assumed FAR FAR Space Supported ,000,000 Attached Dwellings ,565 Assumed Attached Dwelling Size 1,500 Attached Dwelling Space 55,000,000 Total Space ,000,000 FAR factor 2.25 Assumed FAR FAR * Figures may not sum due to rounding. SJ VALLEY HOUSING PREFERENCES AND OPPORTUNITIES TO
74 Appendix H. Tulare County Table H.1. Tulare County Demographic Changes, New White, non- Hispanic All Other Total New Majority Year Population Hispanic All Races Races Majority Share , , ,785 36, ,480 66% , , ,592 40, ,305 77% ,607 75, ,373 49, ,085 87% ,151 48, ,911 57, ,741 92% ,507 (34,318) 88,807 4,018 92, % % 13% -24% 35% 11% 32% ,192 (68,413) 218,588 13, , % % 37% -48% 85% 35% 79% ,736 (95,525) 342,126 21, , % % 61% -66% 134% 58% 124% ---- * Figures may not sum due to rounding. Source: Adapted from The Planning Center (2012). Table H.2. Tulare County Market Viable Housing Distribution, Attached Small All Other Detached Time Period Total Attached Share Lots Lots Detached Share ,220 31,357 23% 15,898 88, ,863 77% ,478 45,352 30% 17,161 88, ,126 70% Change ,258 13, , , Change % 11% 45% % 0% 1% ,756 53,033 30% 34,758 88, ,723 70% Change ,536 21, , , Change % 30% 69% % 0% 18% ,874 63,119 31% 50,790 88, ,755 69% Change ,654 31, , , Change % 49% 101% % 0% 33% ---- * Figures may not sum due to rounding. Source: Adapted from The Concord Group (2012) by assigning the difference between market demand and market viable units to rental viable flat and townhouse units proportionate to their 2050 rental viability distribution. 70 A HOME FOR EVERYONE
75 Table H.3. Change in Floor-Area-Ratio in Tulare County when Accommodating All Space- Occupying Jobs and All New Attached Residential Units in Existing Commercial Corridors and Centers Metric Figure Space Supported ,000, Space Supported ,000,000 Attached Dwellings ,995 Assumed Attached Dwelling Size 1,500 Attached Dwelling Space 21,000,000 Total Space ,000,000 FAR factor 1.39 Assumed FAR FAR Space Supported ,000,000 Attached Dwellings ,676 Assumed Attached Dwelling Size 1,500 Attached Dwelling Space 33,000,000 Total Space ,000,000 FAR factor 1.72 Assumed FAR FAR Space Supported ,000,000 Attached Dwellings ,762 Assumed Attached Dwelling Size 1,500 Attached Dwelling Space 48,000,000 Total Space ,000,000 FAR factor 2.46 Assumed FAR FAR * Figures may not sum due to rounding. SJ VALLEY HOUSING PREFERENCES AND OPPORTUNITIES TO
76 Endnotes 1 See Demographic%20Forecasts%20-%20Final%2027%20Mar%202012_0.pdf. 2 See accessed April 24, Considering there were about 75 million home owners in 2010, losing 5 million would reduce the home ownership rate from about 65% to about 60% a rate not seen since Data adapted from source: U.S. Census Bureau, Current Population Survey, Annual Social and Economic Supplements. apsd/techdoc/cps/cpsmar12.pdf. 5 This is based on analysis of data available from 6 State figures for metropolitan areas over the period 2010 to 2020 have not been released as of this writing. 7 Historical Census of Housing Tables Ownership Rates, hhes/www/housing/census/historic/ownrate.html. 8 Housing Vacancies and Homeownership for 2005, www/housing/hvs/annual05/ann05t13.html. 9 Based on an unpublished presentation to the Southern California Association of Governments pertaining to broad state and national trends. 10 For details including policy implications and recommendations, see Unger and Thompson (2013). 11 There was also a question where respondents were read a list of housing options and asked what type of housing they would consider if they were to relocate within the county in the next 10 years. As consider is not a preference, results were not conclusive for purposes of this report. 12 For instance, if respondents could choose only one definitely yes option the sum of all choices would not exceed 1,201 which is the number of respondents. But the sum of choices came to 1,854, indicating that about half of the respondents gave this answer to two or more options. 13 The option for A building with offices and stores on the first floor and condominiums on the upper floors received the fewest responses and would seem to be a subset of the condominium and townhouse option. 72 A HOME FOR EVERYONE
77 14 Respondents judge for themselves what is considered a short or long commute. 15 The commuting trip accounts for up to half of the distance and time travel during a typical day and is usually considered the most important housing location factor when considering accessibility only. The unweighted average may therefore be low. 16 While the minimum detached preference from surveys is 44%, the Scenario assumes small lots will account for about 40% of the share of all detached units. The Scenario may thus overstate the 2050 demand for homes on lots larger than 6,000 square feet. 17 See the Excel workbook dashboard for the San Joaquin Valley developed by The Concord Group. 18 Similar requests have been made of the other counties but none have been forthcoming for reasons of individual assessors. The author thanks Robert Terry for processing these requests. 19 Most states have homestead exemption policies resulting in assessed values for residential development being less than market value, with the effect of shifting the property tax burden to nonresidential development. 20 The Energy Information Administration of the U.S. Department of Energy conducts a periodic stratified random sample Commercial Buildings Energy Consumption Survey of all nonindustrial/nonindustrial buildings in the nation. Total space in 1992 was 69.7 billion square feet and for 2003 it was 71.7 billion square feet, or an average of 233 and 246 square feet per person for populations of million and million respectively. 21 See Marshall & Swift (2012). 22 See Commercial Buildings Energy Consumption Survey for Estimated based on the Commercial Buildings Energy Consumption Survey, detailed_tables_2003.html. 24 See the National Trust for Historic Preservation, 25 There is a new quantitatively based concept called complete communities, which many San Joaquin Valley governmental units are considering. For a review of the concept, see reconnectingamerica.org/ assets/pdfs/ arewethereyet-web.pdf. 26 These insights were offered by Keith Bergthold and John Wright. SJ VALLEY HOUSING PREFERENCES AND OPPORTUNITIES TO
78 References Belden Russonello & Stewart (2011). Community Preference Survey. Washington, DC: National Association of Realtors. Cunningham, Gail (2009). Survey Reveals Long-Term Implications of Mortgage Meltdown. Washington, DC: National Foundation for Credit Counseling. HomeownershipSurvey.pdf. Dunham-Jones, Ellen and June Williamson (2009). Retrofitting Suburbia: Urban Design Solutions for Redesigning Suburbs. New York, NY: Wiley. Energy Information Administration (2005). Commercial Buildings Energy Consumption Survey. Washington, DC: U.S. Department of Energy. Energy Information Administration (2009). Manufacturing Energy Consumption Survey. Washington, DC: U.S. Department of Energy. Ewing, Reid, Keith Bartholomew, Steve Winkelman, Jerry Walters and Don Chen (2007). Growing Cooler, Washington, DC: The Urban Land Institute and Smart Growth America. Ewing, Reid and Robert Cervero (2010), Travel and the Built Environment, Journal of the American Planning Association, 76 (3): Godbe Research (2012) Community Survey. Bakersfield, CA: Kern Council of Governments. Marshall & Swift (2012). Marshall Valuation Service. New York, NY. Nelson, Arthur C. (2004). Planners Estimating Guide: Estimating Land-Use and Facility Needs. Chicago: American Planning Association. Nelson, Arthur C. (2011). The New California Dream. Washington, DC: The Urban Land Institute. Nelson, Arthur C. (2013). Reshaping Metropolitan America. Washington, DC: Island Press. The Concord Group (2012). Market Demand Analysis for Higher Density Housing in the San Joaquin Valley. Fresno, CA: Fresno Council of Governments. The Planning Center (2012). San Joaquin Valley Demographic Forecasts 2010 to Fresno, CA: Fresno Council of Governments. Unger, Serena and Edward Thompson, Jr. (2013). Saving Farmland, Growing Cities: A Framework for Implementing Effective Farmland Conservation Policies in the San Joaquin Valley. Davis, CA: American Farmland Trust. Woods & Poole Economics (2011), The Complete Economic and Demographic Data Source, Washington, DC: Woods & Poole Economics. 74 A HOME FOR EVERYONE
79 ACKNOWLEDGEMENTS While all conclusions and errors are his own, the author acknowledges the many reviewers who critiqued and strengthened this report: John Wright, Valley Planners Network Keith Bergthold, City of Fresno Barbara Steck, Rob Terry, Kristine Cai and Kathy Chung and Tony Boren, Fresno Council of Governments Rob Ball and Troy Hightower, Kern Council of Governments Those who attended a luncheon in Fresno to hear the presentation on the methodology and offer their constructive comments, including: Kim Anderson San Joaquin COG Rachel Audino and Keith Woodcock, CSU Fresno Adam Avila, Alvarado Group Robert Borchard, City of Waterford Tony Boren, Kathy Chung, Rob Terry and Barbara Steck, Fresno COG Dan Cort, Cort Companies Amanda Eaken, Natural Resources Defense Council Jaylen French, Stanislaus COG Rhonda Haynes, City of Visalia Elizabeth Jonasson, Coalition for Clean Air Christina Lehn, Kings CAG Virginia Madueño, City of Riverbank Roberta Marshall, Tejon Mountain Village Michael Michaud, Wigh Properties Michael Prandini, BIA-Fresno/ Madera Counties Wilma Quan, City of Fresno Jeffrey Roberts, Granville Homes Michael Sigala, Sigala Incorporated Pete Smith, Kern COG Terry Watt, Terrell Watt Planning Debbie Whitmore, City of Turlock Rob Woolley, City of Clovis John Wright, Planningwright The author also acknowledges the Local Government Commission s Laura Podolsky and Judy Corbett for hosting the luncheon and helping to vet the report. Ethan Elkind, UC Berkeley and UCLA Schools of Law, provided valuable insights and edits. Garlynn Woodsong and Erika Lew, Calthorpe Associates, also provided valuable feedback on data and analysis. The author also acknowledges the extraordinary contributions Dave Davis made to this report. ABOUT THE AUTHOR Arthur C. Nelson is Presidential Professor of City and Metropolitan Planning in the College of Architecture and Planning at the University of Utah, where he is Executive Director of the Metropolitan Research Center, Adjunct Professor of Finance in the David Eccles School of Business, and Co-Director of the Master of Real Estate Development Program. He has published more than 20 books and 200 other works, and his research is frequently cited in national media. He advises HUD, EPA, the ULI, National Association of Realtors and other national housing-related groups on development trends. He has also served a special assistant to HUD s Office of Policy Development and Research in the Clinton and Bush administrations.

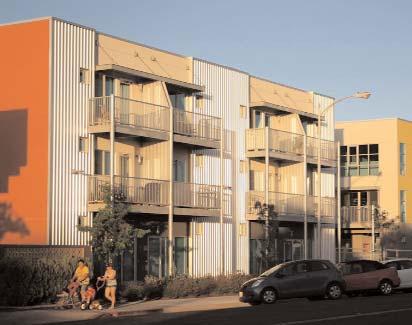
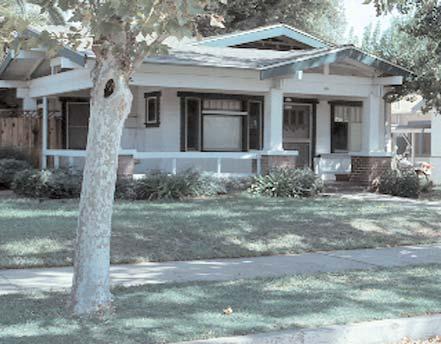
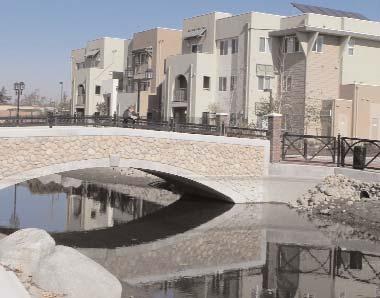
80
The New California Dream How Demographic and Economic Trends May Shape the Housing Market
 Voices on the Future The New California Dream How Demographic and Economic Trends May Shape the Housing Market A Land Use Scenario for 2020 and 2035 ARTHUR C. NELSON Executive Summary The New California
REGIONAL. Rental Housing in San Joaquin County
 Lodi 12 EBERHARDT SCHOOL OF BUSINESS Business Forecasting Center in partnership with San Joaquin Council of Governments 99 26 5 205 Tracy 4 Lathrop Stockton 120 Manteca Ripon Escalon REGIONAL analyst april
2012 Profile of Home Buyers and Sellers New Jersey Report
 Prepared for: New Jersey Association of REALTORS Prepared by: Research Division December 2012 Table of Contents Introduction... 2 Highlights... 4 Conclusion... 7 Report Prepared by: Jessica Lautz 202-383-1155
2012 Profile of Home Buyers and Sellers Texas Report
 2012 Profile of Home and Sellers Report Prepared for: Association of REALTORS Prepared by: NATIONAL ASSOCIATION OF REALTORS Research Division December 2012 2012 Profile of Home and Sellers Report Table
The supply of single-family homes for sale remains
 Oh Give Me a (Single-Family Rental) Home Harold D. Hunt and Clare Losey December, 18 Publication 2218 The supply of single-family homes for sale remains tight in many markets across the United States.
Housing Market Update
 Housing Market Update March 2017 New Hampshire s Housing Market and Challenges Market Overview Dean J. Christon Executive Director, New Hampshire Housing Finance Authority New Hampshire s current housing
Myth Busting: The Truth About Multifamily Renters
 Myth Busting: The Truth About Multifamily Renters Multifamily Economics and Market Research With more and more Millennials entering the workforce and forming households, as well as foreclosed homeowners
2012 Profile of Home Buyers and Sellers Florida Report
 2012 Profile of Home and Sellers Report Prepared for: REALTORS Prepared by: NATIONAL ASSOCIATION OF REALTORS Research Division December 2012 2012 Profile of Home and Sellers Report Table of Contents Introduction...
Nothing Draws a Crowd Like a Crowd: The Outlook for Home Sales
 APRIL 2018 Nothing Draws a Crowd Like a Crowd: The Outlook for Home Sales The U.S. economy posted strong growth with fourth quarter 2017 Real Gross Domestic Product (real GDP) growth revised upwards to
ECONOMIC CURRENTS. Vol. 3, Issue 3 SOUTH FLORIDA ECONOMIC QUARTERLY. Introduction
 ECONOMIC CURRENTS THE Introduction SOUTH FLORIDA ECONOMIC QUARTERLY Economic Currents provides an overview of the South Florida regional economy. The report presents current employment, economic and real
Linkages Between Chinese and Indian Economies and American Real Estate Markets
 Linkages Between Chinese and Indian Economies and American Real Estate Markets Like everything else, the real estate market is affected by global forces. ANTHONY DOWNS IN THE 2004 presidential campaign,
Joint Center for Housing Studies Harvard University. Rachel Drew. July 2015
 Joint Center for Housing Studies Harvard University A New Look at the Characteristics of Single-Family Rentals and Their Residents Rachel Drew July 2015 W15-6 by Rachel Drew. All rights reserved. Short
The Texas 2005 Profile of Home Buyers and Sellers. Prepared by: NATIONAL ASSOCIATION OF REALTORS Research Division
 The Texas 2005 Profile of Home Buyers and Sellers Prepared by: NATIONAL ASSOCIATION OF REALTORS Research Division February, 2006 The 2005 NATIONAL ASSOCIATION OF REALTORS Profile of Home Buyers and Sellers
Chapter 5: Testing the Vision. Where is residential growth most likely to occur in the District? Chapter 5: Testing the Vision
 Chapter 5: Testing the Vision The East Anchorage Vision, and the subsequent strategies and actions set forth by the Plan are not merely conceptual. They are based on critical analyses that considered how
Missing Middle Housing Types Showcasing examples in Springfield, Oregon
 Missing Middle Housing Types Showcasing examples in Springfield, Oregon MissingMiddleHousing.com is powered by Opticos Design Illustration 2015 Opticos Design, Inc. Missing Middle Housing Study Prepared
Module 1. Workforce Housing Overview
 Module 1 Workforce Housing Overview Slide 1 Slide 2 Slide 3 Slide 4 Module 1: Workforce Housing Overview Module 1: Learning Outcomes Slide 5 At the conclusion of this module, you should be able to: Define
The Trends (Hardly Anyone) Are Paying Attention To
 Are Paying Attention To") The Trends (Hardly Anyone) Are Paying Attention To Arthur C. Nelson, Ph.D., FAcSS, FAICP Professor of Planning & Real Estate Development Professor of Geography and Development University of Arizona RMLUI
The Trends (Hardly Anyone) Are Paying Attention To Arthur C. Nelson, Ph.D., FAcSS, FAICP Professor of Planning & Real Estate Development Professor of Geography and Development University of Arizona RMLUI
Compact Housing Sustaining Communities and the Environment
 Compact Housing Sustaining Communities and the Environment 1 Compact Housing Models 1. Compact Single Family Detached 7 21 units per acre 2. Single Family with Secondary Unit 17-24 units per acre 3. Multiple
2015 First Quarter Market Report
 2015 First Quarter Market Report CAAR Member Copy Expanded Edition Charlottesville Area First Quarter 2015 Highlights: Median sales price for the region was up 5.1% over Q1-2014, rising from $244,250 to
Young-Adult Housing Demand Continues to Slide, But Young Homeowners Experience Vastly Improved Affordability
 Young-Adult Housing Demand Continues to Slide, But Young Homeowners Experience Vastly Improved Affordability September 3, 14 The bad news is that household formation and homeownership among young adults
H o u s i n g N e e d i n E a s t K i n g C o u n t y
 1999 2000 2001 2002 2003 2004 2005 2006 2007 2008 2009 2010 Number of Affordable Units H o u s i n g N e e d i n E a s t K i n g C o u n t y HOUSING AFFORDABILITY Cities planning under the state s Growth
DRAFT Plan Incentives. Part A: Basic Discount
 DRAFT 2030 Plan Incentives July 26, 2006 Part A: Basic Discount In order for a development to be eligible for any 2030 Land Resource Management Plan Discounts it must be located in the Urban Corridor and
2013 Arizona Housing Market Mid-Year Report
 2013 Arizona Housing Market Mid-Year Report This mid-year market report outlines the latest trends in Arizona real estate. The housing market hit bottom in mid to late 2011, and has been in recovery mode
TOD and Equity. TOD Working Group. James Carras Carras Community Investment, Inc. August 7, 2015
 TOD and Equity TOD Working Group James Carras Carras Community Investment, Inc. August 7, 2015 What is Equitable TOD? Equity is fair and just inclusion. Equitable TOD is the precept that investments in
Profile of International Home Buyers in Florida
 Profile of International Home Buyers in Florida Research Division National Association of REALTORS 2009 Prepared for the Florida Association of REALTORS 2009 National Association of REALTORS Profile of
RBC-Pembina Home Location Study. Understanding where Greater Toronto Area residents prefer to live
 RBC-Pembina Home Location Study Understanding where Greater Toronto Area residents prefer to live RBC-Pembina Home Location Study: Understanding where Greater Toronto Area residents prefer to live July
Trends in Housing Occupancy
 This bulletin is one in a series of background bulletins to the Official Plan Review. It provides an analysis of changes in household composition and housing occupancy between 1996 and 2006. A copy of
Estimating Commercial Land-Use Conversion: Case Study of Athens-Clarke County, Georgia
 Estimating Commercial Land-Use Conversion: Case Study of Athens-Clarke County, Georgia Arthur C. Nelson, PhD, FAICP Presidential Professor and Director of Metropolitan Research University of Utah Grace
CHAPTER 2: PEOPLE AND THEIR HOMES
 2 CHAPTER 2: PEOPLE AND THEIR HOMES 1kf guts prep.indd 14 3/2/06 1:13:07 PM DANE COUNTY IS DIVERSE The 426,000 people who live in Dane County 6 are in a word diverse. There are people of all ages and families
2011 Profile of Home Buyers and Sellers Texas Report
 2011 Profile of Home and Sellers Report Prepared for: Association of REALTORS Prepared by: NATIONAL ASSOCIATION OF REALTORS Research Division December 2011 2011 Profile of Home and Sellers Report Table
2011 Profile of Home Buyers and Sellers New York Report
 2011 Profile of Home and Sellers Report Prepared for: Association of REALTORS Prepared by: NATIONAL ASSOCIATION OF REALTORS Research Division December 2011 2011 Profile of Home and Sellers Report Table
TASK 2 INITIAL REVIEW AND ANALYSIS U.S. 301/GALL BOULEVARD CORRIDOR FORM-BASED CODE
 TASK 2 INITIAL REVIEW AND ANALYSIS U.S. 301/GALL BOULEVARD CORRIDOR FORM-BASED CODE INTRODUCTION Using the framework established by the U.S. 301/Gall Boulevard Corridor Regulating Plan (Regulating Plan),
ECONOMIC CURRENTS. Vol. 4, Issue 3. THE Introduction SOUTH FLORIDA ECONOMIC QUARTERLY
 ECONOMIC CURRENTS THE Introduction SOUTH FLORIDA ECONOMIC QUARTERLY Vol. 4, Issue 3 Economic Currents provides an overview of the South Florida regional economy. The report presents current employment,
Quarterly Housing Market Update
 Quarterly Housing Market Update An Overview New Hampshire s current housing market performance, as well as its overall economy, is slowly improving, with positives such as increasing employment and rising
2016 MID-YEAR MARKET UPDATE June 23, Breanna Vanstrom, MBA, RCE Chief Executive Officer
 2016 MID-YEAR MARKET UPDATE June 23, 2016 Breanna Vanstrom, MBA, RCE Chief Executive Officer In 2015, Ada County surpassed $2 billion in total dollar volume sold. The first year since 2006. In May 2016,
ON THE HAZARDS OF INFERRING HOUSING PRICE TRENDS USING MEAN/MEDIAN PRICES
 ON THE HAZARDS OF INFERRING HOUSING PRICE TRENDS USING MEAN/MEDIAN PRICES Chee W. Chow, Charles W. Lamden School of Accountancy, San Diego State University, 5500 Campanile Drive, San Diego, CA 92182, chow@mail.sdsu.edu
Housing the Region s Future Workforce SUMMER 2018
 COMING UP SHORT Housing the Region s Future Workforce SUMMER 2018 Prepared by Greenstreet Ltd. in partnership with Lisa Sturtevant & Associates, LLC All rights reserved 2018. MONTGOMERY BOONE HENDRICKS
2015 Spring Market trends report
 2015 Spring Market trends Report National Summary Low inventory in Vancouver and Toronto continue to drive prices as buyers find themselves in competition over the low supply of single-family homes. The
OVERVIEW OF RECENT/EXPECTED ECONOMIC/ HOUSING MARKET CONDITIONS
 OVERVIEW OF RECENT/EXPECTED ECONOMIC/ HOUSING MARKET CONDITIONS STRONG ECONOMIC FUNDAMENTALS *BUT* EXTRAORDINARY SHORT-TERM FACTORS RESULTING IN MAJOR SHIFTS IN TYPES OF HOUSING PRODUCTS AND GEOGRAPHICAL
COMPARISON OF THE LONG-TERM COST OF SHELTER ALLOWANCES AND NON-PROFIT HOUSING
 COMPARISON OF THE LONG-TERM COST OF SHELTER ALLOWANCES AND NON-PROFIT HOUSING Prepared for The Fair Rental Policy Organization of Ontario By Clayton Research Associates Limited October, 1993 EXECUTIVE
Housing Indicators in Tennessee
 Housing Indicators in l l l By Joe Speer, Megan Morgeson, Bettie Teasley and Ceagus Clark Introduction Looking at general housing-related indicators across the state of, substantial variation emerges but
San Francisco Housing Market Update
 San Francisco Housing Market Update California Economic and Housing Market Outlook The national economy maintained a healthy growth rate in the first quarter of 2005 and appeared to be settling in for
Memo to the Planning Commission JULY 12TH, 2018
 Memo to the Planning Commission JULY 12TH, 2018 Topic: California State Senate Bill 828 and State Assembly Bill 1771 Staff Contacts: Joshua Switzky, Land Use & Housing Program Manager, Citywide Division
ECONOMIC CURRENTS. Vol. 3, Issue 1. THE SOUTH FLORIDA ECONOMIC QUARTERLY Introduction
 ECONOMIC CURRENTS THE SOUTH FLORIDA ECONOMIC QUARTERLY Introduction Economic Currents provides an overview of the South Florida regional economy. The report contains current employment, economic and real
ECONOMIC CURRENTS. Vol. 5 Issue 2 SOUTH FLORIDA ECONOMIC QUARTERLY. Key Findings, 2 nd Quarter, 2015
 ECONOMIC CURRENTS THE Introduction SOUTH FLORIDA ECONOMIC QUARTERLY Economic Currents provides an overview of the South Florida regional economy. The report presents current employment, economic and real
ASSEMBLY BILL No. 904
 AMENDED IN SENATE JULY, 0 AMENDED IN SENATE JUNE, 0 AMENDED IN SENATE JUNE, 0 AMENDED IN ASSEMBLY JANUARY, 0 AMENDED IN ASSEMBLY MAY 0, 0 AMENDED IN ASSEMBLY APRIL, 0 AMENDED IN ASSEMBLY MARCH, 0 california
2018 Profile of Home Buyers and Sellers
 Massachusetts Report Prepared for: Massachusetts Association of REALTORS Prepared by: Research Division December 2018 Massachusetts Report Table of Contents Introduction... 2 Highlights... 4 Methodology...
A Historical Perspective on Illinois Farmland Sales
 A Historical Perspective on Illinois Farmland Sales Erik D. Hanson and Bruce J. Sherrick Department of Agricultural and Consumer Economics University of Illinois May 3, 2013 farmdoc daily (3):84 Recommended
CONTENTS. Executive Summary 1. Southern Nevada Economic Situation 2 Household Sector 5 Tourism & Hospitality Industry
 CONTENTS Executive Summary 1 Southern Nevada Economic Situation 2 Household Sector 5 Tourism & Hospitality Industry Residential Trends 7 Existing Home Sales 11 Property Management Market 12 Foreclosure
2006 Profile of Home Buyers and Sellers Texas Report
 2006 Profile of Home Buyers and Sellers Report Prepared for: Association of REALTORS Prepared by: NATIONAL ASSOCIATION OF REALTORS Research Division December 2006 2006 Profile of Home Buyers and Sellers
housing future for our a stronger community, region, and state
 housing for our future a stronger community, region, and state Outline Existing conditions Where does Hanover fit in and how does it compare? Working towards solutions Who is MHP? MISSION: Use private
Detroit Neighborhood Housing Markets
 Detroit Neighborhood Housing Markets Market Study 2016 In 2016, Capital Impact s Detroit Program worked with local and national experts to determine the residential market demand across income levels for
UNDERSTANDING DEVELOPER S DECISION- MAKING IN THE REGION OF WATERLOO
 UNDERSTANDING DEVELOPER S DECISION- MAKING IN THE REGION OF WATERLOO SUMMARY OF RESULTS J. Tran PURPOSE OF RESEARCH To analyze the behaviours and decision-making of developers in the Region of Waterloo
Carver County AFFORDABLE HOUSING UPDATE
 Carver County AFFORDABLE HOUSING UPDATE July 2017 City of Chaska Community Partners Research, Inc. Lake Elmo, MN Executive Summary - Chaska Key Findings - 2017 Affordable Housing Study Update Chaska is
2017 Profile of Home Buyers and Sellers
 New Jersey Report Prepared for: New Jersey REALTORS Prepared by: Research Division December 2017 New Jersey Report Table of Contents Introduction... 2 Highlights... 4 Methodology... 8 Report Prepared by:
Draft for Public Review. The Market and Octavia Neighborhood Plan
 Draft for Public Review The Market and Octavia Neighborhood Plan San Francisco Planning Department As Part of the Better Neighborhoods Program December 00 . Housing People OBJECTIVE.1 MIXED-USE RESIDENTIAL
Chapter 1: Community & Planning Context
 Chapter 1: Community & Planning Context Yesterday, Today & Tomorrow Comprehensive Plan 2040 2 INTRODUCTION The City of Lauderdale is a small town with a long history. Nestled between Saint Paul and Minneapolis,
How Does the City Grow?
 This bulletin summarizes information from the City of Toronto s Land Use Information System II, providing an overview of the development projects received by the City Planning Division between January
2014 Bay Area Council Survey Report of Selected Results: Housing and Transportation
 2014 Bay Area Council Survey Report of Selected Results: Housing and Transportation Online Panel survey of 1,018 Bay Area Residents April 8-15, 2014 EMC Research, Inc. How do you feel things are going
A Tale of Two Canadas
 Centre for Urban and Community Studies Research Bulletin #2 August 2001 A Tale of Two Canadas Homeowners Getting Richer, Renters Getting Poorer Income and Wealth Trends in Toronto, Montreal and Vancouver,
Housing, Retail and Arts
 Summary of Findings & Conclusions West Oakland Specific Plan Market Opportunity Report: Housing, Retail and Arts Prepared for City of Oakland Under subcontract to JRDV Architects DECEMBER 2011 Summary
Characteristics of Recent Home Buyers
 Characteristics of Recent Home Buyers Special Studies, February 1, 2019 By Carmel Ford Economics and Housing Policy National Association of Home Builders Introduction To analyze home buyers NAHB uses the
City and County of San Francisco
 City and County of San Francisco Office of the Controller - Office of Economic Analysis Residential Rent Ordinances: Economic Report File Nos. 090278 and 090279 May 18, 2009 City and County of San Francisco
REAL ESTATE MARKET OVERVIEW 1 st Half of 2015
 REAL ESTATE MARKET OVERVIEW 1 st Half of 2015 With Comparisons to the 2 nd Half of 2014 September 4, 2015 Prepared for: First Bank of Wyoming Prepared by: Ken Markert, AICP MMI Planning 2319 Davidson Ave.
Housing for the Region s Future
 Housing for the Region s Future Executive Summary North Texas is growing, by millions over the next 40 years. Where will they live? What will tomorrow s neighborhoods look like? How will they function
The National Homeownership Strategy: Partners in the American Dream. Chapter 1: The National Homeownership Strategy
 Page 1 of 10 The National Homeownership Strategy: Partners in the American Dream Chapter 1: The National Homeownership Strategy Purpose Li t The purpose of the National Homeownership Strategy is to achieve
VISION 2030: Terrebonne s Plan for Its Future 5 1
 VISION 2030: Terrebonne s Plan for Its Future 5 1 INTRODUCTION CHAPTER 5 HOUSING ELEMENT The need for affordable housing in Terrebonne Parish is growing. Housing development on usable land in the southern
RESIDENTIAL MARKET ANALYSIS
 RESIDENTIAL MARKET ANALYSIS CLANCY TERRY RMLS Student Fellow Master of Real Estate Development Candidate Oregon and national housing markets both demonstrated shifting trends in the first quarter of 2015
HOUSING MARKET REPORT BERLIN 2018: NO END IN SIGHT TO PRICE UPTREND. - Asking rents for apartments rise 8.8 percent to 9.79 per sq m and month in 2017
 PRESS RELEASE HOUSING MARKET REPORT BERLIN 2018: NO END IN SIGHT TO PRICE UPTREND - Asking rents for apartments rise 8.8 percent to 9.79 per sq m and month in 2017 - Focus of new construction shifts from
Source: James Wood, BEBR
 Article from Policy Perspectives (http://www.imakenews.com/cppa/e_article000962572.cfm?x=b6gdd3k,b30dnqvw,w) November 27, 2007 Affordable Housing in Utah by Sara McCormick, MPA and Tricia Jack, MPA, CPPA
Suburban Sprawl: Exposing Hidden Costs, Identifying Innovations. Summary
 : Exposing Hidden Costs, Identifying Innovations Summary October 2013 Suburban sprawl is spreading across Canada as cities expand outwards to accommodate the growing demand for lower cost houses. But it
ANALYSIS OF THE CENTRAL VIRGINIA AREA HOUSING MARKET 1st quarter 2013 By Lisa A. Sturtevant, PhD George Mason University Center for Regional Analysis
 ANALYSIS OF THE CENTRAL VIRGINIA AREA HOUSING MARKET 1st quarter By Lisa A. Sturtevant, PhD George Mason University Center for Regional Analysis Economic Overview Key economic factors in the first quarter
Seattle Housing Market Overview January 2019
 Seattle Housing Market Overview January 2019 A review of recent trends and thoughts about the future of the Seattle housing market. Bill King President, Chief Valuation Officer Real Info, Inc. City of
Housing Needs in Burlington s Downtown & Waterfront Areas
 Housing Needs in s Downtown & Waterfront Areas Researched and written by Vermont Housing Finance Agency for the City of Planning & Zoning Department 10/31/2011 Contents Introduction... 2 Executive Summary...
Australian home size hits 22-year low
 Australian home size hits 22-year low CommSec Home Size Trends Report Economics November 16 2018 The average floor size of an Australian home (houses and apartments) has fallen to a 22-year low. Data commissioned
UC Berkeley Fisher Center Working Papers
 UC Berkeley Fisher Center Working Papers Title The Case for Preserving Costa-Hawkins - The Potential Impacts of Rent Control on Single Family Homes Permalink https://escholarship.org/uc/item/8wt9p088 Author
CONTENTS. Executive Summary. Southern Nevada Economic Situation 1 Household Sector 4 Tourism & Hospitality Industry
 CONTENTS Executive Summary Southern Nevada Economic Situation 1 Household Sector 4 Tourism & Hospitality Industry Residential Trends 6 Existing Home Sales 10 Property Management Market 11 Foreclosure Situation
Yolo County Workshop October 27, 2003
 Yolo County Workshop October 27, 2003 WHAT YOU WILL DO TONIGHT Learn results of Yolo County Neighborhood Workshops Analyze pro and cons of four scenarios for Yolo County s future through 2050 Choose the
2013 Profile of Home Buyers and Sellers Texas Report
 2013 Profile of Home Buyers and Sellers Report Prepared for: Association of REALTORS Prepared by: NATIONAL ASSOCIATION OF REALTORS Research Division December 2013 2013 Profile of Home Buyers and Sellers
housing element of the general plan Approved and Adopted April 2011
 1 public hearing draft housing element of the general plan Approved and Adopted April 2011 ABSTRACT This report contains text that amends the Housing Element of the 1993 General Plan Refinement. It also
2008 Profile of Home Buyers and Sellers Texas Report
 2008 Profile of Home and Sellers Report Prepared for: Association of REALTORS Prepared by: NATIONAL ASSOCIATION OF REALTORS Research Division December 2008 As of fall 2008, the outlook for the economy
E-commerce. E-commerce in the Bay Area. United States Year End How consumer demand for expedited deliveries is driving real estate
 1 E-commerce in the Bay Area United States Year End 2016 How consumer demand for expedited deliveries is driving real estate 2 Last-mile delivery and a new era for industrial Introduction real estate Adjusting
Volume II Edition I Why This is a Once in a Lifetime Opportunity for Investors
 www.arizonaforcanadians.com Volume II Edition I Why This is a Once in a Lifetime Opportunity for Investors In This Edition How to make great investment returns in a soft market U.S. Financing for Canadians
Why are house prices so high in the Portland Metropolitan Area?
 ROBERT F. MCCULLOUGH, JR. PRINCIPAL Why are house prices so high in the Portland Metropolitan Area? Robert McCullough A question that comes up frequently in neighborhood discussions concerns the rapid
HOUSING MARKET OUTLOOK: SAN LUIS OBISPO, CA AND SURROUNDING AREA
 HOUSING MARKET OUTLOOK: SAN LUIS OBISPO, CA AND SURROUNDING AREA GABE RANDALL SCOTT KELTING April15, 2009 National Market Overview April 15, 2009 2008: A Year in Review Starting between 1999 and 2000,
STRENGTHENING RENTER DEMAND
 5 Rental Housing Rental housing markets experienced another strong year in 2012, with the number of renter households rising by over 1.1 million and marking a decade of unprecedented growth. New construction
Housing as an Investment Greater Toronto Area
 Housing as an Investment Greater Toronto Area Completed by: Will Dunning Inc. For: Trinity Diversified North America Limited February 2009 Housing as an Investment Greater Toronto Area Overview We are
3 RENTAL HOUSING STOCK
 3 RENTAL HOUSING STOCK The nation s rental housing comes in all structure types, sizes, prices, and locations. But with the recent growth in high-income renter households, most additions to the stock have
WELCOME. Imagining New Communities. Open House. Planning & economic development department
 WELCOME Imagining New Open House Why are we Here? The City of Hamilton is working on several projects related to residential growth. The City is here to present an overview of the concepts behind these
Austin-area home prices set August record, outpace household income growth in August 2015
 Austin-area home prices set August record, outpace household income growth in August 2015 Market Reports Austin Board of REALTORS releases real estate statistics for August 2015 AUSTIN, Texas September
Table of Contents. Title Page # Title Page # List of Tables ii 6.7 Rental Market - Townhome and Apart ment Rents
 RESIDENTIAL MONITORING REPORT 2013 Table of Contents Title Page # Title Page # List of Tables ii 6.7 Rental Market - Townhome and Apart ment Rents 21 List of Figures iii 7.0 Other Housing Demands and Trends
Land Use. Land Use Categories. Chart 5.1. Nepeuskun Existing Land Use Inventory. Overview
 Land Use State Comprehensive Planning Requirements for this Chapter A compilation of objectives, policies, goals, maps and programs to guide the future development and redevelopment of public and private
Carver County AFFORDABLE HOUSING UPDATE
 Carver County AFFORDABLE HOUSING UPDATE July 2017 City of Cologne Community Partners Research, Inc. Lake Elmo, MN Executive Summary - Cologne Key Findings - 2017 Affordable Housing Study Update Cologne
Affordably- Priced Housing
 Affordably- Priced Housing Can the next generation afford to live in Chester County? Chester County Planning Commission This slide deck is an annotated version of one presented at the Chesco2020 Affordably-Priced
ZIMMERMAN/VOLK ASSOCIATES, INC.
 ZIMMERMAN/VOLK ASSOCIATES, INC. Post Office Box 4907 Clinton, New Jersey 08809 908 735-6336 info@zva.cc www.zva.cc Research and Strategic Planning Presented by: Laurie Volk Co-Managing Director Zimmerman/Volk
The rapidly rising price of single-family homes in. Change and Challenges East Austin's Affordable Housing Problem
 Change and Challenges East 's Affordable Housing Problem Harold D. Hunt and Clare Losey March 2, 2017 Publication 2161 The rapidly rising price of single-family homes in East has left homeownership out
Residential September 2010
 Residential September 2010 Karl L. Guntermann Fred E. Taylor Professor of Real Estate Adam Nowak Research Associate For the first time since March, house prices turned down slightly in August (-2 percent)
UNDERSTANDING THE TAX BASE CONSEQUENCES OF LOCAL ECONOMIC DEVELOPMENT PROGRAMS
 UNDERSTANDING THE TAX BASE CONSEQUENCES OF LOCAL ECONOMIC DEVELOPMENT PROGRAMS Richard K. Gsottschneider, CRE President RKG Associates, Inc. 277 Mast Rd. Durham, NH 03824 603-868-5513 It is generally accepted
HOUSING AFFORDABILITY
 HOUSING AFFORDABILITY (RENTAL) 2016 A study for the Perth metropolitan area Research and analysis conducted by: In association with industry experts: And supported by: Contents 1. Introduction...3 2. Executive
November An updated analysis of the overall housing needs of the City of Aberdeen. Prepared by: Community Partners Research, Inc.
 City of Aberdeen HOUSING STUDY UPDATE November 2010 An updated analysis of the overall housing needs of the City of Aberdeen Prepared by: Community Partners Research, Inc. nd 10865 32 Street North Lake