Photo obtained from Civic Arts Project. Connectivity & Continuity in Downtown Newark Property Assessment January 2018
|
|
|
- Maryann Lawrence
- 5 years ago
- Views:
Transcription

1 Photo obtained from Civic Arts Project Connectivity & Continuity in Downtown Newark Property Assessment January 2018

2 Downtown Newark Property Assessment: 2018 Proposed to Newark Development Partners By the Heath-Newark-Licking County Port Authority In partnership with Miami University s Center for Public Management and Regional Affairs through the Ohio Public Leaders program

3
4

5
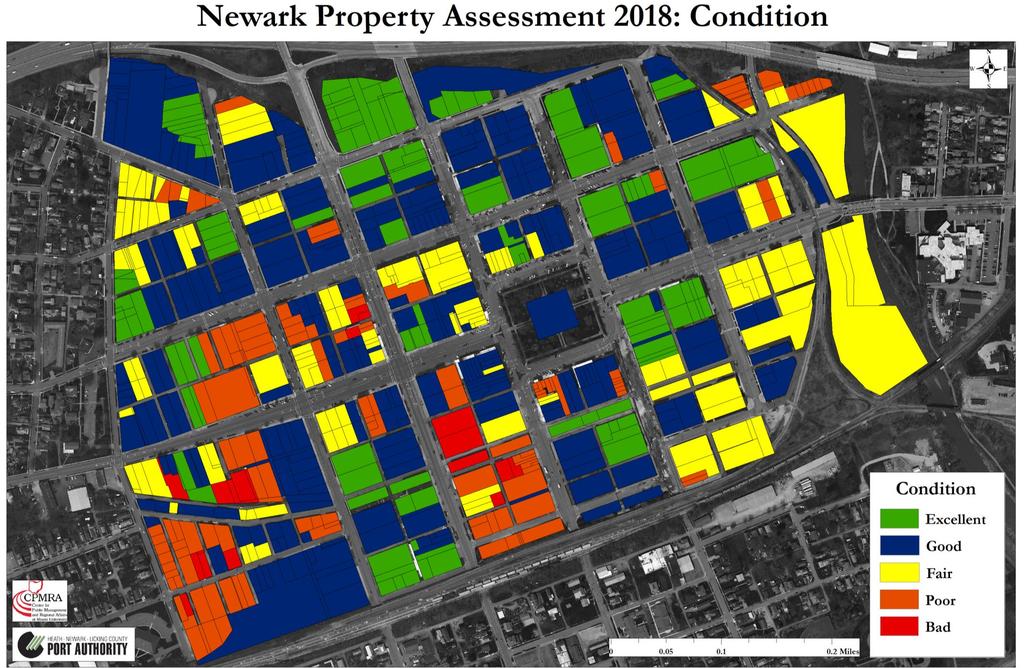
6 Emily Fernandez, a student in Miami University s Ohio Public Leaders (OPL) program, worked with staff at the Heath-Newark Licking County Port Authority (HNLCPA) to conduct a property assessment of Downtown Newark during the month of January The assessment includes a review of land use, condition, and occupancy of 737 parcels in the downtown area. When interpreting the results of this study, note that each 1% represents approximately 7 parcels. Methodology Land use is categorized into seven types. Some buildings are mixed-use, but the data reflect the primary use. For the purposes of this study, the primary use is that which occupies the street level floor of a building. The rationale behind this choice is that downtowns are supposed to create a relationship between the pedestrian and the built environment, and the pedestrian interacts primarily with the use that occupies the street level floor. Although some pedestrians interact with higher floors, they typically have to enter the first floor to reach the others. Condition is ranked on a scale that is as follows: Excellent: Property is well-maintained with recent improvements noticeable. Good: Property shows some wear or need for minor repairs. Fair: Property exhibits signs of need for more major repairs. Poor: Property exhibits multiple signs of needed repairs, including roof, windows, and/or foundation near point of total deterioration. Bad: Property is totally deteriorated and should be razed. Occupancy is classified using two simple categories: occupied or vacant. A parcel is considered vacant only if there are no apparent signs of residency. If a building appears vacant on the top two floors but has a first floor in use, it is considered occupied. Findings Land Use Single Family Housing 11.9% Multi-Family Housing 6.8% Retail 27.8% Office 13.4% Industrial 1.2% Public 35.4% Vacant 3.3% Condition Excellent 18.3% Good 41% Fair 20.1% Poor 18% Bad 2.6% Occupancy Occupied 89.8% Vacant 10.2% Spreadsheets, graphics, and map documents are downloadable from: portauthorityusa.com/downtown
7 Comparison Report Introduction Property assessments of Downtown Newark were also conducted in August 2007 and January The 2007 study involved many data collectors, as six teams surveyed different parts of Downtown and combined their results to complete the full picture. The 2014 study was conducted primarily by an OPL fellow. The current study more closely resembles the 2014 model, in which the fellow is primarily responsible for both the data collection and analysis. The remainder of this study is a comparison of the three assessments that have been completed to date, followed by recommendations for further improvement to Downtown Newark. Land Use Single Family Housing 9% 11% 11.9% Multi-Family Housing 6% 4% 6.8% Retail 28% 28% 27.8% Office 17% 12% 13.4% Industrial 3% 1% 1.2% Public 31% 34% 35.4% Vacant 6% 10% 3.3% Analysis- Land Use 2018 % Change: % Change: Single Family Housing Multi-Family Housing Retail Office Industrial Public Vacant As depicted in the chart above, land use has remained mostly consistent over the past decade. In terms of housing, the differences between single family and multi-family within a given year are greater than the differences in the total amount of housing between years. Therefore, the variation within each of the two categories, single family housing and multi-family housing, is most likely attributable to classification error rather than real change. A notable trend is that the amount of retail has not changed since 2007*. The 2014 report notes the 5% decrease in office space from , but office space is on the incline again with a 1.4% increase in the past four years. Public space increased 3% from , and 1.4% from After accounting for the variation in elapsed time between studies, further analysis indicates that public space has been steadily increasing by about 0.4% every year since The largest differences are in vacancy, which between the three studies shifts from 6% up to 10%, then all the way down to 3.3%. The explanation for this may lie partially in classification differences. The current study assigns an occupied status to parcels with any amount of occupancy, while the previous studies may have been based on whether buildings had full occupancy or a certain percentage of occupancy. Additionally, the results of the current study and 2014 study are derived from windshield surveys of Downtown. Buildings that appear vacant on the outside may in fact be in use, while buildings that appear well-maintained may be empty. Athough the 2007 study was conducted on foot, and therefore at a closer perspective, recordings were still based on the exterior appearance of buildings. Because occupancy is *A difference of <1% is negligible for the comparative purposes of this study because the previous two studies rounded percentages to a whole number. This study includes fractions of percentages so that readers may determine the number of parcels that are represented by a given percentage with greater accuracy.
8 difficult to determine from an outside perspective, recordings about vacancy are more susceptible to error than recordings in the other categories. Comparison Report Condition Excellent 29% 17.5% 18.3% Good 26% 35% 41% Fair 32% 38% 20.1% Poor 11% 8.5% 18% Bad 2% 1% 2.6% Analysis- Condition % Change: % Change: Excellent Good Fair Poor Bad The number of Excellent properties decreased between the first two studies, but increased between the most recent two. The decrease from is probably due to typical deterioration over time. Perhaps growth stagnated from , and some of the Excellent buildings shifted to Good condition while there was no new construction to replenish the Excellent category. One possible explanation for the lack of new growth is economic hardship stemming from the 2008 recession, which occurred just after the first property assessment of Downtown Newark was completed. While part of the increase in Good properties may be due to the decline of Excellent properties, it is also important to note the large decrease in Fair properties. Some of the properties that were previously considered Fair have probably been renovated and shifted to the Good category. The increase in Poor properties indicates that other Fair properties were probably neglected, and therefore fell into Poor condition. There is minor fluctuation in the Bad category, with a net increase of just 0.6% since Still, the number of Poor properties in Downtown has increased sharply by 9.5% since If those areas are not addressed promptly, there may be a significant shift from Poor to Bad over the next few years. Occupancy Occupied 87% 81% 89.8% Vacant 13% 19% 10.2% Analysis- Occupancy % Change: % Change: Occupied Vacant The net difference from 2007 to 2018 is a only a 2.8% increase in occupancy. However, occupancy has been relatively unsteady. There was a drop of 6% from , but then occupancy spiked by 8.8% from As described in the Analysis- Land Use section of this report, vacancy is probably the most difficult category to measure from an outside perspective. Of all the attributes recorded, vacancy may be most affected by classification differences. However, classification differences should not account for a full 6-8% of change. One possible explanation for the spike in occupancy is the rate of population increase. According to the U.S. Census Bureau, Newark s population was 47,130 in 2007, 48,399 in 2014, and 49,134 in 2016, which is the most recent data available. This means that the population was increasing by approximately 181 per year from , and by 368 per year from Assuming the population continues to increase at the same rate, the 2018 population will
9 be about 49,871. Part of the increase in occupancy may be due to the quick rise in population over the past few years. However, the population has been on the incline since at least 2007, so population change is probably not the driving force for the sharp increase in occupancy. The most likely explanation is that Downtown Newark has recently seen more vigorous community development efforts, and that the efforts have been successful. Conclusion Considerations To reiterate what has been mentioned throughout this report, it is important to remember that the findings of each study are affected by the biases of the individuals conducting the studies, and comparisons should be drawn with care. Distinguishing between retail and office space can be difficult from an outside perspective, but the absolute lack of change in retail space between the three studies most likely means that the uses were classified consistently and that retail truly has remained at about 28%. Industrial use does not appear to have a place in Downtown, and there is no compelling reason to expect that it will increase. A comparison of the maps from all three studies shows that an industrial use was primarily assigned to parcels containing storage units. Although small storage units are not typically associated with industrial use, they are most suited to the industrial category for the purposes of these studies because they do not fit retail or other uses. When interpreting condition, the maps should be viewed in clusters, such as a whole block or one side of a block, rather than as individual parcels. The condition that was assigned could be different based on the angle of the building that was seen, or the amount of the building that was seen. Some of the buildings in Downtown appear maintained from the street, yet have sides or backs that appear to be falling apart. This seems especially true of the mixed use buildings, many of which have a well-maintained first floor but are neglected on the higher floors. Some of the parcels around Courthouse Square have retail on the bottom floor that is in fine condition, while the top floors are designed for housing and yet they are vacant. Housing as a whole seems to be a problem in the Downtown area. Most of the housing on the outskirts of Downtown is in Fair or Poor condition, while the center of Downtown struggles with vacancy in spaces that are dedicated to housing. Again, the condition map should be viewed in terms of broad areas with evident trends rather than as a collection of individual parcels. Recommendations Moving forward, the primary focus in Downtown should be on filling the major areas of vacancy in order to encourage continuity and connectivity. Maintaining and improving the condition of currently occupied spaces is also important, but Downtown is in overall good condition. The majority of parcels in Downtown are in Good or Excellent condition, at a combined 59.3%. Another 20.1% is in Fair condition, while Poor and Bad conditions comprise the final 20.6% of parcels. The parcels that are completely vacant are most concerning because they are concentrated in central areas, which creates a disconnect between some of the major attractions in Downtown. The worst vacancies are the ones on Third Street, southwest of Courthouse Square. This area has the potential to create a smooth connection between the
10 park, Canal Market, and Courthouse Square. Instead, it harms the walkability of the street and tarnishes the aesthetics of the nearby attractions. The vacancies on Third Street could be filled with more retail. An ice cream parlor directly across from the park may be successful. In winter, when both the park and ice cream parlor are out of use, the spaces could be used to host events such as a chili cook-off or snowman building contest. Family-oriented, seasonal events will help build community and keep the street alive all year round. Fostering a unique culture and sense of place is essential to Downtown s vitality. Although vacancies are not ideal, the city has a huge opportunity right now to rebuild the entire southern stretch of Third Street in a creative way. The possibility of pop-up shops should be explored as the city debates a long-term vision. Support for pop-up shops can be found in publications by Smart Growth America 1, as well as other articles published within the past year 2. A similar approach, filling vacancies with artists, is another temporary solution that keeps the street busy and helps create culture 3. The park also needs to have its own central attraction. While Licking County Foundation, the nonprofit northeast of the courthouse, has a splash pad, there is nothing similar in the park. Moreover, the one at Licking County Foundation has been out of commission for years. With more knowledge available about sanitation and maintenance than ever before, it may be time to vacancies 3 owntown_jacksonville_buildings reexplore the idea of including a similar feature in Downtown. A splash pad within the park itself would help create a sense of centrality and make the park more attractive. Some companies, such as Custom Ice 1, specialize in multipurpose splash pads that serve as ice rinks in winter so that spaces can be utilized year-round. Another option is a small fountain and pond, with ledge seating that allows people to put their feet or hands in the water. Water is desirable, but another option is to put something climbable in the park, such as statues or a jungle gym. As it sits now, the park more closely resembles a requirement for green space than an actual destination where people can spend time. The occupancy and conditions around the library are another area of concern. There are a number of vacancies immediately to the west of the library. The space could be filled with a recreational use to complement the library. Some suggestions are a basketball court, sand volleyball court, playground, skatepark, tetherball, or a combination of such activities. Equipment that is necessary for the games can be signed out at the library, which also encourages youth to actually enter the library. Another idea is a pavilion, which would be a good spot to host live music, reading programs related to the library, and other community events. The library closes at 8:00 p.m. on weeknights and as early as 5:00 p.m. on weekends, so live music and other noisy events should not cause a conflict. The vacant parcels in that area that are directly on the street can become a small expansion of the library parking lot. This will help accommodate any increased traffic due to new facilities, and will also protect the people using the facilities by creating a barrier between the recreational area and Main Street. 1
11 Finally, the alleys throughout Downtown would benefit from some cleanup efforts. Taking care of the alleys supports the connectivity and continuity that was discussed in relation to the vacancies on Third Street. Newark should look to other downtowns in Ohio with model alleys, such as the Easton Town Center or Kent s Acorn Alley. Although Downtown Newark is walkable in terms of physical distance and sidewalks, there are parts that simply look uninviting and may deter pedestrians, especially after dark. Adding signage to the alleys is a good way to make them seem as if they are a part of the Downtown experience, rather than just dismal corridors a person must pass through to get from one destination to another. The signage should be consistent, symmetrical, and well-maintained. Additionally, putting decorative lights in the alleys is a good way to make them more aesthetically pleasing and will serve as a safety feature at night. In some of the more open alleys, which are really just centers of blocks and are not enclosed, the city should consider allowing local artists to paint murals. Most of the buildings are bare on the sides that do not directly face the street, so there are a lot of places that could benefit from some artwork. Filling in some of the major vacancies and cleaning up the alleys will help to create connectivity and continuity, and show people that Downtown Newark is a livable and exciting place all on its own. Proposed to Newark Development Partners By the Heath-Newark-Licking County Port Authority In partnership with Miami University s Center for Public Management and Regional Affairs through the Ohio Public Leaders program
12
ECONOMIC CURRENTS. Vol. 5 Issue 2 SOUTH FLORIDA ECONOMIC QUARTERLY. Key Findings, 2 nd Quarter, 2015
 ECONOMIC CURRENTS THE Introduction SOUTH FLORIDA ECONOMIC QUARTERLY Economic Currents provides an overview of the South Florida regional economy. The report presents current employment, economic and real
REAL ESTATE MARKET OVERVIEW 1 st Half of 2015
 REAL ESTATE MARKET OVERVIEW 1 st Half of 2015 With Comparisons to the 2 nd Half of 2014 September 4, 2015 Prepared for: First Bank of Wyoming Prepared by: Ken Markert, AICP MMI Planning 2319 Davidson Ave.
2015 Downtown Parking Study
 2015 Downtown Parking Study City of Linden Genesee County, Michigan November 2015 Prepared by: City of Linden Downtown Development Authority 132 E. Broad Street Linden, MI 48451 www.lindenmi.us Table of
Volume Title: Well Worth Saving: How the New Deal Safeguarded Home Ownership
 This PDF is a selection from a published volume from the National Bureau of Economic Research Volume Title: Well Worth Saving: How the New Deal Safeguarded Home Ownership Volume Author/Editor: Price V.
A project of Neighborhood Projects for Community Revitalization At the Center for Urban and Regional Affairs (CURA) University of Minnesota
 University of Minnesota") Affordable Housing Siting Opportunities in Minneapolis October 2008 Rachel C. Robinson, Author With assistance from Joel Larson A project of Neighborhood Projects for Community Revitalization At the Center
Affordable Housing Siting Opportunities in Minneapolis October 2008 Rachel C. Robinson, Author With assistance from Joel Larson A project of Neighborhood Projects for Community Revitalization At the Center
Year to Date (thru June)
") CAAR Market Report 2009 Mid-Year Published by the Charlottesville Area Association of REALTORS Where Are We Now? The pace of home purchases in the Charlottesville area continues to improve from the dismal
CAAR Market Report 2009 Mid-Year Published by the Charlottesville Area Association of REALTORS Where Are We Now? The pace of home purchases in the Charlottesville area continues to improve from the dismal
Missing Middle Housing Types Showcasing examples in Springfield, Oregon
 Missing Middle Housing Types Showcasing examples in Springfield, Oregon MissingMiddleHousing.com is powered by Opticos Design Illustration 2015 Opticos Design, Inc. Missing Middle Housing Study Prepared
2014 Plan of Conservation and Development
 The Town of Hebron Section 1 2014 Plan of Conservation and Development Community Profile Introduction (Final: 8/29/13) The Community Profile section of the Plan of Conservation and Development is intended
CHAPTER 3. HOUSING AND ECONOMIC DEVELOPMENT
 CHAPTER 3. HOUSING AND ECONOMIC DEVELOPMENT This chapter analyzes the housing and economic development trends within the community. Analysis of state equalized value trends is useful in estimating investment
City of Lonsdale Section Table of Contents
 City of Lonsdale City of Lonsdale Section Table of Contents Page Introduction Demographic Data Overview Population Estimates and Trends Population Projections Population by Age Household Estimates and
Back in the Loop. It was a place of refuge, of big shoulder pads and bad hair. In the 1980s, it
 Back in the Loop After two decades of living in the past, Chicago s Presidential Towers repositioned itself into relevancy. BY LAUREN BOSTON It was a place of refuge, of big shoulder pads and bad hair.
Appendix 1: Gisborne District Quarterly Market Indicators Report April National Policy Statement on Urban Development Capacity
 Appendix 1: Gisborne District Quarterly Market Indicators Report April 2018 National Policy Statement on Urban Development Capacity Quarterly Market Indicators Report April 2018 1 Executive Summary This
Estimating National Levels of Home Improvement and Repair Spending by Rental Property Owners
 Joint Center for Housing Studies Harvard University Estimating National Levels of Home Improvement and Repair Spending by Rental Property Owners Abbe Will October 2010 N10-2 2010 by Abbe Will. All rights
REGIONAL. Rental Housing in San Joaquin County
 Lodi 12 EBERHARDT SCHOOL OF BUSINESS Business Forecasting Center in partnership with San Joaquin Council of Governments 99 26 5 205 Tracy 4 Lathrop Stockton 120 Manteca Ripon Escalon REGIONAL analyst april
ARLA Members Survey of the Private Rented Sector
 Prepared for The Association of Residential Letting Agents ARLA Members Survey of the Private Rented Sector Second Quarter 2014 Prepared by: O M Carey Jones 5 Henshaw Lane Yeadon Leeds LS19 7RW June, 2014
Myth Busting: The Truth About Multifamily Renters
 Myth Busting: The Truth About Multifamily Renters Multifamily Economics and Market Research With more and more Millennials entering the workforce and forming households, as well as foreclosed homeowners
Housing affordability in England and Wales: 2018
 Statistical bulletin Housing affordability in England and Wales: 2018 Brings together data on house prices and annual earnings to calculate affordability ratios for national and subnational geographies
Downtown Development Focus Area: I. Existing Conditions
 Downtown Development Focus Area: I. Existing Conditions The Downtown Development Focus Area is situated along Route 1, south of the train tracks, except for the existing Unilever property. It extends west
APPENDIX F DETAILED DISCUSSION OF SPATIALLY EXPLICIT ANALYSIS OF ADDITIONAL HOUSING UNITS IN GUSG HABITAT
 APPENDIX F DETAILED DISCUSSION OF SPATIALLY EXPLICIT ANALYSIS OF ADDITIONAL HOUSING UNITS IN GUSG HABITAT F-1 SPATIALLY EXPLICIT ANALYSIS OF ADDITIONAL HOUSING UNITS IN GUSG HABITAT Dr. David Theobald,
Procedures Used to Calculate Property Taxes for Agricultural Land in Mississippi
 No. 1350 Information Sheet June 2018 Procedures Used to Calculate Property Taxes for Agricultural Land in Mississippi Stan R. Spurlock, Ian A. Munn, and James E. Henderson INTRODUCTION Agricultural land
OFFICE MARKET ANALYSIS:
 OFFICE MARKET ANALYSIS: DAVID WEST RMLS Fellow Certificate of Real Estate Development Student Masters of Urban and Regional Planning Candidate While the Portland office market continues the slow recovery
Residential Capacity Estimate
 Residential Capacity Estimate Montgomery County Department of Park & Planning Research & Technology Center January 2005 Current plans allow 75,000 more housing units. by Matthew Greene, Research Planner
Chapter 5: Testing the Vision. Where is residential growth most likely to occur in the District? Chapter 5: Testing the Vision
 Chapter 5: Testing the Vision The East Anchorage Vision, and the subsequent strategies and actions set forth by the Plan are not merely conceptual. They are based on critical analyses that considered how
Charlottesville Housing Market Report Year-End (Published by the Charlottesville Area Association of REALTORS )
") Charlottesville Housing Market Report - 2009 Year-End (Published by the Charlottesville Area Association of REALTORS ) This Quarterly Market Report is produced by the Charlottesville Area Association of
Charlottesville Housing Market Report - 2009 Year-End (Published by the Charlottesville Area Association of REALTORS ) This Quarterly Market Report is produced by the Charlottesville Area Association of
Census Tract Data Analysis
 Data Analysis Study Area: s within the City of Evansville, Indiana Prepared For Mr. Kelley Coures City of Evansville Department of Metropolitan Development 1 NW MLK Jr. Boulevard Evansville, Indiana 47708
Comparative Housing Market Analysis: Minnetonka and Surrounding Communities
 Comparative Housing Market Analysis: Minnetonka and Surrounding Communities Prepared by Mark Huonder, Eric King, Katie Knoblauch, and Xiaoxu Tang Students in HSG 5464: Understanding Housing Assessment
Housing Characteristics
 CHAPTER 7 HOUSING The housing component of the comprehensive plan is intended to provide an analysis of housing conditions and need. This component contains a discussion of McCall s 1990 housing inventory
The Impact of Market Rate Vacancy Increases Eleven-Year Report
 The Impact of Market Rate Vacancy Increases Eleven-Year Report January 1, 1999 - December 31, 2009 Santa Monica Rent Control Board April 2010 TABLE OF CONTENTS Summary 1 Vacancy Decontrol s Effects on
Introduction. Charlotte Fagan, Skyler Larrimore, and Niko Martell
 Charlotte Fagan, Skyler Larrimore, and Niko Martell Introduction Powderhorn Park Neighborhood, located in central-southern Minneapolis, is one of the most economically and racially diverse neighborhoods
City of Exeter Housing Element
 D. Housing Stock Characteristics Government Code Section 65583(a) requires an analysis and documentation of household characteristics, including level of payment compared to ability to pay, housing characteristics,
OBSERVATION. TD Economics IS THE AMERICAN HOUSING REBOUND SUSTAINABLE?
 OBSERVATION TD Economics IS THE AMERICAN HOUSING REBOUND SUSTAINABLE? Highlights 2012 was a very good year for the U.S. housing market. Home prices were up almost 8% and housing starts by close to 30%.
An Overview of Iowa s Downtown Resource Center. Jim Thompson CMSM Business Specialist, Main Street Iowa
 An Overview of Iowa s Downtown Resource Center Jim Thompson CMSM Business Specialist, Main Street Iowa Downtown is a symbol of economic health of the community.and even a key element in industrial, commercial
Time for Retail to Take Stock
 Q1 2013 RETAIL LAS VEGAS NEVADA RESEARCH & FORECAST REPORT Time for Retail to Take Stock It is heartening to say, after five years of a bad economy, that the first quarter of 2013 s 119,649 square feet
Multifamily Market Commentary February 2017
 Multifamily Market Commentary February 2017 Affordable Multifamily Outlook Incremental Improvement Expected in 2017 We expect momentum in the overall multifamily sector to slow in 2017 due to elevated
Linden Hills and Fulton Neighborhoods Land Use Impact Study & Potential Sites for a Neighborhood Community Center/Gym Facility
 Linden Hills and Fulton Neighborhoods Land Use Impact Study & Potential Sites for a Neighborhood Community Center/Gym Facility Neighborhood Planning for Community Revitalization (NPCR) supported the work
Land Use. Land Use Categories. Chart 5.1. Nepeuskun Existing Land Use Inventory. Overview
 Land Use State Comprehensive Planning Requirements for this Chapter A compilation of objectives, policies, goals, maps and programs to guide the future development and redevelopment of public and private
HOUSING ELEMENT Inventory Analysis
 HOUSING ELEMENT Inventory Analysis 2.100 INVENTORY Age of Housing Stock Table 2.25 shows when Plantation's housing stock was constructed. The latest available data with this kind of breakdown is 2010.
State of Renters and Their Homes
 State of Renters and Their Homes As rents rose and renters incomes remained stagnant from to, many New Yorkers continued to face heavy rent burdens. In, roughly 30 percent of the city s renter households
1615 EDGEWATER DRIVE, SUITE 180 ORLANDO, FL T: /F: Memorandum
 1615 EDGEWATER DRIVE, SUITE 180 ORLANDO, FL 32804 T: 407-975-1273/F: 407-975-1278 Memorandum To: Erik Bredfeldt, Planning and Development Services Department Director CC: Scott Wright; Ralph Hilliard;
Stronger Office Market Looking Into Future
 Research & Forecast Report Long Island OFFICE MARKET Q2 2015 Stronger Office Market Looking Into Future Rose Liu Research & Financial Analyst Long Island Takeaways Class A & B Long Island economic and
In your opinion, what opportunities do you think should be considered in this process? (Describe up to 3)
") Working Group Meeting #1: Orientation June 21, 2014 (Comments updated 7.9.14) Thanks for your help and your ideas! In your opinion, what opportunities do you think should be considered in this process?
Working Group Meeting #1: Orientation June 21, 2014 (Comments updated 7.9.14) Thanks for your help and your ideas! In your opinion, what opportunities do you think should be considered in this process?
Community Workshop Public Comments January 14, 2015 #CantonForward
 Community Workshop Public Comments January 14, 2015 #CantonForward The following text documents raw, unedited comments and has not been checked for grammar, accuracy, or feasibility. Neither the consultant
How Severe is the Housing Shortage in Hong Kong?
 (Reprinted from HKCER Letters, Vol. 42, January, 1997) How Severe is the Housing Shortage in Hong Kong? Y.C. Richard Wong Introduction Rising property prices in Hong Kong have been of great public concern
 Department of Planning & Zoning 4200 Springdale Road Colerain Township, Ohio 45251 Staff Report: Prepared By: FINAL DEVELOPMENT PLAN MINOR AMENDMENT CASE #: ZA1998-01 PLANET FITNESS 9345 COLERAIN AVENUE
ARLA Members Survey of the Private Rented Sector
 Prepared for The Association of Residential Letting Agents & the ARLA Group of Buy to Let Mortgage Lenders ARLA Members Survey of the Private Rented Sector Fourth Quarter 2010 Prepared by: O M Carey Jones
2012 Profile of Home Buyers and Sellers New Jersey Report
 Prepared for: New Jersey Association of REALTORS Prepared by: Research Division December 2012 Table of Contents Introduction... 2 Highlights... 4 Conclusion... 7 Report Prepared by: Jessica Lautz 202-383-1155
HOUSING MARKET REPORT BERLIN 2018: NO END IN SIGHT TO PRICE UPTREND. - Asking rents for apartments rise 8.8 percent to 9.79 per sq m and month in 2017
 PRESS RELEASE HOUSING MARKET REPORT BERLIN 2018: NO END IN SIGHT TO PRICE UPTREND - Asking rents for apartments rise 8.8 percent to 9.79 per sq m and month in 2017 - Focus of new construction shifts from
ECONOMIC CURRENTS. Vol. 4, Issue 3. THE Introduction SOUTH FLORIDA ECONOMIC QUARTERLY
 ECONOMIC CURRENTS THE Introduction SOUTH FLORIDA ECONOMIC QUARTERLY Vol. 4, Issue 3 Economic Currents provides an overview of the South Florida regional economy. The report presents current employment,
research highlight Impact of the 2010 Winter Olympic Games on the Vancouver and Sea-to-Sky Housing Markets introduction Methodology
 research highlight November 2006 Socio-economic Series 06-022 Impact of the 2010 Winter Olympic Games on the Vancouver and Sea-to-Sky Housing Markets introduction Cities are increasingly using mega events
Oahu Report 1 st. Quarter March 2017
 Oahu Report 1 st. Quarter March 2017 Overall the best way to describe the Oahu S.F.H. Market is to tell you that it is Flat- Line. Unit Sales are barely up at +6%. New Listings are barely off at -6%. The
PART ONE - GENERAL INFORMATION
 Corrected Date: Page 7 Date of Submittal Changed to Coincide with Submittal Date on Page 5 PART ONE - GENERAL INFORMATION A. INTRODUCTION B. Background Miami Shores Village is soliciting responses to this
Dan Immergluck 1. October 12, 2015
 Examining Recent Declines in Low-Cost Rental Housing in Atlanta, Using American Community Survey Data from 2006-2010 to 2009-2013: Implications for Local Affordable Housing Policy Dan Immergluck 1 October
Appendix B. Density Definitions. Densification Definition and Concepts
 232 Revitalizing Places: Improving Housing and Neighborhoods from Block to Metropolis Appendix B Density Definitions Densification Definition and Concepts Density, at its most basic, is a measure of the
Housing and Homelessness. City of Vancouver September 2010
 Housing and Homelessness City of Vancouver September 2010 1 Table of Contents Overview Key Housing Issues Homelessness Rental Housing Affordable Home Ownership Key Considerations 2 OVERVIEW 3 Overview
One Host, One Home: New York City (February 2017 Update)
") One Host, One Home: New York City (February 2017 Update) Key Figures About Airbnb s NYC Community Today, we re releasing updated information about the Airbnb community in New York City. This covers the
One Host, One Home: New York City (February 2017 Update) Key Figures About Airbnb s NYC Community Today, we re releasing updated information about the Airbnb community in New York City. This covers the
ARCHITECTURE EDUCATION IN FINLAND
 Jaana Räsänen ARCHITECTURE EDUCATION IN FINLAND Architecture art and everyday experiences Combining the rational and the irrational, architecture is difficult to define. It is a common thought that architecture
Town Centre Community Improvement Plan
 2012 Town Centre Community Improvement Plan City of Greater Sudbury Growth and Development Department 1.0 PLAN BACKGROUND 1.1 Introduction The following Community Improvement Plan (CIP) has been prepared
City of Reno October 30, 2012 Draft Midtown Zoning Text Amendments 1
 Section 18.08.405 Regional Center and Transit Corridor Overlay Districts (i) SVTC South Virginia Street Transit Corridor Overlay Zoning District. (1) Applicability. This Section 18.08.405(l)'s standards
Washington Apartment Market Spring 2011
 Washington Apartment Market Spring 2011 Since 1996 the Washington Center for Real Estate Research (WCRER) at Washington State University has been providing valuable apartment market statistics for communities
Real Estate Technology
 The State of Real Estate Technology Commercial and multifamily real estate industries still rely on antiquated technology for critical business processes February 2018 Executive Summary In recent years,
CITY PLANNING COMMISSION CITY OF NEW ORLEANS EXECUTIVE DIRECTOR. City Planning Commission Staff Report. Executive Summary
 CITY PLANNING COMMISSION CITY OF NEW ORLEANS MITCHELL J. LANDRIEU MAYOR ROBERT D. RIVERS EXECUTIVE DIRECTOR LESLIE T. ALLEY DEPUTY DIRECTOR City Planning Commission Staff Report Zoning Docket 092/16 Executive
Damascus
 Damascus Flag Locations 1. Sitting on the roof of a building on the north side of the canal. 2. On the second floor of a building in the north east corner of the district. 3. Sitting in a boat on the west
Market Segmentation: The Omaha Condominium Market
 Market Segmentation: The Omaha Condominium Market Roger P. Sindt Steven Shultz University of Nebraska at Omaha Introduction A highly visible and growing niche in the homeownership market is the condominium
PLANNING COMMISSION REPORT Regular Agenda - Public Hearing Item
 Z-11-25-09; Z-11-26-09; Z-11-28-09 Item No. 2-1 PC Staff Report 3/28/11 PLANNING COMMISSION REPORT Regular Agenda - Public Hearing Item ITEM NO. 2A RM32 TO MU;.19 ACRES; 1340 TENNESSEE ST (MJL) Z-1-1-11:
Introduction. Sidney Ainkorn, Peter Mathison, and David Tomporowski. General History and Context. Geographic Context
 Sidney Ainkorn, Peter Mathison, and David Tomporowski Introduction General History and Context Geographic Context Richfield is a first-ring suburb, located just outside the city of Minneapolis (Map 1).
Analysis of Infill Development Potential Under the Green Line TOD Ordinance
 Analysis of Infill Development Potential Under the Green Line TOD Ordinance Prepared for the Los Angeles County Second Supervisorial District Office and the Department of Regional Planning Solimar Research
ECONOMIC COMMENTARY. Housing Recovery: How Far Have We Come? Daniel Hartley and Kyle Fee
 ECONOMIC COMMENTARY Number 13-11 October, 13 Housing Recovery: How Far Have We Come? Daniel Hartley and Kyle Fee Four years into the economic recovery, housing markets have fi nally started to improve.
We thank you for the opportunity to provide our services, and we look forward to discussing the report with you at your earliest convenience.
 565 East Swedesford Road, Suite 300 Wayne, PA 19087 Office: 610.995.0260 Fax: 888.502.5726 www.walkerparking.com Mr. Maury Stern Partner Road & Washington, LLC c/o Insight Property Group 4601 N Fairfax
Las Vegas Valley Executive Summary
 ARROYO MARKET SQUARE Las Vegas Valley Executive Summary Retail Market 4th Quarter 2013 THE DISTRICT AT GREEN VALLEY RANCH January 23, 2014 Re: Commercial Real Estate Survey: 4th Quarter, 2013 Dear Reader,
Route 6 Corridor Study Bristol Planning Commission Meeting #1. May 25, 2016 FITZGERALD & HALLIDAY, INC. Innovative Planning, Better Communities
 Route 6 Corridor Study Bristol Planning Commission Meeting #1 May 25, 2016 FITZGERALD & HALLIDAY, INC. Innovative Planning, Better Communities Today s Agenda 1. Introductions 2. Study overview Scope Schedule
Generic Environmental Impact Statement. Build-Out Analysis. City of Buffalo, New York. Prepared by:
 Generic Environmental Impact Statement Build-Out Analysis City of Buffalo, New York 2015 Prepared by: TABLE OF CONTENTS 1.0 INTRODUCTION 1 2.0 METHODOLOGY 2 3.0 EXISTING LAND USE 3 4.0 EXISTING ZONING
3 November rd QUARTER FNB SEGMENT HOUSE PRICE REVIEW. Affordability of housing
 3 November 2011 3 rd QUARTER FNB SEGMENT HOUSE PRICE REVIEW JOHN LOOS: HOUSEHOLD AND PROPERTY SECTOR STRATEGIST 011-6490125 John.loos@fnb.co.za EWALD KELLERMAN: PROPERTY MARKET ANALYST 011-6320021 ekellerman@fnb.co.za
TASK 2 INITIAL REVIEW AND ANALYSIS U.S. 301/GALL BOULEVARD CORRIDOR FORM-BASED CODE
 TASK 2 INITIAL REVIEW AND ANALYSIS U.S. 301/GALL BOULEVARD CORRIDOR FORM-BASED CODE INTRODUCTION Using the framework established by the U.S. 301/Gall Boulevard Corridor Regulating Plan (Regulating Plan),
RESIDENTIAL MARKET ANALYSIS
 RESIDENTIAL MARKET ANALYSIS The following market analysis is a two-part analysis that is designed to concentrate on the two types of residential development applicable to the subject. The first analysis
October 17, Proposal Due Date: Friday, November 10, 2017 by 4:00 pm
 Request for Proposal (RFP) For Housing Study and Needs Assessment Lamoille County Planning Commission (LCPC) Lamoille Housing Partnership (LHP) Stowe Land Trust (Identified below as The Contracting Partners
Briefing Book. State of the Housing Market Update San Francisco Mayor s Office of Housing and Community Development
 Briefing Book State of the Housing Market Update 2014 San Francisco Mayor s Office of Housing and Community Development August 2014 Table of Contents Project Background 2 Household Income Background and
The Coldwell Banker Carlson Real Estate Market Report
 The Coldwell Banker Carlson Real Estate Market Report 2017 Year-End Stowe Area Report Our 2017 Year-End Market Report uses market-wide data, based on transactions that closed in 2017 in the Multiple Listing
SUBSTITUTE ORDINANCE
 SUBSTITUTE ORDINANCE WHEREAS, the City of Chicago ("City") is a home rule unit of government by virtue of the provisions of the Constitution of the State of Illinois of 1970, and as such, may exercise
VALUE FINDING APPRAISAL REPORT
 RE 90 Rev. 01-2014 VALUE FINDING APPRAISAL REPORT (Compensation not to exceed $65,000) COUNTY John Doe 2880 Lancaster-Newark Rd. (SR 37), Pleasant Twp., 43030 Owner Mailing Address of Owner East side of
P o p u l a t i o n, L a n d U s e, a n d Z o n i n g
 P o p u l a t i o n, L a n d U s e, a n d Z o n i n g The Town of Upper Marlboro is located only 15 miles southeast of the District of Columbia, in the central portion of Prince George s County in the
st Quarter Market Report A Recipe That s Hard to Swallow
 2008 1 st Quarter Market Report A Recipe That s Hard to Swallow By Dave Phillips, CEO Charlottesville Area Association of REALTORS Have you ever stood in your kitchen, felt a creative surge and decided
Place Type Descriptions Vision 2037 Comprehensive Plan
 Place Type Descriptions Vision 2037 Comprehensive Plan The Vision 2037 Comprehensive Plan establishes a range of place types for Oxford, ranging from low intensity (limited development) Rural and Natural
Universal Periodic Review Canada
 Universal Periodic Review Canada Individual submission on behalf of: The Wellesley Institute Submitted by: Michael Shapcott, Director of Community Engagement The Wellesley Institute, 45 Charles Street
Washington Apartment Market Spring 2010
 Washington Apartment Market Spring 2010 Since 1996 the Washington Center for Real Estate Research (WCRER) at Washington State University has been providing valuable apartment market statistics for communities
RESEARCH BRIEF. Oct. 31, 2012 Volume 2, Issue 3
 RESEARCH BRIEF Oct. 31, 2012 Volume 2, Issue 3 PDR programs affect landowners conversion decision in Maryland PDR programs pay farmers to give up their right to convert their farmland to residential and
Planning and Development Department Building and Development Permit Summary Report
 Planning and Development Department 21 Building and Development Permit Summary Report February 22, 21 2 21 Building and Development Permit Summary Table of Contents Introduction... 3 Building Permits...
Appraisers and Assessors of Real Estate
 http://www.bls.gov/oco/ocos300.htm Appraisers and Assessors of Real Estate * Nature of the Work * Training, Other Qualifications, and Advancement * Employment * Job Outlook * Projections Data * Earnings
Market Report Summary 2006 Northwest Arkansas. Prepared By Judy Luna. Copyright 2007 Judy Luna
 Market Report Summary 26 Northwest Arkansas Prepared By Judy Luna Copyright 27 Judy Luna Northwest Arkansas Market Area For the purposes of this report, the Northwest Arkansas market area includes Washington
WESTERN SPECIALTY CONTRACTORS. Property Inspections. The Critical First Step
 WESTERN SPECIALTY CONTRACTORS Property Inspections The Critical First Step How to Use a Building Component Inventory to Provide Clients More Value Are you preparing to launch a new or revamped maintenance
Washington Apartment Market Fall 2009
 Washington Apartment Market Fall 2009 Since 1996 the Washington Center for Real Estate Research (WCRER) at Washington State University has been providing valuable apartment market statistics for communities
Coding For Places People Love Main Street Corridor District
 Coding For Places People Love Main Street Corridor District 1) Scope a) District boundaries are assigned according to the District Boundary Map. b) The Primary Retail Corridor is assigned according to
Approval of Amendment to City Code Chapter 34 (Zoning) Read Brodhead, Zoning Administrator of the City of Charlottesville
 Read Brodhead, Zoning Administrator of the City of Charlottesville") CITY OF CHARLOTTESVILLE, VIRGINIA CITY COUNCIL AGENDA Agenda Date: April 15, 2013 Action Required: Presenter: Staff Contacts: Approval of Amendment to City Code Chapter 34 (Zoning) Read Brodhead, Zoning
CITY OF CHARLOTTESVILLE, VIRGINIA CITY COUNCIL AGENDA Agenda Date: April 15, 2013 Action Required: Presenter: Staff Contacts: Approval of Amendment to City Code Chapter 34 (Zoning) Read Brodhead, Zoning
Residential October 2009
 Residential October 2009 Karl L. Guntermann Fred E. Taylor Professor of Real Estate Adam Nowak Research Associate Summary The latest data for July 2009 reveals that house prices declined by 28 percent
Technical Report 7.1 MODEL REPORT AND PARKING SCENARIOS. May 2016 PARKING MATTERS. Savannah GA Parking Concepts PARKING MATTERS
 Savannah GA Parking Concepts PARKING MATTERS A Strategic Plan for Parking + Mobility in Savannah PARKING MATTERS Technical Report 7.1 MODEL REPORT AND PARKING SCENARIOS Prepared for the Chatham County-Savannah
The survey also examines the underlying causes of FVM and impairment audit
 Acuitas, Inc. s Survey of Fair Value Audit April 20122 Executive Summary Public Company Accounting Oversight Board (PCAOB) inspections have noted a dramatic increase in the number of fair value measurement
Cycle Monitor Real Estate Market Cycles Third Quarter 2017 Analysis
 Cycle Monitor Real Estate Market Cycles Third Quarter 2017 Analysis Real Estate Physical Market Cycle Analysis of Five Property Types in 54 Metropolitan Statistical Areas (MSAs). Income-producing real
COMPARISON OF THE LONG-TERM COST OF SHELTER ALLOWANCES AND NON-PROFIT HOUSING
 COMPARISON OF THE LONG-TERM COST OF SHELTER ALLOWANCES AND NON-PROFIT HOUSING Prepared for The Fair Rental Policy Organization of Ontario By Clayton Research Associates Limited October, 1993 EXECUTIVE
Downtown Brampton and Queen Street Corridor: Residential and Commercial Projects
 Downtown Brampton and Queen Street Corridor: Residential and Commercial Projects What Makes a Great Downtown The economic and cultural vitality of the city depends on a robust downtown and central corridor.
Office Market Continues to Improve
 Research & Forecast Report LAS VEGAS OFFICE Q3 2016 Office Market Continues to Improve > > Southern Nevada s office market is improving at a steady rate > > Net absorption has been positive in twelve of
Soft Land Market in 2017
 Research & Forecast Report LAND Q4 217 Soft Land Market in 217 > > Land sales in 217 fell behind 216 > > A lack of large sales at Apex brought the average price per square foot up > > Strong development