Year-end report January December 2017 rikshem.se
|
|
|
- Lee Holt
- 5 years ago
- Views:
Transcription

1 rikshem.se Year-end report January December
2 The healthy profit after tax resulted from a favorable market, effective management, successful new builds and dedicated employees. Sophia Mattsson-Linnala, CEO Cover caption: Tuna Kristallen in Luleå

3 Contents Rikshem in summary... 4 Message from the CEO...5 Our properties...7 We re working for a sustainable society...10 Comments on the Group s earnings Comments on financial position,...14 Consolidated financial statements...18 Parent Company financial statements Key performance data...27 Definitions Property in Gränby, Uppsala
4 Year-end report Profit after tax for the year amounted to MSEK 2,430, which was in line with (2,433) despite a lower increase in the value of investment properties. The increase in value was MSEK 1,647 (1,962). Net operating income rose to MSEK 1,555 (1,420). Net operating income for existing properties rose by 6.7% (3.4). Rikshem acquired a large housing portfolio in Umeå during the year, but the acquisition rate declined year-on-year because of higher prices in the property market. In total, transaction operations resulted in net sales of MSEK 72. Profit after tax for the year combined with the lower acquisition rate led to a decrease in the loan-tovalue ratio to 59% (62) while the equity/assets ratio increased to 36% (33). During the year, Rikshem extended its average loan maturity to 3.0 years (1.9) and its average fixed-interest term to 5.3 years (2.6). Rikshem in summary Full year Full year 2015 Full year 2014 Full year Rental income, MSEK 2,665 2,484 2,040 1,691 Net operating income, MSEK 1,555 1,420 1, Income from management operations, MSEK 1,150 1, Profit after tax, MSEK 2,430 2,433 1,964 1,010 Fair value of properties, MSEK 41,039 37,878 32,009 25,160 Number of apartments 27,924 27,224 24,203 20,844 Lettable area, sqm 000s 2,219 2,182 1,975 1,708 Vacant residential properties, % Remaining average lease length** Loan-to-value ratio, % Interest-coverage ratio Equity 15,710 13,281 10,360 4,850 Total return, % Return on equity, % * Pertains to market vacancy for residential properties from 2015 to but total vacancy for full-year ** Pertains to properties for public use. Return on equity, % Total return, % Direct yield Change in value Average total return Rikshem Year-end report January December 4

5 Message from the CEO In 2007, Rikshem was characterized by the change process under way and by an increased focus on efficiency through quality-assured property management. Meanwhile, we continued to deliver excellent earnings. The healthy profit after tax resulted from a favorable market, effective management, successful new builds and dedicated employees. Market in flux From transaction-intensive and a high rate of new builds to a slowdown in the pace of construction, ownership apartments that were converted into rental apartments and uncertainty concerning possible legislative changes relating to tax on gains from properties sold in legal entities and about limitations on deductions for interest expenses. That is how I can summarize the year in the property market. With a core business in rental apartments, Rikshem hopes that the slowdown will lead to an increased focus among politicians on the role of rental apartments in society. It is important to act to create better prerequisites for building rental apartments. The municipalities focus on production of ownership apartments has made it more difficult to build rental apartments, in part because of the prices they demand for land. If prices decline in the market for ownership apartments, our potential to contribute with the production of rental apartments will increase. At the same time, there is a risk that coming limitations on interest expense deductions could have a negative impact on new production. Healthy total return Rikshem reported highly favorable profit after tax for the period of MSEK 2,430. For existing properties, net operating income increased significantly more than revenues, which is an indication of efficient cost control in the organization. Our financial position is strong and we significantly lengthened loan maturities and fixedinterest terms in. Vacancies are at a very low level and we noted a healthy total return of 8.1% for the year. It is gratifying to deliver profit after tax that gives us good opportunities to continue to develop residential properties that contribute to Sweden s growth and create attractive homes where people want to reside and live. Clear focus on growth districts The year was transaction-intensive with many small deals. Because we believe that market prices were high, we reduced the acquisition rate compared with. At the same time, the price level in the market meant that Rikshem was paid handsomely for the properties we divested. The divestments consisted of properties that we should not retain long term when we streamline the portfolio and clarify our focus on owning, managing and developing residential properties and large properties for public use in selected growth districts. In October, for example, we divested the portfolio in Haparanda, which was part of the acquisition of a larger property portfolio. After having taken possession of 800 apartments in Umeå in January, we completed a number of acquisitions during the year, primarily involving project properties.in Uppsala, for example, we acquired what will be the largest nursing home in the Nordic region. The year ended with the signing of purchase agreements for 257 apartments in Västerås, with possession to be taken in Expanded sustainability initiative To remain a strong company in the long term too, we continuously focus on sustainability work. In line with our efforts to develop safe and sustainable homes for those who live and work in our areas, we intensified cooperation with Läxhjälpen in the final quarter of the year. Pupils at three upper secondary schools in Norrköping will now be offered help with their homework so that they can improve their grades and create better potential for the future. We also continue to work with the Welcome Café in Fredriksdal, Helsingborg, which conducts integration work to break isolation and social exclusion, primarily for women who are at home during the day. Sophia Mattsson-Linnala Chief Executive Officer Rikshem Year-end report January December 5


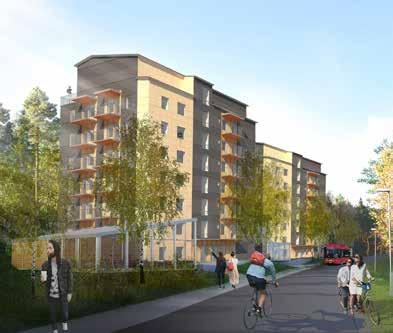
6 8.1 Total annualized return, % Klintbacken project, Luleå
7 Our properties Rikshem owns, develops and manages residential properties and properties for public use in selected municipalities in Sweden. Properties for public use are defined as properties for primarily nursing homes and schools, where the operations are funded by the public sector. An important prerequisite for future new production by Rikshem is to create development rights through the development of zoning plans. In addition to new production, property development includes extensions and upgrades of existing properties. The property-management organization identifies development opportunities for Rikshem to improve living environments. This could be a opportunity to build something new or to complement an existing building with appropriate premises for good neighborhood services. At year-end, Rikshem s property portfolio consisted of 586 properties (574) with a fair value of MSEK 41,039 (37,878). The property value is broken down into MSEK 28,942 of residential properties, MSEK 8,854 of nursing homes, MSEK 2,518 of schools and MSEK 725 of commercial premises. The property portfolio includes development rights of MSEK 738. Properties corresponding to MSEK 20,201, or 49%, are located in the Greater Stockholm Uppsala axis. The property portfolio comprises 27,924 apartments (27,224) and 2,219,000 square meters (2,182,000) of lettable area. Rikshem s property portfolio, Type Residential Value MSEK Proportion, % Area, 000 sqm Value SEK/sqm Annual rent MSEK Annual rent broken down by type of tenant Residential leases, % Public sector, % Private sector, % Total, % Residential 28, ,631 17,744 Commercial* ,916 Residential 29, ,646 17,818 1, Properties for public use Nursing homes 8, ,729 Schools 2, ,857 Commercial* ,760 Properties for public use 11, , Total 41, ,219 18,494 2, *Commercial premises for neighborhood services or areas of use for future residential properties or properties for public use. Breakdown of fair value of investment properties, % Breakdown of rental income, % Residential, 70% Nursing homes, 22% Schools, 6% Commercial, 2% Residential leases, 64% Public sector, 29% Private sector, 7% Rikshem Year-end report January December 7
8 Our largest cities Uppsala 25% Greater Stockholm 24% Helsingborg 11% Norrköping 7% Östersund 6% We are also active in: Umeå 5% Västerås 5% Kalmar 5% Luleå 5% Halmstad 3% Malmö 3% Jönköping <1% Linköping <1% Nyköping <1% Ale <1% Rikshem Year-end report January December 8
9 Our properties in figures 27,924 number of apartments (27,224) MSEK 41,039 in fair value of investment properties (37,878) 2,219,000 sqm of lettable area (2,182,000) 8.1 total annualized return, % (9.7) Rikshem Year-end report January December 9
10 Rikshem works for a sustainable society Rikshem wants its operations to be long-term sustainable from an environmental, social and financial perspective. We combine entrepreneurship with social involvement since we regard sustainability as a prerequisite for longterm profitability. We contribute to social development in the locations we serve, while working to ensure a minimal impact on the environment. Sustainability work is a feature throughout our operations. This continuously ongoing work includes: New builds Rikshem is the housing company in Sweden that builds most timber apartments. Timber is better for the environment compared with other common building materials. Energy consumption in Rikshem s new builds is 25% lower than what is stipulated in the Swedish Board of Housing Building and Planning s building regulations. We work for mixed forms of tenure in our areas as part of efforts to create sustainable living environments. Renovation Our repair, maintenance and upgrade work results in a more than 50% reduction in the property s energy use. We give tenants the option to choose the level of renovation to be able to influence their rent. Socially We give job experience to young people in our areas through our summer jobs program. Through the Läxhjälpen Foundation, we help young people in our areas to achieve better results at school. In cooperation with the municipalities we serve, we offer social-housing leases to people who find it difficult to get a normal housing contract. In addition Environmental certification of two housing projects by the Sweden Green Building Council is under way. Green bonds are issued to finance energy efficiency measures in repair, maintenance and upgrade projects and timber new builds. Sustainability efforts are under way on a daily basis During the period, for example, the following activities were implemented: We joined BoTryggt2030 which, on the basis of current research and tried-and-tested experiences, intends to disseminate knowledge about how to prevent crimes and increase safety/security through the design of physical space. 158 young people were hired during the summer to work with property upkeep. Increased support to the Läxhjälpen Foundation to make possible 20 new homework assistance places. Building start for 99 timber apartments in Luleå. Start up of the Business Improvement District collaboration in Valsta, Sigtuna, between public and private sector operators to develop and strengthen the area. Extension of the Welcome Café integration project in Fredriksdal, Helsingborg. Energy and environment The energy consumption of Rikshem s properties declined by 1.6% in. Annual emissions were reduced by 18,500 tons of carbon through reductions in energy consumption and eco-friendly energy sources. Rikshem Year-end report January December 10

11 Our owners Rikshem AB (publ) is owned 100% by Rikshem Intressenter AB, in which AMF Pensionsförsäkring AB and the Fourth AP Fund own 50% each. Our business concept We aim to be a long-term and sustainable owner, and develop and manage our residential properties and properties for public use. Our vision Our mission We make the difference in the development of the good society. We develop safe, secure and sustainable homes for those who live and work in our areas. We do this by combining entrepreneurship with social commitment.
12 Comments on Group earnings Net operating income The Group s rental income for the year increased by MSEK 181 to MSEK 2,665 (2,484), of which MSEK 87 derived from increased property holdings. Rental income for existing properties rose by MSEK 94 or 4.3% (3.7). The rent increase for existing properties mainly derived from investments that enable rents to be raised in the properties. At year-end, the vacancy rate for residential properties was 2.7%. Adjusted for apartments that have been vacated prior to renovation, the market vacancy rate was 0.3% (0.5). The average remaining lease term for properties for public use was 9.8 years (10.3). Increase in rental income for existing properties, % Total net operating income increased by 10% in relation to and amounted to MSEK 1,555 (1,420). Net operating income for existing properties rose by 6.7% (3.4). The increase in net operating income is a consequence of rental income increasing more than costs 4.3% compared with 1.2%.The surplus ratio for the total property holding was 58% (57). Increase in net operating income for existing properties, % Central administration The year s costs for central administration amounted to MSEK 62 (76). Leases on properties for public use Remaining lease term, years Proportion, % Property expenses increased by MSEK 46 to MSEK 1,110 (1,064), of which MSEK 35 derived from increased property holdings. Costs for existing properties rose by MSEK 11 or 1.2%. MSEK 216 of the property expense pertained to maintenance costs, corresponding to SEK 97 per square meter per year. Net financial items Net financial items amounted to MSEK -433 (-341). Interest expenses increased by MSEK 81 year-on-year. The increase was due in part to higher interest-bearing liabilities due to the expanded property holding and in part to the company having increased its fixed-rate and loan maturity period, which resulted in a higher average interest rate. Change in value, properties The change in value for investment properties was MSEK 1,647 (1,962), equal to growth of 4.3% (6.1). The change in value primarily derived from a decrease in the average capitalization rate during the year by 0.22 percentage points to 4.31%. Residential properties increased in value by MSEK 1,475, or 5.5%, and properties for public use by MSEK 172, or 1.6% Rikshem Year-end report January December 12
13 Geographically, most of the total change in value occurred in Uppsala, where value rose by close to 10%. One of the reasons for the increase in value in Uppsala was that Uppsala accounts for one fourth of the company s valueenhancing investments. Change in value, derivative instruments The change in value of financial derivatives amounted to MSEK 36 (-76). The derivative instruments were interestrate swaps and combined currency and interest-rate swaps, which were entered into to eliminate the exchange rate impact of loans raised in EUR and NOK. The change in exchange rates for EUR and NOK loans amounted to MSEK 115 (-39). Profit after tax for the year Profit after tax for the year has been charged with tax costs of MSEK 518 (622), primarily pertaining to deferred tax. Profit after tax for the year was MSEK 2,430 (2,433). Segment reporting Amounts in MSEK Residential Properties for public use Total Jan-Dec Jan Dec Jan-Dec Jan Dec Jan-Dec Jan Dec Rental income 1,907 1, ,665 2,484 Property expenses ,110-1,064 Net operating income 1, ,555 1,420 Change in value, properties 1,475 1, ,647 1,962 Total return 2,515 2, ,202 3,382 Fair value of properties 29,327 26,907 11,712 10,971 41,039 37,878 Proportion, % Area, 000 sqm 1,646 1, ,219 2,182 Fair value, SEK per sqm 17,818 16,570 20,436 19,669 18,494 17,362 Investments 1,369 1, ,586 1,849 Fair value, amounts in MSEK Rental income, amounts in MSEK Profit after tax for the period/year, amounts in MSEK Residential Properties for public use Residential Properties for public use Rikshem Year-end report January December 13
. The increased value resulted from investments in existing properties and value increases. The change in value was MSEK 1,647 (1,962), corresponding to growth of 4.3% (6.1).")

14 Comments on financial position Investment properties The fair value of investment properties increased during the year to MSEK 41,039 (37,878), which corresponds to SEK 18,494 per square meter (17,362). The increased value resulted from investments in existing properties and value increases. The change in value was MSEK 1,647 (1,962), corresponding to growth of 4.3% (6.1). The change in value reflects the change in the properties cash flows and in the capitalization rate. During the year, properties were acquired for MSEK 1,603 (3,549). The acquisition rate declined year-on-year because of increasingly higher prices in the property market. The acquisitions mainly occurred in Umeå and added 880 apartments and 75,000 square meters of lettable area to the property portfolio. In total, properties were sold for MSEK 1,675 (1,491), which exceeded their fair value at the start of the year, and investments during the year, by 3.0%. All of the sales were of the type of properties that Rikshem should not retain in the long term, when the company streamlines the holding and clarifies the focus on owning, managing and developing housing and large properties for public use in selected growth districts. Investments in existing properties during the year amounted to MSEK 1,586 (1,849), of which MSEK 943 (985) pertained to redevelopment and renovation of residential properties, MSEK 426 (528) to new builds of residential properties and MSEK 217 (336) to investments in properties for public use. On the balance sheet date, Rikshem had 56 (112) ownership apartments in proprietary production, of which five were unsold. Fair value of investment properties Amounts in MSEK Jan Dec Jan-Dec Fair value at the beginning of the period 37,878 32,009 Change in value 1,647 1,962 Investment 1,586 1,849 Acquisitions 1,603 3,549 Sales -1,675-1,491 Fair value at the end of the period 41,039 37,878 The Oskarström retirement home for the elderly is located in beautiful rural surroundings outside Halmstad. This is where Rikshem has redeveloped existing and built new properties to create a well-functioning retirement home that blends in with the environment. The retirement home was awarded the Architecture Prize of by the Halmstad Building Committee. In Umeå, Rikshem is developing 110 rental apartments and 32 ownership apartments in three buildings. The residential buildings are being constructed with timber frames in cooperation with Lindbäcks Bygg on the basis of Rikshem s designer house concept. One of the units will be eight stories high and will thus be the tallest timber building in northern Sweden. Rikshem Year-end report January December 14
15 Participations in associated companies Rikshem owns shares in associated companies with a total value of MSEK 1,356 (1,292). The largest holding of MSEK 880 pertains to 49% of VärmdöBostäder AB. The remaining part of VärmdöBostäder AB is owned by the Municipality of Värmdö. The second largest holding of MSEK 393 pertains to Farsta Stadsutveckling AB, where Rikshem and Ikano Bostad each hold 50%. Farsta Stadsutveckling AB owns the Burmanstorp 1 property in Farsta. This is where the development of the new city district Telestaden is under way, which will comprise 3,000 residential properties and premises for offices and neighborhood services. Other participations in associated companies totaling MSEK 83 pertain to development projects owned and operated together with Veidekke Bostad, P&E Fastighetspartner and Glommen & Lindberg. These associated companies had 80 ownership apartments in production on the balance sheet date (190), of which 44 were unsold. Rikshem s interests in these holdings amounted to 50%. Interest-bearing liabilities At year-end, interest-bearing liabilities amounted to MSEK 24,290 (23,422). Of these interest-bearing liabilities, MSEK 4,944 (5,582) pertained to liabilities to credit institutions, MSEK 3,715 (6,090) to borrowings through commercial papers and MSEK 15,363 (11,708) to bonds. In addition, the company had MSEK 268 (0) in current interest-bearing liabilities to related parties. The fair value of the interest-bearing liabilities essentially matches the carrying amount. At year-end, the average interest rate was 2.0% (1.5). The average fixed-interest term increased from 2.6 years at the beginning of the year to 5.3 years at year-end. The average loan maturity period increased from 1.9 years to 3.0 years. The refinancing and liquidity risks resulting from the maturity structure are managed by means of a backup facility and a subscription undertaking for commercial of papers from the owners a combined amount of SEK 10 billion and through backup facilities and unutilized overdraft facilities with various banks in a combined amount of SEK 3.2 billion (3.9). Cash and cash equivalents totaled MSEK 386 (320) at the end of the year. The loan-to-value ratio declined to 59% (62). Most of the financing carries variable interest based on 3 months STIBOR. Interest-rate derivatives are used to reduce the interest-rate risk resulting from the short fixed-interest term. At year-end, the interest-rate derivatives had a nominal value of MSEK 17,800 (14,800) and a fair value of MSEK -425 (-594). The company also has combined interest-rate and currency swaps with a fair value MSEK -85 (39). At year-end, the total fair value of derivative instruments was MSEK -510 (-581). Interest-rate derivatives, December 31, Nominal amount, SEK billion (end of the year) Average interest rate, % (end of the year) n/a All liabilities to credit institutions are secured by collateral in properties. In total, secured financing accounted for 12% (15) of the fair value of investment properties. Rikshem has a commercial paper program that represents an opportunity to issue commercial papers with maturities of up to 12 months subject to a limit of SEK 10 billion. Rikshem also has an MTN program listed on Nasdaq Stockholm and an EMTN program listed on the Irish Stock Exchange for the issuance of bonds. The MTN program has a limit of SEK 20 billion and the EMTN program a limit of EUR 2 billion. Neither the commercial papers nor the bonds are secured. Rikshem has issued four bonds in NOK and two bonds in EUR with a combined volume of SEK 5.4 billion. All other bonds are denominated in SEK. The interest coverage ratio for external funding during the year was 3.5 (3.8). Rikshem has a credit rating of A- with a stable outlook from S&P Global. Equity Comprehensive income totaling MSEK 2,429 increased the Group s equity to MSEK 15,710 (13,281). Profit after tax for the year in combination with the lower acquisition rate led to an increase in the equity/assets ratio to 36% (33). Rikshem Year-end report January December 15
16 Capital structure, December 31, Interest-bearing liabilities, December 31, Equity, 36% Interest-bearing, 56% Deferred tax, 6% Derivatives, 1% Bonds, 63% Commercial papers, 15% Bank loans, 21% Other, 1% Non-interest-bearing, 1% Financial key figures Equity/assets ratio, % Loan-to-value ratio, % Loan-to-value ratio, secured loans, % Short term share of debt, % Interest-coverage ratio Fixed-interest term, years Loan maturity, years Interest-bearing liabilities, December 31, Amounts in MSEK Fixed-interest term Loan maturity term, years amount proportion, % amount proportion, % , , , , , , , , , , , , Total 24, , Rikshem Year-end report January December 16


17 MSEK 1,586 Year s investments in existing properties Of the total, redevelopment and renovation accounted for MSEK 943, new production for MSEK 426 and investments in properties for public use for MSEK 217. Property at Häradsvägen, Knivsta
18 Group Condensed statement of comprehensive income Amounts in MSEK Oct-Dec Oct-Dec Jan Dec Jan-Dec Rental income ,665 2,484 Operating expenses Repairs and maintenance Property administration Property tax Total property expenses ,110-1,064 Net operating income ,555 1,420 Central administration Net financial items Earnings from shares in joint ventures of which, income from management operations of which change in value of properties of which change in value of derivative instruments of which, tax Income from management operations ,150 1,208 Change in fair value of investment properties ,647 1,962 Change in fair value of financial instruments Exchange rate fluctuation, loans in other currencies Profit before income tax 281 1,338 2,948 3,055 Tax Profit after tax for the period/year 186 1,040 2,430 2,433 Other comprehensive income Revaluation of pensions Income tax, pensions Other comprehensive income for the period/year, net after tax Total comprehensive income for the period/year 185 1,039 2,429 2,432 Rikshem Year-end report January December 18
19 Group Condensed statement of financial position Amounts in MSEK Dec 31 Dec 31 ASSETS Investment properties 41,039 37,878 Participation in joint ventures 1,356 1,292 Tangible non-current assets 6 8 Derivative instruments Financial assets Total non-current assets 42,660 39,448 Other current assets Cash and cash equivalents Total current assets TOTAL ASSETS 43,501 40,114 EQUITY AND LIABILITIES Equity 15,710 13,281 Deferred tax 2,365 1,892 Derivative instruments Interest-bearing liabilities 16,525 12,469 Non-interest-bearing liabilities 3 2 Total non-current liabilities 19,435 14,984 Interest-bearing liabilities 7,765 10,953 Non-interest-bearing liabilities Total current liabilities 8,356 11,849 TOTAL EQUITY AND LIABILITIES 43,501 40,114 Rikshem Year-end report January December 19
20 Consolidated statement of changes in equity Amounts in MSEK Share capital Other contributed capital Retained earnings including profit for the year Total equity Opening balance, Jan 1, 100 4,274 5,986 10,360 Profit for the year 2,433 2,433 Other comprehensive income -1-1 Group contributions, net Shareholder contributions Closing balance, 100 4,874 8,307 13,281 Opening balance, Jan 1, 100 4,874 8,307 13,281 Profit for the year 2,430 2,430 Other comprehensive income -1-1 Group contributions, net Shareholder contributions Closing balance, 100 4,874 10,736 15,710 Rikshem Year-end report January December 20
21 Consolidated statement of cash flows Amounts in MSEK Oct-Dec Oct-Dec Jan-Dec Jan-Dec Cash flow from operating activities ,496 1,347 Interest paid Tax paid Change in working capital Cash flow from operating activities ,034 1,492 Investment in investment properties ,586-1,849 Acquisition of investment properties ,603-3,549 Divestment of investment properties ,675 1,491 Investment in other tangible non-current assets Investment in financial assets Divestment of financial assets Cash flow from investing activities ,729-4,029 Loans raised 1,737 4,160 13,142 16,311 Amortization of loans -2,696-4,219-12,381-14,005 Shareholders contributions received Group contributions rendered Cash flow from financing activities ,763 Cash flow for the period/year -1, Cash and cash equivalents at the beginning of the period/year 1, Cash and cash equivalents at the end of the period/year After interest paid but before changes in working capital, full-year cash flow amounted to MSEK 1,063 (1,010). Rikshem Year-end report January December 21
22 Parent Company condensed statement of income Amounts in MSEK Oct-Dec Oct-Dec Jan Dec Jan-Dec Income Other operating expenses Personnel expenses Depreciation Operating profit Profit from participations in Group companies Net interest income Change in fair value of financial instruments Foreign exchange effects on financial liabilities Profit after financial items Appropriations Tax Profit after tax for the period/year Rikshem Year-end report January December 22
23 Parent Company s condensed balance sheet Amounts in MSEK ASSETS Equipment 6 8 Shares and participations in Group companies 1,967 1,890 Receivables from Group companies 26,201 24,729 Non-current receivables Total assets 28,228 26,797 Current assets Cash and cash equivalents Total current assets TOTAL ASSETS 28,889 27,237 EQUITY AND LIABILITIES Equity 7,133 7,026 Untaxed reserves 24 0 Deferred tax Derivative instruments 0 26 Interest-bearing liabilities 21,353 19,641 Non-interest-bearing liabilities Total liabilities 21,756 20,211 TOTAL EQUITY AND LIABILITIES 28,889 27,237 Rikshem Year-end report January December 23
24 Parent Company, Board of Directors and organization Parent Company The operations of the Parent Company Rikshem AB (publ) comprise Group-wide functions as well as the organization for managing properties owned by the subsidiaries. No properties are owned directly by the Parent Company. Board of Directors and organization The composition of the Board of Directors of Rikshem AB (publ) was changed at the Annual General Meeting when Per Uhlén was elected Member of the Board, replacing Ulrika Malmberg Livijn. The number of employees in the Rikshem Group at year-end was 206 (192) of whom, 90 were women. Risks Risks associated with income and assets The property sector is impacted by macroeconomic factors such as general economic development, the growth rate, employment, the level of production of new properties, infrastructure changes, population growth, inflation and interest rates. In a weaker macroeconomic situation, the value of properties could decline. The value of properties could also decline if access to funds and/or to equity declines in the property sector. The company s revenue consists of rent for leased residential properties and premises. Should the number of rented residential properties and leased premises decline, the company s revenue will decrease. Revenue could also decline if the payment capacity of the company s tenants is reduced, whereby they are unable to pay the rent. The company s costs for managing the property portfolio, and for operation and maintenance, are dependent on the general cost trend in Sweden. This applies particularly to electricity and heating costs. Financial risks Rikshem s interest-bearing liabilities result in liquidity, refinancing and interest-rate risk. Liquidity and refinancing risk is defined as the risk that when loans mature funding cannot be raised or can only be raised at significantly higher costs, and that payment obligations cannot be met due to insufficient liquidity. Interest-rate risk is the risk that increased market interest rates could lead to higher interest expenses. This could have adverse consequences on the company s operations, financial position and earnings. Rikshem s tax charges could change due to amended tax legislation. For additional information regarding risks, refer to Rikshem s annual report for. Accounting policies The consolidated financial statements for the Rikshem Group have been prepared in compliance with International Financial Reporting Standards (IFRS) and with the interpretations of the International Financial Reporting Interpretations Committee (IFRIC), as adopted by the European Union (EU). The Annual Accounts Act and RFR 1 Supplementary Accounting Rules for Groups have also been applied. This year-end report has been prepared according to IAS 34 Interim Financial Reports. Accounting policies and measurement methods are the same as those applied in the Annual Report. The Parent Company s accounting policies comply with the Annual Accounts Act and RFR 2. IFRS 9 Financial Instruments and IFRS 15 Revenue from Contracts with Customers will be applied as of January 1, Rikshem makes the assessment that these standards will not have a material impact on the company s income statement or balance sheet. When it comes to IFRS 15, the assessment is based on the Rikshem Year-end report January December 24
25 following. Rikshem provides residential properties and properties for public use primarily through leases under which, in addition to the right to use the leased home/ premises, the agreed rent usually also includes heat, water/sewage and refuse collection. Normally, the individual tenant is not permitted to enter into agreements with a supplier other than the ones contracted by the landlord. Should, due to climate variations, the consumption of, for example, heat end up higher than what has been calculated, the landlord Rikshem normally carries the risk and no additional payment from the tenant is required. In view of this, Rikshem considers that the entire rental payment should be viewed as rent also in accounting terms. Related-party transactions No significant related-party transactions were implemented during the year. Significant events after year-end No significant events occurred after year-end. The Board of Directors and the CEO affirm that this year-end report provides a true and fair view of the Parent Company s and the Group s operations, position and earnings, and describes the significant risks and uncertainties facing the Parent Company and the companies included in the Group. The company s auditors have not examined the year-end report. Financial calendar Annual Report March 29, 2018 Interim report Jan-Mar 2018 May 21, 2018 Half-year report Jan-Jun 2018 August 30, 2018 Interim report Jan-Sep 2018 November 12, 2018 rikshem.se On Rikshem s website, you will be able to download and subscribe to press releases and reports. Rikshem Year-end report January December 25

26
27 Key performance data Amounts in MSEK Risk capital Equity 15,710 13,281 10,360 4,850 3,705 2,247 Shareholder loans ,007 2,881 2,881 Risk-bearing capital 15,710 13,281 10,360 7,857 6,586 5,128 Total assets 43,501 40,114 34,053 26,036 20,210 16,302 Equity/assets ratio, % Share of risk-bearing capital, % Return on equity, % Financial key figures Loan-to-value ratio, secured loans, % Loan-to-value ratio, % Average interest rate, % Interest-coverage ratio, multiple Fixed-interest term, years Loan maturity, years Property-related key figures No. of properties Lettable area, 000 sqm 2,219 2,182 1,975 1,708 1,506 1,340 Proportion of properties for public use, % Number of apartments 27,924 27,224 24,203 20,844 19,541 17,617 Vacant residential properties, % Market vacancy rate, residential properties, % Remaining lease term for properties for public use, years Investment in properties 1,586 1,849 1, Fair value 41,039 37,878 32,009 25,160 20,009 16,153 Fair value, SEK/sqm 18,494 17,362 16,205 14,727 13,286 12,054 Total return, % Rikshem Year-end report January December 27
28 Key performance data Amounts in MSEK Performance-related key figures Rental income 2,665 2,484 2,040 1,691 1,485 1,277 Growth in revenue for existing properties, % Net operating income 1,555 1,420 1, Growth in net operating income for existing properties, % Surplus ratio, % Income from management operations 1,150 1, Profit for the period 2,430 2,433 1,964 1,010 1, Employees Number of employees of whom, women Rikshem Year-end report January December 28
29 Definitions Share of risk-bearing capital Return on equity Amount within parentheses Loan-to-value ratio Loan-to-value ratio, secured loans Direct yield Net operating income Property expenses Net financial items Income from management operations Rental income Loan maturity, years Market vacancy rate, residential properties Risk-bearing capital Fixed-interest term, years Interest-coverage ratio Equity/assets ratio Secured loans Total return Vacancy rate, residential properties Remaining lease term, properties for public use Surplus ratio Risk-bearing capital in relation to total assets. This is stated to illuminate the company s financial stability. Profit after tax for the year in relation to average equity. This is stated to illuminate the company s ability to generate a return on the capital invested by the shareholders. For income statement items, amounts within parentheses refer to the outcome for the corresponding year-earlier period and for balance sheet items, amounts within parentheses refer to the outcome at the end of the preceding year. Interest-bearing liabilities in relation to the fair value of properties. This is stated to illuminate the company s financial risk. Secured interest-bearing liabilities in relation to the fair value of properties. This is stated to illuminate the company s financial risk. Annualized net operating income in relation to the average fair value of properties. This is stated to illuminate the property investments ability to generate a return. Rental income less property expenses. Costs for heat, electricity, water, operation, maintenance, property tax, ground rent and property administration. Net of interest income, interest expenses and similar revenue and costs. Net operating income less administrative costs and net financial items plus profit/loss from shares in joint ventures. This is stated to illuminate the continuous earnings capacity of the business. Rental value less vacancies, rent discounts and rent losses. The weighted remaining maturity of interest-bearing liabilities on the balance sheet date. This is stated to illuminate the company s financial risk. As per the balance sheet date, the number of apartments less apartments unrented due to renovation in relation to the total number of apartments in the residential properties segment. Equity plus an increment for shareholder loans. The weighted remaining fixed-interest term for interest-bearing liabilities and derivative instruments on the balance sheet date. This is stated to illuminate the company s financial risk. Profit before tax following a reversal of profit/loss from shares in joint ventures, interest expense, change in the value of assets and liabilities and other financial expenses in relation to interest expenses for external borrowings. This is stated to illuminate the company s sensitivity to interest rate fluctuations. Equity in relation to total assets. This is stated to illuminate the company s financial stability. Loans raised against liens on properties. Net operating income plus change in value in relation to the average fair value of properties. This is stated to illuminate the property investments ability to generate a return. As per the balance sheet date, the number of unrented apartments in relation to the total number of apartments in the residential properties segment. The weighted remaining lease term on the balance sheet date in the properties for public use segment. Net operating income in relation to rental income. This is stated to illuminate the property investments continuous earnings capacity. The calculation of alternative performance measures is available on Rikshem s website. Rikshem Year-end report January December 29
30 Rikshem is one of Sweden s largest private property companies. We own, develop and manage residential properties and properties for public use in selected municipalities in Sweden, where we offer safe, pleasant and flexible housing in attractive locations. Rikshem is owned by the Fourth Swedish National Pension Fund (AP4) and AMF. Read more at rikshem.se Contact Switchboard: Rikshem AB (publ) Box 307, SE Stockholm rikshem.se rikshem.se
Six-month report January June 2018 rikshem.se
 rikshem.se Six-month report January June Six-month report Rental income increased 3 percent to MSEK 1,374 (1,335). Net operating income declined to MSEK 748 (758), mainly as a result of the harsh winter
Interim report January September 2018 rikshem.se
 rikshem.se Interim report January September Interim report Events during the period () Rental income increased MSEK 75 or 3.8 percent to MSEK 2,071 (1,996). Net operating income declined to MSEK 1,183
Year-end report January December 2018 rikshem.se
 rikshem.se Year-end report January December Year-end report Events during the year Profit for the year rose to MSEK 2,489 (2,430). Rental income increased MSEK 127 or 4.8 percent during the year to MSEK
Rental income, SEK million 1,071 1,014 4,122 4,109 Growth in rental income comparable properties, percent
 Akelius Residential Property AB (publ) year-end report January to December summary Oct Dec Oct Dec Jan Dec Jan Dec Rental income, SEK million 1,071 1,014 4,122 4,109 Growth in rental income comparable
Market update Q3 2017
 Market update Q3 2017 1 Rikshem in brief Total property value SEK 40.3 bn Portfolio comprising c. 600 properties with c. 28,000 apartments. Lettable area c. 2.2 million sqm Annual rental income 2016 was
Rental income, SEK million 1,016 1,040 3,051 3,095 4,109 Growth in rental income comparable properties, percent
 Akelius Residential Property AB (publ) interim report January to September summary Jul Sep Jul Sep Jan Sep Jan Sep Jan Dec Rental income, SEK million 1,016 1,040 3,051 3,095 4,109 Growth in rental income
Estancia Logistik AB (publ) Quarterly Report. July - September 2015
 Quarterly Report. July - September 2015") Estancia Logistik AB (publ) Quarterly Report July - September 2015 QUARTERLY REPORT Q3 2015 Focus on Vacancies July - September 2015 Quarter Rental income amounted to MSEK 40 (40). Operating profit totaled
Estancia Logistik AB (publ) Quarterly Report July - September 2015 QUARTERLY REPORT Q3 2015 Focus on Vacancies July - September 2015 Quarter Rental income amounted to MSEK 40 (40). Operating profit totaled
Estancia Logistik AB (publ) Quarterly Report. April - June 2015
 Quarterly Report. April - June 2015") Estancia Logistik AB (publ) Quarterly Report April - June 2015 QUARTERLY REPORT Q2 2015 Optimizing Management April - June 2015 Quarter Rental income amounted to MSEK 40 (43). Operating profit totaled
Estancia Logistik AB (publ) Quarterly Report April - June 2015 QUARTERLY REPORT Q2 2015 Optimizing Management April - June 2015 Quarter Rental income amounted to MSEK 40 (43). Operating profit totaled
Half-year report January-June 2016
 Half-year report January-June 2016 Summary, January-June 2016» Rental income amounted to SEK 1,070 million (SEK 989 million corresponding period preceding year).» Profit from property management amounted
Rental income, EUR million Like-for-like growth in rental income, percent
 Akelius Residential Property AB (publ) interim report January to June summary Apr Jun Apr Jun Jan Jun Jan Jun Jan Dec Rental income, EUR million 115 113 233 229 469 Like-for-like growth in rental income,
Telefonplan Stockholm Property AB (publ) REPORT FOR THE PERIOD January 1 December 31, 2015
 REPORT FOR THE PERIOD January 1 December 31, 2015") REPORT FOR THE PERIOD January 1 December 31, 2015 Image: View of Timotejen 19 Corp. Reg. No. 556708-3588 Telefonplan Stockholm Property AB (publ) REPORT FOR THE PERIOD January 1 December 31, 2015 JANUARY
REPORT FOR THE PERIOD January 1 December 31, 2015 Image: View of Timotejen 19 Corp. Reg. No. 556708-3588 Telefonplan Stockholm Property AB (publ) REPORT FOR THE PERIOD January 1 December 31, 2015 JANUARY
Rental income, EUR million Like-for-like growth in rental income, percent
 Akelius Residential Property AB (publ) year-end report January to December summary Oct Dec Oct Dec Jan Dec Jan Dec Rental income, EUR million 129 124 482 469 Like-for-like growth in rental income, percent
Rental income, EUR million Like-for-like growth in rental income, percent
 Akelius Residential Property AB (publ) interim report January to September summary Jul Sep Jul Sep Jan Sep Jan Sep Jan Dec Rental income, EUR million 120 116 353 345 469 Like-for-like growth in rental
Rental income, EUR million** Like-for-like growth in rental income, percent Net operating income, EUR million
 Akelius Residential Property AB (publ) interim report January to March summary* Jan Mar Jan Mar Jan Dec Rental income, EUR million** 119 116 469 Like-for-like growth in rental income, percent 3.7 5.4 5.1
INTERIM REPORT JANUARY MARCH 2016
 INTERIM REPORT JANUARY MARCH 2016 1 Strong start to the year JANUARY MARCH 2016 QUARTER Rental income amounted to MSEK 650 (589) Profit from property management totaled MSEK 340 (265), corresponding to
Year-end report January to December 2016
 Akelius Residential Property AB (publ) Year-end report January to December Growth for comparable properties 4.1 percent rental income 8.0 percent net operating income Change in property value 17 percent
Quarterly report
 Quarterly report 3 2017 2017-01-01 to 2017-09-30 Jefast Holding AB (publ), org nr 556721-2526 Third quarter Revenue inline with last year Portfolio value increase of 28.6% to 2,965 m (2,305) 2017 2016
AUDIOCAST PRESENTATION H1/2018
 AUDIOCAST PRESENTATION H1/2018 IRREPLACEABLE AND MULTI-FUNCTIONAL ASSETS IN GROWING CATCHMENTS 2 WE CONTINUE OUR TRANSFORMATION JOURNEY 2011 H1/2018 GOAL 2022 41 # OF SHOPPING # OF SHOPPING 78 30 CENTRES
AUDIOCAST PRESENTATION Q1/2018
 19.4.2018 AUDIOCAST PRESENTATION Q1/2018 HIGHLIGHTS Q1/2018 EPRA EARNINGS PER SHARE EUR 0.041 -Divestments in 2017 and weaker currencies impacted EPRA EPS -Efficient cost management with administrative
CONSOLIDATED STATEMENT OF INCOME
 CONSOLIDATED STATEMENT OF INCOME (unaudited, data converted from the Euro to the US Dollar (for information concerning this restatement, see Note 11 to these Consolidated Financial Statements)) 1 st quarter
Interim Report January March 2018
 Interim Report January March Many units in production with high sales rate 1 JANUARY 31 MARCH Net sales amounted to SEK 1,639 M (2,93) Operating profit was SEK 43 M (53), of which profit from land sales
Corporate Presentation Q SHH Bostad AB
 Corporate Presentation Q3 2018 SHH Bostad AB SHH in brief A residential developer offering affordable housing throughout Sweden 3 SHH in brief Introduction SHH Bostad AB (publ) (SHH), incorporated 2010,
Strong progress for Property Management
 Strong progress for Property Management Interim report January-June 2016 Stockholm, 18 August 2016 Anders Nissen, CEO Liia Nõu, CFO Forward-looking statements PANDOX EXCELLENCE IN HOTEL OWNERSHIP & OPERATIONS
Good underlying growth
 Good underlying growth Interim report January-March 2016 Stockholm, 3 May 2016 Anders Nissen, CEO Liia Nõu, CFO Agenda Introduction Financial review Market and business Q&A Anders Nissen Liia Nõu Anders
JM Group. Sweden. Norway. Finland. Belgium 3 % 19 % 78 % 0 % 12-month period 2) SEK 301 per share
 SEK 301 per share") Interimreport 2017 JM Group Revenue: SEK 16.7 billion Total assets: SEK 13.5 billion No. of building rights: 34,600 No. of employees: 2,538 Market Cap: SEK 21.3 billion 2) 19 % Norway 78 % Sweden 3 % Finland
Interimreport 2017 JM Group Revenue: SEK 16.7 billion Total assets: SEK 13.5 billion No. of building rights: 34,600 No. of employees: 2,538 Market Cap: SEK 21.3 billion 2) 19 % Norway 78 % Sweden 3 % Finland
Interim Report January June 2018
 Interim Report January June More housing units sold and good sales rate in ongoing production 1 APRIL 3 JUNE amounted to SEK 2,773 M (3,387) Operating profit was SEK 36 M (45), of which profit from land
DREAM GLOBAL ANNOUNCES FOURTH QUARTER RESULTS, 24% ANNUAL NET ASSET VALUE GROWTH AND OVER 6% FOURTH QUARTER COMPARATIVE NOI GROWTH
 DREAM GLOBAL ANNOUNCES FOURTH QUARTER RESULTS, 24% ANNUAL NET ASSET VALUE GROWTH AND OVER 6% FOURTH QUARTER COMPARATIVE NOI GROWTH TORONTO, FEBRUARY 20, 2019 DREAM GLOBAL REIT (TSX:DRG.UN, FRA:DRG) (or
Interim presentation. 24 April, Anders Nissen, CEO Liia Nõu, CFO
 Interim presentation 24 April, 2018 Anders Nissen, CEO Liia Nõu, CFO A stable earnings development 21% Return on equity 2 1 2 3 Profitable acquisitions Positive effects from product development A seasonally
Heiwa Real Estate Co., Ltd.
 To the Shareholders of Heiwa Real Estate Co., Ltd. INFORMATION DISCLOSED ON THE INTERNET UPON ISSUING NOTICE CONCERNING THE CONVOCATION OF THE 94th ORDINARY GENERAL SHAREHOLDERS MEETING THE 94th FISCAL
CONSOLIDATED STATEMENT OF INCOME
 CONSOLIDATED STATEMENT OF INCOME 1 st quarter (a) 2017 4 th quarter Sales 41,183 42,275 32,841 Excise taxes (5,090) (5,408) (5,319) Revenues from sales 36,093 36,867 27,522 Purchases, net of inventory
Board of Directors' Report on the Corporation's State of Affairs
 Board of Directors' Report on the Corporation's State of Affairs Brack Capital Properties NV (hereinafter: "the Company") hereby submits the Board of Directors' report for a period of six months ending
2018 Q3: TENANTS FIRST Putting the needs of our tenants at the centre of everything we do. 26 October 2018
 2018 Q3: TENANTS FIRST Putting the needs of our tenants at the centre of everything we do 26 October 2018 CONTENT 1 HIGHLIGHTS AND KEY FIGURES 2 NEW NAME 3 MARKET OVERVIEW 4 GENERAL COMPANY OVERVIEW 7
Interim presentation. 13 July, Anders Nissen, CEO Liia Nõu, CFO
 Interim presentation 13 July, 2018 Anders Nissen, CEO Liia Nõu, CFO Profitable growth 20% R12M Return on equity 2 1 2 3 Profitable acquisitions in new large markets Continued strong development in Brussels
Interim statement from the Board of Directors for the first quarter of 2015
 Regulated information - under embargo until 05/05/2015, 8 a.m. Antwerp, 5 May 2015 Interim statement from the Board of Directors Acquisition of a modern logistics site of approximately 52.000 m² in a prime
CONSOLIDATED FINANCIAL STATEMENTS
 CONSOLIDATED FINANCIAL STATEMENTS Dundee Real Estate Investment Trust Consolidated Balance Sheets (unaudited) June 30, December 31, (in thousands of dollars) Note 2004 2003 Assets Rental properties 3,4
Dream Global REIT 2018 Fourth Quarter 1
 EPRA Metrics The annual EPRA BPR Awards aim to recognize and commend upon the efforts of property companies that have successfully adopted the EPRA BPR Guidelines. Based on the assessment performed by
Net rental income increased by 25.36% to EUR million
 INTERIM STATEMENT OF THE BOARD OF DIRECTORS THIRD QUARTER 2018-2019 1 (closed on 31.12.2018) Net rental income increased by 25.36% to EUR 69.52 million EPRA Earnings 2 for the third quarter of financial
May 10, 2016 Halifax, Nova Scotia KILLAM APARTMENT REIT ANNOUNCES 20% INCREASE IN FFO PER UNIT IN Q1 2016
 May 10, 2016 Halifax, Nova Scotia KILLAM APARTMENT REIT ANNOUNCES 20% INCREASE IN FFO PER UNIT IN Q1 2016 Killam Apartment REIT (TSX: KMP.UN) ("Killam") is pleased to report its Q1 2016 results, including
Interim statement by the board of directors on the first quarter of 2018
 Regulated information - under embargo until 03/05/2018, 6 p.m. Antwerp, 3 May 2018 on the first quarter of 2018 Third logistics site in the Netherlands: agreement signed for the purchase of the site and
Extra Space Storage Inc. Reports 2017 Fourth Quarter and Year-End Results
 Extra Space Storage Inc. Reports 2017 Fourth Quarter and Year-End Results February 20, 2018 SALT LAKE CITY, Feb. 20, 2018 /PRNewswire/ -- Extra Space Storage Inc. (NYSE: EXR) (the "Company"), a leading
Extra Space Storage Inc. Reports 2018 Fourth Quarter and Year-End Results
 Extra Space Storage Inc. Reports 2018 Fourth Quarter and Year-End Results February 20, 2019 SALT LAKE CITY, Feb. 20, 2019 /PRNewswire/ -- Extra Space Storage Inc. (NYSE: EXR) (the "Company"), a leading
Zug Estates Group. Financial Year Tobias Achermann, CEO Gabriela Theus, CFO. March 11, 2016
 Zug Estates Group Financial Year 2015 Tobias Achermann, CEO Gabriela Theus, CFO March 11, 2016 2015 in a nutshell Gratifying result Operating income before depreciation and revaluation CHF 39.2 Mio. +4.0%
Economy. Denmark Market Report Q Weak economic growth. Annual real GDP growth
 Denmark Market Report Q 1 Economy Weak economic growth In 13, the economic growth in Denmark ended with a modest growth of. % after a weak fourth quarter with a decrease in the activity. So Denmark is
Year-end report January 1 December 31, 2015
 Year-end report January 1 December 31, Peter Wågström President and CEO NCC Ann-Sofie Danielsson Skånegatan, Gothenburg 1 Q4 in brief Orders received SEK 20.4 BN (18.5) Order backlog SEK 56.6 BN (54.8)
Public Storage Reports Results for the Quarter Ended March 31, 2017
 News Release Public Storage 701 Western Avenue Glendale, CA 91201-2349 www.publicstorage.com For Release Immediately Date April 26, 2017 Contact Clemente Teng (818) 244-8080, Ext. 1141 Public Storage Reports
PRIMARIS RETAIL REIT Announces Third Quarter Results
 PRIMARIS RETAIL REIT Announces Third Quarter Results Toronto (Ontario) November 8, 2011 Primaris Retail REIT (TSX:PMZ.UN) is pleased to report positive operating results for the third quarter of 2011.
SMARTCENTRES REAL ESTATE INVESTMENT TRUST RELEASES SECOND QUARTER RESULTS FOR 2018 AND ANNOUNCES DISTRIBUTION INCREASE
 SMARTCENTRES REAL ESTATE INVESTMENT TRUST RELEASES SECOND QUARTER RESULTS FOR 2018 AND ANNOUNCES DISTRIBUTION INCREASE TORONTO, ONTARIO - (August 9, 2018) SmartCentres Real Estate Investment Trust ("SmartCentres"
EN Official Journal of the European Union L 320/373
 29.11.2008 EN Official Journal of the European Union L 320/373 INTERNATIONAL FINANCIAL REPORTING STANDARD 3 Business combinations OBJECTIVE 1 The objective of this IFRS is to specify the financial reporting
Interim report presentation
 Interim report presentation 13 July, 2017 Anders Nissen, CEO Liia Nõu, CFO Forward-looking statements This presentation contains forwardlooking statements. Such statements are subject to risks and uncertainties
Q EPRA KEY METRICS
 Q1 EPRA KEY METRICS EPRA KEY METRICS The European Public Real Estate Association (EPRA) is a not-for-profit association based in Brussels that represents the interests of both listed real estate companies
ANNUAL REPORT 2017 Lake Country Co-operative Association Limited
 ANNUAL REPORT Management's Responsibility To the Members of Lake Country Co-operative Association Limited: Management is responsible for the preparation and presentation of the accompanying financial statements,
DAR AL ARKAN REAL ESTATE DEVELOPMENT COMPANY SAUDI JOINT STOCK COMPANY
 DAR AL ARKAN REAL ESTATE DEVELOPMENT COMPANY INTERIM CONSOLIDATED FINANCIAL STATEMENTS AND AUDITORS LIMITED REVIEW REPORT FOR THE NINE-MONTH PERIOD ENDED 30 SEPTEMBER INTERIM CONSOLIDATED FINANCIAL STATEMENTS
This document does not constitute an offer to sell or an invitation or solicitation of an offer to subscribe for or purchase any securities, and
 This document has been prepared by Atrium (the Company ). This document is not to be reproduced nor distributed, in whole or in part, by any person other than the Company. The Company takes no responsibility
Interim Report, H1 2016/17. Illustration: Amerika Have, residential property Copenhagen, Denmark
 Interim Report, H1 2016/17 Illustration: Amerika Have, residential property Copenhagen, Denmark Contents 1. The Group s results in H1 2016/17 Financial highlights and key ratios Segment results Handed-over
OPTIBASE LTD. ANNOUNCES THIRD QUARTER RESULTS
 Media Contacts: Amir Philips, CEO, Optibase Ltd. 011-972-73-7073-700 info@optibase-holdings.com Investor Relations Contact: Marybeth Csaby, for Optibase +1-917-664-3055 Marybeth.Csaby@gmail.com OPTIBASE
Investor. Investment Service Centre. Listed Companies Information. YANGTZEKIANG<00294> - Results Announcement
 Investor Investment Service Centre Listed Companies Information YANGTZEKIANG - Results Announcement Yangtzekiang Garment Limited announced on 16/12/2005: (stock code: 00294 ) Year end date: 31/03/2006
Front Yard Residential Corporation Reports Third Quarter 2018 Results
 Front Yard Residential Corporation Reports Third Quarter 2018 Results November 7, 2018 CHRISTIANSTED, U.S. Virgin Islands, Nov. 07, 2018 (GLOBE NEWSWIRE) -- Front Yard Residential Corporation ( Front Yard
IFRS - 3. Business Combinations. By:
 IFRS - 3 Business Combinations Objective 1. The purpose of this IFRS is to specify to disclose financial information by an entity when carrying out a business combination. In particular, specifies that
Consolidated Financial Statements of ECOTRUST CANADA. Year ended December 31, 2016
 Consolidated Financial Statements of ECOTRUST CANADA KPMG Enterprise TM Metro Tower I 4710 Kingsway, Suite 2400 Burnaby BC V5H 4M2 Canada Telephone (604) 527-3600 Fax (604) 527-3636 INDEPENDENT AUDITORS
EN Official Journal of the European Union L 320/323
 29.11.2008 EN Official Journal of the European Union L 320/323 INTERNATIONAL ACCOUNTING STANDARD 40 Investment property OBJECTIVE 1 The objective of this standard is to prescribe the accounting treatment
TULSA DEVELOPMENT AUTHORITY (A Component Unit of the City of Tulsa, Oklahoma) FINANCIAL REPORTS June 30, 2018 and 2017
 FINANCIAL REPORTS June 30, 2018 and 2017") FINANCIAL REPORTS June 30, 2018 and 2017 Index Page Independent Auditor s Report 1 Management s Discussion and Analysis 3 Basic Financial Statements: Statements of Net Position 9 Statements of Revenues,
FINANCIAL REPORTS June 30, 2018 and 2017 Index Page Independent Auditor s Report 1 Management s Discussion and Analysis 3 Basic Financial Statements: Statements of Net Position 9 Statements of Revenues,
Peab forms Brinova Fastigheter AB
 1 (5) Press release from Peab AB 13 February 2003 No. 3 Peab forms Brinova Fastigheter AB As previously announced, the board of Peab has decided to propose that the group s entire holding of managed properties
Interim report presentation
 Interim report presentation 10 November, 2017 Anders Nissen, CEO Liia Nõu, CFO Forward-looking statements This presentation contains forwardlooking statements. Such statements are subject to risks and
Senior Housing Properties Trust Announces Fourth Quarter and Year End 2017 Results
 Senior Housing Properties Trust NEWS RELEASE Senior Housing Properties Trust Announces Fourth Quarter and Year End 2017 Results 2/27/2018 NEWTON, Mass.--(BUSINESS WIRE)-- Senior Housing Properties Trust
WHITE PAPER ON FUNDS FROM OPERATIONS
 WHITE PAPER ON FUNDS FROM OPERATIONS FOR IFRS REVISED: SEPTEMBER 2010 Page 1 of 17 I. Introduction and Background TABLE OF CONTENTS II. III. IV. Intended use of FFO FFO Definition Discussion of FFO Definition
STRAWBERRY FIELDS REIT LTD. CONSOLIDATED FINANCIAL STATEMENTS AS OF DECEMBER 31, 2016
 . CONSOLIDATED FINANCIAL STATEMENTS AS OF DECEMBER 31, 2016 1 CONSOLIDATED FINANCIAL STATEMENTS AS OF DECEMBER 31, 2016 Contents Page Independent auditors' report 3 Consolidated Statements of Financial
UNITED STATES SECURITIES AND EXCHANGE COMMISSION Washington, D.C FORM 10-Q
 UNITED STATES SECURITIES AND EXCHANGE COMMISSION Washington, D.C. 20549 FORM 10-Q ý QUARTERLY REPORT PURSUANT TO SECTION 13 OR 15(d) OF THE SECURITIES EXCHANGE ACT OF 1934 For the Quarterly Period Ended
STRAWBERRY FIELDS REIT LTD. CONSOLIDATED FINANCIAL STATEMENTS AS OF DECEMBER 31, 2018
 . CONSOLIDATED FINANCIAL STATEMENTS AS OF DECEMBER 31, 2018 1 CONSOLIDATED FINANCIAL STATEMENTS AS OF DECEMBER 31, 2018 Contents Page Independent auditors' report 3 Consolidated Statements of Financial
Year-end report Peter Wågström President and CEO Ann-Sofie Danielsson Chief Financial Officer NCC AB 1
 Year-end report 2012 Peter Wågström President and CEO Ann-Sofie Danielsson Chief Financial Officer 2013-01-30 NCC AB 1 Q4 in brief Strong close resulted in successful year All business areas on par with
FOR IMMEDIATE RELEASE
 FOR IMMEDIATE RELEASE American Finance Trust Announces Second Quarter Operating Results New York, August 9, - American Finance Trust, Inc. (Nasdaq: AFIN) ( AFIN or the Company ), a real estate investment
Sponda Financial Results Q4 and FY February 2017
 Sponda Financial Results Q4 and FY 2016 3 February 2017 1. 2. 3. 4. Highlights for the Period Kari Inkinen Portfolio Development Pia Arrhenius Financials Niklas Nylander Business Environment and Business
Achieved record annual revenues of $110.0 million for 2018, representing an increase of 5.8%
 Clipper Realty Inc. Announces Fourth Quarter and Full-Year 2018 Results Reports Record Annual Revenues, Record Annual Income from Operations and Record Quarterly and Annual Adjusted Funds from Operations
Front Yard Residential Corporation Announces Transformative Acquisition and Reports Second Quarter 2018 Results
 Front Yard Residential Corporation Announces Transformative Acquisition and Reports Second Quarter 2018 Results August 9, 2018 CHRISTIANSTED, U.S. Virgin Islands, Aug. 09, 2018 (GLOBE NEWSWIRE) -- Front
Sekisui House, Ltd. Second Quarter of FY2017 (February 1, 2017 through July 31, 2017) Summary of Consolidated Financial Results. Management Direction
 Summary of Consolidated Financial Results. Management Direction") Sekisui House, Ltd. Second Quarter of (February 1, 2017 through July 31, 2017) Summary of Consolidated Financial 1. Overview 2. Financial Position 3. Segment Information Built to Order Supplied Housing
Sekisui House, Ltd. Second Quarter of (February 1, 2017 through July 31, 2017) Summary of Consolidated Financial 1. Overview 2. Financial Position 3. Segment Information Built to Order Supplied Housing
2018 Half-Year Results Ongoing developments to prepare for the future
 Press Release 2018/07/20 2018 Half-Year Results Ongoing developments to prepare for the future The Board of Directors of Société de la Tour Eiffel, which met on 20 July 2018, approved the financial statements
EDGEFRONT REALTY CORP. MANAGEMENT S DISCUSSION AND ANALYSIS For the three-month period ended March 31, 2013
 EDGEFRONT REALTY CORP. MANAGEMENT S DISCUSSION AND ANALYSIS For the three-month period ended March 31, 2013 May 30, 2013 MANAGEMENT S DISCUSSION AND ANALYSIS The following management s discussion and analysis
TABLE OF CONTENTS 100. INTRODUCTION
 TABLE OF CONTENTS 100. INTRODUCTION 101. REAL PROPERTY ASSOCIATION OF CANADA 102. THE ORIGINAL ACCOUNTING PRACTICES HANDBOOK 103. THE REALPAC IFRS HANDBOOK 103.1. PREPARATION 103.2. APPLICATION 103.3.
Tenant: Law Firm 4 NAICS: Primary Industry: Offices of lawyers
 Tenant: Law Firm 4 NAICS: 541110 Primary Industry: Offices of lawyers Date: 05.25.17 Table of Contents Law Firm 4 132 Main Street TABLE OF CONTENTS TIL Score Executive Summary Tenant Score Information
Investor Update Q results. Maëlys Castella October 22, 2015
 Investor Update Q3 2015 results Maëlys Castella October 22, 2015 Agenda Highlights Operational review Financial review Conclusion Questions 2 Q3 2015; Another quarter of improved performance Revenue million
EHLANZENI DISTRICT MUNICIPALITY ACCOUNTING POLICIES TO THE ANNUAL FINANCIAL STATEMENTS
 EHLANZENI DISTRICT MUNICIPALITY ACCOUNTING POLICIES TO THE ANNUAL FINANCIAL STATEMENTS 1. OBJECT TO THE POLICY The aim of the policy is to set accounting standards in line with good international financial
SECURITIES AND EXCHANGE COMMISSION. Washington, D.C FORM 8-K CURRENT REPORT
 SECURITIES AND EXCHANGE COMMISSION Washington, D.C. 20549 FORM 8-K CURRENT REPORT PURSUANT TO SECTION 13 OR 15(d) OF THE SECURITIES EXCHANGE ACT OF 1934 Date of Report (Date of earliest event reported):
National Real Estate Company. Earnings Presentation Q1 FY2014
 National Real Estate Company (Kuwait KSE: NRE) Earnings Presentation Q1 FY2014 May 28, 2014 1 Agenda 1. NREC Overview 3 2. Q1 FY2014 Summary 4 3. Financial Performance 5 4. Key Financial Ratios 7 5. Quarterly
FY18/12 Q2 PRESENTATION
 FY18/12 Q2 PRESENTATION RENESAS ELECTRONICS CORPORATION JULY 31, 2018 2018 Renesas Electronics Corporation. All rights reserved. FINANCIAL TARGETS AND STRATEGY Long-term Financial Targets *1 (Starting
Mountain Equipment Co-operative
 Mountain Equipment Co-operative Consolidated Financial Statements, and December 28, 2009 April 11, 2012 Independent Auditor s Report To the Members of Mountain Equipment Co-operative We have audited the
FOR IMMEDIATE RELEASE AUGUST 2, 2018 ARTIS REAL ESTATE INVESTMENT TRUST RELEASES SECOND QUARTER RESULTS
 FOR IMMEDIATE RELEASE AUGUST 2, 2018 ARTIS REAL ESTATE INVESTMENT TRUST RELEASES SECOND QUARTER RESULTS Today Artis Real Estate Investment Trust ( Artis or the "REIT") issued its financial results and
2016 Financial Supplement February 2017
 Safe Harbor Statement Forward-Looking Statements - Certain statements in this presentation regarding anticipated financial outcomes including Rayonier s earnings guidance, if any, business and market conditions,
PS Business Parks, Inc. Reports Results for the Quarter Ended September 30, 2018
 News Release PS Business Parks, Inc. 701 Western Avenue Glendale, CA 91201-2349 psbusinessparks.com For Release: Immediately Date: October 23, 2018 Contact: Jeff Hedges (818) 244-8080, Ext. 1649 PS Business
DCT INDUSTRIAL TRUST REPORTS FOURTH QUARTER AND FULL-YEAR 2017 RESULTS. Net Earnings of $0.22 per Diluted Share in Q4; $1.11 per Diluted Share in 2017
 Press Release FOR IMMEDIATE RELEASE: DCT INDUSTRIAL TRUST REPORTS FOURTH QUARTER AND FULL-YEAR 2017 RESULTS Net Earnings of $0.22 per Diluted Share in Q4; $1.11 per Diluted Share in 2017 FFO, as adjusted,
COMPARISON OF THE LONG-TERM COST OF SHELTER ALLOWANCES AND NON-PROFIT HOUSING
 COMPARISON OF THE LONG-TERM COST OF SHELTER ALLOWANCES AND NON-PROFIT HOUSING Prepared for The Fair Rental Policy Organization of Ontario By Clayton Research Associates Limited October, 1993 EXECUTIVE
Glendale, California - PS Business Parks, Inc. (AMEX: PSB), reported operating results for the fourth quarter and the year ending December 31, 2001.
, reported operating results for the fourth quarter and the year ending December 31, 2001.") News Release PS Business Parks, Inc. 701 Western Avenue P.O. Box 25050 Glendale, CA 91221-5050 www.psbusinessparks.com For Release: Immediately Date: January 30, 2002 Contact: Mr. Jack Corrigan (818) 244-8080,
News Release PS Business Parks, Inc. 701 Western Avenue P.O. Box 25050 Glendale, CA 91221-5050 www.psbusinessparks.com For Release: Immediately Date: January 30, 2002 Contact: Mr. Jack Corrigan (818) 244-8080,
SUNTEC REIT FINANCIAL RESULTS. For the 2 nd Quarter and Half Year ended 30 June 2017
 SUNTEC REIT FINANCIAL RESULTS For the 2 nd Quarter and Half Year ended 30 June 2017 26 July 2017 Agenda 03 2Q 17 Highlights 05 Financial Highlights 18 Office Portfolio Performance 25 Retail Portfolio Performance
Applying IFRS. Presentation and disclosure requirements of IFRS 16 Leases. November 2018
 Applying IFRS Presentation and disclosure requirements of IFRS 16 Leases November 2018 Contents 1. Overview 2 2. What is changing from current IFRS? 4 2.1 Presentation 4 2.2 Lessee disclosures 5 3. Presentation
NEWS RELEASE For immediate release
 NEWS RELEASE For immediate release Laura Clark 904 598 7831 LauraClark@RegencyCenters.com Regency Centers Reports Third Quarter 2018 Results Company Increases 2018 Guidance JACKSONVILLE, FL. (October 25,
Select Income REIT Announces Third Quarter 2017 Results
 FOR IMMEDIATE RELEASE Contact: Christopher Ranjitkar, Director, Investor Relations (617) 796-8320 Select Income REIT Announces Third Quarter 2017 Results Third Quarter Net Income of $0.35 Per Share Third
Q RESULTS 15 MAY 2018 TLG IMMOBILIEN AG Q RESULTS
 TLG IMMOBILIEN AG Q 208 RESULTS DISCLAIMER This presentation includes statements, estimates, opinions and projections with respect to anticipated future performance of TLG IMMOBILIEN ("Forward-Looking
Q Financial Supplement October 2018
 Safe Harbor Statement Forward-Looking Statements - Certain statements in this presentation regarding anticipated financial outcomes including Rayonier s earnings guidance, if any, business and market conditions,
NOTES TO THE CONSOLIDATED FINANCIAL STATEMENTS FOR THE FIRST NINE MONTHS OF 2017
 TOTAL NOTES TO THE CONSOLIDATED FINANCIAL STATEMENTS FOR THE FIRST NINE MONTHS OF 2017 (unaudited) 1) Accounting policies The interim consolidated financial statements of TOTAL S.A. and its subsidiaries
Interim announcement of the Board of Directors First quarter 2017 ending on 31 March 2017
 Interim announcement of the Board of Directors First quarter 2017 ending on 31 March 2017 Antwerp, Belgium Interim results for the period from 1 January 2017 until 31 March 2017 Net result increased to
Investor Presentation. First Quarter 2015
 Investor Presentation First Quarter 2015 1 CAUTIONARY STATEMENTS Today s session and our answers to questions contain statements that constitute forward-looking statements about expected future events
GOLDFIELD CORPORATION
 GOLDFIELD CORPORATION The Goldfield Corporation (Goldfield), incorporated in 1906, is engaged in electrical construction, including the placement of fiber optic cable and real estate development. The Company,