by Dr. Michael Sklarz and Dr. Norman Miller October 13, 2016 Introduction
|
|
|
- Oswald Holmes
- 5 years ago
- Views:
Transcription
1 by Dr. Michael Sklarz and Dr. Norman Miller October 13, 2016 Introduction The analysis of home price risk, default and foreclosure risk, usually occurs at the individual household level and considers value, credit, income and wealth at that same level. Without dismissing the value of such individualized analysis, the neighborhood within which each household resides exhibits considerable influence over price, the uncertainty behind value estimates of price, and foreclosure rates. Here we explore the ways we might add to value and risk analysis at the neighborhood level. A neighborhood can be thought of as a submarket located in a broader geographic area within which the typical buyer would search for alternatives to any given subject property. 1 Attributes that might be used to define a neighborhood for residential property include but are not limited to year built, living area or lot size, school district, postal carrier route, and other physical traits of the homes themselves. Postal carrier routes tend to handle physical differences in geography as natural walking barriers tend to be boundaries for neighborhoods. Appraisers and realtors define and use neighborhoods as the primary source from which comparable sales are selected. 2 Aside from value calculations, neighborhoods can provide an array of useful metrics for those concerned about both home price risk and mortgage default risk. We categorize the types of information that can be extracted from advanced neighborhood analysis in the following three dimensions: 1) Price and Attribute Dispersion In 1988 Haurin suggested a measurement for atypicality of a property relative to its neighborhood peers. 3 The general idea was to list out the frequency of property attributes and to compare a weighted measure of how well a subject property fit into that which is most typical in a neighborhood. This same idea can be extended in several ways. One approach is to simply look at the statistical dispersion of all properties within a neighborhood on the basis of physical attributes. In the appendix we provide a set of distributions of common physical attributes for all the houses in the United States. Naturally, these are not the standard against which any given property should be measured for judging the conformity with a given neighborhood. That requires a relative measurement. While this does not portend whether a subject property fits into an average neighborhood, it does provide some general notion as to what is normal for the aggregate US residential housing market. Distributions of property attributes will be illustrated below as one measure of homogeneity of a neighborhood. Our hypothesis is that neighborhoods with greater physical (age, size, features) attribute heterogeneity will also have greater price dispersion and value uncertainty. Price dispersion in relative terms is most relevant so we 1 See p. 17 of Real Estate Principles for the New Economy by Miller and Geltner, Cengage publishers, 2005 for an expanded discussion. The subject property is the one under analysis. 2 Collateral analytics has defined over 400,000 distinct residential neighborhoods. This compares to 43,000 5 digit zip codes not all with residential homes. There are on average 5 to 15 neighborhoods per ZIP Code. 3 See Haurin, 1988 at abstract. The Duration of Marketing Time of Residential Housing AREUEA Journal, 16: 4 pp
2 will most often use the percentage measure relative to the mean for any given attribute as a way to standardize the data, which is the Coefficient of Variation. RESEARCH Another approach is to look at the relative dispersion of sold prices within the neighborhood or the sold prices per square foot of living area. This would seem to be a more direct approach to judging homogeneity when standardized as a percent of mean prices. In the appendix we describe the sale prices of US single family homes over the past 12 months in A-1. The median sold price is less than $200,000 and while the distribution is wide, homes above $1,000,000 in value are a small percentage, even if they are the norm in many coastal neighborhoods. In A-2 we observe the median sale price per square foot is quite close to $100, while in the extreme $500 or more will be typical. The average home is less than 1900 square feet in size (A-3) and has 3 bedrooms (A-4), 2 baths (A-5) and sits on a lot of about 9500 square feet. The average age of homes (A-7) is around 40 years old, and we see broad systematic differences in age based on location. Less than 5% of all homes exceed 100 years in age. 2) Liquidity Risks There are several neighborhood metrics that directly reflect on liquidity risks, both for owners and lenders, should foreclosure be necessary. Among these are average time on the market (TOM). Another is months remaining inventory (MRI). Haurin (1988) postulated that atypical property would take longer to sell. We also know today that relatively higher priced property generally require much longer time on the market. One might surmise this is because of the thinness of such markets. Months remaining inventory provides another way to measure liquidity based on how many months would it take at recent prior sales rates to sell out the existing listings of properties. The higher MRI the less liquid a market. Very significant differences exist on both the TOM and MRI measures by neighborhood and should be factored into the riskiness of ownership or mortgage lending decisions. 3) Risk of Neighborhood Defaults and Contagion Properties all provide positive and negative externalities and these influence the property value of all properties within a given neighborhood in a joint and dynamic manner. One illustration of this is the impact of distressed sales on neighbors. After housing prices started to fall and defaults soared in 2007 and throughout the next few years, the question and analysis of distress sale contagion became a hot research topic. Harding, Rosenblatt and Yao were early contributors to this literature in They estimated the incremental price impact of nearby foreclosures, at the peak to be a discount of roughly 1% per nearby foreclosed property. Rauterkus, Miller, Thrall and Sklarz (2010) also found contagion affects as did Towe and Lawley (2013) among others. Towe and Lawley stated we find that a neighbor in foreclosure increases the hazard of additional defaults by 18 percent. Positive and negative externalities suggest that a house cannot escape the influences of what is going on around it and therefore the neighborhood price trends, neighbors investments in upgrades, maintenance and repairs, average property condition and willingness to walk or stay when under financial distress all impact the value estimate of every property. Ideally, such analysis is brought to bear on not only price trends but default trends as well. It is well established that higher leverage results in higher default risk and 4 John P. Harding, Eric Rosenblatt, and Vincent Yao, 2009, The Contagion Effect of Foreclosed Properties, Journal of Urban Economics, 22:3, pp
3 so one variable at the neighborhood level which is useful is the average loan to value (LTV) ratio. This can be calculated on current values or initial values when homes the homes were purchased. The distribution of LTVs might be even more important since half the homes might have no leverage and half might have 100% leverage and while the overall average is 50% LTV the risk of default is quite high on half the homes for the neighborhood. In this regard, Miller and Sklarz (2013) found that the percentage of homes with initial mortgages exceeding 90% of value were strong indicators of price trends, initially positive and then negative. More recently Griffin and Maturana (2016) found that easy credit ran home prices up faster and down faster in targeted neighborhoods. 5 For the US as a whole, approximately two thirds of all homes have mortgages. On these with mortgages the average LTV is quite high, over 80%. (A-8) What is a bit surprising is that 43% of the homes with mortgages, based on current values have LTVs equal to or exceeding 90%. (A-9) This could reflect the extensive refinancing and loan modifications that occurred in and the appeal of low rates. At the same time on average by neighborhood, only 5.5% of the homes have second mortgages (A-10) and this could reflect the fact that first mortgage LTVs are already high, (as of June 2016) and that underwriting for second mortgages has become more stringent since late One other factor that may reflect on neighborhood risk is the average property condition of homes. Collateral Analytics has been able to combine a number of data sources to assign a property condition rating on a meaningful number of homes throughout the United States. Based on a 1 to 6 scale with 1 as best and 6 as reflecting a very deteriorated property, we observe (A-11) that the vast majority of all properties are C2-C4. The percentage of C5 or C6 that could spell trouble for owners and lenders is under 5% as shown in A-12. Illustrations and Preliminary Analysis General price dispersion is very much a function of the homogeneity of the physical attributes of a neighborhood. Here we use sales from San Diego County neighborhoods from January 2015 through June of 2016 and we see the average home price has a standard deviation is 21% of the mean price. The general distribution of standard deviations as a percent of price are show below for several hundred neighborhoods. 5 See Did Dubious Mortgage Origination Practices Distort House Prices? by John M. Griffin and Gonzalo Maturana, 2016 (January 22) in The Review of Financial Studies.
4 Exhibit 1: San Diego Neighborhoods Price Dispersion 250 Home Price Std Dev as a percentage of the mean price in that same neighborhood, the average Std dev is 21% of the mean price for this sample in San Diego for January 2015 through June We should expect price dispersion to vary for different neighborhoods based on their homogeneity over a variety of attributes. Below we observe the distributions for hundreds of neighborhoods and later we will explore what is normal for the US and provide some illustrations for average neighborhoods, relatively lower priced and higher priced. Exhibit 2: San Diego Neighborhood Quartile Distributions from Exhibit 1 Quartile of Homogeneity Standard Deviation as % of Mean Price in Neighborhood Top 25% 12.5% Next 25% 17.5% Next 25% 27.0% Bottom 25% (Most heterogeneous) 34.0% One of the most telling attributes for measuring homogeneity is age. Here in Exhibit 3 we compare the age of two nearby neighborhoods, one fairly new, Carmel Valley and one much older, La Jolla, both in San Diego. The mean ages are different but the greater variance of the La Jolla homes compared to Carmel Valley is obvious.
5 < >= 1200 < >= 90 RESEARCH Exhibit 3: Age of Homes 250 Two Neighborhoods Compared by Age of Homes Sold in Prior Year: La Jolla and Carmel Valley, both in San Diego La Jolla Number of Sales Carmel Valley Using Exhibit 3 as an indicator of possible price dispersion, observe the prices per square foot for these same two neighborhoods expressed in dollar terms in Exhibit 4. Which one is the greater challenge for appraisers? It is obviously the older and more diverse housing neighborhood. In such diverse neighborhoods finding similar comparable property will be more of a challenge and therefore accurate appraisals will also be more difficult. Exhibit 4: Price Per Square Foot for Neighborhoods in Exhibit 3 Price Per Square Foot 2015 Sales in Two Neighborhoods La Jolla Carmel Valley
6 Frequency RESEARCH Several physical attributes can be used in combination or alone to describe the heterogeneity of a neighborhood. Generally, the degree of heterogeneity is correlated among several variables. That is, neighborhoods with greater dispersion by age also will have more dispersion by living area, number of bedrooms or baths or lot sizes. Below the frequency distributions are compared across several physical attributes for over 1500 neighborhoods. The dispersion of age is less than for other attributes as it is skewed further left. Lot size is skewed more to the right with a longer tail. In terms of which variables work best solo as a measure of homogeneity; age and age dispersion seem to hold the most promise. A preliminary test of price dispersion is described below along with some indications of neighborhood traits impacting foreclosure rates. Exhibit 5: Comparing the Distribution of Standard Deviations of Physical Attributes by Neighborhood Dispersion of Physical Attributes (Standard Dev %) by Neighborhood Std Dev % Age Std Dev % Liv Area Std Dev % Bed Std Dev % Baths Std Dev % Lot Size Std Dev % Physical attribute heterogeneity within a neighborhood are an indication of valuation uncertainty. Below in Exhibit 6 we have a sample of neighborhoods from Cincinnati, where average age varied from 18 years to 93 years, selected for a diversity of ages. Here the value confidence score is based on the estimate of value and being within 10% of the true value. What becomes apparent is that the less age dispersion in a given neighborhood, the lower will be appraisal error. It is simply harder to compare properties when ages vary and the condition of the interior is not always known. It is also generally harder to value older properties in the same neighborhood for the same reason. The condition of the interiors of comparable property used for valuation modeling is less certain.
7 Standard Deviation of Age RESEARCH Exhibit 6: Percentage Standard Deviation of Age Versus Valuation Confidence Range for a Sample of Neighborhoods in Cincinnati 0.7 Value Confidence Scores Versus % Standard Deviation Of Age By Neighborhood Value Confidence Level by Neighborhood What Drives Neighborhood AVM Confidence Levels? In a more formal test of AVM confidence scores by neighborhood, we found that turnover, age and age dispersion were all significant predictors of the forecast standard deviation of the value estimate and therefore of the confidence level. Turnover rate is an indicator of liquidity, measured by the number of homes selling each year as a percentage of the total stock. Age and age dispersion capture much of the physical heterogeneity. For a sample of nearly 11,000 neighborhoods we find the following results on a model with an adjusted R Squared of.363: Dependent Variable: Average Confidence Score Grouped by Neighborhood Independent Variable Coefficient T-Stat P>(t) Turnover Rate Age Mean Age Dispersion Cons We observe above that confidence scores vary positively with more turnover and negatively with higher average age and higher average age dispersion. The older the property the more likely we would find more variability in terms of property conditions as some properties have been maintained better than others. The greater the age dispersion the more variability we observe in general. One could interpret this as an indication of appraisal difficulty. Older neighborhoods or those built at different times and neighborhoods with less turnover are more challenging to value.
8 In the Appendix we show some spatial maps of San Diego, Orange County and the Bay Area that provide average neighborhood confidence scores. See A-13, A-14 and A-15 respectively. Note that unique and expensive neighborhoods filled with older custom homes tend to have the lowest confidence scores while more homogeneous neighborhoods with more turnover and less distress tend to have the highest scores. More Formal Tests Explaining Neighborhood Price Dispersion with the Addition of Debt Stress Indicators For 5419 neighborhoods we ran price dispersion, as measured by the standard deviation of price as the dependent variable against the following variables, with very significant results for most of the variables shown. The overall Adjusted R square is.377. Price dispersion is positively related to age dispersion and living area dispersion and higher use of debt reflected in higher LTVs. Price dispersion is negatively related to bedroom and bathroom dispersion, the use of second mortgages and the percent of homes with LTV above 90% and foreclosure rates. The use of 90% and higher mortgages is correlated with price and representative of the lower priced range neighborhoods. The use of second mortgages is more typical of homes with low first mortgage LTVs but not very common in Dependent Variable: Price dispersion Independent Variable Coefficient T-Stat P>(t) Age dispersion Baths dispersion Bed dispersion Living area dispersion Avg LTV Pct LTV> Pct_w_2 nd Mtge Foreclosure Rate To standardize and control for size, and to some extent price range, the same variables and neighborhoods were tested against the price dispersion observed per square foot, with the following results. The overall adjusted R Square is Now the coefficients results are as follows, with bedrooms falling out as insignificant. Not only do physical elements help explain price dispersion but leverage also seems to matter a great deal. This is an interesting result in that leverage is not a physical attribute, yet it is correlated with greater neighborhood price dispersion even when controlling for size. Independent Variable Coefficient T-Stat P>(t) Age dispersion Baths dispersion Bed dispersion Living area dispersion Avg LTV Pct LTV> Pct_w_2 nd Mtge Foreclosure Rate
9 Constant Liquidity Risk Illustrations Note that in Exhibit 7 below, the sweet spot in terms of liquidity seems to be similar in the $1.2 million price range for these high end neighborhoods, but at the lower end of the market in these neighborhoods we observe that homes below $600,000 are much less liquid in one neighborhood versus the other. In general, cheaper homes sell fast but there are exceptions, such as when such homes are atypical for the neighborhood and most of the value is simply land. Also note that this data is for homes that have sold. A better indicator of liquidity risk might be the Months of Remaining Inventory. In Exhibit 8 we show this for Carmel Valley. We see the Y axis only going to 20 months while in La Jolla (Exhibit 9) it goes to 40 months, or over three years. The time to sell a property in La Jolla is likely to be much longer even though the time on the market statistics do not look that different. Some unique homes take much longer to sell and in the $4 million to $4.2 million price range it might take three years to unload a property not deeply discounted. Exhibit 7: Time on the Market by Selected Neighborhood Time on the Market Versus Price Range for Two Neighborhoods La Jolla Carmel Valley
10 Exhibit 8: Months Remaining Inventory in Carmel Valley 20 Carmel Valley Months Remaining Inventory By Price Range Exhibit 9: Months Remaining Inventory in La Jolla La Jolla Months of Remaining Inventory by Price Range Time on the market and months remaining inventory are important indicators of neighborhood liquidity risk, should a lender need to foreclose and sell a home. These statistics do vary a great deal by neighborhood and price range within a neighborhood but can be analyzed and incorporated into liquidity risk considerations
11 ahead of time. To sell a home quickly, in say 30 to 60 days, in a neighborhood where 210 days is more typical will require a larger price discount than selling in a neighborhood where 120 days is typical or where there is less than 3 months of inventory typically on the market. Default Risks by Neighborhood Loan to value ratios matter in terms of default rates. There is an extensive literature on strategic or rational default. See for example, Guiso, Sapienza and Zingales (2013). The less equity the homeowners thinks they have the more likely they will walk away from a mortgage. But loan to value ratios, to be correctly calculated require some confidence in the valuation of the property. 6 There is also extensive literature on the stigma and propensity to default based on your neighbors (See M. Seiler ) and the contagion effect ( See Towe and Lawley, 2013 or Rauterkaus, Miller, Thrall and Sklarz 2010). Here we analyzed over 5400 neighborhoods over the past year for their propensity to observe foreclosures as a function of the attributes of the neighborhood. While age is correlated with more foreclosure it is not very significant. The dispersion of living area in each neighborhood is also slightly positively related to foreclosure, but it should be no surprise that the most significant impact on foreclosure is the average LTV of the neighborhood. Each percent of higher average LTV for neighborhood results in 2.23 times the average foreclosure rate. Second mortgages, perhaps because they are so sparse in 2016 did not impact foreclosure rates. Price dispersion, based on price per square foot, was fairly significant and correlated with foreclosure suggesting that neighborhoods with greater price dispersion also tended to be riskier for mortgage lenders. The overall adjusted R square was quite low at.034. Dependent Variable: Foreclosure Rate Independent Variable Coefficient T-Stat P>(t) Age dispersion Baths dispersion Bed dispersion Living area dispersion Avg LTV Pct LTV> Pct_w_2 nd Mtge PricePSF dispersion Constant We repeated the regression above without a constant, and got the following results. It seems that the sign on the percentage of loans in a neighborhood with 90% or higher LTV flipped and now suggests a higher foreclosure rate. The overall adjusted R square increased slightly to.067. At the same time, price dispersion shows up as more significant this time as an indicator of foreclosure rates along with average LTV and the 6 That is the subject of another paper by Sklarz and Miller. See
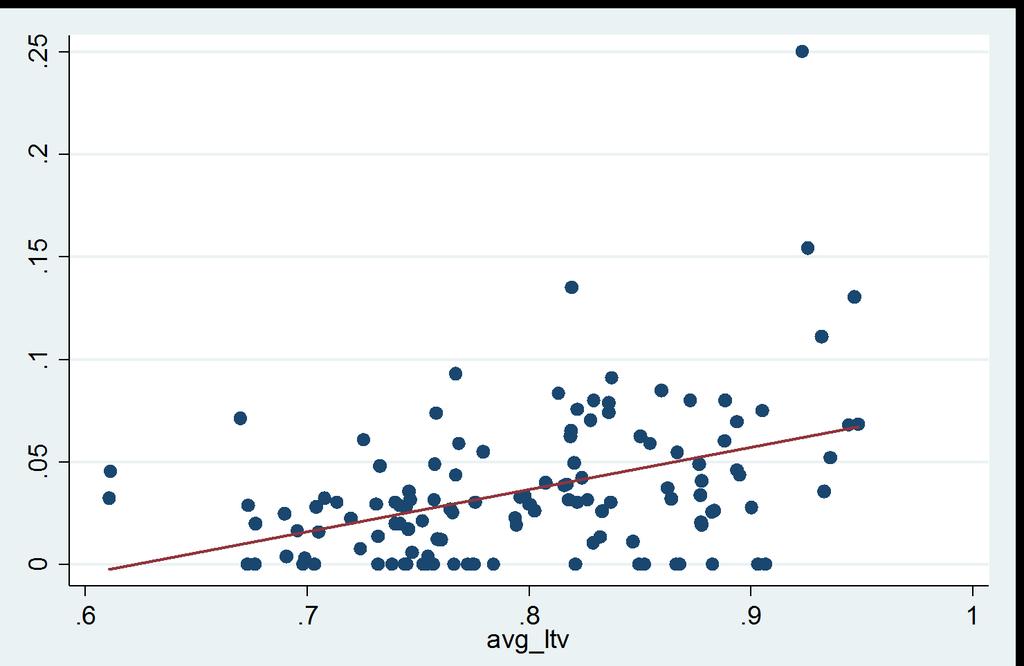
12 percentage of loans with LTVs above 90%. Second mortgages do not seem to matter but were scarce in this data set. Dependent Variable: Foreclosure Rate without a constant Independent Variable Coefficient T-Stat P>(t) Age dispersion Baths dispersion Bed dispersion Living area dispersion Avg LTV Pct LTV> Pct_w_2 nd Mtge PricePSF dispersion Below in Exhibit 10 we show foreclosure rates versus average LTVs in all the San Diego neighborhoods with both a linear fitted line and a curvilinear fitted line. It appears that the LTV of the neighborhood matters in explaining foreclosure rates. Neighborhoods with average LTVs above 90% appear to be significantly riskier than those where the average LTVs are below 80%. Exhibit 10: Foreclosure Rates in San Diego by Average LTV of Neighborhood with Linear and Polynomial Fitted Lines
13

14 Visualizations of Neighborhood Attributes Below in Exhibit 11 we show the average living area by neighborhood with color coding. Some neighborhoods are larger than others in less dense neighborhoods, but we observe small units in both the expensive per square foot inner city and in the least expensive suburban markets with small homes. The dark green are large homes and the orange or red are the smallest. Compare this to Exhibit 11 which shows the variance of the living area in percentage terms. Exhibit 11: San Diego Neighborhoods by Average Size of Living Area

15 Exhibit 12: San Diego Neighborhoods Standard Deviation of Size of Living Area Here the orange color shows the greatest variation of size and the dark green represents the most homogeneous neighborhoods by size. Naturally the lowest the variation in size the easier it is to appraise in such neighborhoods, especially when the ages are similar. Exhibits 11 and 12 are combined below in Exhibit 13. In which neighborhoods can higher confidence valuation occur? Below in Exhibit 12 we show the average coefficient of variation of the standard deviation of size over the average size of living area. Those neighborhoods with the dark green are the easiest to appraise as they are the least complex. Those neighborhoods with red or orange are the most complex showing the highest degree of variation.


16 Exhibit 13: San Diego Percentage Variation of Size by Neighborhood Exhibit 14: San Diego Average Loan to Value of Mortgages by Neighborhood Below we use only three simple groups for the average LTV as of June 2016, the dark green dots represent LTVs of 10% to 80%, the yellow dots represent 80% to 90% LTV and the red dots represent those neighborhoods where the LTV remains above 90%. Here clear patterns are obvious.
17 Conclusions Neighborhoods can be analyzed from the perspective of complexity or heterogeneity. Neighborhoods with more percentage variation by age or size tend to be more difficult to value. Neighborhoods also exhibit patterns with respect to the average time required to liquidate property should that be necessary and these patterns systematically vary by neighborhood and price levels within each neighborhood. Last, foreclosure rates tend to be higher in neighborhoods with a propensity for more debt as a percentage of value, and the literature suggests that contagion is a real risk. It is not just the loan to value ratio of an individual household that matters but the neighbors as well, in any thorough analysis of risk. References Harding, John P. Eric Rosenblatt, and Vincent Yao, 2009, The Contagion Effect of Foreclosed Properties, Journal of Urban Economics, 22:3, pp Haurin, Donald, 1988, The Duration of Marketing Time of Residential Housing AREUEA Journal, 16: 4 pp Towe, Charles and Chad Lawley, The Contagion Effect of Neighboring Foreclosures (2013) American Economic Journal, 5:2, pp Rauterkus, Stephanie, Norm Miller, Grant Thrall and Michael Sklarz, 2010, Foreclosure Contagion and REO Versus Non-REO Sales International Real Estate Review 15:3, pp Miller, Norman G. and Michael Sklarz, 2013, Integrating Real Estate Market Conditions Into Home Price Forecasting Systems Journal of Housing Research, 21:2. pp Guiso, L., P. Sapienza and L. Zingales, The Determinants of Attitudes Toward Strategic Default on Mortgages 2013, Journal of Finance, 68: 4, pp
18 Appendix What is normal for the distributions of prices and physical attributes in the United States. Below is a set of Exhibits depicting several physical attributes for US homes. The data and analysis here is by Collateral Analytics. Exhibit A-1 Median Sold Prices as of June 2016 Percent SALE_PRICE_HV_MEDIAN Exhibit A-2: US Median Neighborhood Price/Living Area in Square Feet as of June 2016 Percent PPSF_HV_MEDIAN
19 Exhibit A-3: US Neighborhood Mean Living Area Size in Square Feet as of June Percent LIVING_MEAN Exhibit A-4: US Neighborhood Mean Bedroom Count Distribution Percent BEDRMS_MEAN
20 Exhibit A-5 US Neighborhood Mean Bath Count Distribution Percent BATH_MEAN Exhibit A-6: US Neighborhood Mean Lot Area Distribution in Square Feet Percent LOTSIZE_MEAN

21 Exhibit A-7: US Neighborhood Age (From Year Built) Distribution as of June 2016 Percent AGE_MEAN Exhibit A-8: US Single Family Home Distribution of Average LTV as of June 2016 for those with Mortgages based on current valuations

22 Exhibit A-9: US Neighborhoods Percentage of Homes with 90% or higher LTVs as of June 2016 RESEARCH Exhibit A-10: US Neighborhood Percentage of Homes with a Second Mortgage as of June 2016


23 Exhibit A-11: US Single Family Property Condition Distribution as of June 2016 Exhibit A-12: US Homes with Property Condition of 5 or 6 as of June 2016

24 Exhibit A-13: Average CA Value AVM Confidence Scores in 2016 by Neighborhood for San Diego Darker green areas are those with high confidence, above 90%, light green areas are 81% to 90% and light orange is 71-80%, while red is below 70%

25 Exhibit A-14: Average CA Value AVM Confidence Scores in 2016 by Neighborhood for Orange County Darker green areas are those with high confidence, above 90%, light green areas are 81% to 90% and light orange is 71-80%, while red is below 70%

26 Exhibit A-15: Average CA Value AVM Confidence Scores in 2016 by Neighborhood for the Bay Area Darker green areas are those with high confidence, above 90%, light green areas are 81% to 90% and light orange is 71-80%, while red is below 70%
*Predicted median absolute deviation of a CASA value estimate from the sale price
 PLATINUMdata Premier AVM Products ACA The AVM offers lenders a concise one-page summary of a property s current estimated value, complete with five recent comparable sales, neighborhood value data, homeowner
REDSTONE. Regression Fundamentals.
 REDSTONE from Bradford Advanced Analytics Technologies for Appraisers Regression Fundamentals www.bradfordsoftware.com/redstone Bradford Technologies, Inc. 302 Piercy Road San Jose, CA 95138 800-622-8727
Chapter 13. The Market Approach to Value
 Chapter 13 The Market Approach to Value 11/22/2005 FIN4777 - Special Topics in Real Estate - Professor Rui Yao 1 Introduction Definition: An approach to estimating market value of a subject property by
AVM Validation. Evaluating AVM performance
 AVM Validation Evaluating AVM performance The responsible use of Automated Valuation Models in any application begins with a thorough understanding of the models performance in absolute and relative terms.
Foreclosure Contagion and REO Versus Non- REO Sales
 1 Foreclosure Contagion and REO versus non-reo Sales INTERNATIONAL REAL ESTATE REVIEW 2011 Vol. XX No. XX: pp. XX XX Foreclosure Contagion and REO Versus Non- REO Sales Stephanie Y. Rauterkus 1 Assistant
How Did Foreclosures Affect Property Values in Georgia School Districts?
 Tulane Economics Working Paper Series How Did Foreclosures Affect Property Values in Georgia School Districts? James Alm Department of Economics Tulane University New Orleans, LA jalm@tulane.edu Robert
Current State and Direction of the Housing and Mortgage Markets From a Micro Market Metric Perspective. Nov. 23, 2009 for UC Berkeley Outlook
 And Current State and Direction of the Housing and Mortgage Markets From a Micro Market Metric Perspective By Norm Miller Ph.D. Burnham Moores Center for Real Estate, University of San Diego and Michael
James Alm, Robert D. Buschman, and David L. Sjoquist In the wake of the housing market collapse
 istockphoto.com How Do Foreclosures Affect Property Values and Property Taxes? James Alm, Robert D. Buschman, and David L. Sjoquist In the wake of the housing market collapse and the Great Recession which
by Dr. Michael Sklarz and Dr. Norman Miller August 1st, 2017
 by Dr. Michael Sklarz and Dr. Norman Miller August 1st, 2017 Abstract Here we examine the price differentials for homes sold through traditional agents through the multiple listing service compared to
Technical Description of the Freddie Mac House Price Index
 Technical Description of the Freddie Mac House Price Index 1. Introduction Freddie Mac publishes the monthly index values of the Freddie Mac House Price Index (FMHPI SM ) each quarter. Index values are
The Impact of Using. Market-Value to Replacement-Cost. Ratios on Housing Insurance in Toledo Neighborhoods
 The Impact of Using Market-Value to Replacement-Cost Ratios on Housing Insurance in Toledo Neighborhoods February 12, 1999 Urban Affairs Center The University of Toledo Toledo, OH 43606-3390 Prepared by
The Residential Market: Impact of Current Conditions on Valuation
 Date: August 22, 2012 Time: 12 p.m. CST Duration: 120 minutes The Residential Market: Impact of Current Conditions on Valuation Presenters: Norm Miller Michael Sklarz Professor of Real Estate President
Susanne E. Cannon Department of Real Estate DePaul University. Rebel A. Cole Departments of Finance and Real Estate DePaul University
 Susanne E. Cannon Department of Real Estate DePaul University Rebel A. Cole Departments of Finance and Real Estate DePaul University 2011 Annual Meeting of the Real Estate Research Institute DePaul University,
Cook County Assessor s Office: 2019 North Triad Assessment. Norwood Park Residential Assessment Narrative March 11, 2019
 Cook County Assessor s Office: 2019 North Triad Assessment Norwood Park Residential Assessment Narrative March 11, 2019 1 Norwood Park Residential Properties Executive Summary This is the current CCAO
IREDELL COUNTY 2015 APPRAISAL MANUAL
 STATISTICS AND THE APPRAISAL PROCESS INTRODUCTION Statistics offer a way for the appraiser to qualify many of the heretofore qualitative decisions which he has been forced to use in assigning values. In
The Corner House and Relative Property Values
 23 March 2014 The Corner House and Relative Property Values An Empirical Study in Durham s Hope Valley Nathaniel Keating Econ 345: Urban Economics Professor Becker 2 ABSTRACT This paper analyzes the effect
86 years in the making Caspar G Haas 1922 Sales Prices as a Basis for Estimating Farmland Value
 2 Our Journey Begins 86 years in the making Caspar G Haas 1922 Sales Prices as a Basis for Estimating Farmland Value Starting at the beginning. Mass Appraisal and Single Property Appraisal Appraisal
Evaluation of Vertical Equity in Residential Property Assessments in the Lake Oswego and West Linn Areas
 Portland State University PDXScholar Center for Urban Studies Publications and Reports Center for Urban Studies 2-1988 Evaluation of Vertical Equity in Residential Property Assessments in the Lake Oswego
Can the coinsurance effect explain the diversification discount?
 Can the coinsurance effect explain the diversification discount? ABSTRACT Rong Guo Columbus State University Mansi and Reeb (2002) document that the coinsurance effect can fully explain the diversification
The Effect of Relative Size on Housing Values in Durham
 TheEffectofRelativeSizeonHousingValuesinDurham 1 The Effect of Relative Size on Housing Values in Durham Durham Research Paper Michael Ni TheEffectofRelativeSizeonHousingValuesinDurham 2 Introduction Real
Effect of Foreclosures on Nearby Property Values. The effect of real estate foreclosures on nearby property values is well studied by
 Nicholas Wiegardt March 2015 Effect of Foreclosures on Nearby Property Values Abstract The effect of real estate foreclosures on nearby property values is well studied by economists. In fact, this effect
Contents. off the fence. It s a good life!
 I hope you enjoy the latest edition of Brian Buffini s Real Estate Report. The goal of this piece is to help you stay educated on today s market and position yourself as a true professional and your clients
CABARRUS COUNTY 2016 APPRAISAL MANUAL
 STATISTICS AND THE APPRAISAL PROCESS PREFACE Like many of the technical aspects of appraising, such as income valuation, you have to work with and use statistics before you can really begin to understand
Efficiency in the California Real Estate Labor Market
 American Journal of Economics and Business Administration 3 (4): 589-595, 2011 ISSN 1945-5488 2011 Science Publications Efficiency in the California Real Estate Labor Market Dirk Yandell School of Business
Initial sales ratio to determine the current overall level of value. Number of sales vacant and improved, by neighborhood.
 Introduction The International Association of Assessing Officers (IAAO) defines the market approach: In its broadest use, it might denote any valuation procedure intended to produce an estimate of market
The purpose of the appraisal was to determine the value of this six that is located in the Town of St. Mary s.
 The purpose of the appraisal was to determine the value of this six that is located in the Town of St. Mary s. The subject property was originally acquired by Michael and Bonnie Etta Mattiussi in August
Trend (span) Last 4-6 Months (3-month period)
 Last 4-6 Months (3-month period)") Local Market Conditions: Summary The Local Market Conditions tables summarize trends and statistics in the local market: the area around the subject property that was searched for comps in the Sales Comparison
Local Market Conditions: Summary The Local Market Conditions tables summarize trends and statistics in the local market: the area around the subject property that was searched for comps in the Sales Comparison
Description of IHS Hedonic Data Set and Model Developed for PUMA Area Price Index
 MAY 2015 Description of IHS Hedonic Data Set and Model Developed for PUMA Area Price Index Introduction Understanding and measuring house price trends in small geographic areas has been one of the most
OVERVIEW OF RECENT/EXPECTED ECONOMIC/ HOUSING MARKET CONDITIONS
 OVERVIEW OF RECENT/EXPECTED ECONOMIC/ HOUSING MARKET CONDITIONS STRONG ECONOMIC FUNDAMENTALS *BUT* EXTRAORDINARY SHORT-TERM FACTORS RESULTING IN MAJOR SHIFTS IN TYPES OF HOUSING PRODUCTS AND GEOGRAPHICAL
Using Hedonics to Create Land and Structure Price Indexes for the Ottawa Condominium Market
 Using Hedonics to Create Land and Structure Price Indexes for the Ottawa Condominium Market Kate Burnett Isaacs Statistics Canada May 21, 2015 Abstract: Statistics Canada is developing a New Condominium
An Introduction to RPX INTRODUCTION
 An Introduction to RPX INTRODUCTION Radar Logic is a real estate information company based in New York. We convert public residential closing data into information about the state and prospects for the
Trends in Affordable Home Ownership in Calgary
 Trends in Affordable Home Ownership in Calgary 2006 July www.calgary.ca Call 3-1-1 PUBLISHING INFORMATION TITLE: AUTHOR: STATUS: TRENDS IN AFFORDABLE HOME OWNERSHIP CORPORATE ECONOMICS FINAL PRINTING DATE:
Recommendations for COD Standards. Robert J. Gloudemans Almy, Gloudemans, Jacobs & Denne. for. New York State Office of Real Property Services
 Recommendations for COD Standards Robert J. Gloudemans Almy, Gloudemans, Jacobs & Denne for New York State Office of Real Property Services March 12, 2009 Recommendations for COD Standards Robert J. Gloudemans
2013 Update: The Spillover Effects of Foreclosures
 2013 Update: The Spillover Effects of Foreclosures Research Analysis August 19, 2013 Between 2007 and 2012, over 12.5 million homes have gone into foreclosure. i These foreclosures directly harm the families
Heterogeneity in the Neighborhood Spillover Effects of. Foreclosed Properties
 Heterogeneity in the Neighborhood Spillover Effects of Foreclosed Properties Lei Zhang Edinboro University of Pennsylvania Tammy Leonard University of Texas at Dallas James C. Murdoch University of Texas
Assessment Year 2016 Assessment Valuations / Mass Appraisal Summary Report
 Assessment Year 2016 Assessment Valuations / Mass Appraisal Summary Report Overview Following up on last year s work, additional work was done cleaning up the sales data. The land valuation model was further
STAT 200. Guided Exercise 8 ANSWERS
 STAT 200 Guided Exercise 8 ANSWERS For On- Line Students, be sure to: Key Topics Submit your answers in a Word file to Sakai at the same place you downloaded the file Remember you can paste any Excel or
The Municipal Property Assessment
 Combined Residential and Commercial Models for a Sparsely Populated Area BY ROBERT J. GLOUDEMANS, BRIAN G. GUERIN, AND SHELLEY GRAHAM This material was originally presented on October 9, 2006, at the International
Stat 301 Exam 2 November 5, 2013 INSTRUCTIONS: Read the questions carefully and completely. Answer each question and show work in the space provided.
 Stat 301 Exam 2 November 5, 2013 Name: INSTRUCTIONS: Read the questions carefully and completely. Answer each question and show work in the space provided. Partial credit will not be given if work is not
What s Next for Commercial Real Estate Leveraging Technology and Local Analytics to Grow Your Commercial Real Estate Business
 What s Next for Commercial Real Estate Leveraging Technology and Local Analytics to Grow Your Commercial Real Estate Business - A PUBLICATION OF GROWTH MAPS- TABLE OF CONTENTS Intro 1 2 What Does Local
Coachella Valley Median Detached Home Price April April 2017
 The Desert Housing Report Median Price $450,000 $400,000 Coachella Valley Median Detached Home Price April 2002 - $349,000 $389,000 $350,000 $300,000 $250,000 $200,000 $150,000 CV Detached Median Price
Using Historical Employment Data to Forecast Absorption Rates and Rents in the Apartment Market
 Using Historical Employment Data to Forecast Absorption Rates and Rents in the Apartment Market BY CHARLES A. SMITH, PH.D.; RAHUL VERMA, PH.D.; AND JUSTO MANRIQUE, PH.D. INTRODUCTION THIS ARTICLE PRESENTS
Regression Estimates of Different Land Type Prices and Time Adjustments
 Regression Estimates of Different Land Type Prices and Time Adjustments By Bill Wilson, Bryan Schurle, Mykel Taylor, Allen Featherstone, and Gregg Ibendahl ABSTRACT Appraisers use puritan sales to estimate
MULTIFAMILY APARTMENT MARKETS IN THE WEST: METRO AREA APARTMENT CYCLES AND THEIR TRENDS MANOVA TEST:
 MULTIFAMILY APARTMENT MARKETS IN THE WEST: METRO AREA APARTMENT CYCLES AND THEIR TRENDS MANOVA TEST: CONSTRAINED AND UNCONSTRAINED MARKETS STRUCTURAL EFFECTIVE RENTS AND OCCUPANCY RATES Written by Lawrence
Demonstration Properties for the TAUREAN Residential Valuation System
 Demonstration Properties for the TAUREAN Residential Valuation System Taurean has provided a set of four sample subject properties to demonstrate many of the valuation system s features and capabilities.
Effects of Zoning on Residential Option Value. Jonathan C. Young RESEARCH PAPER
 Effects of Zoning on Residential Option Value By Jonathan C. Young RESEARCH PAPER 2004-12 Jonathan C. Young Department of Economics West Virginia University Business and Economics BOX 41 Morgantown, WV
DATA FOR OCTOBER Published November 14, Sales are down -0.8% month-over-month. The year-over-year comparison is at 4.1%.
 Permission is granted only to ARMLS Subscribers for reproduction with attribution on to ARMLS COPYRIGHT 2017. For questions regarding this publication contact Brand@ARMLS.com. DATA FOR OCTOBER 2017 - Published
PVD Foreclosure Related Sales Guidelines
 Introduction PVD Foreclosure Related Sales Guidelines The purpose of this paper is to provide guidance to county appraisers in dealing with the high volume of foreclosure related sales, also known as REO
Minneapolis St. Paul Residential Real Estate Index
 University of St. Thomas Minneapolis St. Paul Residential Real Estate Index Welcome to the latest edition of the UST Minneapolis St. Paul Residential Real Estate Index. The University of St Thomas Residential
Northgate Mall s Effect on Surrounding Property Values
 James Seago Economics 345 Urban Economics Durham Paper Monday, March 24 th 2013 Northgate Mall s Effect on Surrounding Property Values I. Introduction & Motivation Over the course of the last few decades
Over the past several years, home value estimates have been an issue of
 abstract This article compares Zillow.com s estimates of home values and the actual sale prices of 2045 single-family residential properties sold in Arlington, Texas, in 2006. Zillow indicates that this
Housing Supply Restrictions Across the United States
 Housing Supply Restrictions Across the United States Relaxed building regulations can help labor flow and local economic growth. RAVEN E. SAKS LABOR MOBILITY IS the dominant mechanism through which local
Market Trends Generated on 04/24/2018 Page 1 of Alpaca St, South El Monte, CA , Los Angeles County.
 9743 Alpaca St, South El Monte, CA 91733-3028, Los Angeles County Pricing Trends Median Sale Price to Current Value - Tax The percentage of properties that have increased or decreased in value based on
The Impact of. The Impact of. Multifamily. Multifamily. Foreclosures and. Foreclosures and. Over-Mortgaging. Over-Mortgaging.
 The Impact of The Impact of Multifamily Multifamily Foreclosures and Foreclosures and Over-Mortgaging Over-Mortgaging in Neighborhoods in Neighborhoods in New York City in New York City Harold Shultz,
DATA FOR JULY Published August 16, Sales are down -7.7% month-over-month. The year-over-year comparison is up +6.7%. ARMLS STAT JULY 2018
 Permission is granted only to ARMLS Subscribers for reproduction with attribution on to ARMLS COPYRIGHT 2018. For questions regarding this publication contact Brand@ARMLS.com. DATA FOR JULY 2018 - Published
Thoughts on the Future of the Appraisal Industry Collateral Risk Network, April 8, 2015 Joseph Tracy
 Thoughts on the Future of the Appraisal Industry Collateral Risk Network, April 8, 2015 Joseph Tracy These views are my own and not necessarily the view of the Federal Reserve Bank of NY or the Federal
Financial Bootcamp. Participant Guide SAMPLE
 Financial Bootcamp Participant Guide September 2017 2017 National Apartment Association 2 Table of Contents Section 1: Welcome... 6 Participant Introductions... 6 Learning Goals and Objectives... 6 Section
Past & Present Adjustments & Parcel Count Section... 13
 Assessment 2017 Report This report includes specific information regarding the 2017 assessment as well as general information about both the appeals and assessment processes. Contents Introduction... 3
Metro Boston Perfect Fit Parking Initiative
 Metro Boston Perfect Fit Parking Initiative Phase 1 Technical Memo Report by the Metropolitan Area Planning Council February 2017 1 About MAPC The Metropolitan Area Planning Council (MAPC) is the regional
Introduction. Bruce Munneke, S.A.M.A. Washington County Assessor. 3 P a g e
 Assessment 2016 Report This report includes specific information regarding the 2016 assessment as well as general information about both the appeals and assessment processes. Contents Introduction... 3
Assessment-To-Sales Ratio Study for Division III Equalization Funding: 1999 Project Summary. State of Delaware Office of the Budget
 Assessment-To-Sales Ratio Study for Division III Equalization Funding: 1999 Project Summary prepared for the State of Delaware Office of the Budget by Edward C. Ratledge Center for Applied Demography and
CONTENTS. Executive Summary 1. Southern Nevada Economic Situation 2 Household Sector 5 Tourism & Hospitality Industry
 CONTENTS Executive Summary 1 Southern Nevada Economic Situation 2 Household Sector 5 Tourism & Hospitality Industry Residential Trends 7 Existing Home Sales 11 Property Management Market 12 Foreclosure
Residential December 2009
 Residential December 2009 Karl L. Guntermann Fred E. Taylor Professor of Real Estate Adam Nowak Research Associate Year End Review The dramatic decline in Phoenix house prices caused by an unprecedented
Relationship of age and market value of office buildings in Tirana City
 Relationship of age and market value of office buildings in Tirana City Phd. Elfrida SHEHU Polytechnic University of Tirana Civil Engineering Department of Civil Engineering Faculty Tirana, Albania elfridaal@yahoo.com
ON THE HAZARDS OF INFERRING HOUSING PRICE TRENDS USING MEAN/MEDIAN PRICES
 ON THE HAZARDS OF INFERRING HOUSING PRICE TRENDS USING MEAN/MEDIAN PRICES Chee W. Chow, Charles W. Lamden School of Accountancy, San Diego State University, 5500 Campanile Drive, San Diego, CA 92182, chow@mail.sdsu.edu
The Effects of Securitization, Foreclosure, and Hotel Characteristics on Distressed Hotel Prices, Resolution Time, and Recovery Rate
 639124CQXXXX10.1177/1938965516639124Cornell Hospitality QuarterlySingh research-article2016 Article The Effects of Securitization, Foreclosure, and Hotel Characteristics on Distressed Hotel Prices, Resolution
1. There must be a useful number of qualified transactions to infer from. 2. The circumstances surrounded each transaction should be known.
 Direct Comparison Approach The Direct Comparison Approach is based on the premise of the "Principle of Substitution" which implies that a rational investor or purchaser will pay no more for a particular
Findings: City of Johannesburg
 Findings: City of Johannesburg What s inside High-level Market Overview Housing Performance Index Affordability and the Housing Gap Leveraging Equity Understanding Housing Markets in Johannesburg, South
Seattle Housing Market Overview January 2019
 Seattle Housing Market Overview January 2019 A review of recent trends and thoughts about the future of the Seattle housing market. Bill King President, Chief Valuation Officer Real Info, Inc. City of
THINGS TO CONSIDER WHEN BUYING A HOME
 THINGS TO CONSIDER WHEN BUYING A HOME SPRING 2014 edition TABLE OF CONTENTS 1 HARVARD: 5 FINANCIAL REASONS TO BUY A HOME 3 HOMEOWNERSHIP S IMPACT ON NET WORTH 4 EXPERTS PREDICT INTEREST RATES WILL INCREASE
Appendix D HOUSING WORK GROUP REPORT JULY 10, 2002
 Appendix D HOUSING WORK GROUP REPORT JULY 10, 2002 Work Group Assignment At the 20/20 forum in April 2001, the community expressed a need for housing policies which will protect both the Town s social
2015 First Quarter Market Report
 2015 First Quarter Market Report CAAR Member Copy Expanded Edition Charlottesville Area First Quarter 2015 Highlights: Median sales price for the region was up 5.1% over Q1-2014, rising from $244,250 to
PROJECT H.O.M.E. S ECONOMIC AND FISCAL IMPACT ON PHILADELPHIA NEIGHBORHOODS
 PROJECT H.O.M.E. S ECONOMIC AND FISCAL IMPACT ON PHILADELPHIA NEIGHBORHOODS Submitted to: Project H.O.M.E. 1515 Fairmount Ave. Philadelphia, PA 19130 (215) 232-7272 Submitted by: Econsult 3600 Market Street,
Definitions ad valorem tax Adaptive Estimation Procedure (AEP) - additive model - adjustments - algorithm - amenities appraisal appraisal schedules
 - additive model - adjustments - algorithm - amenities appraisal appraisal schedules") Definitions ad valorem tax - in reference to property, a tax based upon the value of the property. Adaptive Estimation Procedure (AEP) - A computerized, iterative, self-referential procedure using properties
Definitions ad valorem tax - in reference to property, a tax based upon the value of the property. Adaptive Estimation Procedure (AEP) - A computerized, iterative, self-referential procedure using properties
W H O S D R E A M I N G? Homeownership A mong Low Income Families
 W H O S D R E A M I N G? Homeownership A mong Low Income Families CEPR Briefing Paper Dean Baker 1 E X E CUTIV E S UM M A RY T his paper examines the relative merits of renting and owning among low income
Assessment Quality: Sales Ratio Analysis Update for Residential Properties in Indiana
 Center for Business and Economic Research About the Authors Dagney Faulk, PhD, is director of research and a research professor at Ball State CBER. Her research focuses on state and local tax policy and
Briefing Book. State of the Housing Market Update San Francisco Mayor s Office of Housing and Community Development
 Briefing Book State of the Housing Market Update 2014 San Francisco Mayor s Office of Housing and Community Development August 2014 Table of Contents Project Background 2 Household Income Background and
Minneapolis St. Paul Residential Real Estate Index
 University of St. Thomas Minneapolis St. Paul Residential Real Estate Index Welcome to the latest edition of the UST Minneapolis St. Paul Residential Real Estate Index. The University of St Thomas Residential
Deal Analyzer For Flips
 Preview Of What You Will Learn Sections: Introduction...5 Using This Manual...7 Section 1: General Property Information...8 Section 2: Property Values & Pricing......9 Section 3: Financing Costs...12 Section
SAN RAMON. Current prices for homes on the market Trends in pricing Current levels of supply and demand Value metrics
 East Bay LOCAL market update SAN RAMON Current prices for homes on the market Trends in pricing Current levels of supply and demand Value metrics Report for the week of 2008-02-08 Presented by The Harper-Mees
APPLICATION OF GEOGRAPHIC INFORMATION SYSTEM IN PROPERTY VALUATION. University of Nairobi
 APPLICATION OF GEOGRAPHIC INFORMATION SYSTEM IN PROPERTY VALUATION Thesis Presented by STEPHEN WAKABA GATHERU F56/69748/2013 Supervised by DR. DAVID NYIKA School of Engineering Department of Geospatial
FY General Revenue Forecast Presentation
 FY 2015-2019 General Revenue Forecast Presentation Steven A. Solomon Director of Finance February 18, 2014 Overview Current Economic Outlook National State Local FY 2014 2nd Quarter Revenue Update Five
Regression + For Real Estate Professionals with Market Conditions Module
 USER MANUAL 1 Automated Valuation Technologies, Inc. Regression + For Real Estate Professionals with Market Conditions Module This Regression + software program and this user s manual have been created
The Improved Net Rate Analysis
 The Improved Net Rate Analysis A discussion paper presented at Massey School Seminar of Economics and Finance, 30 October 2013. Song Shi School of Economics and Finance, Massey University, Palmerston North,
Residential January 2009
 Residential January 2009 Karl L. Guntermann Fred E. Taylor Professor of Real Estate Adam Nowak Research Associate Methodology The use of repeat sales is the most reliable way to estimate price changes
EVGN 11. The Valuer s Use of Statistical Tools
 EVGN 11 The Valuer s Use of Statistical Tools 1. Introduction 2. Preconditions for the use of AVMs 3. Limitations on the use of AVMs once the preconditions have been met 4. Portfolio valuation 1. Introduction
7 Tips to Increase Your Real Estate Profits in Today s Markets BY J SCOTT
 7 Tips to Increase Your Real Estate Profits in Today s Markets BY J SCOTT 10 E 23rd Street, 5th FL New York, NY 10010 646-895-6090 info@fundthatflip.com Higher-Level Details of the Real Estate Market Learn
Appraisal Review: Analyzing the 1004
 Appraisal Review: Analyzing the 1004 1 LIVE ONLINE PARTICIPANT GUIDE Version: 8.12 Table of Contents The Purpose of the Appraisal... 3 Define Market Value... 3 Scenario 1 (John Johnson report) - 1004 Uniform
EFFECT OF TAX-RATE ON ZONE DEPENDENT HOUSING VALUE
 EFFECT OF TAX-RATE ON ZONE DEPENDENT HOUSING VALUE Askar H. Choudhury, Illinois State University ABSTRACT Page 111 This study explores the role of zoning effect on the housing value due to different zones.
The supply of single-family homes for sale remains
 Oh Give Me a (Single-Family Rental) Home Harold D. Hunt and Clare Losey December, 18 Publication 2218 The supply of single-family homes for sale remains tight in many markets across the United States.
7224 Nall Ave Prairie Village, KS 66208
 Real Results - Income Package 10/20/2014 TABLE OF CONTENTS SUMMARY RISK Summary 3 RISC Index 4 Location 4 Population and Density 5 RISC Influences 5 House Value 6 Housing Profile 7 Crime 8 Public Schools
Messung der Preise Schwerin, 16 June 2015 Page 1
 New weighting schemes in the house price indices of the Deutsche Bundesbank How should we measure residential property prices to inform policy makers? Elena Triebskorn*, Section Business Cycle, Price and
IHS Regional Housing Market Segmentation Analysis
 REPORT IHS Regional Housing Market Segmentation Analysis June, 2017 INSTITUTE FOR HOUSING STUDIES AT DEPAUL UNIVERSITY HOUSINGSTUDIES.ORG IHS Regional Housing Market Segmentation Analysis June 2017 Using
Valuing Land in Dispute Resolution: Using Coefficient of Variation to Determine Unit of Measurement
 From the SelectedWorks of Bryan Younge March 4, 2015 Valuing Land in Dispute Resolution: Using Coefficient of Variation to Determine Unit of Measurement Bryan Younge Available at: https://works.bepress.com/bryan_younge/1/
Neighborhood Price Externalities of Foreclosure Rehabilitation: An Examination of the 1 / Neigh 29. Program
 Neighborhood Price Externalities of Foreclosure Rehabilitation: An Examination of the Neighborhood Stabilization Program Tammy Leonard 1, Nikhil Jha 2 & Lei Zhang 3 1 University of Dallas, 2 Melbourne
Orange County Housing Report: Too Much Noise. March 11, Good Afternoon!
 Orange County Housing Report: Too Much Noise March 11, 2018 Good Afternoon! Everybody seems to have an opinion about the direction of the housing market. Ignore the Noise: From talk of a housing bubble
Valuing and Marketing High- Performance Homes in DC & Beyond. Cliff Majersik, Executive Director Institute for Market Transformation
 Valuing and Marketing High- Performance Homes in DC & Beyond Cliff Majersik, Executive Director Institute for Market Transformation The Visible Value Blueprint 1. Document Upgrades 2. Disclose Inventories
The Uneven Housing Recovery
 AP PHOTO/BETH J. HARPAZ The Uneven Housing Recovery Michela Zonta and Sarah Edelman November 2015 W W W.AMERICANPROGRESS.ORG Introduction and summary The Great Recession, which began with the collapse
DISTRESSED-HOME PRICES:
 C o v e r R e p o r t : Te c h n o l o g y DISTRESSED-HOME PRICES: The True Story A recent study of more than 1,000 defaulted properties shows lenders and government agencies lack the tools to properly
Communities at the Crossroads: A Survey of Five First-Ring Suburbs
 Communities at the Crossroads: A Survey of Five First-Ring Suburbs 19 inner ring suburbs of Cleveland Inner-ring Suburban Key Challenges Bottom feeding flippers and speculators Increase in vacant homes