INVESTOR Presentation. -About Prestige Estates - Q4 & FY Review & Way Forward
|
|
|
- Gerald Chambers
- 5 years ago
- Views:
Transcription


1 INVESTOR Presentation -About Prestige Estates - Q4 & FY Review & Way Forward 1


2 ABOUT PRESTIGE Advantage Prestige Business Segments Scale of Operations Shareholding Pattern Board of Directors and Management Awards & Recognition 2


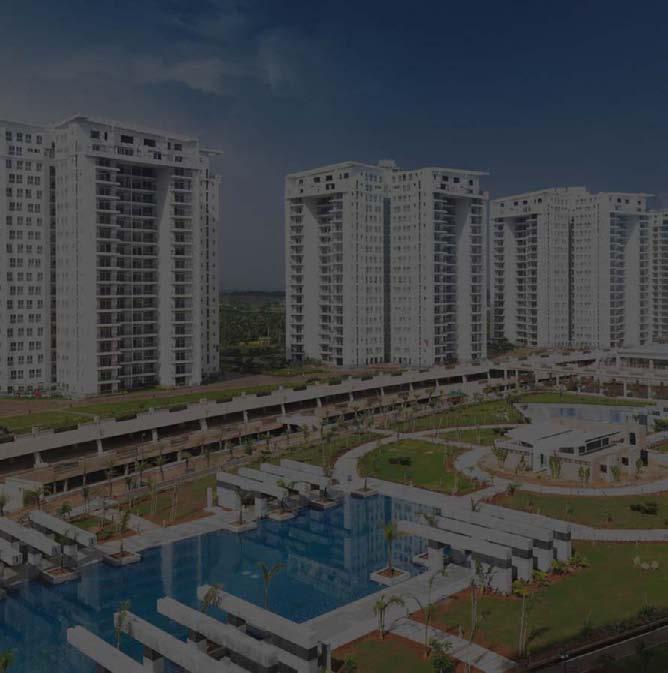
3 Iconic developments like Forum Mall, Prestige Shantiniketan, UB City, Prestige Golfshire etc Awarded with financial rating of A+ by ICRA Only CRISIL DA1* rated Developer in India One of South India s Leading Developers. Diversified Cash Flows from Various Segments 186 completed projects spanning across Mnsf of Developed Area Excellence across all Real Estate Classes, i.e. Residential, Commercial, Retail & Hospitality ADVANTAGE - PRESTIGE Strong Associations with Various Banks & FIs One of the Most Trusted Developers by Land Owners and Customers 68 Ongoing Projects spanning Over Mnsf of Area Stable Cash Flows by way of Annuity Income Spearheaded by Real Estate Icon, Mr. Irfan Razack & his brothers Mr. Rezwan and Mr.Noaman Razack Legacy Spanning over 28 YEARS Strong Joint Venture partners like CapitaLand, RedFort, etc 3


4 Business Segments RESIDENTIAL Apartments Villas Integrated Townships Plotted Developments COMMERCIAL Office Space Built to suit Campuses SEZs IT Parks RETAIL Malls HOSPITALITY Resorts Serviced Apartments Hotels Food Courts SERVICES Sub leasing & fit out services Interior Design & Execution Facilities & Property Mgmt Project & Construction Mgmt Services 4
5 Scale of Operations Category Residential Area Number (Mnsft) Commercial Retail Hospitality Plotted Development Total Area Area Area Area Area Number (Mnsft) Number (Mnsft) Number (Mnsft) Number (Mnsft) Number (Mnsft) Completed Projects Ongoing Projects Upcoming Projects Land Bank TOTAL
6 SHAREHOLDING PATTERN As on 31 March % Category % Holding 22% Promoters 70% FIIS 22% 5% Mutual Funds 5% Retail 3% 3% Promoters FIIs Mutual Funds Retail 6

7 Board of Directors Irfan Razack Chairman & Managing Director Rezwan Razack Joint Managing Director Noaman Razack Wholetime Director Uzma Irfan Additional Director Jagdeesh K. Reddy Independent Director B.G. Koshy Independent Director Noor Ahmed Jaffer Independent Director Dr. Pangal Ranganath Nayak Independent Director 7


8 Executive Management Faiz Rezwan Executive Director- Contracts & Projects Zackria Hashim Executive Director- Land Acquisition Zaid Sadiq Executive Director- Liasion & Hospitality Anjum Jung Executive Director- Interior Design Omer Bin Jung Executive Director- Hospitality Venkat K Narayan Executive Director- Finance & CFO Arvind Pai Executive Director- Legal Nayeem Noor Executive Director- Public Relations V. Gopal Executive Director- Projects & Planning Suresh Singaravelu Executive Director- Retail, Hospitality & Business Expansion Swaroop Anish Ravinda Jain Executive Director- Business Executive Director- Contracts Development 8
9 AWARDS & RECOGNITION Excellence in landscaping Best Design and Master planning Best Development Marketing Top Indian Real Estate Company Certificate of Excellence Entrepreneur Extraordinaire Most Admired shopping center Best Residential Property Developer of the year Admired Brand of Asia Top Commercial Space Developer Most Promising Brand Builder of the year Best Hotel Development Outstanding contribution to Real Estate Best Golf Development Most Admired Socially Responsible Project 188 Awards since inception And Many more 9
10 Q4 & FY

11 INDEX Guidance Vs Achieved Operational & Financial Highlights Debt Profile Rental Portfolio & Leasing Update Project Portfolio & Update Highlights Q4 & FY15 Sales Summary Receivables Proflie (Dev. Business) Hospitality & Property Management Services 11
 Achieved FY14-15 %")


 8.92 2.")
12 GUIDANCE VS ACHIEVED FULL YEAR FY14-15 Target for Full Year ( FY 14-15) Achieved FY14-15 % Achieved 100% 130% 113% 104% 89% 137% 104% 50,000 Sales (Rs. Mn) 50,135 27,000 Turnover (Rs Mn) 35,184 28,500-30,000 Collections (Rs. Mn) 32, Launches (Mnsf) Completions (Mnsft) Leasing (Mnsf) ,700-3,900 3,840 Exit Rental Income (Rs. Mn) 12
13 Highlights FY15 Highest ever Sales of Rs. 50,135 Mn, up by 13% from FY14 & Highest sales among the listed Real Estate companies in India Highest ever collections at Rs. 38,843 Mn, up by 32% from FY14 (Prestige Estates share of Rs.32,317 Mn, up by 31%) Mnsft of Launches Highest launches by a developer 8.92 Mnsft of completions Exit Rental at Rs. 3,840 Mn, up by 30% from FY14 Inaugurated two malls (Forum) in Mangalore and Hyderabad Successfully raised Rs.6125 Mn from QIP Financial/Credit rating upgraded by ICRA from ICRA A- to ICRA A+ 13
14 Highlights FY15 Re-affirmation of DA1 rating by CRISIL Tied up for 17 new property developments 30+ Awards- Maximum number of awards Rated as the Best in India & one of the best in Asia for Investor relations by Institutional Investor Magazine Highest no. of projects / area under development (68 projects Mnsft) PAT around Rs Mn per quarter Crossed Turnover of Rs Mn per quarter 14


15 OPERATIONAL UPDATE 15
16 Operational Highlights MILLIONS Particulars Quarter IV FY15 Quarter IV FY14 QIV FY15 Vs QIV FY14 (% Growth) Quarter III FY15 FY15 FY14 FY15 Vs FY14 (% Growth) New Sales - Total Amount (Rs. Mn) % Area (Mnsf) % Avg Realization/Sft (Rs) % % % % New Sales - Prestige Share Amount (Rs. Mn) % Area (Mnsf) % % % Collections (Rs. Mn) Total Collections Prestige Share % 38% % % 16
17 Operational Highlights MILLIONS Particulars Quarter IV FY15 Quarter IV FY14 QIV FY15 Vs QIV FY14 (% Growth) Quarter III FY15 FY15 FY14 FY15 Vs FY14 (% Growth) New Leasing Total (Mnsf) % % Prestige Share (Mnsf) % % Rental Income - Prestige Share (Rs. Mn) Area Delivered (Mnsf) % % % % Launches (Mnsf) % % Unrecognized Revenue (Mnsft) % % 17
 Sales Y-O-Y (Rs.")
18 Operational Highlights % % % % Total Sales Prestige Estates Sales Total Sales Prestige Estates Sales Q4 FY 14 Q4 FY 15 0 FY14 FY15 Sales Q4 FY14 & Q4 FY15 (Rs.Mn) Sales Y-O-Y (Rs.Mn) 18
19 Operational Highlights % % Q4 FY14 Q4 FY15 0 FY14 FY15 Collection Q4 FY14 & Q4 FY15 (Rs.Mn) Collections Y-O-Y (Rs. Mn) 19

20 FINANCIAL UPDATE 20
21 Financial Highlights- Q4 & FY Standalone Rs. Mn Particulars Quarter IV FY15 Quarter IV FY14 QIV FY15 Vs QIV FY14 (% Growth) Quarter III FY15 FY15 FY14 FY15 Vs FY14 (% Growth) Turnover (Rs. Mn) % % EBIDTA (Rs. Mn) % % EBIDTA % 28% 27% 35% 32% 30% PAT (Rs. Mn) % % PAT % 15% 14% 15% 16% 16% WACC 12.50% 12.75% 12.51% 12.50% 12.75% D/E Ratio (Standalone) D/E Ratio (Consolidated)
22 FINANCIAL HIGHLIGHTS- STANDALONE % % % 20% Turnover EBIDTA PAT % 22% Turnover EBIDTA PAT 0 Q4 FY14 Q4 FY15 0 FY14 FY15 Turnover, EBIDTA & PAT (Rs. Mn) Turnover, EBIDTA & PAT (Rs. Mn) Y-o-Y 22
23 FINANCIALS- Standalone Balance Sheet as at 31 March Rs. Mn As at As at As at Particulars 31-Mar Dec Mar-14 I. EQUITY AND LIABILITIES (1) Shareholders funds (a) Share capital 3,750 3,750 3,500 (b) Reserves and surplus 35,195 34,808 26,211 38,945 38,558 29,711 (2) Non-current liabilities (a) Long-term borrowings 3,363 2,433 2,360 (b) Deferred tax liabilities (Net) (c) Other Long-term liabilities (d) Long-term provisions ,317 3,185 2,815 (3) Current liabilities (a) Short-term borrowings 19,932 18,752 15,475 (b) Trade payables 4,719 3,717 3,971 (c) Other current liabilities 16,598 15,453 14,400 (d) Short-term provisions 1, ,523 42,731 38,630 35,369 Total 85,993 80,373 67,895 23
24 FINANCIALS- Standalone Balance Sheet as at 31 March 2015 Rs. Mn 2 As at As at As at Particulars 31-Mar Dec Mar-14 II. ASSETS (1) Non-current assets (a) Fixed assets (i)tangible assets 5,266 4,474 4,293 (ii)intangible assets (iii)capital work-in-progress 2,813 3,586 2,241 8,104 8,080 6,553 (b) Non-current investments 10,644 10,523 10,143 (c) Deferred tax assets (Net) (c) Long-term loans and advances 15,229 14,329 12,386 (d) Other non-current assets ,673 33,482 29,468 (2) Current assets (a) Current investments 1,700 1,950 1,880 (b) Inventories 25,608 23,954 18,294 (c) Trade receivables 7,413 7,300 6,528 (d) Cash and Bank balances 3,315 2,358 2,206 (e) Short-term loans and advances 12,933 10,968 9,226 (f) Other current assets ,320 46,891 38,427 Total 85,993 80,373 67,895 24
25 FINANCIALS- Standalone Profit & Loss Account for FY15 2 Rs. Mn Particulars 31-Mar Dec Mar Mar Mar-14 (I) Revenue from Operations 6,762 6,094 6,012 23,743 20,052 (II) Other Income ,987 1,473 (III) Total Revenue - (I+II) 7,426 6,453 6,591 25,730 21,525 (IV) Expenses Quarter ended Year ended Purchases of Stock of units Cost of sales on projects 4,059 3,023 3,371 12,879 11,344 Property and Facilities operating expenses ,610 1,204 Employee benefits expense , Finance costs ,883 1,261 Depreciation and amortization expense Other expenses ,154 1,087 Total Expenses 5,959 4,836 5,279 19,825 16,643 (V) Profit before tax (III-IV) 1,467 1,617 1,312 5,905 4,882 (VI) Tax expense ,763 1,482 VII. Profit (Loss) for the period 1, ,142 3,400 25
26 FINANCIALS - Key Ratios- Standalone Sl. No. Particulars Rs. Mn Quarter Ended Year Ended Year Ended 31-Mar Dec Mar Mar Mar-14 Ratio/% Ratio/% Ratio/% (Unaudited) (Unaudited) (Unaudited) (Audited) Ratio/% (Audited) Ratio/% 1 Sale of Projects & Property Income 6,762 6,094 6,012 23,743 20,052 2 Other Income ,987 1,473 3 Total Income 7,426 6,453 6,591 25,730 21,525 4 Cost of project sold and property expense 4,624 3,544 4,196 15,058 13,062 5 Gross Margin 2,138 32% 2,550 42% 1,816 30% 8,685 37% 6,990 35% 6 Admin, Employee and Selling cost ,462 1,965 7 EBIDTA 2,113 28% 2,241 35% 1,810 27% 8,210 32% 6,498 30% 8 Financial Expenses ,883 1,261 9 Depreciation Total Expenses 5,959 4,836 5,279 19,825 16,643 26
27 FINANCIALS - Key Ratios- Standalone Rs. Mn Sl. No. Particulars Quarter Ended Year Ended Year Ended 31-Mar Dec Mar Mar Mar-14 Ratio/% Ratio/% Ratio/% (Unaudited) (Unaudited) (Unaudited) (Audited) Ratio/% (Audited) Ratio/% 11 PBT 1,467 20% 1,617 25% 1,312 20% 5,905 23% 4,882 23% 12 Tax ,763 1, PAT 1,138 15% % % 4,142 16% 3,400 16% 14 Share of profit / (loss) from associates Minority Profit after tax 1, ,142 3, EPS (Annualized) (In Rs) Market Price per share PE Ratio Market Cap 100,688 89,719 74, ,688 74, Net Worth 38,945 38,558 29,533 38,945 29, Book Value per share Price to Book Value
28 Financial Highlights- Q4 & FY Consolidated Rs. Mn Particulars FY15 FY14 Growth % Turnover (Rs. Mn) EBIDTA (Rs. Mn) EBIDTA % PAT (Rs. Mn) PAT % % % 31% 31% % 10% 12% 28
29 Financial Highlights- Q4 & FY Consolidated Rs. Mn % Turnover EBIDTA PAT % % FY14 FY15 Turnover, EBIDTA & PAT (Rs. Mn) Y-O-Y 29
30 FINANCIALS- Consolidated Balance Sheet as at 31 March 2015 Rs. Mn As at As at Particulars 31-Mar Mar-14 I. EQUITY AND LIABILITIES (1) Shareholders funds (a) Share capital 3,750 3,500 (b) Reserves and surplus 33,757 25,593 (c) Capital reserve arising on consolidation ,206 29,792 (2) Minority interest 3,975 2,990 (3) Non-current liabilities (a) Long-term borrowings 17,162 12,159 (b) Deferred tax liabilities (Net) (c) Other Long-term liabilities 1,962 1,392 (d) Long-term provisions ,235 13,685 (4) Current liabilities (a) Short-term borrowings 21,366 15,896 (b) Trade payables 7,211 5,627 (c) Other current liabilities 31,308 23,700 (d) Short-term provisions 2,257 1,735 62,142 46,958 Total 123,558 93,
31 FINANCIALS- Consolidated Balance Sheet as at 31 March 2015 Rs. Mn As at As at Particulars 31-Mar Mar-14 II. ASSETS (1) Non-current assets (a) Fixed assets (i)tangible assets 25,033 19,230 (ii)intangible assets (iii)capital work-in-progress 7,756 9,955 32,817 29,206 (b) Goodwill (arising on consolidation) 5,040 4,520 (c) Non-current investments 1,087 1,007 (d) Deferred tax assets (net) 9 8 (e) Long-term loans and advances 11,924 11,788 (f) Other non-current assets ,245 46,807 (2) Current assets (a) Current investments 1,700 1,880 (b) Inventories 42,598 25,362 (c) Trade receivables 8,840 7,257 (d) Cash and Bank balances 5,368 3,395 (e) Short-term loans and advances 12,788 7,901 (f) Other current assets 1, ,313 46,618 Total 123,558 93,
32 FINANCIALS- Consolidated Profit & Loss account for FY15 Rs. Mn Year ended Particulars 31-Mar Mar-14 (I) Revenue from Operations 34,198 25,492 (II) Other Income (III) Total Revenue - (I+II) 35,184 26,467 (IV) Expenses Cost of sales on projects 15,862 11,712 Cost of contractual projects Property and Facilities operating expenses 3,914 2,877 Employee benefits expense 2,290 1,610 Finance costs 3,214 2,290 Depreciation and amortization expense 1, Other expenses 1,704 1,464 Total Expenses 28,870 21,471 (V) Profit before tax (III-IV) 6,314 4,996 (VI) Tax expense 2,647 1,750 VII. Profit (Loss) for the year 3,667 3,246 Share of profit / (loss) from associates (Net) (VIII) 7 (30) Profit after tax (before adjustment for Minority interest) (IX = VII - VIII) 3,674 3,216 Share in (profit) / loss to Minority interest (X) (351) (72) Profit after tax and Minority interest (VIII - X) 3,323 3,144 32
33 FINANCIALS - Key Ratios- Consolidated Sl. No. Particulars Year Ended 31-Mar-15 Ratio/% (Audited) Rs. Mn Year Ended 31-Mar-14 Ratio/% (Audited) 1 Sale of Projects & Property Income 34,198 25,492 2 Other Income Total Income 35,184 26,467 4 Cost of project sold and property expenses 20,265 15,214 5 Gross Margin 13,933 41% 10,278 40% 6 Admin, Employee and Selling cost 3,994 3,074 7 EBIDTA 10,925 31% 8,179 31% 8 Financial Expenses 3,214 2,290 9 Depreciation 1, Total Expenses 28,870 21,471 33
34 FINANCIALS - Key Ratios- Consolidated Rs. Mn Year Ended Year Ended Sl. No. Particulars 31-Mar Mar-14 Ratio/% (Audited) (Audited) Ratio/% 11 PBT 6,314 18% 4,996 19% 12 Tax 2,647 1, PAT 3,667 10% 3,246 12% 14 Share of profit / (loss) from associates Minority Profit after tax 3,323 3, EPS (Annualized) (In Rs) Market Price per share PE Ratio Market Cap 100,688 74, Net Worth 38,206 29, Book Value per share Price to Book Value
35 Business Performance 1 Launches/Pre Launches during FY15 Sl.No Project Location Segment Developable Area (Mnsf) Economic Interest No. of Units (Total) No. of Units (PEPL Share) Quarter I FY15 1 Prestige Falcon City Phase I Bengaluru Residential % 1, Prestige Cube Bengaluru Retail % - - Total- Quarter I Quarter II FY15 3 Prestige Bagmane Temple Bells Bengaluru Residential % Prestige Gulmohar Bengaluru Residential % Prestige Leela Residences Bengaluru Residential % Total- Quarter II Quarter III FY15 NIL Total- Quarter III
36 Business Performance Launches/Pre Launches during FY15 2 Sl.No Project Location Segment Developable Area (Mnsf) Economic Interest No. of Units (Total) No. of Units (PEPL Share) Quarter IV FY15 6 Prestige Ivy League Hyderabad Residential % Prestige High Fields_Phase I Hyderabad Residential % Prestige North Point Bengaluru Residential % Prestige Pine Wood Bengaluru Residential % Prestige Woodland Park Bengaluru Residential % Prestige Woodside Bengaluru Residential % Prestige MSR Bengaluru Residential % Prestige Bougainvillea Platinum Bengaluru Residential % Prestige Falcon City Phase II Bengaluru Residential % Prestige Saleh Ahmed Bengaluru Commercial % Prestige Déjà vu Bengaluru Residential % Prestige Kenilworth Bengaluru Residential % Sheraton Hotel & Convention Center Bengaluru Hospitality % - - Total- Quarter IV Total FY
37 Business Performance Completions during FY15 1 Sl.No Project Location Segment Developable Area (Mnsf) Economic Interest Prestige Share (Mnsf) Quarter I FY15 1 Prestige TechPark III Bengaluru Commercial % Exora Business Park - Block 2 Bengaluru Commercial % Excelsior T ech Park Bengaluru Commercial % Forum Mangalore Mangaluru Retail % 0.32 Total- Quarter I Quarter II FY15 5 Prestige Oasis- Phase II Bengaluru Residential % Prestige Philadelphia Bengaluru Residential % Cessna Business Park B8 Bengaluru Commercial % Prestige Khoday Towers Bengaluru Commercial % Prestige Technopolis Bengaluru Commercial % Forum Sujana Hyderabad Retail % 0.36 Total- Quarter II
38 Business Performance Completions during FY15 2 Sl.No Project Location Segment Developable Area (Mnsf) Economic Interest Prestige Share (Mnsf) Quarter III FY15 11 Prestige Silver Oak Bengaluru Residential % 0.22 Total- Quarter III Quarter IV FY15 12 Prestige Plaza(Star II) Bengaluru Commercial % Prestige Tech Platina Bengaluru Commercial % 0.95 Total- Quarter IV Total FY


39 SALES SUMMARY 39
40 SALES Summary - Prestige Estates Share Rs. Mn Particulars Residential Q4 FY 15 Q4 FY14 Q3 FY15 TOTAL FY 2015 TOTAL FY 2014 Area Units Value Area Units Value Area Unit s Value Area Units Value Area Units Value Mid Income Segme , , , ,419 32, ,303 26,068 Premium Segment , , , , ,166 TOTAL , , , ,716 40, ,700 35,234 Commercial , ,089 GRANDTOTAL , , , ,716 43, ,700 36,323 Realisation per sft (Sale Value/Area) NOTE Substantial portion of above sales are yet to come for revenue recognition in the books of accounts since the projects have not reached the threshold limits of 25% completion (excluding land) Overall unrecognized revenue in the books of accounts from all the projects as on 31/03/2015 (Sales made and yet to come for recognition) based on POC is approximately Rs. 85,254 million. The above sales value and realization are excluding Stamp duty, Registration fee and Taxes. (These exclusions approximately aggregate to around 15% of the sales value)
41 Unrecognized Revenue From Projects Under Construction As on 31 March Rs.85,254 Mn Rs. Mn 1 Sl.No Projects Total sales value of unit sold as at Cumulative turnover declared upto Balance turnover to be declared on POC Expected timeline to reach 25% trigger A Residential Projects 1 Prestige Bella Vista 10,119 9, Prestige Tranquility 9,621 6,880 2,741 3 Prestige White Meadows-1&2 7,175 5,466 1,709 4 Kingfisher Towers 5,841 3,134 2,708 5 Prestige Golf Shire 5,106 3,744 1,362 6 Prestige Sunny Side 3,218 2, Prestige Park View 1,805 1, Prestige Royal Woods 1, Prestige Garden Bay 1, Prestige Casabella Prestige Edwardian Prestige Westholme
42 Unrecognized Revenue From Projects Under Construction Rs. Mn 2 Sl.No Projects Total sales value of unit sold as at Cumulative turnover declared upto Balance turnover to be declared on POC Expected timeline to reach 25% trigger A Residential Projects 13 Prestige Silver Crest Prestige Ferns Residency 5,047 2,324 2, Prestige Mayberry 2,277 1, Prestige Glen Wood Prestige Misty Waters 3,624 2,055 1, Prestige Summer Fields Prestige Jade Pavilion 1, Prestige Silver Sun Prestige West Woods 3, , Prestige Ivy Terraces 1, Prestige Silver Spring 1, , Prestige Down Town Prestige Royale Garden-Phase I & Phase II 2,545-2,545 FY Prestige Brooklyn Heights FY 16 42
43 Unrecognized Revenue From Projects Under Construction Rs. Mn 3 Sl.No Projects Total sales value of unit sold as at Cumulative turnover declared upto Balance turnover to be declared on POC Expected timeline to reach 25% trigger A Residential Projects 26 Prestige Brooklyn Heights FY Prestige Tech Vista FY Prestige Augusta Golf Village 5,642-5,642 FY Prestige Spencer Heights FY Prestige Sunrise Park - Phase I & Phase II 9,350-9,350 FY Prestige Lakeside Habitat Phase I & II 12,134-12,134 FY Prestige Falcon City- Phase I 15,297-15,297 FY Prestige Bagmane Temple Bells 3,066-3,066 FY Prestige Gulmohar 1,945-1,945 FY Prestige Leela Residences 1,454-1,454 FY Prestige déjà vu FY Prestige Kenil Worth FY Presige Woodside FY Prestige Pine Wood 1,182-1,182 FY 17 43
44 Unrecognized Revenue From Projects Under Construction Rs. Mn 4 Sl.No Projects Total sales value of unit sold as at Cumulative turnover declared upto Balance turnover to be declared on POC Expected timeline to reach 25% trigger A Residential Projects 40 Prestige Woodland Park 1,063-1,063 FY Prestige High Fields_Phase I FY Prestige Ivy League FY Prestige Bougainvillea - II FY Prestige MSR FY Prestige Northpoint 1,423-1,423 FY 17 Sub Total - A 127,745 45,430 82,315 B Commercial Projects 1 Prestige Platina 4,176 1,516 2,660 2 Prestige Trinity Centre Sub Total - B 4,640 1,700 2,940 GRAND TOTAL - A+B 132,385 47,130 85,254 44
45 Project Debtors Summary Rs. Mn 1 Name of the Project Opening Balance as at New Sales / Adjustment Amount Realised Closing Balance as at Completed Projects Prestige Cyber Towers 31 (22) - 9 Prestige Oasis Prestige Shantiniketan Prestige Southridge Prestige Neptune Couryard Prestige Tech Park Phase - III 452 (27) Prestige Technopolis 329 (4) Prestige Khoday Tower Prestige Silver Oak Prestige Philadelphia Prestige Atrium Prestige Plaza Prestige Star Others 6 (1) - 5 Sub Total - A Note: In addition to the above, there are Land Owner dues to the extent of Rs. 869 mn. 45
46 Project Debtors Summary Rs. Mn 2 Name of the Project Opening Balance as at Incremental POC Turnover POC Adjustment Amount Realised Closing Balance as at Ongoing Projects Prestige Edwardian 63 9 Prestige Golfshire Prestige White Meadows Prestige Kingfisher Towers Prestige Parkview Prestige Sunny Side Prestige Tranquility Prestige Bellavista Prestige Westholme - 10 Prestige Royal Woods Prestige Casabella - 68 Prestige Garden Bay Prestige Glenwood 8 62 (3) (8) 137 (24) (239) ,
47 Project Debtors Summary Rs. Mn 3 Name of the Project Opening Balance as at Incremental POC Turnover POC Adjustment Amount Realised Closing Balance as at Ongoing Projects Prestige Mayberry (73) Prestige Ferns Residency Prestige Tech Platina (402) Prestige Silver Sun Prestige Silver Crest 32 2 (1) 6 29 Prestige Misty Waters (35) Prestige Summer Fields Prestige Jade Pavilion Prestige Trinity Centre Prestige Ivy Terraces Prestige West Woods Prestige Down Town Prestige Silversprings Sub Total - B 3,616 6,900 2,199 4,240 4,077 47
48 Project Debtors Summary Rs. Mn 4 Name of the Project Opening Balance as at Incremental POC Turnover POC Adjustment Amount Realised Closing Balance as at Other Ongoing Projects Prestige Techvista - - Prestige Star - - Prestige Augusta Golf Village - - Prestige Brooklyn Heights - - Prestige Spencer Heights - - Prestige Sunrise Park - - Prestige Lakeside Habitat - - Prestige Royale Gardens - - Prestige Falcon City - - Prestige KenilWorth - - Prestige Leela Residences - - Prestige Deja vu - - Prestige Bagmane Temple Bells
49 Project Debtors Summary Rs. Mn 5 Name of the Project Opening Balance as at Incremental POC Turnover POC Adjustment Amount Realised Closing Balance as at Other Ongoing Projects Prestige Gulmohar - - Prestige Ivy League - - Prestige High Fields - - Prestige MSR - - Prestige Woodland Park - - Prestige Pinewood - - Prestige North Point - - Prestige Wood Side - - Prestige Alta Vista Falcon City - - Sub Total - C Total (A+B+C) ,730-5,931 7,374 2,199 9,054 5,782 49
50 Debt Profile Rs. Mn Particulars Standalone % Consolidate d Loan * % Debt as on Secured Loan 22, % 38, % a. Project Debt - Resi & Comm 10,636 46% 13,900 37% b. Capex Loans Office Space 1,403 6% 1,403 4% - Retail % - Hospitality 2,272 10% 4,079 11% c. Rental Securitisation Loans 1,913 8% 11,668 31% d. Receivables discounting loans 6,744 29% 6,744 18% Unsecured Loan - 0% - 0% Gross Debt 22, % 38, % Less: Cash & Bank Balances 4,563 5,887 Net Debt 18,405 32,167 Networth 38,945 42,181 Debt Equity Ratio Note: There is an increase of Rs 15,086 Mn in the secured loan amount due to consolidation of the subsidiary companies. However, we should note that since consolidation is done based on line by line basis as per Accounting Standard 21, 100% of the loan amounts in subsidiaries are added up to standalone loan outstanding. If we consider only proportionate PEPL holding in the subsidiaries the net loan balance will amount to Rs 12,008 Mn as against Rs. 15,086 Mn, resulting in the overall net debt of Rs 29,089 mn (Rs 22,968 + Rs 12,008 Rs. 5887) on a consolidated basis resulting in an effective D/E Ratio of 0.69 (Rs. 29,089 / Rs.42,181). 50
51 Receivables Profile Ongoing Projects Revenue Generating Projects As on March 31, 2015 (Areas are in Million Sqft) (Values are in Million Rupees) Sales Developable Area Car Park Area Saleable Area Cost 125,331 Partner Share Prestige Share Value NA Area Value 223,417 Area Already Incurred 52,002 Balance to be spent 73,330 Amount Received Sales achieved (68%) Value 139,889 Area ,066 Balance to be received = A 65,822 Stock (32%) Value 83,528 Area = B Category Area Value Premium Projects ,959 Mid Income Projects ,730 Commercial Projects Completed Projects ,483 Total ,529 Recovery from Land Owner Refundable Deposit 1,255 5,954 Net Cash Flows of Ongoing Projects: Balance to be incurred 66,120 = C 83,230 = (A+B-C) 51
52 Receivables Profile Upcoming Projects Upcoming-Revenue Generating Projects As on March 31, 2015 (Areas are in Million Sqft) (Values are in Million Rupees) Sales Developable Car Park Area Saleable Area Cost 65,001 Partner Share Value NA Prestige Share Value 105,961 Already Incurred - Balance to be spent 65,001 Area 5.99 Area Positive Cashflow 40,959 52
53 Rental Income Office space As on March 31, 2015 (Areas are in Mn Sft) (Values are in Mn Rs) EXISTING ONGOING UPCOMING Leasable Area Leasable Area* Leasable Area Total Prestige Share in Leasable Area 6.36 Prestige Share in Leasable Area 1.77 Prestige Share in Leasable Area 3.68 Total Annual Rental Income Gross 4,302 Annual Rental Income Gross 1,912 Annual Rental Income Gross 2,519 Total 8,733 Annual Rental Income Gross - Prestige Share 3,133 Projected annual Rental Income - Prestige Share 1,276 Projected Annual Rental Income - Prestige Share 2,053 Total 6,461 53
54 Rental Income Retail As on March 31, 2015 (Areas are in Mn Sft) (Values are in Mn Rs) EXISTING ONGOING UPCOMING Leasable Area Leasable Area* Leasable Area Total Prestige Share in Leasable Area 1.15 Prestige Share in Leasable Area 0.89 Prestige Share in Leasable Area 0.60 Total 2.65 Annual Rental Income Gross 2,544 Annual Rental Income Gross 1,554 Annual Rental Income Gross 1,104 Total 5,201 Annual Rental Income 1,097 Projected Annual Rental Income - Prestige Share 710 Projected Annual Rental Income - Prestige Share 476 Total 2,283 54
55 Annualized Projected Exit Rentals for Area Leased Rs. Mn Sl. No Project Name Segment Total Leasable Area PEPL Share of Leasable Area Area Leased - Prestige Share Rent Per Sft Rent P.A (Annualised) Existing Rental Income as on 31 March, Prestige Estates Projects Ltd Commercial Cessna Business Park - B1 to B7 Commercial West Palm Developers Commercial Prestige Valley View Commercial ICBI India Commercial Forum Mall Retail Forum Value Mall Retail UB City Mall Retail Exora Business Park - B1 & B3 Commercial Prestige Polygon Commercial Forum Vijaya (Retail) Retail Forum Vijaya (Commercial) Commercial
56 Annualized Projected Exit Rentals for Area Leased Sl. No Project Name Segment Existing Rental Income as on 31 March, 2015 Total Leasable Area PEPL Share of Leasable Area Area Leased - Prestige Share Rent Per Sft Rs. Mn Rent P.A (Annualised) 13 Forum Mangalore Retail Forum Sujana Retail Exora Business Park- Block II Commercial Cessna Business Park B8 Commercial Total annualised rentals as on 31 March, ,840 Rental Income by March Prestige Polygon Commercial Forum Vijaya (Commercial) Commercial Prestige Shantiniketan (Commercial) Commercial Mysore Central Retail Trade Towers Commercial Prestige Falcon Towers Commercial Incremental rentals in FY Total annualised rentals by March ,706 56
57 Hospitality Income Hospitality As on March 31, 2015 (Areas are in Mn Sft) (Values are in Mn Rs) EXISTING ONGOING Total Keys Total Keys Total ,559 Prestige Share Keys 384 Prestige Share Keys 942 Total 1,326 Annual Gross Revenue 1,164 Annual Gross Revenue 2,117 Total 3,281 Annual Gross Revenue - Prestige Share 759 Annual Gross Revenue - Prestige Share 2,117 Total 2,876 57
58 Property Management Services Rs. Mn Particulars FY2012 FY2013 FY2014 FY2015 Number of Properties under Management Area under Management (Mnsft) Total Property management service income Other income Total operating cost EBIDTA EBITDA % 12% 13% 12% 14% PAT PAT% 9% 9% 8% 9% 58


59 PROJECT PORTFOLIO & UPDATE 59
60 PRODUCT MIX Segment Wise 7% 4% 3% 6% 19% [PERCENTAGE] [PERCENTAGE] Residential Commercial Retail Hospitality Residential Commercial Retail ONGOING PROJECTS UPCOMING PROJECTS TOTAL AREA MNSF TOTAL AREA MNSF Segment No. of Developable Projects Area (Mnsf) Residential Commercial Retail Hospitality Total Segment No. of Developable Projects Area (Mnsf) Residential Commercial Retail Total
61 Product Mix Geography Wise Ongoing Projects Total Area Mnsf Upcoming Projects Total Area Mnsf 83% 9% 3% 5% 0.1% 1% 1% 1% City No. of Developable Projects Area (Mnsf) Bengaluru Chennai Cochin Mangaluru Hyderabad Ooty Total Bengaluru Chennai Cochin Hyderabad Mangaluru Mysuru 77% 3% 4% 4% 3% 13% 4% 0.2% 1% City No. of Developable Projects Area (Mnsf) Bengaluru Chennai Cochin Hyderabad Mangaluru Mysure Total Bengaluru Chennai Cochin Mangaluru Hyderabad Ooty 61
62 Ongoing Projects Residential Sl.No Project City Developable Area (Mnsf) Economic Interest Prestige Share (Mnsf) No of Units Prestige Share of Units 1 Prestige Golfshire- Villas Bengaluru % Prestige White Meadows -1 Bengaluru % Prestige White Meadows -2 Bengaluru % Kingfisher Towers Bengaluru % Prestige Royal Woods Hyderabad % Prestige Edwardian Bengaluru % Prestige Hermitage Bengaluru % Prestige Tranquility Bengaluru % ,368 2,368 9 Prestige Park View Bengaluru % Prestige Bella Vista Chennai % ,613 1, Prestige Sunny Side Bengaluru % Prestige Garden Bay Bengaluru % Prestige Glen Wood Bengaluru % Prestige Mayberry-1 Bengaluru %
63 Ongoing Projects Residential Sl.No Project City Developable Area (Mnsf) Economic Interest Prestige Share (Mnsf) No of Units Prestige Share of Units 15 Prestige Mayberry-2 Bengaluru % Prestige Silver Crest Bengaluru % Prestige Summer Fields Bengaluru % Prestige Silver Sun Bengaluru % Prestige Hillside Retreat Bengaluru % Prestige Ferns Residency Bengaluru % , Prestige Misty Waters Bengaluru % Prestige West Holmes Mangaluru % Prestige Tech Vista Bengaluru % Prestige Brooklyn Heights Bengaluru % Prestige Spencer Heights Bengaluru % Prestige Royale Garden - Phase I Bengaluru % Prestige Sunrise Park - Phase I Bengaluru % ,046 1,036 63
64 Ongoing Projects Residential Sl.No Project City Developable Area (Mnsf) Economic Interest Prestige Share (Mnsf) No of Units Prestige Share of Units 28 Prestige West Woods Bengaluru % Prestige Augusta Golf Village Bengaluru % Prestige Casabella Bengaluru % Prestige Jade Pavilion Bengaluru % Prestige Royale Gardens - Phase II Bengaluru % Prestige Sunrise Park - Phase II Bengaluru % Prestige Silver Spring Chennai % Prestige Down Town Chennai % Prestige Thomson Cochin % Prestige Ivy Terraces Bengaluru % Prestige Lakeside Habitat- Phase I & II Bengaluru % Prestige Falcon City Phase I Bengaluru % Prestige Bagmane Temple Bells Bengaluru % Prestige Gulmohar Bengaluru %
65 Ongoing Projects Residential Sl.No Project City Developable Area (Mnsf) Economic Interest Prestige Share (Mnsf) No of Units Prestige Share of Units 42 Prestige Leela Residences Bengaluru % Prestige Ivy League Hyderabad % Prestige High Fields_Phase I Hyderabad % Prestige North Point Bengaluru % Prestige Pine Wood Bengaluru % Prestige Woodland Park Bengaluru % Prestige Woodside Bengaluru % Prestige MSR Bengaluru % Prestige Bougainvillea Platinum Bengaluru % Prestige Falcon City Phase II Bengaluru % Prestige Déjà vu Bengaluru % Prestige Kenilworth Bengaluru % Total - A ,964 16,524 65
66 Ongoing Projects Commercial Sl. No Project City Developable Area (Mnsf) Economic Interest Prestige Share (Mnsf) 1 Cessna Business Park B9-B11 Bengaluru % Prestige Trade Towers Bengaluru % Prestige TMS Square Cochin % Prestige Trinity Centre Bengaluru % Prestige Falcon Towers Bengaluru % Prestige Saleh Ahmed Bengaluru % 0.06 Total - B
67 Ongoing Projects Retail Sl. No Project City Developable Area (Mnsf) Economic Interest Prestige Share (Mnsf) 1 Forum Shantiniketan Bengaluru % Forum Mysore Mysure % Prestige TMS Square Cochin % Forum Thomsun Cochin % Prestige Mysore Central Mysure % Prestige Cube Bengaluru % 0.03 Total - C Hospitality Sl. No Project City Developable Area (Mnsf) Economic Interest Prestige Share (Mnsf) No. of Keys 1 Conrad (Hilton) Bengaluru % Marriott Hotel + Convention Centre Bengaluru % Sheraton Hotel & Convention Center Bengaluru % Total - D GRAND TOTAL - A+B+C+D
68 Upcoming Projects Residential Sl.No Project City Developable Area (Mnsf) Economic Interest Prestige Share (Mnsf) 1 Prestige Hillside Gateway (Kakanad) Cochin % Prestige Greenmoor Bengaluru % Prestige South Woods Bengaluru % Prestige Hillcrest Ooty % Prestige Lakeside Habitat Phase III Bengaluru % Prestige Primerose Hills Bengaluru % Prestige Park Square Bengaluru % Roshanara Property Bengaluru % Mangaluru Villas Mangaluru % Prestige Kew Gardens Bengaluru % Prestige Avalon Bengaluru % Prestige Fountain Blue Bengaluru % Prestige Dolce Vita Bengaluru %
69 Upcoming Projects Residential Sl.No Project City Developable Area (Mnsf) Economic Interest Prestige Share (Mnsf) 14 Prestige Sycamore Bengaluru % Prestige Courtyards Chennai % Prestige Lake Ridge Bengaluru % Prestige Cosmopoliton Chennai % Prestige Bejai Property Mangaluru % Prestige Jindal Property Bengaluru % Kadri Mangalore Property Mangaluru % Prestige High Field Phase II Hyderabad % Bannerghatta Property Bengaluru % Dollars Colony Property Bengaluru % 0.26 Total - A
70 Upcoming Projects Commercial Sl. No Project City Developable Area (Mnsf) Economic Interest Prestige Share (Mnsf) 1 Prestige Hillside Gateway (Kakanad) Cochin % Prestige Technostar Bengaluru % Prestige Tech Cloud Bengaluru % Prestige Tech Park IV Bengaluru % Prestige Tech Pacifica Park (ORR) Bengaluru % 0.64 Total - B Retail Sl. No Project City Developable Area (Mnsf) Economic Interest Prestige Share (Mnsf) 1 Prestige Hillside Gateway (Kakanad) Cochin % Falcon City Forum Mall Bengaluru % 0.87 Total - C GRAND TOTAL - A+B+C
71 Land Bank & Projects Under Planning Sl. No Entity Name Location Land Area (Acres) Economic Interest PEPL Share (Acres) 1 Prestige Bidadi Holdings Pvt Ltd Bidadi % Prestige Projects Pvt Ltd Bengaluru % Prestige Garden Resorts Pvt Ltd Bengaluru % Prestige Estates Projects Ltd Bengaluru/Chennai %% Village D Nandi Pvt Ltd Bengaluru % Prestige Nottinghill Investments Bengaluru % Eden Investments Goa % Total *Potential developable area Mnsft (Prestige Share Mnsft) 71


72 AWARDS & RECOGNITION- Received during the quarter VWP world Brands- Admired Brand of Asia Real Estate India Golf Awards Best Golf Real Estate Prestige Golfshire VWP world Brands- Admired Leader of Asia Mr. Irfan Razack 72


73 AWARDS & RECOGNITION- Received during the quarter NDTV Property Awards Outstanding Industry Contribution_ Mr. Irfan Razack ABP News Women Super achiever award in Real Estate Sector_ Ms. Uzma Irfan Care Awards 2015 Best Villa Project of the Year Prestige Silver Oak 73

74 PROJECT SNAPSHOT A Virtual Tour 74

 Prestige Tech")
75 PROJECT SNAPSHOTS Completions during the quarter Prestige Plaza (Star II) Prestige Tech Platina 75


76 PROJECT SNAPSHOTS Residential Projects Prestige Ferns Residency Prestige Park View Prestige Bella Vista Prestige Casabella 76


77 PROJECT SNAPSHOTS Residential Projects Prestige White Meadows Prestige Lakeside Habitat Prestige Edwardian Prestige Garden Bay 77 77


78 PROJECT SNAPSHOTS Residential Projects Prestige Glenwood Prestige Downtown Prestige Mayberry Prestige Sunny Side 78 78


79 PROJECT SNAPSHOTS Residential Projects Prestige Hermitage Kingfisher Towers 79


80 PROJECT SNAPSHOTS - Commercial Projects Prestige Falcon Tower Prestige Trinity Centre Prestige Trade Towers 80 80


81 REVIEW & WAY FORWARD 81
 Achieved FY13-14 % Achieved")
 44,348 20,000 Turnover (Rs Mn) 21,525 23,000")
 2.")
82 GUIDANCE VS ACHIEVED FULL YEAR FY Target for Full Year ( FY 13-14) Achieved FY13-14 % Achieved 103% 108% 108% 112% 133% 92% 43,000 Sales (Rs. Mn) 44,348 20,000 Turnover (Rs Mn) 21,525 23,000 Collections (Rs. Mn) 24, Launches (Mnsf) Leasing (Mnsf) ,200 2,950 Exit Rental Income (Rs. Mn) 82

 10.39 2.50 Leasing (Mnsf) 2.")
83 GUIDANCE VS ACHIEVED FULL YEAR FY Target for Full Year ( FY 12-13) Achieved FY12-13 % Achieved 125% 131% 130% 84% 102% 107% 25,000 Sales (Rs. Mn) 31,221 15,000 Turnover (Rs Mn) 16,064 15,000 Collections (Rs. Mn) 19, Launches (Mnsf) Leasing (Mnsf) ,250 2,289 Exit Rental Income (Rs. Mn) 83
84 Growth Y-o-Y Sales Collections 84


85 Growth Y-o-Y Turnover PAT 85
86 Growth Y-o-Y FY FY % 3,840 Exit Rental Income (Rs. Mn) FY % 2,950 FY % 2,289 1,648 86
87 Growth Y-o-Y Unrecognized Revenue (Rs. Mn) 87

88 GUIDANCE FOR FY15-16 SALES TURNOVER COLLECTIONS LAUNCHES MILLIONS MILLIONS MILLIONS MILLION Sqft 57,500-60,000 40,000-42,000 37,500-40, COMPLETIONS LEASING EXIT RENTAL DEBT EQUITY RATIO MILLION Sqft ` MILLION Sqft MILLIONS ,500 5,000 Consolidated Standalone
89 DISCLAIMER This presentation has been prepared by Prestige Estates Projects Limited ( Company ) solely for providing information about the Company. It contains certain forward looking statements concerning Prestige Estates Projects Ltd s future business prospects and business profitability, which are subject to a number of risks and uncertainties and the actual results could materially differ from those in such forward looking statements. The risks and uncertainties relating to these statements include, but are not limited to, risks and uncertainties, regarding fluctuations in earnings, our ability to manage growth, competition, economic growth in India, ability to attract and retain highly skilled professionals, time and cost over runs on contracts, government policies and actions with respect to investments, fiscal deficits, regulation etc., interest and other fiscal cost generally prevailing in the economy. The company does not undertake to make any announcement in case any of these forward looking statements become materially incorrect in future or update any forward looking statements made from time to time on behalf of the company. 89


90 Prestige Estates Projects Limited The Falcon House, No. 1, Main Guard Cross Road, Bangalore CIN: L07010KA1997PLC Phone: Fax: THANK YOU Mr. Venkat K. Narayana Executive Director & CFO Phone: investors@prestigeconstructions.com 90
INVESTOR PRESENTATION
 INVESTOR PRESENTATION Q2 FY 2012-13 www.prestigeconstructions.com 2 Index HIGHLIGHTS OF Q2 FY 2012-13 FINANCIAL PERFORMANCE SALES SUMMARY DEBT PROFILE RECEIVABLES PROFILE RENTAL PORTFOLIO & LEASING UPDATE
INVESTOR PRESENTATION Q3 FY
 INVESTOR PRESENTATION Q3 FY2014-15 www.prestigeconstructions.com 1 2 Index HIGHLIGHTS OF Q3 FY 2014-15 OPERATIONAL & FINANCIAL PERFORMANCE SALES SUMMARY DEBT PROFILE RECEIVABLES PROFILE RENTAL PORTFOLIO
RECENT LAUNCH MIXED DEVELOPMENT PROJECT ARTIST'S IMPRESSION INVESTOR PRESENTATION Q3FY16
 RECENT LAUNCH MIXED DEVELOPMENT PROJECT ARTIST'S IMPRESSION INVESTOR PRESENTATION Q3FY16 INDEX. 1. ABOUT PRESTIGE 2. OPERATIONAL HIGHLIGHTS 3. FINANCIAL HIGHLIGHTS 4. PROJECT PORTFOLIO & UPDATE 5. RECEIVABLES
Index. Highlights of Q4 & FY11. Debt Profile. Sales Summary. Rental Portfolio. Project Portfolio & Update. Corporate Governance. Awards & Recognition
 Index Highlights of Q4 & FY11 Financials Debt Profile Sales Summary Rental Portfolio Project Portfolio & Update Brand Prestige Corporate Governance Awards & Recognition Highlights Q4 & FY11 During the
Investor Presentation Q1 FY19
 Investor Presentation Q1 FY19 August 2018 (CIN: L85110KA1995PLC019126) 1 Ind AS 115 Ind AS 115 has been notified by MCA on March 28, 2018 and is applicable for accounting periods beginning on or after
PROPINSIGHT A Detailed Property Analysis Report
 PROPINSIGHT A Detailed Property Analysis Report 40,000+ Projects 10,000+ Builders 1,200+ Localities Report Created On - 7 Oct, 2015 Price Insight This section aims to show the detailed price of a project
P R E S T I G E E S T A T E S P R O J E C T S L T D SHINE ON A N N U A L R E P O R T
 P R E S T I G E E S T A T E S P R O J E C T S L T D SHINE ON A N N U A L R E P O R T 2 0 12-13 The Shining Jewel in the Crown of Indian Real Estate. For over two and a half decades, one name has been consistently
the-bridge OCTOBER - DECEMBER, 2013 VOL 3 ISSUE 3 Happiness Lies in the joy of achievement and thrill of creative effort
 the-bridge OCTOBER - DECEMBER, 2013 VOL 3 ISSUE 3 Happiness Lies in the joy of achievement and thrill of creative effort Contents 03 Standing Tall 04 Omaxe Presence Across India 05 Business Operation Q3
Ansal Properties & Infrastructure Ltd. Investors Update 4Q & FY12 May 26, 2012
 Ansal Properties & Infrastructure Ltd. Investors Update 4Q & FY12 May 26, 2012 Disclaimer This presentation has been prepared by Ansal Properties & Infrastructure Ltd (the Company ) solely for your information
National Real Estate Company. Earnings Presentation Q1 FY2014
 National Real Estate Company (Kuwait KSE: NRE) Earnings Presentation Q1 FY2014 May 28, 2014 1 Agenda 1. NREC Overview 3 2. Q1 FY2014 Summary 4 3. Financial Performance 5 4. Key Financial Ratios 7 5. Quarterly
PROPINSIGHT A Detailed Property Analysis Report
 PROPINSIGHT A Detailed Property Analysis Report 40,000+ Projects 10,000+ Builders 1,200+ Localities Report Created On - 7 Oct, 2015 Price Insight This section aims to show the detailed price of a project
Q3 FY18 Investor Presentation
 Q3 FY18 Investor Presentation Omaxe Vision & Mission Vision To be a trusted leader in the real estate sector contributing towards a progressive India. Mission To provide customer satisfaction and create
PROPINSIGHT A Detailed Property Analysis Report
 PROPINSIGHT A Detailed Property Analysis Report 40,000+ Projects 10,000+ Builders 1,200+ Localities Report Created On - 7 Oct, 2015 Price Insight This section aims to show the detailed price of a project
Dy. General Manager, BSE LIMITED, First Floor, PJ. Towers, Dalal Street, Fort, Further, the information pursuant to
 Subres SL/BSE/NSE/l 8 The Manager, Listing Department, National Stock Exchange of India Ltd., Exchange Plaza C-l, Block G, Bandra-Kurla Complex, Bandra (E), Mumbai-400 051. Corp,compliance@bseindia.com
First Sponsor Group Limited Investor Presentation 24 July 2015
 First Sponsor Group Limited Investor Presentation 24 July 2015 The initial public offering of the Company s shares was sponsored by DBS Bank Ltd., who assumes no responsibility for the contents of this
Public Storage Reports Results for the Quarter Ended March 31, 2017
 News Release Public Storage 701 Western Avenue Glendale, CA 91201-2349 www.publicstorage.com For Release Immediately Date April 26, 2017 Contact Clemente Teng (818) 244-8080, Ext. 1141 Public Storage Reports
the-bridge January - March, 2015 VOL 4 ISSUE 4 Simplicity with Variety!
 the-bridge January - March, 2015 VOL 4 ISSUE 4 Simplicity with Variety! Contents 03 Standing Tall 04 Omaxe Presence Across India 05 Business Overview Q4 FY15 06 Business Overview FY15 07 Business Operation
Brigade Enterprises Limited Q2 FY11 Earnings Conference Call. November 9, 2010 MR. JAISHANKAR- CHAIRMAN AND MD MR. SHYAMSUNDAR- GM FINANCE
 Brigade Enterprises Limited Q2 FY11 Earnings Conference Call MODERATORS: MR. JAISHANKAR- CHAIRMAN AND MD MR. SHYAMSUNDAR- GM FINANCE Ladies and gentlemen, good day and welcome to the Brigade Enterprises
Investor Presentation Q1 FY18. Happinest - Boisar
 Investor Presentation Q1 FY18 Happinest - Boisar 1 Contents Q1 FY18 Highlights Residential Business Update Integrated Cities & Industrial Clusters Update Financial Update 2 Q1 FY18 Highlights The operating
Investor. Investment Service Centre. Listed Companies Information. YANGTZEKIANG<00294> - Results Announcement
 Investor Investment Service Centre Listed Companies Information YANGTZEKIANG - Results Announcement Yangtzekiang Garment Limited announced on 16/12/2005: (stock code: 00294 ) Year end date: 31/03/2006
Pre-launch Opportunity
 Pre-launch Opportunity 3 In an established residential area of Bangalore On Kanakapura Road (NH 209) From a Grade A builder who has completed projects of over 1 million sft Under 5 acres limited inventory
Q Earnings Call November 7, 2018
 Q3 2018 Earnings Call November 7, 2018 1 Important Information This presentation contains forward-looking statements that involve risks, uncertainties and assumptions, including guidance, projections,
MANAGING HIGH VALUE ADDED PROCESSES GLOBALLY. MID TERM FINANCIAL REPORT SEPTEMBER 30 th 2017
 1 MANAGING HIGH VALUE ADDED PROCESSES GLOBALLY MID TERM FINANCIAL REPORT SEPTEMBER 30 th 2017 DISCLAIMER 2 This document has been prepared by CIE Automotive, S.A. ("CIE Automotive"), and is for information
MANAGING HIGH VALUE ADDED PROCESSES GLOBALLY. MID TERM FINANCIAL REPORT JUNE 30 th 2017
 1 MANAGING HIGH VALUE ADDED PROCESSES GLOBALLY MID TERM FINANCIAL REPORT JUNE 30 th 2017 DISCLAIMER 2 This document has been prepared by CIE Automotive, S.A. ("CIE Automotive"), and is for information
AGREE REALTY CORPORATION REPORTS OPERATING RESULTS FOR THE SECOND QUARTER 2015
 FOR IMMEDIATE RELEASE CONTACT: Joey Agree Chief Executive Officer (248) 737-4190 AGREE REALTY CORPORATION REPORTS OPERATING RESULTS FOR THE SECOND QUARTER 2015 BLOOMFIELD HILLS, MI (July 27, 2015) - Agree
PRESENTATION RESULTS Q Aldar Q Results
 Q1 2018 RESULTS PRESENTATION DISCLAIMER This disclaimer governs the use of this presentation. You must not rely on the information in the presentations and alternatively we recommend you to seek advice
Whispering Heights Real Estate Private Limited
 Rating Rationale 19 Sep 2018 Whispering Heights Real Estate Private Limited Brickwork Ratings reaffirms ratings for the Non-Convertible Debentures amount of. 156.00 Crores of Whispering Heights Real Estate
Ashiana Housing Limited
 Ashiana Housing Limited Update for Quarter Ending June 30 th 2012 Utsav Bhiwadi 1 Agenda Highlights and Overview Ongoing Project Details Financial Summary Future Projects Future Outlook 2 Highlights (Q1
Translation Of Financial Statements Originally Issued In Arabic
 PALM HILLS DEVELOPMENTS COMPANY (An Egyptian Joint Stock Company) Consolidated Financial Statements For The Year Ended Together With Auditor s Report PALM HILLS DEVELOPMENTS COMPANY S.A.E CONSOLIDATED
CENTURY PROPERTIES GROUP, INC. Analysts Presentation: FY 2013 Results April 2014
 CENTURY PROPERTIES GROUP, INC. Analysts Presentation: FY 2013 Results April 2014 IMPORTANT NOTICE AND DISCLAIMER These materials have been prepared by Century Properties Group Inc. (together with its subsidiaries,
The information contained in this presentation is only current as of its date.
 The information contained in this presentation is only current as of its date. This presentation may contain forward-looking statements, including those relating to our general business plans and strategy,
SOBHA CITY, BANGALORE LIVE THE MEDITERRANEAN LIFE. INVESTOR PRESENTATION 30 th June, 2013
 SOBHA CITY, BANGALORE LIVE THE MEDITERRANEAN LIFE SOBHA DEVELOPERS LTD INVESTOR PRESENTATION 30 th June, 2013 AWARDS & RECOGNITION SobhaAnnual Report -2013 bagged six major awards from LACP Vision Awards
Sunway Berhad TP: RM3.27 (+10.6%) Acquires Industrial Land Parcels in Selangor
 Acquires Industrial Land Parcels in Selangor") A Member of the TA Group MENARA TA ONE, 22 JALAN P. RAMLEE, 50250 KUALA LUMPUR, MALAYSIA TEL: +603-20721277 / FAX: +603-20325048 C O M P A N Y U P D A T E Monday, 22 February 2016 FBMKLCI: 1,674.88 Sector:
A Member of the TA Group MENARA TA ONE, 22 JALAN P. RAMLEE, 50250 KUALA LUMPUR, MALAYSIA TEL: +603-20721277 / FAX: +603-20325048 C O M P A N Y U P D A T E Monday, 22 February 2016 FBMKLCI: 1,674.88 Sector:
Lessor Example Performance Obligation Approach
 Lessor Example Performance Obligation Approach **Disclaimer The exposure draft received nearly 700 letters of comment through the comment period ended December 15, 2010. There is some expectation that
roots The Substance of the Standard Contents Changes to the Accounting for Goodwill for Private Companies
 The Substance of the Standard MAYER HOFFMAN MCCANN P.C. AN INDEPENDENT CPA FIRM TM A publication of the Professional Standards Group February 2014 Changes to the Accounting for Goodwill for Private Companies
Front Yard Residential Corporation Reports Third Quarter 2018 Results
 Front Yard Residential Corporation Reports Third Quarter 2018 Results November 7, 2018 CHRISTIANSTED, U.S. Virgin Islands, Nov. 07, 2018 (GLOBE NEWSWIRE) -- Front Yard Residential Corporation ( Front Yard
Achieved record annual revenues of $110.0 million for 2018, representing an increase of 5.8%
 Clipper Realty Inc. Announces Fourth Quarter and Full-Year 2018 Results Reports Record Annual Revenues, Record Annual Income from Operations and Record Quarterly and Annual Adjusted Funds from Operations
Definitions. CPI is a lease in which base rent is adjusted based on changes in a consumer price index.
 Annualized Rental Income is rental revenue under our leases on Operating Properties on a straight-line basis, which includes the effect of rent escalations and any tenant concessions, such as free rent,
Senior Housing Properties Trust Announces Fourth Quarter and Year End 2017 Results
 Senior Housing Properties Trust NEWS RELEASE Senior Housing Properties Trust Announces Fourth Quarter and Year End 2017 Results 2/27/2018 NEWTON, Mass.--(BUSINESS WIRE)-- Senior Housing Properties Trust
REAL ESTATE IN INDIA 2017
 Now Available REAL ESTATE IN INDIA 2017 Segment Analysis, Outlook and Opportunities Report (PDF) Data-set (Excel) India Infrastructure Research Real Estate in India 2017 Table of Contents SECTION I: MARKET
Front Yard Residential Corporation Announces Transformative Acquisition and Reports Second Quarter 2018 Results
 Front Yard Residential Corporation Announces Transformative Acquisition and Reports Second Quarter 2018 Results August 9, 2018 CHRISTIANSTED, U.S. Virgin Islands, Aug. 09, 2018 (GLOBE NEWSWIRE) -- Front
Clipper Realty Inc. Announces Third Quarter 2018 Results Reports Record Revenues, Income From Operations and Adjusted Funds From Operations
 Clipper Realty Inc. Announces Third Quarter 2018 Results Reports Record Revenues, Income From Operations and Adjusted Funds From Operations NEW YORK, November 1, 2018 /Business Wire/ -- Clipper Realty
PALM HILLS DEVELOPMENTS COMPANY
 PALM HILLS DEVELOPMENTS COMPANY (An Egyptian Joint Stock Company) Consolidated Financial Statements For The Year Ended Together With Auditor s Report PALM HILLS DEVELOPMENTS COMPANY S.A.E CONSOLIDATED
UNITED STATES SECURITIES AND EXCHANGE COMMISSION Washington, D.C FORM 10-Q
 UNITED STATES SECURITIES AND EXCHANGE COMMISSION Washington, D.C. 20549 FORM 10-Q ý QUARTERLY REPORT PURSUANT TO SECTION 13 OR 15(d) OF THE SECURITIES EXCHANGE ACT OF 1934 For the Quarterly Period Ended
FOR IMMEDIATE RELEASE
 FOR IMMEDIATE RELEASE American Finance Trust Announces Second Quarter Operating Results New York, August 9, - American Finance Trust, Inc. (Nasdaq: AFIN) ( AFIN or the Company ), a real estate investment
CONSOLIDATED FINANCIAL STATEMENTS
 CONSOLIDATED FINANCIAL STATEMENTS Dundee Real Estate Investment Trust Consolidated Balance Sheets (unaudited) June 30, December 31, (in thousands of dollars) Note 2004 2003 Assets Rental properties 3,4
Translation Of Financial Statements Originally Issued In Arabic
 PALM HILLS DEVELOPMENTS COMPANY (An Egyptian Joint Stock Company) Consolidated Financial Statements For The Six Months Ended Together With Review Report PALM HILLS DEVELOPMENTS COMPANY S.A.E CONSOLIDATED
Revenue Recognition- Real Estate Companies
 Revenue Recognition- Real Estate Companies CTC 25 NOVEMBER ZFB & ASSOCIATES, Chartered Accountants 1 Accounting for Real Estate Transactions Introduction Scope Revenue Recognition Criteria Project Project
Tenant: Law Firm 4 NAICS: Primary Industry: Offices of lawyers
 Tenant: Law Firm 4 NAICS: 541110 Primary Industry: Offices of lawyers Date: 05.25.17 Table of Contents Law Firm 4 132 Main Street TABLE OF CONTENTS TIL Score Executive Summary Tenant Score Information
Accounting and Auditing Update. Paul Lundy
 Accounting and Auditing Update Paul Lundy Leases: Not Just for the Footnotes Anymore Significant Financial Statement Impact New lease standard generally requires all leases to be capitalized and recognized
will not unbalance the ratio of debt to equity.
 paragraph 2-12-3. c.) and prime commercial paper. All these restrictions are designed to assure that debt proceeds (including Title VII funds disbursed from escrow), equity contributions and operating
CONSOLIDATED STATEMENT OF INCOME
 CONSOLIDATED STATEMENT OF INCOME (unaudited, data converted from the Euro to the US Dollar (for information concerning this restatement, see Note 11 to these Consolidated Financial Statements)) 1 st quarter
OPTIBASE LTD. ANNOUNCES THIRD QUARTER RESULTS
 Media Contacts: Amir Philips, CEO, Optibase Ltd. 011-972-73-7073-700 info@optibase-holdings.com Investor Relations Contact: Marybeth Csaby, for Optibase +1-917-664-3055 Marybeth.Csaby@gmail.com OPTIBASE
MILESTONE DOMESTIC SCHEME - III
 MILESTONE DOMESTIC SCHEME - III July-September, 2013 Dear Investors Greetings! Please find enclosed the Investors Update for Milestone Domestic Scheme III (the Fund ) for the quarter ended September 30,
the-bridge OCTOBER - DECEMBER, 2012 VOL 2 ISSUE 3 INNOVATION Changing the way you live!
 the-bridge OCTOBER - DECEMBER, 2012 VOL 2 ISSUE 3 INNOVATION Changing the way you live! Contents 03 Standing Tall 04 Overview Q3 & 9M FY13 06 Business Operation 08 Newly launched projects during 09 Operational
Financial Results for the 2nd Quarter of FY November 8, 2017 NTT Urban Development Corporation
 Financial Results for the 2nd Quarter of FY 2017 November 8, 2017 NTT Urban Development Corporation Financial Results for the 2nd Quarter of FY 2017 Operating revenue and operating income were 72.7 billion
Glendale, California - PS Business Parks, Inc. (AMEX: PSB), reported operating results for the fourth quarter and the year ending December 31, 2001.
, reported operating results for the fourth quarter and the year ending December 31, 2001.") News Release PS Business Parks, Inc. 701 Western Avenue P.O. Box 25050 Glendale, CA 91221-5050 www.psbusinessparks.com For Release: Immediately Date: January 30, 2002 Contact: Mr. Jack Corrigan (818) 244-8080,
News Release PS Business Parks, Inc. 701 Western Avenue P.O. Box 25050 Glendale, CA 91221-5050 www.psbusinessparks.com For Release: Immediately Date: January 30, 2002 Contact: Mr. Jack Corrigan (818) 244-8080,
White Paper on Adjusted Cashflow From Operations (ACFO) for IFRS. February, 2018
 for IFRS. February, 2018") White Paper on Adjusted Cashflow From Operations (ACFO) for IFRS February, 2018 Copyright REALPAC is the owner of all copyright in this publication. All rights reserved. No part of this document may be
White Paper on Adjusted Cashflow From Operations (ACFO) for IFRS February, 2018 Copyright REALPAC is the owner of all copyright in this publication. All rights reserved. No part of this document may be
FOR IMMEDIATE RELEASE CONTACT: John Bucksbaum 312/ General Growth Properties, Inc. Reports Operating Results for the Third Quarter 2005
 News Release General Growth Properties, Inc. 110 North Wacker Drive Chicago, IL 60606 (312) 960-5000 FAX (312) 960-5475 FOR IMMEDIATE RELEASE CONTACT: John Bucksbaum 312/960-5005 Bernie Freibaum 312/960-5252
Translation Of Financial Statements Originally Issued In Arabic
 PALM HILLS DEVELOPMENTS COMPANY (An Egyptian Joint Stock Company) Consolidated Financial Statements For The Nine Months Ended 30 Together With Review Report PALM HILLS DEVELOPMENTS COMPANY S.A.E CONSOLIDATED
Prime Urban Development India Ltd. Investor Presentation - November, 2017
 Prime Urban Development India Ltd Investor Presentation - November, 2017 Safe Harbor This presentation and the accompanying slides (the Presentation ), which have been prepared by Prime Urban Development
Prime Urban Development India Ltd Investor Presentation - November, 2016
 Prime Urban Development India Ltd Investor Presentation - November, 2016 Safe Harbor This presentation and the accompanying slides (the Presentation ), which have been prepared by Prime Urban Development
PS Business Parks, Inc. Reports Results for the Quarter Ended March 31, 2017
 News Release PS Business Parks, Inc. 701 Western Avenue Glendale, CA 91201-2349 psbusinessparks.com For Release: Immediately Date: April 25, 2017 Contact: Edward A. Stokx (818) 244-8080, Ext. 1649 PS Business
PROPOSED DISPOSAL OF MYANMAR INFRASTRUCTURE GROUP PTE. LTD.
 SINGAPORE MYANMAR INVESTCO LIMITED (Registration No. 200505764Z) (Incorporated in Singapore) PROPOSED DISPOSAL OF MYANMAR INFRASTRUCTURE GROUP PTE. LTD. 1. INTRODUCTION The Board of Directors (the Board
GODREJ INDUSTRIES LIMITED Performance Update Q1 FY AUGUST 13, 2018
 GODREJ INDUSTRIES LIMITED Performance Update Q1 FY 2018-19 AUGUST 13, 2018 1 I Godrej Industries Limited I Q1 FY 2018-19 Performance Update Aug 13,2018 DISCLAIMER Some of the statements in this communication
Retail Opportunity Investments Corp. Reports Strong First Quarter Results & Raises FFO Guidance
 April 27, 2016 Retail Opportunity Investments Corp. Reports Strong First Quarter Results & Raises FFO Guidance $17.4% increase in FFO Per Diluted Share 7.6% Increase in Same-Center Cash Net Operating Income
FY18/12 Q2 PRESENTATION
 FY18/12 Q2 PRESENTATION RENESAS ELECTRONICS CORPORATION JULY 31, 2018 2018 Renesas Electronics Corporation. All rights reserved. FINANCIAL TARGETS AND STRATEGY Long-term Financial Targets *1 (Starting
CNK & Associates, LLP
 & Associates, LLP Accounting Standards vs Taxation - Revenue Recognition, Effect of Changes in Foreign Exchange Rates, Construction Contracts, Leases & Government Grants 8th July 2017 Gautam Nayak Himanshu
News Release. PS Business Parks, Inc. 701 Western Avenue P.O. Box Glendale, CA
 News Release PS Business Parks, Inc. 701 Western Avenue P.O. Box 25050 Glendale, CA 91221-5050 www.psbusinessparks.com For Release: Immediately Date: May 3, 2001 Contact: Mr. Jack Corrigan (818) 244-8080,
the-bridge Sustainability Every business bears the responsibilty to understand the circumstances that enable its existence JULY - SEPT, 2011 ISSUE 2
 the-bridge JULY - SEPT, 2011 ISSUE 2 Sustainability Every business bears the responsibilty to understand the circumstances that enable its existence Contents 3 / Overview 4/ New Horizons 5/ Succeeded 6/
2Q16 Earnings Release
 Rodobens Reports 2Q16 Results São Paulo, August 11, 2016: Rodobens Negócios Imobiliários (BM&FBovespa: RDNI3), a residential real estate developer and builder, announces today its audited results for the
PRIMARIS RETAIL REIT Announces Third Quarter Results
 PRIMARIS RETAIL REIT Announces Third Quarter Results Toronto (Ontario) November 8, 2011 Primaris Retail REIT (TSX:PMZ.UN) is pleased to report positive operating results for the third quarter of 2011.
Guidance Note on Accounting for Real Estate Transactions. Dinesh Jangid
 Guidance Note on Accounting for Real Estate Transactions Dinesh Jangid Agenda Background and current accounting practices 2 Background Current accounting is mostly driven by the GN of the Institute of
GODREJ INDUSTRIES LIMITED Performance Update Q2 FY NOVEMBER 12, 2018
 GODREJ INDUSTRIES LIMITED Performance Update Q2 FY 2018-19 NOVEMBER 12, 2018 1 I Godrej Industries Limited I Q2 FY 2018-19 Performance Update Nov 12,2018 DISCLAIMER Some of the statements in this communication
CASE STUDY DEVELOPER CONTRIBUTES LAND AS EQUITY INTRODUCTION
 CASE STUDY DEVELOPER CONTRIBUTES LAND AS EQUITY INTRODUCTION This case study demonstrates where a developer owns a parcel of land that they are developing, and they want the Performance Indicators in the
Investor Relations. Quarterly Update. July September, 2012
 1 Investor Relations Quarterly Update July September, 2012 Disclaimer This note has been prepared exclusively for the benefit and internal use of the recipient and does not carry any right of reproduction
PROPINSIGHT A Detailed Property Analysis Report
 PROPINSIGHT A Detailed Property Analysis Report 40,000+ Projects 10,000+ Builders 1,200+ Localities Report Created On - 7 Oct, 2015 Price Insight This section aims to show the detailed price of a project
2014 Operating and Financial Highlights
 FINANCIAL HIGHLIGHTS > 2014 Operating and Financial Highlights Operating Results Executed 203 leasing transactions representing approximately 2.8 million square feet, the highest gross leasing volume in
H RESULTS 10 AUGUST 2018 TLG IMMOBILIEN AG H RESULTS
 TLG IMMOBILIEN AG H1 2018 RESULTS DISCLAIMER This presentation includes statements, estimates, opinions and projections with respect to anticipated future performance of TLG IMMOBILIEN ("Forward-Looking
Report on 2018 Second Quarter Operating and Financial Results
 Report on 2018 Second Quarter Operating and Financial Results Forward-Looking Statements This press release includes "forward-looking statements." These statements are subject to a number of risks, uncertainties
Build Toronto Inc. Consolidated Financial Statements December 31, 2015
 Consolidated Financial Statements May 10, 2016 Independent Auditor s Report To the Shareholder of Build Toronto Inc. We have audited the accompanying consolidated financial statements of Build Toronto
Corporate Update 1H FY2014 Financial Results. 28 August 2014
 Corporate Update 1H FY2014 Financial Results 28 August 2014 1H 2014 Key Highlights Achieved 2Q FY14 PATMI of RM89.5m, +132.5% y-o-y Achieved 1H FY14 PATMI of RM97.3m, +18.5% y-o-y Total property sales
STAG INDUSTRIAL ANNOUNCES SECOND QUARTER 2018 RESULTS
 STAG INDUSTRIAL ANNOUNCES SECOND QUARTER 2018 RESULTS Boston, MA July 31, 2018 - STAG Industrial, Inc. (the Company ) (NYSE:STAG), today announced its financial and operating results for the quarter ended
DEVELOPING EAST CAIRO SINCE
 1 DEVELOPING EAST CAIRO SINCE 1959 MNHD at a glance 2 2019 MNHD Corporate History & Structure MNHD is currently positioned as one of the leading real estate developers in Egypt MNHD s history dates back
2016 Financial Supplement February 2017
 Safe Harbor Statement Forward-Looking Statements - Certain statements in this presentation regarding anticipated financial outcomes including Rayonier s earnings guidance, if any, business and market conditions,
Consolidated Financial Statements of ECOTRUST CANADA. Year ended December 31, 2016
 Consolidated Financial Statements of ECOTRUST CANADA KPMG Enterprise TM Metro Tower I 4710 Kingsway, Suite 2400 Burnaby BC V5H 4M2 Canada Telephone (604) 527-3600 Fax (604) 527-3636 INDEPENDENT AUDITORS
Investor Presentation Second Quarter 2006
 Investor Presentation Second Quarter 2006 2006 Highlights (Six months to June 30, 2006) Revenues up 10.2% from accretive acquisitions Net Operating Income up 10.9% NOI margin increases Stabilized portfolio
Carter Validus Mission Critical REIT, Inc. Reports Second Quarter 2016 Results
 Carter Validus Mission Critical REIT, Inc. Reports Second Quarter 2016 Results TAMPA, FL (September 1, 2016) - Carter Validus Mission Critical REIT, Inc. (the Company ) announced today its operating results
Q RESULTS 15 MAY 2018 TLG IMMOBILIEN AG Q RESULTS
 TLG IMMOBILIEN AG Q 208 RESULTS DISCLAIMER This presentation includes statements, estimates, opinions and projections with respect to anticipated future performance of TLG IMMOBILIEN ("Forward-Looking
WP Glimcher Reports Second Quarter 2016 Results
 NEWS RELEASE WP Glimcher Reports Second Quarter 2016 Results COLUMBUS, OH August 3, 2016 WP Glimcher Inc. (NYSE: WPG) today reported financial and operating results for the second quarter ended June 30,
Keppel Land Limited 1H2004 Results 28 July 2004 Presentation Highlights Financial Results Operations Review Market Outlook Going Forward
 Keppel Land Limited 1H2004 Results 28 July 2004 Presentation Highlights Financial Results Operations Review Market Outlook Going Forward 2 Financial Results Financial Performance % $m 1H2004 1H2003 Change
CAPITALAND COMMERCIAL TRUST ANNOUNCEMENT PROPOSED ACQUISITION OF ASIA SQUARE TOWER 2
 CAPITALAND COMMERCIAL TRUST (Constituted in the Republic of Singapore pursuant to a trust deed dated 6 February 2004 (as amended)) ANNOUNCEMENT PROPOSED ACQUISITION OF ASIA SQUARE TOWER 2 1. INTRODUCTION
26 February 2013 FIRST HALF RESULTS PRESENTATION
 26 February 2013 FIRST HALF RESULTS PRESENTATION Investment highlights Proven track record of consistent earnings growth and meeting targets Strategically located and diverse residential portfolio Urban
CC HOLDINGS GS V LLC INDEX TO FINANCIAL STATEMENTS. Consolidated Financial Statements Years Ended December 31, 2011, 2010 and 2009
 INDEX TO FINANCIAL STATEMENTS Consolidated Financial Statements Years Ended December 31, 2011, 2010 and 2009 Report of PricewaterhouseCoopers LLP, Independent Auditors...................................
First Quarter Fiscal Year Ending March 31, 2017 Consolidated Earnings Announcement (Japanese GAAP)
") First Quarter Fiscal Year Ending March 31, 2017 Consolidated Earnings Announcement (Japanese GAAP) Company Name: Hoosiers Holdings Stock Code: 3284 Representative: (Title) CEO and President Contact: (Title)
First Quarter Fiscal Year Ending March 31, 2017 Consolidated Earnings Announcement (Japanese GAAP) Company Name: Hoosiers Holdings Stock Code: 3284 Representative: (Title) CEO and President Contact: (Title)
FINANCIAL YEAR 2012 RESULTS
 FINANCIAL YEAR 2012 RESULTS 31 January 2013 Contents Financial Highlights FY 2012 Portfolio Update KLCA & Cyberjaya Office Market Outlook Klang Valley & Penang Retail Market Outlook Conclusion 2 Important
Fourth Quarter & Full Year 2013 Operating & Financial Results February 20, 2014
 Fourth Quarter & Full Year 2013 Operating & Financial Results February 20, 2014 DISCLOSURE Statements in this presentation that are not historical facts are forward-looking statements, within the meaning
Investor Presentation. First Quarter 2015
 Investor Presentation First Quarter 2015 1 CAUTIONARY STATEMENTS Today s session and our answers to questions contain statements that constitute forward-looking statements about expected future events
MARGARITAVILLE RESORT CASINO TRANSACTION OVERVIEW JUNE 19, 2018
 MARGARITAVILLE RESORT CASINO TRANSACTION OVERVIEW JUNE 19, 2018 DISCLAIMERS Forward-Looking Statements This presentation contains forward-looking statements within the meaning of the federal securities
Details Make the Difference. Investor Presentation. Sobha City Thrissur Topaz & Malachite Villas. Malachite - Villas
 Sobha City Thrissur Topaz & Malachite Villas Details Make the Difference Investor Presentation Malachite - Villas 30 th September-2011 Performance Highlights Q2-12 Achieved sales of 936,319 sft during