Fourth Quarter & Full Year 2013 Operating & Financial Results February 20, 2014
|
|
|
- Mervyn Summers
- 5 years ago
- Views:
Transcription


1 Fourth Quarter & Full Year 2013 Operating & Financial Results February 20, 2014
2 DISCLOSURE Statements in this presentation that are not historical facts are forward-looking statements, within the meaning of the Private Securities Litigation Reform Act of 1995, that involve a number of risks and uncertainties that could cause actual results to differ materially from those contemplated by the relevant forward-looking statement. Factors that could cause actual results to differ materially from those contemplated in the statements include, without limitation, those described in our 2012 Annual Report on Form 10-K and in our other subsequent filings with the SEC. These forward looking statements are not guarantees of future performance. We do not undertake any obligation to update our forward-looking statements. 2
3 CALL AGENDA Opening remarks... Stan Kuriyama Real Estate & Agribusiness update....chris Benjamin Natural Materials & Construction update.....george Morvis Financial matters. Paul Ito Closing remarks..... Stan Kuriyama Questions & answers 3
4 FOURTH QUARTER EARNINGS Dollars in Millions, Except Per Share Amounts * Net Income Q13 4Q12 Diluted Earnings Per Share * Includes $0.1M of Grace acquisition-related expenses in 4Q13. 4Q Q


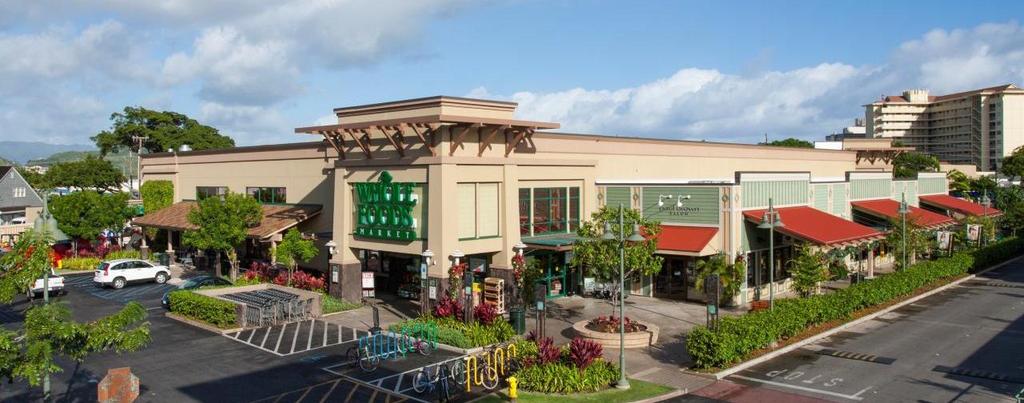
5 FOURTH QUARTER SEGMENT PERFORMANCE Development & Sales posts $37M increase in operating profit - 24-acre sale on Maui - 8 Kahala Avenue property sales - 7 Mainland commercial property sales Leasing continues upward trend - Operating profit up 5% - NOI up 17%* Kahala Avenue Ocean View * See appendix for a statement on management s use of non-gaap financial measures and a required reconciliation. Pearl Highlands Center 5


6 FOURTH QUARTER SEGMENT PERFORMANCE Natural Materials & Construction - Adjusted operating profit of $6M* - Adjusted EBITDA of $8M* Agribusiness - Operating profit $5M lower - Inventory valuation adjustments due to lower sugar prices Grace Pacific Paving * Grace s fourth quarter 2013 operating profit and EBITDA were $2.9M and $6.8M, respectively. See appendix for a statement on management s use of non-gaap measures and required reconciliations. 6 Sugar Plantation
7 FULL YEAR EARNINGS Dollars in Millions, Except Per Share Amounts * Adjusted Net Income 32.3* ** 20.5** Diluted Earnings Per Share Adjusted* GAAP * Adjusted to exclude Grace acquisition-related expenses (2013) and separation-related expenses (2012). See appendix for a statement on management s use of non-gaap financial measures and required reconciliations. ** GAAP 7
8 FOURTH QUARTER HIGHLIGHTS Acquisition of Grace Pacific closed on October 1 Initiated a modest quarterly dividend of $0.04 Closed on 24-acre parcel for the development of Maui s first Target-anchored center - Proceeds reinvested in income-producing properties $373M KR Portfolio acquisition closed on December 20 - Sold 6 Mainland properties for $266M to fund acquisition Sale of Maui Mall announced - Closed in January - Proceeds reinvested in KR portfolio 8
 Acquired 3 properties (2 large oceanfront) in December for")
9 KAHALA AVENUE PROPERTIES Acquired 27 properties in September for $98M 10 lots sold for $53M (9 closed, 1 in escrow) Acquired 3 properties (2 large oceanfront) in December for $30M 9


10 HAWAII ECONOMY CONTINUES TO PERFORM WELL 2013 Record year for the tourism industry December unemployment remains low at 4.5% Bankruptcies declined by 18% Private construction permits up 3% - Residential permits up 22% Kukui ula Plantation House Sources: Hawaii Dept. of Business, Economic Development & Tourism; Hospitality Advisors; Hawaii Department of Labor and Industrial Relations; U.S. Bankruptcy Court District of Hawaii Data provided for informational purposes only; no endorsement of forecast implied. 10

11 HAWAII ECONOMY CONTINUES TO PERFORM WELL Oahu real estate continues strong recovery - Median prices returning to peak levels Homes - $685,000 Condos - $330,000 Low levels of available inventory - Sales volumes up, but remain well below peak levels Homes 30% below peak Condos 39% below peak Commercial markets vacancies drop - Industrial 2.7% - Retail 4.2% - Office 12.2% Waihonua Sources: Title Guaranty; Honolulu Board of Realtors; Colliers International (Hawaii) Data provided for informational purposes only; no endorsement of forecast implied. 11

12 DEVELOPMENT & SALES


13 URBAN HONOLULU HIGH-RISE WAIHONUA Completely sold out under binding contracts Estimated construction completion in early 2015 THE COLLECTION 497 units in urban Honolulu 56% of 400-unit high-rise presold under binding contracts Timing of construction dependent on pre-sales & completing the regulatory approval process 13
 2013 closings - 8 custom home lots at average price of $1.2M ($70 psf) - 2 cottages at average price of $2.")
14 KUKUI ULA 3 custom lots sold in 4Q at an average price of $1.4M ($70 psf) 2013 closings - 8 custom home lots at average price of $1.2M ($70 psf) - 2 cottages at average price of $2.8M or $1,600 psf of enclosed living space ($1,200 psf living area) 14
 The Bungalows: Detached condominium homes Average enclosed living area: 800 sf to 1,900 sf Pricing: $1.")
15 KUKUI ULA Expanding products to appeal to a broader market base (prices ranging from $1.2M to $8M) The Bungalows: Detached condominium homes Average enclosed living area: 800 sf to 1,900 sf Pricing: $1.2M to $3M ($1,500 to $1,700 psf) 15

16 KUKUI ULA THE VILLAS Phase I: 13 high-end, oceanview single family homes Developed in partnership with East West Partners Positive market reception 4 binding contracts secured in January at an average price of $4.5M ($1,700 psf enclosed living area) 16


17 RESORT RESIDENTIAL KA MILO (HAWAII ISLAND) 13 units closed in 2013 at average price of $1.1M KAI MALU (MAUI) 7 units closed in 2013 at an average price of $1.3M 3 units available for sale 17

18 WAILEA Seeking regulatory approval for 70-unit condominium project Advancing additional projects & evaluating opportunities to sell parcels 18

19 MAUI BUSINESS PARK 24-acre parcel sold in 4Q13 Expect Target to drive sales at project over the long run 19
20 LEASING


21 LEASING NOI trends upwards - Up 17% to $18.2M in 4Q* - Up 9% to $68.8M in 2013* - Increase related to acquisition of Hawaii assets $565M invested in Hawaii commercial assets - 85% funded with 1031 proceeds, 60% by Mainland 75% of NOI to come from Hawaii assets Expect NOI growth in 2014 to be between 8% to 12% Waianae Mall * See appendix for a statement on management s use of non-gaap financial measures and a required reconciliation. Napili Plaza 21

22 KR PORTFOLIO 22

23 KR PORTFOLIO 386,000 sf of prime retail & industrial space in downtown Kailua Additional 51 acres ground leased to third parties & improved with 760,000 sf of commercial space Includes 70% of all the commercialzoned land in Kailua 23

24 AGRIBUSINESS Operating loss of $3.6M in 4Q due to low sugar prices Expect headwinds in Operating loss in the range of $6M to $9M Forward priced 21% of 2014 crop Have until July to price the next shipment of sugar 24

25 NATURAL MATERIALS & CONSTRUCTION
26 NATURAL MATERIALS & CONSTRUCTION 4Q performance - Adjusted operating profit of $5.7M* - Adjusted EBITDA of $7.7M* Full year 2014 purchase price allocation (PPA) adjustments impacts - $4.6M non-cash impact to operating profit - $0.6M non-cash impact to EBITDA - PPA impacts to EBITDA expected to end in December 2014 * Grace s fourth quarter 2013 operating profit and EBITDA were $2.9M and $6.8M, respectively. See appendix for a statement on management s use of non-gaap measures and required reconciliations. 26


27 NATURAL MATERIALS & CONSTRUCTION 115,000 tons paved in 4Q13-21,000 tons delayed into Quarry equipment failure has been repaired & placed into service Weather impacting 1Q14 - Greater than planned rain out days - Backlog of $226M at 1/31/14 up 10% from 10/1/13 Paving Operations Hot Mix Operations 27
28 CONDENSED BALANCE SHEET DOLLARS IN MILLIONS Assets 12/31/13 12/31/12 Current assets Investments in affiliates Real estate developments Property, net 1, Other assets Total 2,285 1,437 Liabilities & Shareholders Equity 12/31/13 12/31/12 Current liabilities, excl. current portion of LTD Long-term debt Deferred income taxes Accrued pension and post-retirement benefits Other long-term liabilities Shareholders equity 1, Total 2,285 1,437 Available borrowing capacity 12/31/13 $246M Debt to debt + equity 38% Debt to total assets 31% 28
29 CAPITAL EXPENDITURES DOLLARS IN MILLIONS Forecast* Actual Plan Growth capital Ongoing development capital, joint ventures and other investments Leasing Natural materials & construction Total growth capital 155 1, Maintenance capital Leasing Natural materials & construction Agribusiness Total maintenance capital Gross capital expenditures 185 1, exchange proceeds (50) (390) (60) Debt assumed - (165) - Stock issuance - (196) - Deferred purchase price for Grace - (24) - Net capital expenditures * Excludes KR portfolio-related exchanges. 29


30 CLOSING REMARKS Invested over $1B in high-quality Hawaii investments Position A&B as the best vehicle to invest in Hawaii s future Focused on integration and returns from investments Kailua Town Center Paving Operations 30


31 CLOSING REMARKS Continue core strategies - Build development pipeline - Seek new investments in Hawaii real estate & complementary businesses - Migrate Mainland commercial portfolio to Hawaii - Identify less volatile future for Agribusiness Strong financial position for pursuing future growth opportunities Committed to creating shareholder value 31 The Ridge at Wailea Pearl Highlands Center
32 Fourth Quarter & Full Year 2013 Operating & Financial Results February 20, 2014
33 USE OF NON-GAAP FINANCIAL MEASURES Alexander & Baldwin, Inc. reports net income and diluted earnings per share in accordance with GAAP and on a non-gaap basis. Reconciliations of the Company s GAAP to non-gaap financial measures for the year ended December 31, 2013 and 2012 are presented on the next slide. The Company uses these non-gaap financial measures when evaluating operating performance because management believes that the exclusion from net income of one-time advisory, legal, equity conversion and other expenses that were incurred to acquire Grace Pacific Corporation and to effect the separation of the Company from Matson, Inc., provides insight into the Company s core operating results, future cash flow generation, and the underlying business trends affecting performance on a consistent and comparable basis from period to period. A&B provides this information to investors as an additional means of evaluating ongoing core operations. The non-gaap financial information presented herein should be considered supplemental to, and not as a substitute for, or superior to, financial measures calculated in accordance with GAAP. 33
34 RECONCILIATION OF GAAP TO NON-GAAP MEASURES DOLLARS IN MILLIONS, EXCEPT PER SHARE AMOUNTS (UNAUDITED) Year Ended December 31, Net income Professional service and other expenses incurred to acquire Grace Pacific LLC Professional service and other expenses incurred to effect separation Charge to convert pre-separation stock options to A&B-only shares Write-down of non-strategic Mainland development project carrying values Income tax effect of adjusting items (1.7) (4.8) Adjusted net income Diluted earnings per share, net income Professional service and other expenses incurred to acquire Grace Pacific LLC Professional service and other expenses incurred to effect separation Charge to convert pre-separation stock options to A&B-only shares Write-down of non-strategic Mainland development project carrying values Income tax effect of adjusting items (0.04) (0.12) Diluted earnings per share, adjusted net income
35 USE OF NON-GAAP FINANCIAL MEASURES The Company presents NOI, which is a non-gaap measure derived from real estate revenues (determined in accordance with GAAP, less straight-line rental adjustments) minus property operating expenses (determined in accordance with GAAP). NOI does not have any standardized meaning prescribed by GAAP, and therefore, may differ from definitions of NOI used by other companies. NOI should not be considered as an alternative to net income (determined in accordance with GAAP) as an indicator of the Company s financial performance, or as an alternative to cash flow from operating activities as a measure of the Company s liquidity. NOI is commonly used as a measure of operating performance because it is an indicator of the return on property investment, and provides a method of comparing property performance over time. NOI excludes general and administrative expenses, straightline rental adjustments, interest income, interest expense, depreciation and amortization, and gains on sales of interests in real estate. The Company believes that the Real Estate Leasing segment s operating profit after discontinued operations is the most directly comparable GAAP measurement to NOI. A required reconciliation of Real Estate Leasing operating profit to Real Estate Leasing segment NOI is on the following slide. 35
36 RECONCILIATION OF GAAP TO NON-GAAP MEASURES DOLLARS IN MILLIONS Real estate leasing segment operating profit before discontinued operations Three Months Ended December 31, Full Year Ended December 31, Less amounts reported in discontinued operations (2.8) (4.2) (14.6) (17.1) Real estate leasing segment operating profit after subtracting discontinued operations Adjustments: Depreciation and amortization Straight-line lease adjustments (0.7) (0.9) (2.9) (3.6) General and administrative expenses Discontinued operations Real estate leasing segment NOI
37 USE OF NON-GAAP FINANCIAL MEASURES The Company presents adjusted operating profit and adjusted EBITDA for Grace, which is a non-gaap measure. The Company uses this non-gaap financial measure when evaluating operating performance for Grace because management believes that adjusted operating profit and adjusted EBITDA provide insight into Grace s core operating results, future cash flow generation, and the underlying business trends affecting performance on a consistent and comparable basis from period to period. A&B provides this information to investors as an additional means of evaluating Grace s ongoing core operations. The non-gaap financial information presented herein should be considered supplemental to, and not as a substitute for, or superior to, financial measures calculated in accordance with GAAP. A required reconciliation of Grace s operating profit to adjusted operating profit and operating profit to adjusted EBITDA is on the following slide. 37
38 RECONCILIATION OF GAAP TO NON-GAAP MEASURES DOLLARS IN MILLIONS Three Months Ended, December 31, 2013 Grace operating profit 2.9 Impact of purchase price allocation adjustments 2.8 Grace adjusted operating profit 5.7 Grace operating profit 2.9 Depreciation & amortization expense 4.4 Impact of purchase price allocation adjustments on cost of goods sold 0.9 Income attributable to non-controlling interest (0.5) Grace adjusted EBITDA
39 KEY HAWAII ECONOMIC INDICATORS Indicator (% Change YOY, except unemployment rate) Real Gross Domestic Product F 2015F 2016F DBEDT DBEDT DBEDT DBEDT UHERO DBEDT UHERO DBEDT UHERO DBEDT * Visitor Arrivals Real Personal Income * Unemployment Rate ** * Forecast ** December 2013 Sources: University of Hawaii Economic Research Organization (UHERO), State Forecast Update October 25, Hawaii Department of Business, Economic Development & Tourism (DBEDT), Outlook for the Economy 4Q Data provided for informational purposes only; no endorsement implied. 39
40 KEY HAWAII ECONOMIC INDICATORS YTD DECEMBER 2013, EXCEPT AS INDICATED % Change Unemployment rate (December) 4.5 (11.8) Visitors Arrivals (millions) Expenditures (billions) $ Building permits (millions) $2.6B 2.9 Oahu residential real estate resales Median home prices $650, Home volumes 3, Home months of inventory (December) Median condo prices $332, Condo volumes 4, Condo months of inventory (December) 2.9 (3.3) Sources: Hawaii Department of Labor and Industrial Relations; Hawaii Tourism Authority, Monthly Visitor Statistics, January 30, 2014 ; DBEDT Monthly Economic Indicators, December 2013; Honolulu Board of Realtors, December Data provided for informational purposes only; no endorsement implied. 40
41 Visitor Arrivals (in Millions) Visitor Expenditures ($ in Billions) VISITOR ARRIVALS & EXPENDITURES Arrivals: 2.6% Expenditures: 2.0% F 2015F 2016F Visitor Expenditures Visitor Arrivals 6 Source: DBEDT Quarterly Statistical & Economic Report, 4th Quarter Hawaii Tourism December 2013 Visitor Highlights Data provided for informational purposes only; no endorsement of forecast implied. 41
42 Percent HAWAII & U.S. UNEMPLOYMENT RATE Hawaii Average Unemployment December % December % F 2015F 2016F Hawaii U.S. Sources: DBEDT Quarterly Statistical & Economic Report, 4 th Quarter United States Department of Labor, Unemployment Data; Federal Reserve Forecast as of December 18, 2013 Data provided for informational purposes only; no endorsement of forecast implied. 42
43 HAWAII REAL ESTATE OVERVIEW YTD DECEMBER 2013 RESIDENTIAL REAL ESTATE RESALES County Single Family Homes Condominiums Sales % Change Median Price % Change Sales % Change from 2012 Median Price % Change Hawaii 1, , ,000 (3) Kauai , ,000 7 Maui , , ,500 5 Oahu 3, , , ,000 5 Total 6, , Source: Title Guaranty Sales of Existing Homes & Condominiums Report, December Data provided for informational purposes only; no endorsement implied. 43
44 Median Price Sales Volume HAWAII REAL ESTATE OVERVIEW - OAHU OAHU SINGLE FAMILY HOMES & CONDO RESALES (QUARTERLY DATA) 800,000 2, , , ,000 2,000 1, , , ,000 1, , Oahu- SFH Median Price Oahu- Condo Median Price Oahu - SFH Sales Volume Oahu- Condo Sales Volume Source: Title Guaranty Sales of Existing Homes & Condominiums report, Honolulu Board of Realtors December Data provided for informational purposes only; no endorsement implied. 0 44
45 HAWAII COMMERCIAL REAL ESTATE OVERVIEW 2013 Market Retail Industrial Office Trends Rental rate growth expected Rents expected to rise further due to tightened market conditions Vacancy expected to rise in the short term, rents to remain stable Oahu Commercial Market Statistics Retail Industrial Office Net absorption (sq. ft.) 72, , ,748 Vacancy rate 4.2% 2.7% 12.2% Average asking rent per sf per month (NNN) $3.35 $0.99 $1.55 Average operating expense per sf $1.18 $0.37 $1.33 Source: Colliers International (Hawaii) Data provided for informational purposes only; no endorsement implied. 45
A Premier Hawaii Real Estate and Land Company
 A Premier Hawaii Real Estate and Land Company Third Quarter 2012 Q Operating and Financial Results November 8, 2012 DISCLOSURE Kai Malu Maui Mall 36,000-acre sugar plantation on Maui Statements in this
ALEXANDER & BALDWIN, INC.
 Artist Rendering ALEXANDER & BALDWIN, INC. Third Quarter 2016 Operating & Financial Results October 27, 2016 DISCLOSURE Statements in this call and presentation that are not historical facts, including
Alexander & Baldwin, Inc. PREMIER HAWAII REAL ESTATE COMPANY
 1 Alexander & Baldwin, Inc. PREMIER HAWAII REAL ESTATE COMPANY 1Q17 Earnings Call May 4, 2017 Disclosure 2 Statements in this call and presentation that are not historical facts, including potential benefits,
The Plantation House at Kukui ula. Financial Community Meetings May 13-17, 2013
 The Plantation House at Kukui ula Financial Community Meetings May 13-17, 2013 DISCLOSURE Waihonua Sales Office 36,000-acre Sugar Plantation Kai Malu Statements in this presentation that are not historical
ALEXANDER & BALDWIN. Third Quarter 2017 Earnings Call. November 7, 2017
 1 ALEXANDER & BALDWIN Third Quarter 2017 Earnings Call November 7, 2017 SAFE HARBOR STATEMENT 2 Statements in this call and presentation that are not historical facts are forward-looking statements within
JMP Securities Financial Services and Real Estate Conference. Christopher J. Benjamin, President & Chief Operating Officer Alexander & Baldwin, Inc.
 JMP Securities Financial Services and Real Estate Conference October 1, 2013 Christopher J. Benjamin, President & Chief Operating Officer Alexander & Baldwin, Inc. DISCLOSURE Statements in this presentation
ALEXANDER & BALDWIN. May 8, 2018
 1 ALEXANDER & BALDWIN F I R S T Q U A R T E R 2 0 1 8 E A R N I N G S P R E S E N T A T I O N May 8, 2018 SAFE HARBOR STATEMENT 2 Statements in this call and presentation that are not historical facts
A&B: A Premier Hawaii Real Estate & Land Company June , 2012
 A&B: A Premier Hawaii Real Estate & Land Company June 18-22 22, 2012 1 Forward-Looking Statements Statements in this presentation that set forth expectations or predictions are based on facts and situations
A L E X A N D E R & B A L D W I N, I NC. S R E A L E S T A T E S U P P L E M E N T U P D A T E SECOND QUARTER (Unaudited)
") A L E X A N D E R & B A L D W I N, I NC. S R E A L E S T A T E S U P P L E M E N T U P D A T E SECOND QUARTER 2016 (Unaudited) About This Supplement Update This periodic Supplement Update is designed to
A L E X A N D E R & B A L D W I N, I NC. S R E A L E S T A T E S U P P L E M E N T U P D A T E SECOND QUARTER 2016 (Unaudited) About This Supplement Update This periodic Supplement Update is designed to
Clipper Realty Inc. Announces Third Quarter 2018 Results Reports Record Revenues, Income From Operations and Adjusted Funds From Operations
 Clipper Realty Inc. Announces Third Quarter 2018 Results Reports Record Revenues, Income From Operations and Adjusted Funds From Operations NEW YORK, November 1, 2018 /Business Wire/ -- Clipper Realty
Achieved record annual revenues of $110.0 million for 2018, representing an increase of 5.8%
 Clipper Realty Inc. Announces Fourth Quarter and Full-Year 2018 Results Reports Record Annual Revenues, Record Annual Income from Operations and Record Quarterly and Annual Adjusted Funds from Operations
Carter Validus Mission Critical REIT, Inc. Reports Second Quarter 2016 Results
 Carter Validus Mission Critical REIT, Inc. Reports Second Quarter 2016 Results TAMPA, FL (September 1, 2016) - Carter Validus Mission Critical REIT, Inc. (the Company ) announced today its operating results
Senior Housing Properties Trust Announces Fourth Quarter and Year End 2017 Results
 Senior Housing Properties Trust NEWS RELEASE Senior Housing Properties Trust Announces Fourth Quarter and Year End 2017 Results 2/27/2018 NEWTON, Mass.--(BUSINESS WIRE)-- Senior Housing Properties Trust
Retail Opportunity Investments Corp. Reports Strong First Quarter Results & Raises FFO Guidance
 April 27, 2016 Retail Opportunity Investments Corp. Reports Strong First Quarter Results & Raises FFO Guidance $17.4% increase in FFO Per Diluted Share 7.6% Increase in Same-Center Cash Net Operating Income
FIRST INDUSTRIAL REALTY TRUST REPORTS FIRST QUARTER 2018 RESULTS
 First Industrial Realty Trust, Inc. 311 South Wacker Drive Suite 3900 Chicago, IL 60606 312/344-4300 FAX: 312/922-9851 MEDIA RELEASE FIRST INDUSTRIAL REALTY TRUST REPORTS FIRST QUARTER 2018 RESULTS Occupancy
Report on 2018 Second Quarter Operating and Financial Results
 Report on 2018 Second Quarter Operating and Financial Results Forward-Looking Statements This press release includes "forward-looking statements." These statements are subject to a number of risks, uncertainties
Highwoods Reports Third Quarter 2017 Results
 FOR IMMEDIATE RELEASE Ref: 17-20 Contact: Brendan Maiorana Senior Vice President, Finance and Investor Relations 919-431-1529 Highwoods Reports Third Quarter 2017 Results $0.55 Net Income per Share $0.86
CONSOLIDATED STATEMENT OF INCOME
 CONSOLIDATED STATEMENT OF INCOME (unaudited, data converted from the Euro to the US Dollar (for information concerning this restatement, see Note 11 to these Consolidated Financial Statements)) 1 st quarter
Front Yard Residential Corporation Announces Transformative Acquisition and Reports Second Quarter 2018 Results
 Front Yard Residential Corporation Announces Transformative Acquisition and Reports Second Quarter 2018 Results August 9, 2018 CHRISTIANSTED, U.S. Virgin Islands, Aug. 09, 2018 (GLOBE NEWSWIRE) -- Front
Front Yard Residential Corporation Reports Third Quarter 2018 Results
 Front Yard Residential Corporation Reports Third Quarter 2018 Results November 7, 2018 CHRISTIANSTED, U.S. Virgin Islands, Nov. 07, 2018 (GLOBE NEWSWIRE) -- Front Yard Residential Corporation ( Front Yard
FOR IMMEDIATE RELEASE
 FOR IMMEDIATE RELEASE American Finance Trust Announces Second Quarter Operating Results New York, August 9, - American Finance Trust, Inc. (Nasdaq: AFIN) ( AFIN or the Company ), a real estate investment
OPTIBASE LTD. ANNOUNCES THIRD QUARTER RESULTS
 Media Contacts: Amir Philips, CEO, Optibase Ltd. 011-972-73-7073-700 info@optibase-holdings.com Investor Relations Contact: Marybeth Csaby, for Optibase +1-917-664-3055 Marybeth.Csaby@gmail.com OPTIBASE
... ARMADA HOFFLER PROPERTIES REPORTS FOURTH QUARTER 2013 RESULTS
 PRESS RELEASE.......................................... ARMADA HOFFLER PROPERTIES REPORTS FOURTH QUARTER 2013 RESULTS Core FFO of $7.1 Million, $0.22 Per Diluted Share Operating Property Portfolio at 94.4%
WP Glimcher Reports Second Quarter 2016 Results
 NEWS RELEASE WP Glimcher Reports Second Quarter 2016 Results COLUMBUS, OH August 3, 2016 WP Glimcher Inc. (NYSE: WPG) today reported financial and operating results for the second quarter ended June 30,
Q Financial Supplement October 2018
 Safe Harbor Statement Forward-Looking Statements - Certain statements in this presentation regarding anticipated financial outcomes including Rayonier s earnings guidance, if any, business and market conditions,
Select Income REIT Announces Third Quarter 2017 Results
 FOR IMMEDIATE RELEASE Contact: Christopher Ranjitkar, Director, Investor Relations (617) 796-8320 Select Income REIT Announces Third Quarter 2017 Results Third Quarter Net Income of $0.35 Per Share Third
Highwoods Reports Third Quarter 2018 Results
 FOR IMMEDIATE RELEASE Ref: 18-18 Contact: Brendan Maiorana Senior Vice President, Finance and Investor Relations 919-431-1529 Highwoods Reports Third Quarter 2018 Results $0.32 Net Income per Share $0.86
Alexander & Baldwin, Inc. Real Estate Supplement As of and for the Years Ended December 31, 2015 and 2014 (unaudited)
") Alexander & Baldwin, Inc. Real Estate Supplement As of and for the Years Ended December 31, 2015 and 2014 (unaudited) ABOUT THIS SUPPLEMENT This periodic Supplement is designed to provide current and potential
Alexander & Baldwin, Inc. Real Estate Supplement As of and for the Years Ended December 31, 2015 and 2014 (unaudited) ABOUT THIS SUPPLEMENT This periodic Supplement is designed to provide current and potential
INVESTOR PRESENTATION MAY 2013
 INVESTOR PRESENTATION MAY 2013 Forward-Looking Statements This presentation includes forward-looking statements. These statements are subject to a number of risks, uncertainties and other factors that
Highwoods Reports Second Quarter 2018 Results
 FOR IMMEDIATE RELEASE Ref: 18-14 Contact: Brendan Maiorana Senior Vice President, Finance and Investor Relations 919-431-1529 Highwoods Reports Second Quarter 2018 Results $0.49 Net Income per Share $0.87
2016 Financial Supplement February 2017
 Safe Harbor Statement Forward-Looking Statements - Certain statements in this presentation regarding anticipated financial outcomes including Rayonier s earnings guidance, if any, business and market conditions,
Public Storage Reports Results for the Quarter Ended March 31, 2017
 News Release Public Storage 701 Western Avenue Glendale, CA 91201-2349 www.publicstorage.com For Release Immediately Date April 26, 2017 Contact Clemente Teng (818) 244-8080, Ext. 1141 Public Storage Reports
FOR IMMEDIATE RELEASE
 FOR IMMEDIATE RELEASE GLOBAL NET LEASE ANNOUNCES OPERATING RESULTS FOR THIRD QUARTER 2018 New York, November 7, 2018 Global Net Lease, Inc. (NYSE: GNL) ( GNL or the Company ), a real estate investment
PS Business Parks, Inc. Reports Results for the Quarter Ended September 30, 2018
 News Release PS Business Parks, Inc. 701 Western Avenue Glendale, CA 91201-2349 psbusinessparks.com For Release: Immediately Date: October 23, 2018 Contact: Jeff Hedges (818) 244-8080, Ext. 1649 PS Business
FOR IMMEDIATE RELEASE
 FOR IMMEDIATE RELEASE GLOBAL NET LEASE ANNOUNCES OPERATING RESULTS FOR SECOND QUARTER 2018 New York, August 8, 2018 Global Net Lease, Inc. (NYSE: GNL) ( GNL or the Company ), a real estate investment trust
FOR IMMEDIATE RELEASE CONTACT: John Bucksbaum 312/ General Growth Properties, Inc. Reports Operating Results for the Third Quarter 2005
 News Release General Growth Properties, Inc. 110 North Wacker Drive Chicago, IL 60606 (312) 960-5000 FAX (312) 960-5475 FOR IMMEDIATE RELEASE CONTACT: John Bucksbaum 312/960-5005 Bernie Freibaum 312/960-5252
2014 Operating and Financial Highlights
 FINANCIAL HIGHLIGHTS > 2014 Operating and Financial Highlights Operating Results Executed 203 leasing transactions representing approximately 2.8 million square feet, the highest gross leasing volume in
PS Business Parks, Inc. Reports Results for the Quarter Ended March 31, 2017
 News Release PS Business Parks, Inc. 701 Western Avenue Glendale, CA 91201-2349 psbusinessparks.com For Release: Immediately Date: April 25, 2017 Contact: Edward A. Stokx (818) 244-8080, Ext. 1649 PS Business
Senior Housing Properties Trust Announces Fourth Quarter and Year End 2018 Results
 Senior Housing Properties Trust NEWS RELEASE Senior Housing Properties Trust Announces Fourth Quarter and Year End 2018 Results 3/1/2019 Fourth Quarter Net Loss Attributable to Common Shareholders of $0.50
Extra Space Storage Inc. Reports 2017 Fourth Quarter and Year-End Results
 Extra Space Storage Inc. Reports 2017 Fourth Quarter and Year-End Results February 20, 2018 SALT LAKE CITY, Feb. 20, 2018 /PRNewswire/ -- Extra Space Storage Inc. (NYSE: EXR) (the "Company"), a leading
PRIMARIS RETAIL REIT Announces Third Quarter Results
 PRIMARIS RETAIL REIT Announces Third Quarter Results Toronto (Ontario) November 8, 2011 Primaris Retail REIT (TSX:PMZ.UN) is pleased to report positive operating results for the third quarter of 2011.
Third Quarter 2018 Results. November 21, 2018 (Singapore / Hong Kong Time) November 20, 2018 (U.S. Eastern Time)
 November 20, 2018 (U.S. Eastern Time)") Third Quarter Results November 21, (Singapore / Hong Kong Time) November 20, (U.S. Eastern Time) Disclaimer This presentation by Sea Limited ( Sea ) contains forward-looking statements. These statements
Third Quarter Results November 21, (Singapore / Hong Kong Time) November 20, (U.S. Eastern Time) Disclaimer This presentation by Sea Limited ( Sea ) contains forward-looking statements. These statements
PS Business Parks, Inc. Reports Results for the Quarter Ended March 31, 2018
 News Release PS Business Parks, Inc. 701 Western Avenue Glendale, CA 91201-2349 psbusinessparks.com For Release: Immediately Date: April 24, 2018 Contact: Maria R. Hawthorne (818) 244-8080, Ext. 1370 PS
Extra Space Storage Inc. Reports 2018 Fourth Quarter and Year-End Results
 Extra Space Storage Inc. Reports 2018 Fourth Quarter and Year-End Results February 20, 2019 SALT LAKE CITY, Feb. 20, 2019 /PRNewswire/ -- Extra Space Storage Inc. (NYSE: EXR) (the "Company"), a leading
PS Business Parks, Inc. Reports Results for the Quarter and Year Ended December 31, 2018
 News Release PS Business Parks, Inc. 701 Western Avenue Glendale, CA 91201-2349 psbusinessparks.com For Release: Immediately Date: February 20, 2019 Contact: Jeff Hedges (818) 244-8080, Ext. 1649 PS Business
FIRST INDUSTRIAL REALTY TRUST REPORTS FIRST QUARTER 2019 RESULTS
 First Industrial Realty Trust, Inc. 1 North Wacker Drive Suite 4200 Chicago, IL 60606 312/344-4300 MEDIA RELEASE FIRST INDUSTRIAL REALTY TRUST REPORTS FIRST QUARTER 2019 RESULTS Signed 1.8 Million Square
NEWS RELEASE For immediate release
 NEWS RELEASE For immediate release Laura Clark 904 598 7831 LauraClark@RegencyCenters.com Regency Centers Reports Third Quarter 2018 Results Company Increases 2018 Guidance JACKSONVILLE, FL. (October 25,
Highwoods Properties Reports Fourth Quarter and Full Year 2011 Results
 FOR IMMEDIATE RELEASE Ref: 12-06 Contact: Tabitha Zane Vice President, Investor Relations 919-431-1529 Highwoods Properties Reports Fourth Quarter and Full Year 2011 Results $0.70 FFO per Share for Fourth
CONSOLIDATED STATEMENT OF INCOME
 CONSOLIDATED STATEMENT OF INCOME 1 st quarter (a) 2017 4 th quarter Sales 41,183 42,275 32,841 Excise taxes (5,090) (5,408) (5,319) Revenues from sales 36,093 36,867 27,522 Purchases, net of inventory
SEC Reg. G Compliance - Non-GAAP Financial Measures
 SEC Reg. G Compliance - Non-GAAP Financial Measures Funds From Operations (FFO) Reconciliation, Including Non-Cash Items 1 ($ in 000s, except per share amounts) Tentative Estimates Preliminary and Midpoint
June 2018 VALUE PROPOSITION
 1 ALEXANDER & BALDWIN F i n a n c i a l C o m m u n i t y P r e s e n t a t i o n June 2018 VALUE PROPOSITION 2 High-quality CRE portfolio in robust market with embedded growth opportunities Underappreciated
Strategic Storage Growth Trust, Inc. Reports 2018 Third Quarter Results
 FOR IMMEDIATE RELEASE Contacts Julie Leber Damon Elder Spotlight Marketing Communications Spotlight Marketing Communications 949.427.1391 949.427.1377 julie@spotlightmarcom.com damon@spotlightmarcom.com
General Growth Properties, Inc.
 General Growth Properties, Inc. Supplemental Financial Information For the Three and Nine Months Ended September 30, 2009 This presentation contains forward-looking statements. Actual results may differ
Q Earnings Call November 7, 2018
 Q3 2018 Earnings Call November 7, 2018 1 Important Information This presentation contains forward-looking statements that involve risks, uncertainties and assumptions, including guidance, projections,
Supplemental Information Package for Alexander & Baldwin, Inc. - Real Estate Leasing Segment. June 30, 2007 (Unaudited)
") Supplemental Information Package for Alexander & Baldwin, Inc. - Real Estate Leasing Segment June 30, 2007 (Unaudited) Alexander & Baldwin, Inc. Real Estate Leasing Segment Index to Supplemental Information
Supplemental Information Package for Alexander & Baldwin, Inc. - Real Estate Leasing Segment June 30, 2007 (Unaudited) Alexander & Baldwin, Inc. Real Estate Leasing Segment Index to Supplemental Information
Highwoods Reports Third Quarter 2015 Results
 FOR IMMEDIATE RELEASE Ref: 15-22 Contact: Mark Mulhern Senior Vice President and Chief Financial Officer 919-875-6682 Reports Third Quarter 2015 Results $0.77 FFO per Share (Including $0.01 per Share of
Definitions. CPI is a lease in which base rent is adjusted based on changes in a consumer price index.
 Annualized Rental Income is rental revenue under our leases on Operating Properties on a straight-line basis, which includes the effect of rent escalations and any tenant concessions, such as free rent,
Highwoods Properties Reports Third Quarter Results. $0.58 FFO per Diluted Share (Excluding Debt Extinguishment Loss and Property Acquisition Costs)
") FOR IMMEDIATE RELEASE Ref: 10-28 Contact: Tabitha Zane Vice President, Investor Relations 919-431-1529 Highwoods Properties Reports Third Quarter Results $0.58 FFO per Diluted Share (Excluding Debt Extinguishment
FOR IMMEDIATE RELEASE Ref: 10-28 Contact: Tabitha Zane Vice President, Investor Relations 919-431-1529 Highwoods Properties Reports Third Quarter Results $0.58 FFO per Diluted Share (Excluding Debt Extinguishment
SAUL CENTERS, INC Wisconsin Avenue, Suite 1500, Bethesda, Maryland (301)
") SAUL CENTERS, INC. 7501 Wisconsin Avenue, Suite 1500, Bethesda, Maryland 20814-6522 (301) 986-6200 October 29, 2015, Bethesda, MD. Saul Centers, Inc. Reports Third Quarter 2015 Earnings Saul Centers, Inc.
SAUL CENTERS, INC. 7501 Wisconsin Avenue, Suite 1500, Bethesda, Maryland 20814-6522 (301) 986-6200 October 29, 2015, Bethesda, MD. Saul Centers, Inc. Reports Third Quarter 2015 Earnings Saul Centers, Inc.
Taubman Centers, Inc. Taubman/Starwood Capital Group Transaction
 Taubman Centers, Inc. Taubman/Starwood Capital Group Transaction June 18, 2014 Forward Looking Language and Use of Non-GAAP Measures For ease of use, references in this presentation to Taubman Centers,
SMARTCENTRES REAL ESTATE INVESTMENT TRUST RELEASES SECOND QUARTER RESULTS FOR 2018 AND ANNOUNCES DISTRIBUTION INCREASE
 SMARTCENTRES REAL ESTATE INVESTMENT TRUST RELEASES SECOND QUARTER RESULTS FOR 2018 AND ANNOUNCES DISTRIBUTION INCREASE TORONTO, ONTARIO - (August 9, 2018) SmartCentres Real Estate Investment Trust ("SmartCentres"
-- Expanding relationship with Brookdale by creating a $1.2 billion CCRC joint venture and amending existing Emeritus leases
 Page 1 of 11 Print Page Close Window News Release HCP Announces Results for Quarter Ended March 31, 2014 HIGHLIGHTS -- FFO per share was $0.75; FAD per share was $0.63; and EPS was $0.56 -- Achieved year-over-year
RESI Update 4 th Quarter 2016
 RESI Update 4 th Quarter 2016 Supplemental Investor Information George Ellison, CEO Robin Lowe, CFO 2017 Altisource Residential Corporation. All rights reserved. Forward Looking Statements This presentation
SAUL CENTERS, INC Wisconsin Avenue, Suite 1500, Bethesda, Maryland (301)
") May 3, 2018, Bethesda, MD. SAUL CENTERS, INC. 7501 Wisconsin Avenue, Suite 1500, Bethesda, Maryland 20814-6522 (301) 986-6200 Saul Centers, Inc. Reports First Quarter 2018 Earnings Saul Centers, Inc. (NYSE:
May 3, 2018, Bethesda, MD. SAUL CENTERS, INC. 7501 Wisconsin Avenue, Suite 1500, Bethesda, Maryland 20814-6522 (301) 986-6200 Saul Centers, Inc. Reports First Quarter 2018 Earnings Saul Centers, Inc. (NYSE:
Table of Contents Page
 Table of Contents Page Page Company, Common Stock, and Earnings Call Information 1 Debt Information Definitions 2-3 Debt Maturities 20 Financial Information Unsecured Public Debt Covenants 21 Balance Sheets
SECURITIES AND EXCHANGE COMMISSION. Washington, D.C FORM 8-K CURRENT REPORT
 SECURITIES AND EXCHANGE COMMISSION Washington, D.C. 20549 FORM 8-K CURRENT REPORT PURSUANT TO SECTION 13 OR 15(d) OF THE SECURITIES EXCHANGE ACT OF 1934 Date of Report (Date of earliest event reported):
CHOICE PROPERTIES REAL ESTATE INVESTMENT TRUST. Management s Discussion and Analysis of Financial Condition and Results of Operations
 CHOICE PROPERTIES REAL ESTATE INVESTMENT TRUST Management s Discussion and Analysis of Financial Condition and Results of Operations (in thousands of Canadian dollars except where otherwise indicated)
Investor Presentation November 2017
 Investor Presentation November 2017 1 Table of Contents Company Overview & 2017 Highlights 3 6 Multifamily Fundamentals 7 11 Camden s Portfolio 12 22 Real Estate Transactions 23 29 Capital Structure &
NON-GAAP FINANCIAL MEASURES
 NON-GAAP FINANCIAL MEASURES Welltower Inc. (HCN) believes that revenues, net operating income from continuing operations (NOICO), net income and net income attributable to common stockholders (NICS), as
AGREE REALTY CORPORATION REPORTS OPERATING RESULTS FOR THE SECOND QUARTER 2015
 FOR IMMEDIATE RELEASE CONTACT: Joey Agree Chief Executive Officer (248) 737-4190 AGREE REALTY CORPORATION REPORTS OPERATING RESULTS FOR THE SECOND QUARTER 2015 BLOOMFIELD HILLS, MI (July 27, 2015) - Agree
Select Income REIT Announces Second Quarter 2016 Results
 FOR IMMEDIATE RELEASE Contact: Christopher Ranjitkar, Director, Investor Relations (617) 796-8320 Select Income REIT Announces Second Quarter 2016 Results Second Quarter Net Income of $0.34 Per Share Second
SAUL CENTERS, INC Wisconsin Avenue, Suite 1500, Bethesda, Maryland (301)
") SAUL CENTERS, INC. 7501 Wisconsin Avenue, Suite 1500, Bethesda, Maryland 20814-6522 (301) 986-6200 Saul Centers, Inc. Reports Third Quarter 2017 Earnings November 2, 2017, Bethesda, MD. Saul Centers, Inc.
SAUL CENTERS, INC. 7501 Wisconsin Avenue, Suite 1500, Bethesda, Maryland 20814-6522 (301) 986-6200 Saul Centers, Inc. Reports Third Quarter 2017 Earnings November 2, 2017, Bethesda, MD. Saul Centers, Inc.
STAG INDUSTRIAL ANNOUNCES SECOND QUARTER 2018 RESULTS
 STAG INDUSTRIAL ANNOUNCES SECOND QUARTER 2018 RESULTS Boston, MA July 31, 2018 - STAG Industrial, Inc. (the Company ) (NYSE:STAG), today announced its financial and operating results for the quarter ended
NEWS RELEASE For immediate release
 NEWS RELEASE For immediate release Laura Clark 904 598 7831 LauraClark@RegencyCenters.com Regency Centers Reports Second Quarter 2018 Results JACKSONVILLE, FL. (August 2, 2018) Regency Centers Corporation
SAUL CENTERS, INC Wisconsin Avenue, Suite 1500, Bethesda, Maryland (301)
") SAUL CENTERS, INC. 7501 Wisconsin Avenue, Suite 1500, Bethesda, Maryland 20814-6522 (301) 986-6200 Saul Centers, Inc. Reports Third Quarter 2016 Earnings November 1, 2016, Bethesda, MD. Saul Centers, Inc.
SAUL CENTERS, INC. 7501 Wisconsin Avenue, Suite 1500, Bethesda, Maryland 20814-6522 (301) 986-6200 Saul Centers, Inc. Reports Third Quarter 2016 Earnings November 1, 2016, Bethesda, MD. Saul Centers, Inc.
Select Income REIT Announces Second Quarter Results
 July 28, 2014 Announces Second Quarter Results Generates Normalized FFO of $0.72 Per Share Increases Rental Rates for New and Renewal Leases by 21% and Hawaii Rent Resets by 30.9% Increases Occupancy to
Investor Presentation December 2017
 Investor Presentation December 2017 Cautionary Statement This presentation includes statements concerning our expectations, beliefs, plans, objectives, goals, strategies, future events or performance and
MARGARITAVILLE RESORT CASINO TRANSACTION OVERVIEW JUNE 19, 2018
 MARGARITAVILLE RESORT CASINO TRANSACTION OVERVIEW JUNE 19, 2018 DISCLAIMERS Forward-Looking Statements This presentation contains forward-looking statements within the meaning of the federal securities
Investor Presentation September 2017
 Investor Presentation September 2017 1 Table of Contents Company Overview & 2017 Guidance 3 6 Multifamily Fundamentals 7 11 Camden s Portfolio 12 22 Real Estate Transactions 23 29 Capital Structure & Liquidity
CONSOLIDATED FINANCIAL STATEMENTS
 CONSOLIDATED FINANCIAL STATEMENTS Dundee Real Estate Investment Trust Consolidated Balance Sheets (unaudited) June 30, December 31, (in thousands of dollars) Note 2004 2003 Assets Rental properties 3,4
The St. Joe Company Reports Full Year and Fourth Quarter 2010 Results
 The St. Joe Company Reports Full Year and Fourth Quarter 2010 Results WaterSound, Florida - (March 1, 2011) - The St. Joe Company (NYSE: JOE) today announced a Net Loss for the full year ended 2010 of
Great Elm Capital Group, Inc. An Introduction to the Fort Myers Transaction & GEC s Real Estate Strategy
 Great Elm Capital Group, Inc. An Introduction to the Fort Myers Transaction & GEC s Real Estate Strategy March 6, 2018 2018 Great Elm Capital Group, Inc. Disclaimer Statements in this presentation that
CREATING A FUTURE WORTH LIVING. FOR PATIENTS. WORLDWIDE. EVERY DAY. Third quarter Conference call October 29, 2015
 CREATING A FUTURE WORTH LIVING. FOR PATIENTS. WORLDWIDE. EVERY DAY. Third quarter 2015 Conference call October 29, 2015 Our motivation in numbers 9m 2015 Every 0.8 seconds we provide a dialysis treatment
UNITED STATES SECURITIES AND EXCHANGE COMMISSION FORM 8-K GOVERNMENT PROPERTIES INCOME TRUST
 UNITED STATES SECURITIES AND EXCHANGE COMMISSION WASHINGTON, D.C. 20549 FORM 8-K CURRENT REPORT PURSUANT TO SECTION 13 OR 15(d) OF THE SECURITIES EXCHANGE ACT OF 1934 Date of Report (Date of earliest event
TAUBMAN CENTERS ISSUES STRONG FIRST QUARTER RESULTS
 Taubman Centers, Inc. 200 East Long Lake Road Suite 300 Bloomfield Hills, Michigan 48304-2324 T 248.258.6800 www.taubman.com TAUBMAN CENTERS ISSUES STRONG FIRST QUARTER RESULTS - Comparable Center Net
ALEXANDER & BALDWIN. Premier Hawaii Real Estate Company ANALYST DAY PRESENTATION September 14, 2017
 1 ALEXANDER & BALDWIN Premier Hawaii Real Estate Company ANALYST DAY PRESENTATION September 14, 2017 AGENDA 2 Welcome Opening Remarks Commercial Real Estate Materials & Construction Suzy Hollinger Chris
Glendale, California - PS Business Parks, Inc. (AMEX: PSB), reported operating results for the fourth quarter and the year ending December 31, 2001.
, reported operating results for the fourth quarter and the year ending December 31, 2001.") News Release PS Business Parks, Inc. 701 Western Avenue P.O. Box 25050 Glendale, CA 91221-5050 www.psbusinessparks.com For Release: Immediately Date: January 30, 2002 Contact: Mr. Jack Corrigan (818) 244-8080,
News Release PS Business Parks, Inc. 701 Western Avenue P.O. Box 25050 Glendale, CA 91221-5050 www.psbusinessparks.com For Release: Immediately Date: January 30, 2002 Contact: Mr. Jack Corrigan (818) 244-8080,
News Release. PS Business Parks, Inc. 701 Western Avenue P.O. Box Glendale, CA
 News Release PS Business Parks, Inc. 701 Western Avenue P.O. Box 25050 Glendale, CA 91221-5050 www.psbusinessparks.com For Release: Immediately Date: May 3, 2001 Contact: Mr. Jack Corrigan (818) 244-8080,
DREAM GLOBAL ANNOUNCES FOURTH QUARTER RESULTS, 24% ANNUAL NET ASSET VALUE GROWTH AND OVER 6% FOURTH QUARTER COMPARATIVE NOI GROWTH
 DREAM GLOBAL ANNOUNCES FOURTH QUARTER RESULTS, 24% ANNUAL NET ASSET VALUE GROWTH AND OVER 6% FOURTH QUARTER COMPARATIVE NOI GROWTH TORONTO, FEBRUARY 20, 2019 DREAM GLOBAL REIT (TSX:DRG.UN, FRA:DRG) (or
FOR IMMEDIATE RELEASE: Equity One Reports Fourth Quarter and Year End 2014 Operating Results
 Equity One, Inc. For additional information: 410 Park Avenue, Suite 1220 Mark Langer, EVP and New York, NY 10022 Chief Financial Officer 212-796-1760 FOR IMMEDIATE RELEASE: Equity One Reports Fourth Quarter
NEWS RELEASE For immediate release
 NEWS RELEASE For immediate release Laura Clark 904 598 7831 LauraClark@RegencyCenters.com Regency Centers Updates 2017 and Introduces 2018 Earnings Guidance JACKSONVILLE, Fla. (January 11, 2018) Regency
FY18/12 Q2 PRESENTATION
 FY18/12 Q2 PRESENTATION RENESAS ELECTRONICS CORPORATION JULY 31, 2018 2018 Renesas Electronics Corporation. All rights reserved. FINANCIAL TARGETS AND STRATEGY Long-term Financial Targets *1 (Starting
4th Quarter Quarterly Supplemental
 Quarterly Supplemental 4th Quarter 2017 The Hub Hillcrest Market San Diego, CA Aventura Shopping Center Aventura, FL 4S Commons Town San Diego, CA Investor Relations irinfo@regencycenters.com One Independent
Quarterly dividend per common share
 Corporate Profile First Capital Realty (TSX: FCR) is one of Canada s largest owners, developers and managers of grocery anchored, retailfocused urban properties where people live and shop for everyday
SMART REAL ESTATE INVESTMENT TRUST RELEASES SECOND QUARTER RESULTS FOR 2017 AND ANNOUNCES DISTRIBUTION INCREASE
 SMART REAL ESTATE INVESTMENT TRUST RELEASES SECOND QUARTER RESULTS FOR 2017 AND ANNOUNCES DISTRIBUTION INCREASE TORONTO, ONTARIO - (August 9, 2017) Smart Real Estate Investment Trust ("SmartREIT" or "the
FIRST QUARTER Supplemental Operating and Financial Data. Camden Sotelo - Tempe, AZ
 FIRST QUARTER 2014 Supplemental Operating and Financial Data Camden Sotelo - Tempe, AZ Camden Las Olas - Ft. Lauderdale, FL Year Built - 2004 420 Apartment Homes 97% Average 1st Quarter 2014 Occupancy
3rd Quarter Quarterly Supplemental
 Quarterly Supplemental 3rd Quarter 2018 Mkt at Springwoods Village Spring, TX Calhoun Commons Minneapolis, MN Mellody Farm Vernon Hills, IL El Camino Shopping Center Woodland Hills, CA Mellody Farm Vernon
UNITED STATES SECURITIES AND EXCHANGE COMMISSION Washington, D.C FORM 10-Q
 UNITED STATES SECURITIES AND EXCHANGE COMMISSION Washington, D.C. 20549 FORM 10-Q ý QUARTERLY REPORT PURSUANT TO SECTION 13 OR 15(d) OF THE SECURITIES EXCHANGE ACT OF 1934 For the Quarterly Period Ended
NEWS RELEASE For immediate release
 NEWS RELEASE For immediate release Laura Clark 904 598 7831 LauraClark@RegencyCenters.com Regency Centers Reports First Quarter 2018 Results JACKSONVILLE, FL. (April 30, 2018) Regency Centers Corporation
FOURTH QUARTER RESULTS 2015
 FOURTH QUARTER RESULTS Q4 MANAGEMENT S DISCUSSION AND ANALYSIS AND CONSOLIDATED FINANCIAL STATEMENTS MANAGEMENT S DISCUSSION AND ANALYSIS DECEMBER 31, PART I BASIS OF PRESENTATION Financial data included