PREPARED FOR Mr. David F. Andignac, Vice-Chairman Stonebridge Neighborhood Improvement Beautification District P.O. Box 3696 Harvey, Louisiana 70059
|
|
|
- Bryan Edwards
- 5 years ago
- Views:
Transcription


1 STONEBRIDGE GOLF CLUB OF NEW ORLEANS 1500 Stonebridge Drive Gretna, Jefferson County, Louisiana APPRAISAL REPORT Date of Report: December 15, 2017 Colliers File #: PREPARED FOR Mr. David F. Andignac, Vice-Chairman Stonebridge Neighborhood Improvement Beautification District P.O. Box 3696 Harvey, Louisiana PREPARED BY COLLIERS INTERNATIONAL VALUATION & ADVISORY SERVICES HOSPITALITY & LEISURE GROUP


2 LETTER OF TRANSMITTAL COLLIERS INTERNATIONAL VALUATION & ADVISORY SERVICES HOSPITALITY & LEISURE GROUP 139 S. Hennessey Street New Orleans, Louisiana MAIN FAX WEB December 15, 2017 Mr. David F. Andignac Vice-Chairman Stonebridge Neighborhood Improvement Beautification District P.O. Box 3696 Harvey, Louisiana RE: Stonebridge Golf Club of New Orleans 1500 Stonebridge Drive Gretna, Louisiana Colliers File No.: Dear Mr. Andignac: Pursuant with our engagement, the above captioned property was appraised utilizing best practice appraisal principles for this property type. This appraisal report satisfies the scope of work and requirements agreed upon by Stonebridge Neighborhood Improvement Beautification District and Colliers International Valuation & Advisory Services. At the request of the client, this appraisal is presented in a Restricted Use format as defined by USPAP Standards Rule 2-2(a). Our appraisal format provides summarized description of the appraisal process, subject and market data and valuation analyses. The use of this report is restricted to the client only and the client is advised that the appraiser s opinions and conclusions set forth in this report may not be understood properly without additional information in the appraiser s work file. The subject property, commonly known as Stonebridge Golf Club of New Orleans, is 27-hole semi-private golf club located in Gretna, LA. Club amenities include a clubhouse with golf pro shop, lounge, bar, and administrative offices. The clubhouse is one story throughout the building with 2nd story areas in the left, front-center and right side of the building. The center portion includes the clubhouse, bar, commercial kitchen, storage, offices, dining room, restrooms, pro shop, 2nd floor offices above the covered carport at the front entrance. The left portion is unused by the club, but was previously used for administrative office space, restrooms, former pro shop, locker rooms, card-room and a 2nd floor mezzanine. The right portion includes two unused ballrooms, restrooms and offices on the second floor. The clubhouse was reportedly built in the late 1980s and has a total area of about 36,000 square feet. The portion of the clubhouse that is presently used is wholly appropriate for the club s current needs, though future operators may choose to refurbish the unused space going forward. In our opinion it does not detract from the present semi-private golf club use. Colliers International Valuation & Advisory Services, and certain of its subsidiaries, is an independently owned and operated business and a member firm of Colliers International Property Consultants, an affiliation of independent companies with over 500+ offices throughout more than 63 countries worldwide.
3 LETTER OF TRANSMITTAL The property is situated within Stonebridge subdivision and Lake Timberlane Estates subdivision, on approximately 189 acres. The property fronts the south right-of-way of Stonebridge Drive, the east and west rights-of-way of Lake Timberlane Drive, the north right-of-way of Bayou Barataria, and the east and west rightsof-way of the Verret Canal. It is located in Jefferson Parish, Louisiana. The site is identified as Parcels A, B and C and Lot I, Square 16, Stonebridge Subdivision, and Parcels A, B, C and Tracts FF-I1A-l and FF-11C, Lake Timberlane Estates. The Stonebridge Neighborhood Beautification and Improvement District (SNIBD) is a special taxing district of the Parish of Jefferson and is a political subdivision of the State of Louisiana. SNIBD was created in July 2016 by the Jefferson Parish Council, acting as the governing authority of the Parish of Jefferson, State of Louisiana, under and by virtue of the authority conferred by Article 6, Section 19 of the Louisiana Constitution of 1974, Section 2.01 (7) of the Jefferson Parish Home Rule Charter and under House Bill No. 785 of the Regular Session of the Louisiana Legislature for the year 2016, enacted as R.S. 33: The new taxing district was essentially established with the intent to purchase the subject club, which is under contract to sell for $1.674 million. This value is consistent with the value conclusions of this appraisal. The purpose of this appraisal is to develop certain opinions of value for the subject property in its Fee Simple interest. The following table conveys the final opinions of market value of the subject property that are developed within this appraisal report: FINAL RECONCILED VALUES As Is Upon Stabilization Conclusions December 12, 2017 December 12, 2020 Market Value $1,740,000 $2,070,000 Per Hole $64,444 $76,667 ALLOCATION OF PROPERTY COMPONENTS Component As Is Upon Stabilization Real Property $1,712,000 $2,046,000 Furniture, Fixtures and Equipment $28,000 $24,000 Business $0 $0 Total $1,740,000 $2,070,000 The analyses, opinions and conclusions communicated within this appraisal report were developed based upon the requirements and guidelines of the current Uniform Standards of Professional Appraisal Practice (USPAP), the requirements of the Code of Professional Ethics and the Standards of Professional Appraisal Practice of the Appraisal Institute. The report, in its entirety, including all assumptions and limiting conditions, is an integral part of, and inseparable from, this letter. USPAP defines an Extraordinary Assumption as, an assumption, directly related to a specific assignment, as of the effective date of the assignment results, which, if found to be false, could alter the appraiser s opinions or conclusions. USPAP defines a Hypothetical Condition as, that which is contrary to what is known by the appraiser to exist on the effective date of the assignment results, but is used for the purpose of analysis. The Extraordinary Assumptions and/or Hypothetical Conditions that were made during the appraisal process to arrive at our opinions of value are fully discussed below. We advise the client to consider these issues carefully given the intended use of this appraisal, as their use might have affected the assignment results. EXTRAORDINARY ASSUMPTIONS The prospective market value estimates are based upon market participant attitudes and perceptions existing as of the effective date of our appraisal, and assumes the subject property achieves stabilization as of our prospective date. We assume no material change in the physical characteristics and condition of the subject 2017 COLLIERS INTERNATIONAL VALUATION & ADVISORY SERVICES
4 LETTER OF TRANSMITTAL property or in overall market conditions between the date of inspection and effective dates of value, except for those identified within the report. HYPOTHETICAL CONDITIONS This appraisal does not employ any hypothetical conditions. RELIANCE LANGUAGE Per the engagement contract, there is no reliance language specific to the client's intended use. The Appraisal is for the sole use of the Client; however, Client may provide only complete, final copies of the Appraisal report in its entirety (but not component parts) to third parties who shall review such reports if in connection with loan underwriting or securitization efforts. Colliers International Valuation & Advisory Services is not required to explain or testify as to appraisal results other than to respond to the Client for routine and customary questions. Please note that our consent to allow the Appraisal prepared by Colliers International Valuation & Advisory Services or portions of such Appraisal, to become part of or be referenced in any public offering, the granting of such consent will be at our sole and absolute discretion and, if given, will be on condition that Colliers International Valuation & Advisory Services will be provided with an Indemnification Agreement and/or Non-Reliance letter, in a form and content satisfactory to Colliers International Valuation & Advisory Services, by a party satisfactory to Colliers International Valuation & Advisory Services. Colliers International Valuation & Advisory Services does consent to your submission of the reports to rating agencies, loan participants or your auditors in its entirety (but not component parts) without the need to provide Colliers International Valuation & Advisory Services with an Indemnification Agreement and/or Non-Reliance letter. Colliers International Valuation & Advisory Services hereby expressly grants to Client the right to copy the Appraisal and distribute it to other parties in the transaction for which the Appraisal has been prepared, including employees of Client, other lenders in the transaction, and the borrower, if any. Our opinion of value reflects current conditions and the likely actions of market participants as of the date of value. It is based on the available information gathered and provided to us, as presented in this report, and does not predict future performance. Changing market or property conditions can and likely will have an effect on the subject's value COLLIERS INTERNATIONAL VALUATION & ADVISORY SERVICES
5 LETTER OF TRANSMITTAL The below-undersigned indicate our assurance to the client that the development process and extent of analysis for this assignment adhere to the scope requirements and intended use of the appraisal. If you have any specific questions or concerns regarding the attached appraisal report, or if Colliers International Valuation & Advisory Services can be of additional assistance, please contact the individuals listed below. Sincerely, COLLIERS INTERNATIONAL, VALUATION & ADVISORY SERVICES HOSPITALITY & LEISURE GROUP Jason Lindsey, MAI Valuation Services Director Hospitality and Leisure Group Certified General Real Estate Appraiser State of Louisiana License #G-1762 Expires 12/31/ direct Thomas Bogdon, MAI Executive Managing Director Valuation and Advisory Certified General Real Estate Appraiser State of Louisiana License # G-3786 Expires 12/31/ COLLIERS INTERNATIONAL VALUATION & ADVISORY SERVICES
6 TABLE OF CONTENTS TABLE OF CONTENTS INTRODUCTION 1 Executive Summary 1 Aerial Photograph 3 Subject Property Photographs 4 Identification of Appraisal Assignment 7 Scope of Work 9 DESCRIPTIONS & EXHIBITS 10 Regional Map 10 Regional Analysis 11 Local Area Map 19 Local Area Analysis 20 Site Description 21 Assessment & Taxation 23 Zoning Analysis 26 MARKET ANALYSIS 27 National Golf Market Overview 27 Golf Market Supply & Demand Analysis 35 Highest & Best Use 38 VALUATION 39 Valuation Methods 39 Income Capitalization Approach 41 Sales Comparison Approach 73 Reconciliation of Value Conclusions 77 CERTIFICATION OF APPRAISAL ASSUMPTIONS & LIMITING CONDITIONS ADDENDA Engagement Letter Purchase Agreement Historical Financial Statements Qualifications of the CIVAS Golf Club and Resort Practice Valuation Glossary Qualifications & State Licenses of Appraisers 2017 COLLIERS INTERNATIONAL VALUATION & ADVISORY SERVICES
7 EXECUTIVE SUMMARY GENERAL INFORMATION Name Currently known as Stonebridge Golf Club of New Orleans Address 1500 Stonebridge Drive Gretna, Jefferson County, Louisiana Assessor s Parcel #(s) , , , , Property Rights Appraised PROPERTY DESCRIPTION Site Description Size Zoning Flood Zone The Fee Simple interest 189 acres, or 8,232,840 square feet R1A Improvement Description Number of Holes 27 Quality Condition Highest & Best Use As-Vacant As-Improved AE, described as areas determined to be inundated by the 500 year floodplain (Panel number Flood Panel Number, dated Flood Panel Date.) Average Average To hold as vacant until demand substantiates the development of a residential subdivision. A golf facility as it is currently improved and upgraded in line with market standards COLLIERS INTERNATIONAL VALUATION & ADVISORY SERVICES 1
8 EXECUTIVE SUMMARY VALUATION SUMMARY KEY VALUATION ASSUMPTIONS Category As Is Upon Stabilization Initial Projection Year: Rounds 30,000 35,000 Investment Parameters: Discount Rate 11.25% 10.75% Terminal Capitalization Rate 10.25% 10.25% Implied Capitalization Rate 5.32% 8.86% Other Valuation Considerations: Exposure Time 12 months or less 12 months or less Marketing Time 12 months or less 12 months or less Holding Period 10 Years 10 Years Inflation Rate 3.0% 3.0% ANALYSIS OF VALUE CONCLUSIONS Methodology for As Is Upon Stabilization Market Value Conclusions December 12, 2017 December 12, 2020 Sales Comparison Approach Concluded Value $1,780,000 $2,080,000 Income Approach Discounted Cash Flow $1,740,000 $2,070,000 Direct Capitalization Approach $1,710,000 $1,980,000 Gross Income Multiplier $1,680,000 $1,930,000 Reconciled Value via Income Approach $1,740,000 $2,070,000 Reconciled Value Conclusion $1,740,000 $2,070,000 Per Hole $64,444 $76,667 ALLOCATION OF PROPERTY COMPONENTS Component As Is Upon Stabilization Real Property $1,712,000 $2,046,000 Furniture, Fixtures and Equipment $28,000 $24,000 Business $0 $0 Total $1,740,000 $2,070, COLLIERS INTERNATIONAL VALUATION & ADVISORY SERVICES 2

9 AERIAL PHOTOGRAPH AERIAL PHOTOGRAPH 2017 COLLIERS INTERNATIONAL VALUATION & ADVISORY SERVICES 3


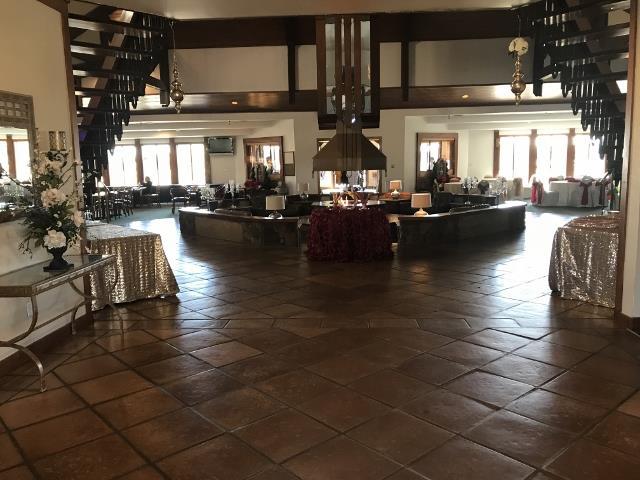


10 SUBJECT PROPERTY PHOTOGRAPHS CLUBHOUSE CLUBHOUSE CLUBHOUSE CLUBHOUSE CLUBHOUSE CLUBHOUSE 2017 COLLIERS INTERNATIONAL VALUATION & ADVISORY SERVICES 4


11 SUBJECT PROPERTY PHOTOGRAPHS UN-RENOVATED CLUBHOUSE SPACE UN-RENOVATED CLUBHOUSE SPACE GOLF COURSE GOLF COURSE GOLF COURSE GOLF COURSE 2017 COLLIERS INTERNATIONAL VALUATION & ADVISORY SERVICES 5


12 SUBJECT PROPERTY PHOTOGRAPHS GOLF COURSE GOLF COURSE GOLF COURSE GOLF COURSE MAINTENANCE FACILITY MAINTENANCE FACILITY 2017 COLLIERS INTERNATIONAL VALUATION & ADVISORY SERVICES 6
13 IDENTIFICATION OF APPRAISAL ASSIGNMENT PROPERTY IDENTIFICATION The subject property, commonly known as Stonebridge Golf Club of New Orleans, is a semi-private golf club. The subject property features all basic services for a property of this type, and offers amenities including 27-hole golf course, clubhouse with golf pro shop, lounge, bar, and administrative offices. The property is situated within Stonebridge subdivision and Lake Timberlane Estates subdivision, on approximately 189 acres. The property fronts the south right-of-way of Stonebridge Drive, the east and west rights-of-way of Lake Timberlane Drive, the north right-of-way of Bayou Barataria, and the east and west rightsof-way of the Verret Canal. It is located in Jefferson Parish, Louisiana. The site is identified as Parcels A, B and C and Lot I, Square 16, Stonebridge Subdivision, and Parcels A, B, C and Tracts FF-I1A-l and FF-11C, Lake Timberlane Estates. We assume no responsibility for matters legal in character, nor do we render any opinion as to title, which is assumed to be marketable. All existing liens, encumbrances, and assessments have been disregarded, unless otherwise noted, and the property is appraised as though free and clear, under responsible ownership, and competent management. CLIENT IDENTIFICATION The client of this specific assignment is Stonebridge Neighborhood Improvement Beautification District. INTENDED USE This report is to be used by Client in connection with investment judgments and to fulfil Louisiana State Bond Commission obligations. INTENDED USERS Stonebridge Neighborhood Improvement Beautification District is the only intended user of this report. Use of this report by third parties and other unintended users is not permitted. This report must be used in its entirety. Reliance on any portion of the report independent of others, may lead the reader to erroneous conclusions regarding the property values. Unless approval is provided by Colliers International Valuation & Advisory Services no portion of the report stands alone. ASSIGNMENT DATES Date of Report December 15, 2017 Date of Inspection December 12, 2017 Market Value As Is December 12, 2017 Prospective Market Value Upon Stabilization December 12, 2020 SUBJECT PROPERTY INSPECTION The subject property was inspected by Jason Lindsey, MAI. PROPERTY RIGHTS APPRAISED The property rights appraised constitute the Fee Simple interest. COMPONENTS OF VALUE The opinions of value include the fee simple interest in the land, the improvements thereto, and the contributory value of the furniture, fixtures and equipment. The appraisers assume that the club will be, and shall remain, open and operational throughout the holding period COLLIERS INTERNATIONAL VALUATION & ADVISORY SERVICES 7
14 IDENTIFICATION OF APPRAISAL ASSIGNMENT PROPERTY AND SALE HISTORY Current Owner Duininck Bros Links LLC. Three-Year Sales History To the best of our knowledge, the subject has not sold in the last three years. Subject Sale Status Based upon discussions with SNIBD representatives, the subject is currently under contract to sell for $1.674 million. The contract price is aligned with the market value conclusions of this appraisal. A copy of the purchase agreement is included in the report addenda. OPERATIONAL ASSUMPTIONS Property Management For purposes of this appraisal, we assume that the subject could be sold free and clear of any and all management contracts, and that future management expenses are market-oriented. Specifically, management fees are projected to equate to 3% percent of total revenue throughout the holding period. General Assumptions For the purposes of this report, we assumed that the subject will be operated by competent and experienced management familiar with the operation of semi-private golf clubs in the United States, and more specifically, in Gretna, Louisiana. In the event that any of the above conditions are not consistent with the subject s actual status, it could have an impact on the subject s overall marketability and underlying market value. DEFINITION OF MARKET VALUE Given the scope and intended use of this assignment, the following definition of market value is applicable in this assignment. A more comprehensive presentation of commonly-adopted definitions is presented in the Addenda of this report. Market Value The most probable price which a property should bring in a competitive and open market under all conditions requisite to a fair sale, the buyer and seller each acting prudently, knowledgeably, and assuming that the price is not affected by undue stimulus. Implicit in this definition is the consummation of a sale as of a specified date and the passing of title from seller to buyer under conditions whereby: 1. Buyer and seller are typically motivated; 2. Both parties are well informed or well advised, and acting in what they consider their own best interests; 3. A reasonable time is allowed for exposure in the open market; 4. Payment is made in terms of cash in United States dollars or in terms of financial arrangements comparable thereto; and 5. The price represents the normal consideration for the property sold unaffected by special or creative financing or sales concessions granted by anyone associated with the sale. 1 1 Office of Comptroller of the Currency (OCC), Title 12 of the Code of Federal Regulation, Part 34, Subpart C - Appraisals, (g); Office of Thrift Supervision (OTS), 12 CFR (g); This is also compatible with the FDIC, FRS and NCUA definitions of market value COLLIERS INTERNATIONAL VALUATION & ADVISORY SERVICES 8
15 SCOPE OF WORK INTRODUCTION The appraisal development and reporting processes requires gathering and analyzing information about those assignment elements necessary to properly identify the appraisal problem to be solved. The scope of work decision must include the research and analyses that are necessary to develop credible assignment results given the intended use of the appraisal. Sufficient information includes disclosure of research and analyses performed and might also include disclosure of research and analyses not performed. The scope of work for this appraisal assignment is outlined below: The appraisers analyzed the regional and local area economic profiles including employment, population, household income, and real estate trends. The local area was further studied to assess the general quality and condition, and emerging development trends for the real estate market. The immediate market area was inspected and examined to consider external influences on the subject. The appraisers verified and analyzed legal and physical features of the subject property including sizes of the site and improvements, flood plain data, seismic zone, zoning, easements and encumbrances, access and exposure of the site, and construction materials and condition of the improvements (as appropriate). This process also included estimating the remaining economic life of the improvements, analysis of the subject s site coverage and parking ratios compared to market standards, a process to identify deferred maintenance and a conclusion of the subject s overall functional utility. The appraisers completed market analyses that included national, regional, local and competitive market overviews. The competitive set overviews analyzed supply/demand conditions. Conclusions were drawn regarding the subject property s competitive position given its physical and locational characteristics, the prevailing economic conditions and external influences. The appraisers conducted a Highest and Best Use analysis, determining the highest and best use of the subject property As-Vacant and As-Improved. The analysis considered legal, locational, physical and financial feasibility characteristics of the subject property. Development of the Highest and Best Use As- Improved explored potential alternative treatments of the property including demolition, expansion, renovation, conversion, and continued use "as-is." The appraisers analyzed financial features of the subject property including historical and budgeted income/expense data, as provided. This information, as well as trends established by market indicators, was used to forecast performance of the subject property. The appraisal considered the three standard approaches to value: Income Capitalization, Sales Comparison, and Cost. Because golf club facilities are income-producing properties that are normally bought and sold on the basis of capitalization of their anticipated stabilized earning power, the greatest weight is given to the value indicated by the income capitalization approach. We find that most golf asset investors employ a similar procedure in formulating their purchase decisions, and thus the Income Capitalization Approach most closely reflects the rational of typical buyers. When appropriate the Sales Comparison and Cost Approaches are used to test the reasonableness of the results indicated by the income capitalization approach. The reasoning for including or excluding traditional approaches to value is developed within the Valuation Methodology section. Reporting of this appraisal is in an Appraisal Report format as required in USPAP Standard 2. The appraiser s analysis and conclusions are fully described within this document. We understand the Competency Rule of USPAP and, at a minimum, the primary author of this report meets the standards. No one provided significant real property appraisal assistance to the appraisers signing the certification COLLIERS INTERNATIONAL VALUATION & ADVISORY SERVICES 9

16 REGIONAL MAP 2017 COLLIERS INTERNATIONAL VALUATION & ADVISORY SERVICES 10
17 REGIONAL ANALYSIS INTRODUCTION The economic condition of a market is an important consideration in forecasting golf rounds and income potential. Historical economic and demographic trends that reflect the quantity of transient visitation provide basis for the projection of golf demand. The short and long-term value of real estate is influenced by a variety of factors and forces that interact within a given region. Regional analysis serves to identify those forces that affect property value and the role they play within the region. The four primary forces that influence real property value include environmental characteristics, governmental forces, social factors, and economic trends. These forces determine the supply and demand for real property which, in turn, affects market value. The intent of the regional analysis is to review all relevant historical and projected demographic data to determine whether the subject market area and neighborhood are likely to experience economic growth, stability, or decline in the future. These trends are correlated based on their propensity to reflect lodging demand variations. New Orleans Metairie Kenner, or the Greater New Orleans Region (as it is often called by the Louisiana Tourism Commission) is a metropolitan area designated by the United States Census encompassing seven parishes (the Louisiana equivalent of other states' counties) in the state of Louisiana, centering on the city of New Orleans. The Mississippi River, running from north to south, divides the United States into eastern and western halves. In southeast Louisiana, though, newcomers are frequently confused by the terms "East Bank" and "West Bank" since, due to the curves of the Mississippi River, what is called the "Eastbank" is sometimes located geographically to the west of what is called the "Westbank" and vice versa. The banks also lie to the north and south of the river throughout most of the region. In southeast Louisiana, the term "Eastbank" is often used to refer to any area that lies on the eastern half of the United States, as established by its location on the eastern bank of the Mississippi River, while the term "Westbank" is often used to refer to areas along the opposite side of the river. These terms are used in urban, suburban and rural parishes that are bisected by the Mississippi River, which include St. John the Baptist, St. Charles, Jefferson, Orleans and Plaquemines. In the New Orleans metropolitan area, the term "Eastbank" is a blanket term used to refer to all portions of metropolitan New Orleans south of Lake Pontchartrain and situated on the "eastern" bank of the river, while the term "Westbank" is used to refer to all portions of metropolitan New Orleans south of Lake Pontchartrain and situated on the "western" bank of the river. Somewhat perversely, while New Orleans residents would never describe a neighborhood as being located north or south of the river, the Westbank is, in actual fact, as a whole located to the south of the Mississippi River, while the Eastbank as a whole is located to the north and is itself wedged between the Mississippi River and the southern shore of Lake Pontchartrain (the Eastbank's northern boundary). The majority of the population of metropolitan New Orleans resides on the Eastbank. The Eastbank of Greater New Orleans includes all of Jefferson Parish (including the suburbs of Metairie, Kenner, River Ridge, Harahan, Elmwood, and Jefferson) that lies on the eastern bank of the river and most of Orleans Parish (including the majority of the city of New Orleans). Also, further down the Mississippi River are those suburbs of New Orleans that are located in St. Bernard Parish, which include Arabi, Chalmette, and Meraux (and, also, Violet and Poydras). All of St. Bernard Parish is located east of the river, extending from the eastern bank of the river back into the marshlands COLLIERS INTERNATIONAL VALUATION & ADVISORY SERVICES 11
18 REGIONAL ANALYSIS The Westbank of suburban New Orleans includes the all of Jefferson Parish (including the suburbs of Waggaman, Avondale, Bridge City, Nine Mile Point, Westwego, Marrero, Harvey, Gretna, Terrytown, Jean Lafitte, Lafitte, Crown Point, Barataria, Estelle, Timberlane, and Woodmere) that lies on the western bank of the river and a portion of Orleans Parish (including the New Orleans communities of Algiers and English Turn). Further down the Mississippi River is the suburb of Belle Chasse, which is located on the West Bank of Plaquemines Parish. Plaquemines Parish both encompasses and is bisected by the final leg of the Mississippi River before it enters the Gulf of Mexico (downriver from Belle Chasse, Plaquemines Parish has numerous rural communities scattered along both banks of the river, but none of these communities have a population greater than 5,000). It should be noted that the terms "Eastbank" and "Westbank" are spelled as one word in local/official terminology when being applied to the Greater New Orleans area. "Northshore" The term "Northshore" or "North Shore" refers to areas that lie on the northern shore of Lake Pontchartrain and includes St. Tammany Parish. The Northshore includes the communities of Mandeville, Covington, Madisonville, Abita Springs, Lacombe, Eden Isle and Slidell. Hammond and Ponchatoula, in Tangipahoa Parish, and Bogalusa and Franklinton, in Washington Parish, are also considered to have economic ties to Greater New Orleans although those parishes are frequently not included in the statistics for the New Orleans Metropolitan Area. The Northshore region is also part of the Florida Parishes, dating back to the time when the Spanish territory known as Florida extended westward all the way to the Mississippi River, including portions of what are now Alabama, Mississippi and Louisiana. St. Tammany Parish is the most affluent parish in metropolitan New Orleans and is also the most politically conservative. "River Parishes" The term "River Parishes" refers to those parishes along the Mississippi River between New Orleans and Baton Rouge. The two River Parishes nearest to New Orleans are St. Charles (including the cities of Destrehan, Luling, St. Rose and Hahnville) and St. John the Baptist (including the cities of Laplace and Reserve). REGIONAL DEMOGRAPHIC ANALYSIS The following is a demographic study of the region sourced by Pitney Bowes/Gadberry Group - GroundView, an on-line resource center that provides information used to analyze and compare the past, present, and future trends of geographical areas. Demographic changes are often highly correlated to changes in the underlying economic climate. Periods of economic uncertainty necessarily make demographic projections somewhat less reliable than projections in more stable periods. These projections are used as a starting point, but we also consider current and localized market knowledge in interpreting them within this analysis. Population According to Pitney Bowes/Gadberry Group - GroundView, a Geographic Information System (GIS) Company, the New Orleans-Metairie metropolitan area had a 2017 total population of 1,279,028 and experienced an annual growth rate of 1.0%, which was higher than the Louisiana annual growth rate of 0.5%. The metropolitan area accounted for 27.2% of the total Louisiana population (4,696,543). Within the metropolitan area the population density was 282 people per square mile compared to the lower Louisiana population density of 100 people per square mile and the lower United States population density of 90 people per square mile COLLIERS INTERNATIONAL VALUATION & ADVISORY SERVICES 12
19 REGIONAL ANALYSIS POPULATION YEAR US LA CBSA 2010 Total Population 308,745,538 4,533,372 1,192, Total Population 325,389,970 4,696,543 1,279, Total Population 338,156,319 4,795,196 1,328, CAGR 0.8% 0.5% 1.0% CAGR 0.8% 0.4% 0.8% Source: Pitney Bowes/Gadberry Group - GroundView POPULATION DENSITY YEAR US LA CBSA 2017 Per Square Mile Per Square Mile Source: Pitney Bowes/Gadberry Group - GroundView The 2017 median age for the metropolitan area was 37.86, which was the same as the United States median age of for The median age in the metropolitan area is anticipated to grow by 0.35% annually, increasing the median age to by MEDIAN AGE YEAR US LA CBSA CAGR 0.34% 0.40% 0.35% Source: Pitney Bowes/Gadberry Group - GroundView Education A large number of institutions of higher education exist within the city, including Tulane University and Loyola University New Orleans, the city's major private universities. These universities also administer the city's three professional schools, Tulane University School of Medicine, Tulane University Law School and Loyola University New Orleans College of Law. The University of New Orleans is a large public research university in the city. Dillard University, Southern University at New Orleans and Xavier University of Louisiana are among some of the leading historically black colleges and universities in the United States (Xavier being the only predominantly black Catholic university in the U.S.) Louisiana State University School of Medicine is the state's flagship public university medical school, which also conducts research. Our Lady of Holy Cross College, Notre Dame Seminary and the New Orleans Baptist Theological Seminary are several smaller religiously affiliated universities. Other notable schools include Delgado Community College, the William Carey College School of Nursing, the Culinary Institute of New Orleans, Herzing College, and Commonwealth University. Household Trends The 2017 number of households in the metropolitan area was 498,036. The number of households in the metropolitan area is projected to grow by 0.6% annually, increasing the number of households to 513,834 by The 2017 average household size for the metropolitan area was 2.53, which was -3.12% smaller than the United States average household size of 2.61 for The average household size in the metropolitan area is anticipated to grow by 0.15% annually, raising the average household size to 2.55 by NUMBER OF HOUSEHOLDS YEAR US LA CBSA ,586,527 1,810, , ,270,369 1,863, ,834 CAGR 0.8% 0.6% 0.6% Source: Pitney Bowes/Gadberry Group - GroundView 2017 COLLIERS INTERNATIONAL VALUATION & ADVISORY SERVICES 13


20 REGIONAL ANALYSIS AVERAGE HOUSEHOLD SIZE YEAR US LA CBSA CAGR 0.03% (0.15%) 0.15% Source: Pitney Bowes/Gadberry Group - GroundView The New Orleans-Metairie metropolitan area had 182,826 renter occupied units, compared to the higher 593,011 in Louisiana and the higher 42,358,761 in the United States. HOUSING UNITS US LA CBSA Owner Occupied 79,227,766 1,217, ,210 Renter Occupied 42,358, , ,826 Source: Pitney Bowes/Gadberry Group - GroundView The 2017 median household income for the metropolitan area was $49,307, which was -12.1% lower than the United States median household income of $56,114. The median household income for the metropolitan area is projected to grow by 1.7% annually, increasing the median household income to $53,658 by According to the American Chamber of Commerce Researchers Association (ACCRA) Cost of Living Index, the subject s regional cost of living is compared to the national average score of 100. The ACCRA Cost of Living Index compares groceries, housing, utilities, transportation, health care and miscellaneous goods and services for over 300 urban areas. MEDIAN HOUSEHOLD INCOME YEAR US LA CBSA 2017 $56,114 $46,840 $49, $59,476 $50,830 $53,658 CAGR 1.2% 1.6% 1.7% Source: Pitney Bowes/Gadberry Group - GroundView Consumer Spending New Orleans-Metairie Eating Out, 15.28% Health Care, 22.10% Hsld Furnishings, 9.31% Food at Home, 20.39% Entertainment, 14.43% Apparel, 9.37% Computers, 2.09% Education, 6.53% Auto Maint., 0.51% 2017 COLLIERS INTERNATIONAL VALUATION & ADVISORY SERVICES 14

21 REGIONAL ANALYSIS $5,000 Consumer Spending Comparison Average Household $4,000 $3,000 $2,000 $1,000 $0 United States Louisiana New Orleans-Metairie Employment Total employment has increased annually over the past decade in the state of Louisiana by 0.3% and increased annually by 1.4% in the area. From 2015 to 2016 unemployment decreased in Louisiana by 0.2% and decreased by 0.5% in the area. In the state of Louisiana unemployment has decreased over the previous month by 0.3% and decreased by 0.4% in the area. 6.5% UNEMPLOYMENT RATES 6.0% 5.5% 5.0% 4.5% 4.0% 3.5% Oct 2016 Nov 2016 Dec 2016 Jan 2017 Feb 2017 Mar 2017 Apr 2017 May 2017 Jun 2017 Jul 2017 Aug 2017 Sep 2017 USA 4.7% 4.4% 4.5% 5.1% 4.9% 4.6% 4.1% 4.1% 4.5% 4.6% 4.5% 4.1% Louisiana 5.9% 5.4% 5.4% 6.1% 5.4% 5.4% 5.6% 5.5% 5.9% 5.6% 5.6% 5.3% Area 5.4% 4.9% 4.8% 5.4% 4.9% 4.9% 5.1% 5.0% 5.5% 5.3% 5.4% 5.0% 2017 COLLIERS INTERNATIONAL VALUATION & ADVISORY SERVICES 15
22 REGIONAL ANALYSIS EMPLOYMENT & UNEMPLOYMENT STATISTICS TOTAL EMPLOYMENT UNEMPLOYMENT RATE Louisiana New Orleans-Metairie, LA Metropolitan Statistical Area Year Total % Yr Ago Total % Yr Ago United States* Louisiana New Orleans- Metairie, LA Metropolitan Statistical Area ,944, % 501, % 4.6% 4.3% 4.0% ,982, % 517, % 5.8% 4.9% 4.9% ,923,884 (3.0%) 507,788 (1.9%) 9.3% 6.8% 6.7% ,919,852 (0.2%) 526, % 9.6% 8.0% 7.7% ,911,021 (0.5%) 525,642 (0.2%) 8.9% 7.8% 7.7% ,933, % 531, % 8.1% 7.1% 7.1% ,964, % 544, % 7.4% 6.7% 6.6% ,015, % 560, % 6.2% 6.4% 6.3% ,024, % 569, % 5.3% 6.3% 6.0% ,992,125 (1.6%) 565,724 (0.6%) 4.9% 6.1% 5.5% CAGR 0.3% - 1.4% Source: U.S. Bureau of Labor Statistics *Unadjusted Non-Seasonal Rate Economy New Orleans recovery from the devastating economic and demographic effects of Hurricane Katrina was nipped in the bud by the recession that followed some three years later. The losses in average employment seen in the local Metropolitan Statistical Area (MSA) in 2009 and 2010 were small alongside what much of the nation endured at the time. Measured against the recession, New Orleans recovery is complete. New Orleans has new industries emerging and taking the economy by the reins. New Orleans ranked third behind tech stalwarts San Jose and San Francisco on Forbes June list of best cities for information jobs, a notable departure for an area associated more with oil and gas, tourism, and port activity than high-technology. New Orleans is now drawing praise from national publications which tout the city s vibrant economy, which is characterized by its historical mainstays, the AP reported in June. According to a June report in The Advocate, Metro New Orleans had a 28% increase in information employment from 2009 to 2012, thanks to growth in the city s tech sector. That includes video games and software development, and the thriving movie and TV industry. General Electric recently placed a new technology center and 300 jobs in New Orleans. Forbes said General Electric and a number of other firms are putting high-tech jobs in low-cost locations. GE and video game developers Gameloft and High Voltage Software are among the big names to open development shops in the city, lured in part by the digital media tax incentives. New Orleans startups, which formed at a per capita rate 64 percent higher than the national average from 2011 to 2013, are also in growth mode. As of May 2014, the greater New Orleans area employed more than 6,500 tech professionals, ranging from information systems analysts to software developers and computer programmers. The Louisiana Workforce Commission projects information security analysts and software developers will be among the fastest growing jobs in the region over the next decade alongside jobs like home health aides and medical records technicians. All the same, however, recent job growth has been positive but less than robust. New Orleans job growth has been poised on the razor between positive and negative movement the past 24 months. Most sectors saw increases in employment totals over the latest measured 12-month span. The local housing market also shows signs of improvement. According to RealtyTrac as reported by New Orleans CityBusiness, the number of foreclosed homes in the New Orleans metropolitan area was down nearly 25% in June year-over-year COLLIERS INTERNATIONAL VALUATION & ADVISORY SERVICES 16
23 REGIONAL ANALYSIS New Orleans, being a major destination-city of Louisiana, is as much involved with the oil and natural gas industry as it is with tourism. New Orleans has been transitioning away from a purely tourism based economy in the most recent pre-katrina and following post-katrina years. The city has been able to reinvent itself in a way that is healthy and attractive to outside employers. In the end of 2015 and beginning of 2016 New Orleans completed construction on what is to become a booming new medical center. The University Medical Center commenced construction before Katrina and was delayed until its August date due to the hurricane s lasting impact. The hospitals construction schedule was able to recover post-katrina and eventually produced a high-end innovative final product. This theme has permeated New Orleans in recent years, reflected by the surge of tech-industry professionals and businesses to NOLA. A city with rich history down on its luck was devastated by an immense natural and economic disaster, yet despite having the cards stacked against New Orleans it remained determined to recover and rebuild into a region of job growth and innovation while still remaining in touch with its roots. TOP EMPLOYERS EMPLOYER NAME EMPLOYEES INDUSTRY Louisiana State University Health 7,000 Healthcare Ingalls Shipbuilding 6,000 Manufacturing Hilton-New Orleans Riverside 5,000 Hotels LSU Public Hospital 5,000 Healthcare Ochsner Medical Ctr-Emerg Dept 5,000 Healthcare Tulane University 5,000 Education US Post Office 4,000 Government University of New Orleans 3,114 Education East Jefferson General Hosp 3,000 Healthcare Jazz Casino Co LLC 3,000 Casino Physician Referral 3,000 Healthcare North Oaks Health System 2,700 Healthcare Lockheed Martin Manned Space 2,500 Manufacturing Harrah's New Orleans Casino 2,400 Casino NASA 2,000 Government Tulane University Hospital 2,000 Healthcare Ventilator Assisted Care Prgm 2,000 Healthcare Source: acinet.org Airport Statistics The following chart summarizes the local airport statistics. LOUIS ARMSTRONG NEW ORLEANS INTERNATIONAL AIRPORT (MSY) YEAR ENPLANED PASSENGERS % CHG ,912, ,127,963 (20.1%) ,770, % ,990, % ,916,746 (1.8%) ,088, % ,255, % ,293, % ,576, % ,870, % ,329, % Source: U.S. Department of Transportation 2017 COLLIERS INTERNATIONAL VALUATION & ADVISORY SERVICES 17
24 REGIONAL ANALYSIS SUMMARY Now more than 10 years removed from the disaster that was Hurricane Katrina, New Orleans had the highest population growth in the country for any city over the size of 100,000. The city s rate of population growth (1.2 percent) remains above the national average of 0.8 percent. As stated by NPR.org, Katrina was one of the biggest disasters in American History, along with a decade of major reconstruction, had little effect on the longterm population trends shaping the region: minority migration to the suburbs, a growing Hispanic community, and more diversity overall. Just as with most Gulf Coast states Louisiana and New Orleans are feeling the drag of low oil prices. New Orleans has the advantage of being a timeless and historic city. The enticing draw of Cajun seafood, true-to-roots jazz music, and French quarter architecture, now aided by new-age tech opportunities and a booming medical center, will continue to propel New Orleans as a Gulf Coast destination city popular around the world well into the foreseeable future. In the next section, we analyze economic and demographic characteristics of the local area; these trends are tied to the regional data, and prompt deeper investigation in order to ascertain the durability of the subject s going concern COLLIERS INTERNATIONAL VALUATION & ADVISORY SERVICES 18

25 LOCAL AREA MAP 2017 COLLIERS INTERNATIONAL VALUATION & ADVISORY SERVICES 19
26 LOCAL AREA ANALYSIS LOCAL AREA OUTLOOK The average household income in the subject s immediate area and the subject s greater market area is experiencing a stage of growth. It is well below the national average of $74,699 in both the subject s greater market area and immediate area. The Westbank is a secondary market that is heavily dependent on port-related activity from along the Harvey Canal, as well as a direct dependence on the City of New Orleans. The subject s market area is best defined as the City of Gretna. Gretna is the second-largest city and parish seat of Jefferson Parish and is located on the west bank of the Mississippi River, just east and across the river from uptown New Orleans. It is part of the New Orleans Metairie Kenner Metropolitan Statistical Area. As delineated on the map below, Gretna is bounded to the north by the southern bank of the Mississippi River and LB Landry Avenue/Whitney Avenue to the east, while the western and southern boundaries are less rigidly defined. Generally speaking, the current economic state of the Gretna market mirrors the overall themes at play in the Westbank Jefferson Parish area COLLIERS INTERNATIONAL VALUATION & ADVISORY SERVICES 20
27 SITE DESCRIPTION General Description Shape Topography Utilities Seismic Flood Zone Flood Zone Description Easements Soils Hazardous Waste Site Utility Access Rating Visibility Rating Location Rating Overall Site Rating Stonebridge Golf Club of New Orleans property is situated within Stonebridge subdivision and Lake Timberlane Estates subdivision, on approximately 189 acres. The property fronts the south right-of-way of Stonebridge Drive, the east and west rights-of-way of Lake Timberlane Drive, the north right-of-way of Bayou Barataria, and the east and west rights-of-way of the Verret Canal. It is located in Jefferson Parish, Louisiana. The site is identified as Parcels A, B and C and Lot I, Square 16, Stonebridge Subdivision, and Parcels A, B, C and Tracts FF-I1A-l and FF-11C, Lake Timberlane Estates. The subject site measures ±189, or ±8,232,840 square feet. Irregularly shaped Level at street grade It is our understanding that all utilities are available to the site. The subject is in a low-risk seismic zone. AE and X An area determined to be inundated by the 500 year floodplain but protected by levee. During the on-site inspection, no adverse easements or encumbrances were noted. This appraisal assumes that there is no negative value impact on the subject improvements. If questions arise regarding easements, encroachments, or other encumbrances, further research is advised. A detailed soils analysis was not available for review. Based on the development of the subject, it appears the soils are stable and suitable for the existing improvements. We not conducted an independent investigation to determine the presence or absence of toxins on the subject property. If questions arise, the reader is strongly cautioned to seek qualified professional assistance in this matter. Please see the Assumptions and Limiting Conditions for a full disclaimer. Overall, it is our opinion that the subject site is adequate for the operation of the subject golf club. Good Good Good Overall, it is our opinion that the subject site is considered to be good when measured against competing properties in the marketplace COLLIERS INTERNATIONAL VALUATION & ADVISORY SERVICES 21


28 SITE DESCRIPTION SITE MAPS 2017 COLLIERS INTERNATIONAL VALUATION & ADVISORY SERVICES 22
29 ASSESSMENT & TAXATION INTRODUCTION Property (or ad valorem) tax is one of the primary revenue sources of municipalities. Based on the concept that the tax burden should be distributed in proportion to the value of all properties within a taxing jurisdiction, a system of assessments is established. Theoretically, the assessed value placed on each parcel bears a definite relationship to market value, so properties with equal market values will have similar assessments and properties with higher and lower values will have proportionately larger and smaller assessments. We note that government appraised values for lodging facilities across the United States are typically quite different from actual estimated market value. This disparity is due to the mass-appraisal techniques used by a jurisdiction to appraise a vast array of property within a very short period of time. Due to the complicated valuation practices required in golf properties, the appraiser can typically not dedicate any significant amount of time to any individual asset. For this reason, the government-appraised value should usually not be relied upon as an indication of actual market value. The assessed value and property tax for the current year are summarized in the following table. Property Assessment Information , , , , Assessor's Parcel Number(s): Stonebridge Street Address: Drive Assessing Authority: Parish of Jefferson Current Tax Year: 2017 Are taxes current? Taxes are current Is there a grievance underway? Not to our knowledge Historical Tax Trend - Subject Year Assessment % Change 2017 (Current) $354, Actual Assessment Information Assessed Value Totals Land Value: $238,360 Building Value: $116,210 Total Real Property Assessment: $354,570 Personal Property: $28,020 Total Effective Taxable Assm't: $382,590 Tax Liability Total Effective Tax Rate % Taxes due Real Estate $41,265 Taxes due Personal Property $3,261 Total Property Taxes $44,526 Number of Holes: 27 Property Taxes per Unit $1,649 Building Area ( SF ) 36,003 Property Taxes per Square Foot $ COLLIERS INTERNATIONAL VALUATION & ADVISORY SERVICES 23
30 ASSESSMENT & TAXATION ASSESSMENT & TAXATION DESCRIPTION As part of the scope of work, we researched assessment and tax information related to the subject property. The following are key factors related to local assessment and taxation policy. Commercial property in the State of Louisiana is assessed at 10% of land value and 15% of improvement value. It is understood that a sale in this jurisdiction may trigger a reassessment, and although there may be a discrepancy between the indicated parish-appraised and market value, the subject s per-unit assessment relative to comparable properties is below market, but considering the subject is the only 27-hole property, current levels are reasonable. Therefore, it is not likely that a substantial reassessment would occur immediately following a sale. Based on this information, it is apparent that the subject s assessments are market levels. It is our understanding that taxes are current. However, we recommend performing a title and tax lien search to properly ascertain the situation of delinquent taxes, if any. If taxes are in fact delinquent, the marketability of the subject could be negatively impacted. TAX COMPARABLES In order to determine if the assessment and taxes on the subject property are reasonable, we considered historical information, as well as information from similar properties in the market. They are illustrated in the table below. Real Estate Tax Assessment Comparables Property (Year Built) Holes Total Assm't Assm't per Hole Timberlane Country Club 18 $576,800 $32,044 Lakewood Golf Club 18 Orleans Parish -- Joseph M. Bartholomew 18 Orleans Parish -- TPC Louisiana (Tax Comp Only) 18 $1,372,510 $76,251 Chateau Golf & Country Club (Tax Comp Only) 18 $910,260 $50,570 Survey Low 18 $576,800 $32,044 Survey High 18 $1,372,510 $76,251 Survey Average 18 $953,190 $52,955 Subject's Assessment (Actual): 27 $354,570 $13,132 Real Property Tax Assessments Are: Below market levels Real Estate Tax Expense Comparables Property (Year Built) Holes R.E. Taxes Taxes per Hole Timberlane Country Club 18 $69,216 $3,845 Lakewood Golf Club Joseph M. Bartholomew TPC Louisiana (Tax Comp Only) 18 $151,374 $8,410 Chateau Golf & Country Club (Tax Comp Only) 18 $75,351 $4,186 Survey Low 18 $69,216 $3,845 Survey High 18 $151,374 $8,410 Survey Average 18 $98,647 $5,480 Subject's Assessment (Actual): 27 $41,265 $1,528 Real Property Tax Payments Are: Below market levels TAX PROJECTION As mentioned, the subject's overall tax expense during the most recent full tax year equated to $44,526. It has been determined that historical taxes are at market levels. In order to ascertain the total tax burden on a going-forward basis, we have considered a variety of factors including the current condition of the property, the amount of capital that is expected to be committed to the 2017 COLLIERS INTERNATIONAL VALUATION & ADVISORY SERVICES 24
31 ASSESSMENT & TAXATION physical plant and the FF&E in the short term, the assessment levels at comparable properties in the area and, most prominently, the expected operational performance of the property through the date of stabilization. We observe that there is a fairly strong correlation between the trends of a club s certain operational metrics and those of its actual tax costs. This is because the value of the tangible components of a golf club are more elastic relative to other property types due to the seasonality and cyclical nature of its revenue sources, notwithstanding there is a higher propensity for intangible value to exist in a golf club which, in the subject's jurisdiction, is not taxed. The most relevant line item of comparison, therefore, is house profit. It is at this level of the business activity of a club where all (or at least a substantial amount) of a property's intangible value has already been accounted for and stripped from the ownership position. (We call your attention to the reconciliation section of this document which describes the rationale behind the absence of any business value associated with this appraisal.) Any swings in operating activities by way of, for example, a renovation would have a commensurate impact on the property's market value. Therefore, there is an intuitive relationship between a club s taxable value and its operating characteristics. Since the house profit line item calculation is dependent on a number of individual revenue and expense components each of which possess the certain fixed and variable characteristics that will be discussed later in this report it is logical to conclude that a portion of any of its dependent variables (tax expense in this case) will be variable. However, given the level of expenses that have already been deducted prior to the calculation of house profit, the majority of the tax expense as it relates to house profit will be fixed. CONCLUSION The following table summarizes our tax projection as measured against house profit over the first five projection years. Please note that, since we have modeled there to be some degree of fixed behavior in the tax burden projection, the nominal percentage change in the tax projection (or, the growth rate s disparity from the inflation rate of 3.0%) is tempered relative to the house profit line item. Tax Projection - First Five Years Period House Profit Pct. Change Tax Projection* Pct. Change Base Year ** $148,147 - $44,526 - Year /18 $201, % $45, % Year /19 $225, % $47, % Year /20 $317, % $48, % Year /21 $303, % $50, % Year /22 $313, % $51, % *We have modeled the fixed/variable components of the tax expense line item to be 100% and 0% respectively. **Base Year House Profit adjusted to account for market-oriented income and expenses COLLIERS INTERNATIONAL VALUATION & ADVISORY SERVICES 25
32 ZONING ANALYSIS INTRODUCTION Zoning requirements typically establish permitted and prohibited uses, building height, lot coverage, setbacks, parking and other factors that control the size and location of improvements on a site. The zoning characteristics for the subject property are summarized below: ZONING SUMMARY Zoning Municipality Zoning Name Permitted Uses Current Use Legally Permitted Zoning Change Proposed Use Legally Permitted and/or Conforming Use City of Gretna R1A The property is currently subject to restrictive covenants effective May 12, 1989 that restricts the use to a private or public golf course through May 11, After this date the property may be used for residential, industrial or Hotel Yes Not likely Hotel Yes NOTES REGARDING CONFORMANCE An existing or proposed use that conforms to zoning regulations implies that there is no legal risk and that the existing improvements could be replaced as-of-right. Pre-Existing, Non-Conforming Uses - In many areas, existing buildings pre-date the current zoning regulations. When this is the case, it is possible for an existing building that represents a non-conforming use to still be considered a legal use of the property. Whether or not the rights of continued use of the building exist depends on local laws. Local laws will also determine if the existing building may be replicated in the event of loss or damage. Non-Conforming Uses - A proposed non-conforming use to an existing building might remain legal via variance or special use permit. When appraising a property that has such a non-conforming use, it is important to understand the local laws governing this use. Other Restrictions - We know of no deed restrictions, private or public, that further limit the subject property's use. The research required to determine whether or not such restrictions exist is beyond the scope of this appraisal assignment. Deed restrictions are a legal matter and only a title examination by those qualified such as an attorney or title company can uncover such restrictive covenants. We recommend a title examination to determine if any such restrictions exist. ZONING CONCLUSIONS Detailed zoning studies are typically performed by a zoning or land use expert, including attorneys, land use planners, or architects. The depth of our analysis correlates directly with the scope of this assignment, and it considers all pertinent issues that have been discovered through our due diligence. Please note that this appraisal is not intended to be a detailed determination of compliance, as that determination is beyond the scope of this real estate appraisal assignment COLLIERS INTERNATIONAL VALUATION & ADVISORY SERVICES 26
33 NATIONAL GOLF MARKET ANALYSIS NATIONAL GOLF MARKET ANALYSIS The market analysis section provides a comprehensive study of supply/demand conditions, examines transaction trends, and interprets ground level information conveyed by market participants. Based on these findings and an analysis of the subject property, conclusions are drawn with regard to the subject s competitive position within the marketplace. Below is a list of the various sections covered in the following Golf Market Analysis: National Golf Market Overview Local Golf Market Overview Broker/Market Participant Interviews Transaction Trends Subject Property Analysis NATIONAL GOLF MARKET OVERVIEW NGF INDUSTRY OVERVIEW The following information has been taken directly from the National Golf Foundation 2017 Industry Overview. Operators in this industry operate golf courses and country clubs. Establishments may also offer food and beverage services, memberships, equipment rentals, golf instruction and other services. Golf courses can be public, private, semiprivate, or part of a country club. This industry excludes driving ranges, miniature golf courses and golf course resorts and hotels. INDUSTRY PERFORMANCE Executive Summary The golf industry, not unlike many other aspects of society, is adapting to cultural and behavioral changes while growing and consolidating simultaneously. Golfers are increasingly participating and spending in new modalities in ways that those from the era of the persimmon driver never could have envisioned. Meanwhile, course owners and operators as a whole have shifted focus when it comes to investment, pumping money into renovating, updating or improving aging facilities rather than building more new courses in an oversupplied market. Golf-related businesses continue to face a highly-competitive environment, as the sport not only confronts challenges from other recreational activities, but significant hurdles of a financial, cultural and socioeconomic nature. While golf is the No. 1 outdoor pay for-play individual participation sport in the U.S., the reality is that its revenues and spending will always be vulnerable to outside forces such as weather and the economy. The game remains incredibly popular, however, and there is reason for significant optimism despite the negative portrayal of the overall health of the industry common in the mainstream media. Golf welcomed a record number of newcomers in 2016, more than during the height of the Tiger Woods era, and there remains a significant pool of people interested in taking up the game. That bodes well for the future, as does the fact that rounds-played have increased slightly the past two years and economic indicators are skewing in a positive direction. New measures of engagement are providing a more comprehensive picture of golf s overall consumer base. While the number of on-course golfers has declined incrementally in recent years, commitment to the sport in many respects is more evident than ever before. The pool of the game s most devoted participants those who account for approximately 95% of all rounds-played and spending rose for the first time in five years, to 20.1 million. Many of these consumers are changing their buying habits. As in the retail industry as a whole, golfers are increasingly turning to the internet, often at the expense of brick-and-mortar stores, which in turn have sought 2017 COLLIERS INTERNATIONAL VALUATION & ADVISORY SERVICES 27
34 NATIONAL GOLF MARKET ANALYSIS to adapt by offering more services (lessons, clinics, repair) and experiential opportunities (club fittings, launch monitors, simulators) to complement their sales of equipment and/or apparel. Most noteworthy for the golf industry is the 11% increase in off-course participation, from the popular facilities like Topgolf and Flying Tee to the indoor simulators found in facilities like PGA Tour Superstore and GOLFZON. Of the estimated 20 million off-course participants in 2016, more than 40% didn t play on an actual golf course. And when combining both on-course and off-course participation (and accounting for those people who did both), golf s overall consumer base increased to 32 million in 2016, up from 31.1 million a year earlier. Research shows that those people who hit golf balls with a club at off-course locations whether Topgolf or a standard driving range are more likely to play golf on an actual course at some point. That might be one reason that NGF studies found that the number of non-golfers expressing the highest level of interest in playing golf increased by 7.6% to 12.8 million. The number of people who say they re very interested in taking up golf has doubled over the past five years, growing at an annual rate of nearly 15%. While the future looks bright given the trends, the challenge for those who make a living in golf remains the same: getting more of those who express interest to give golf a try, and then converting more of those beginners into committed participants the lifeblood of the sport. The trend in golf facilities that gets perhaps the most attention is course closures. What s often not presented is the proper context that the approximate 1% net reduction in courses in the 2016 count demonstrates the ongoing correction in course supply. It s the natural economic response to the opening of almost 5,000 golf facilities between 1986 and 2005, a building boom that led to an over-saturation of the market. The permanent closure of courses in 2016 from a pool of more than 15,000 U.S. golf facilities continues the move toward a healthier balance between supply and demand. Those closures did not have any meaningful effect on the overall number of rounds played, with the increase in overall play showing that customers are taking their business to other area golf facilities. Golf still remains oversupplied, however, and the expectation, for at least several years to come, is additional closures and a further balancing of supply and demand. While only 15.5 new 18-hole equivalent courses opened in 2016 with layouts like Sand Valley in Wisconsin, the Loop at Forest Dunes in Michigan and Mossy Oak in Mississippi investment in golf facilities remains significant. New construction has been replaced by major renovation projects, almost 1,000 over the last decade. These projects represent an investment of at least $3 billion, a conservative figure that doesn t account for the extensive amount of minor rehabilitation work that s being done on a regular basis at courses around the country. The golf industry indeed is evolving, from participation and engagement to construction and retail. With so many segments under golf s sizeable umbrella, one s perspective on the industry is bound to be dependent on the type of business they re in. The trends were largely encouraging in 2016 and there is optimism for a bright future COLLIERS INTERNATIONAL VALUATION & ADVISORY SERVICES 28

35 NATIONAL GOLF MARKET ANALYSIS PARTICIPATION The NGF embraced a new measure of participation in 2016, recognizing the emerging need to expand the definition of golf to include those who engage in the sport at facilities other than traditional golf courses. While green grass golf participation remains an essential measure of golf s vitality, particularly for those in the golf industry, it s also imperative to track the dynamic and ongoing growth seen at venues like Topgolf and with indoor golf simulators. The new measurement better reflects the game s overall activity and makes golf more comparable to other sports such as basketball or baseball, which include casual or pick-up play in assessing engagement rather than limiting themselves to participation at a particular type of facility. While the latest NGF research indicates a slight dip from 24.1 million on-course participants in 2015 to 23.8 million in 2016, overall involvement in the game is actually up when factoring in an 11% increase in off-course participation. When considering both on-course and off-course participation, golf s consumer base now stands at 32 million. Golf s peak of on-course participants in 2003 was 30 million. One of the reasons attributed to the increase in off-course participation is the lack of intimidation or more welcoming atmosphere at these non-traditional facilities, including golf entertainment properties such as Topgolf. Golf course owners and operators need to continue to make the on-course experience more approachable and welcoming, as the opportunity is ripe to convert latent demand. The number of new golfers rose to 2.5 million in 2016, surpassing the previous high set in 2000 when Woods was drawing newcomers to the game in record numbers. It was also 1 million more than the number of beginners five years ago. This jump appears correlated to increases in consumer confidence, spending and other favorable economic indicators, but it s also likely that off-course participation is helping generate a renewed interest in the green-grass game. More than 40 million non-golfers now say they re very or somewhat interested in playing on an actual golf course. The interest level is highest among the millennial generation, a demographic that s critical to golf s future, with 15.2 million saying they re interested in taking up the game. The age group is actually golf s biggest customer age segment, with 6.2 million on-course participants representing 26% of the total golfer pool and another 3.1 million millennials who played only at off-course facilities. GOLF SUPPLY AND CONSTRUCTION The golf course industry continues to go through a period of natural correction, as closures have outweighed openings for the past 11 years. The decline isn t precipitous, as some sensationalist stories in the media suggest, but a healthy and gradual move toward equilibrium. Since 2006, the cumulative reduction in total U.S. golf course supply is just 5.9%. By comparison, the number of courses grew by 44% percent during the two decades prior from 1986 through The growth was unprecedented, and unsustainable. A further balancing of supply and demand is expected for at least the next several years, although it will likely continue to be a slow contraction; the net reduction in courses in the 2016 count was approximately 1%. The U.S. remains, by far, the best supplied golf market in the world, with almost 45% of global facilities COLLIERS INTERNATIONAL VALUATION & ADVISORY SERVICES 29

36 NATIONAL GOLF MARKET ANALYSIS While new course openings are limited, investment in golf facilities remains significant. Major renovations are the focus of attention rather than new construction, with almost 100 such projects undertaken in 2016 that represented an average capital investment of at least $3 million. Dating back to 2006, when the number of course closures exceeded openings, the NGF has tracked almost 1,000 significant renovations in which at least nine holes were closed for a minimum of three months to do upgrades or improvements. Conservatively, that s a $3 billion investment into America s golf courses. A total of 23 new properties opened in 2016, 15 of which were nine-hole courses or additions. The NGF is also tracking a total of hole equivalent courses that are under construction or in planning, with another 24 that have been proposed. The courses that debuted in 2016 generally had a common theme: a unique design, a special location or an existing successful property and/or ownership group. In the case of properties like The Loop Course at Forest Dunes in Michigan or Sand Valley in Wisconsin, it was a combination of all three. While there s a tendency for those outside the industry to regard course closures as a negative, the natural correction in course supply and the ongoing facility investment are positive trends that will make the existing market stronger overall. Few industries in sports or entertainment have a spatial footprint comparable to golf, so the strong real estate market will inevitably continue to create demand for desirable golf course properties. In assessing the value of land golf courses are built on, the reality is that sometimes the dirt is worth more than the grass, as NGF President Joe Beditz says, and this often leads some facility owners to accept offers from commercial or residential builders as an exit strategy. Globally, the NGF is tracking more than 550 new projects in various stages of development, an indication of golf s continued expansion. More than half of the new projects are tied to resorts, from Mexico and Ecuador to Vietnam and Turkmenistan. There are more than 33,000 global golf facilities and courses in 208 of the 245 countries in the world, yet the sport remains geographically concentrated. The top 10 golfing countries (the U.S., Canada, Japan, England, Australia, Germany, France, Scotland, Sweden and South Africa) are home to 74% of the world s supply. ROUNDS PLAYED While approximately 360 more golf courses have closed than opened over the past two years, the total number of rounds played over that time has actually gone up. It is a clear indication that golfers aren t giving up the game if their local golf course closes, but instead migrating to viable options nearby. The total number of U.S. rounds increased by 1.8% in 2015 and was up 0.6% in Unseasonably warm temperatures in the Mid-Atlantic and New England regions at the start of 2016 meant an early and robust start to the golf season in those parts of the country. It was a clear indication of how Mother Nature affects the industry, as the number of rounds played typically climbs or falls with the weather conditions in local regions COLLIERS INTERNATIONAL VALUATION & ADVISORY SERVICES 30
 playing slightly more often than their female counterparts (16.3).")
37 NATIONAL GOLF MARKET ANALYSIS In total, there were almost 470 million rounds of golf played throughout the U.S. in The average number of rounds played per golfer was 19.7, with men (20.8) playing slightly more often than their female counterparts (16.3). The old saying is that golf is the Game of a Lifetime and the statistics certainly bear that out: golfers who were 70 or over played an average of 47.3 rounds in 2016, while those in the age range averaged 32.6 rounds-played. Those participants in the all-important age range played less frequently than seniors a likely byproduct of increased demands on their time and involvement with a variety of other sports and activities with an average of 12.5 rounds in Yet the total 47 million rounds-played by this group was encouragingly half that of the 94 million rounds-played by those 70 and above. ECONOMIC INDICATORS Weather is the No. 1 influence on the golf industry, but the health of the U.S. economy and how much discretionary income consumers have runs a close second. History shows that the game benefits when golfers feel their financial situation is strong or stable. Conversely, when financial confidence is low, the sport tends to suffer. Consumer spending and confidence two primary indicators of the economy s health were up in At the end of the year, consumer optimism about the economy hit its highest level since 2001 and spending advanced, bolstered by stronger income gains. The unemployment rate dropped to its lowest level post-2008 recession, disposable income climbed, and the real estate market continued to show positive gains. The S&P CoreLogic CaseShiller Index, which tracks home values across the country, rose throughout 2016 and is at its highest levels since Despite these positive economic indicators and slow but steady improvement in the general economy, golf has not recovered from the recession of 2008/2009 as it has during previous post-recessionary periods. Two segments of golf s consumer base are likely contributing to this unprecedented historical deviation: millennials and baby boomers. Millennials, those roughly in their twenties to mid-thirties have traditionally contributed a disproportionate number of golfers to the golfing population. While they are still proportionately represented, their numbers are down. Thankfully, this generation is still showing a high degree of interest in golf, but some of that interest is now being expressed more in off-course participation (i.e., Topgolf) than on-course. Baby boomers, particularly those approaching or entering retirement years are another potential factor. Many are opting to continue work well past traditional retirement age thus cutting into the time available for golf. And many others are showing a post-recession frugality that comes from the financial shock of seeing their home values and retirement accounts take significant hits during the last recession. Thus they are being much more careful with their spending, and conservative in their investing. MAJOR COMPANIES Other Companies The Golf Courses and Country Clubs industry is highly fragmented, with over 99.0% of industry establishments hiring fewer than 500 employees. In fact, according to National Golf Foundation, there were only four companies that owned or operated more than 25 private golf clubs in the United States. Consequently, no single company dominates the market COLLIERS INTERNATIONAL VALUATION & ADVISORY SERVICES 31
38 NATIONAL GOLF MARKET ANALYSIS ClubCorp Estimated market share: 3.0% Founded in 1957, Dallas-based ClubCorp is the largest operator of golf courses, country clubs, health clubs and resorts in the United States. In August of 2014, the company acquired Sequoia Golf for $265 million; the deal increased ClubCorp s club count by 31.0%, adding 43 private and six public golf and country clubs to the company s portfolio and increasing company revenue by nearly $100 million. As a result, ClubCorp currently owns or manages 157 golf clubs and country clubs across 26 states; ClubCorp s golf and country clubs include 130 private country clubs, 16 semiprivate clubs and 11 public golf courses. In addition to golf and country clubs, the company operates 46 business, sports and alumni clubs. The company earns about 79.0% of its revenue from golf and country club operations, with the remaining 21.0% coming from business, sports and alumni club operations. Since 2010 ClubCorp s membership levels have grown along with the improving economy; this fact, coupled with the acquisition of Sequoia in 2014, has led ClubCorp to experience strong growth over the past five years. American Golf Corporation Estimated market share: 2.2% Headquartered in Santa Monica, CA, American Golf Corporation operates more than 92 private, resort and daily-fee golf courses across the United States. The company, which leases about half of these properties from National Golf Properties, employs about 10,000 people. The company is a prominent industry player, particularly in the municipal and moderately priced daily-fee categories. In June of 2014, Century Golf Partners took over American Golf and its 92 golf courses; by the terms of the agreement, American Golf remains a stand-alone company and receives consulting services from Century Golf. As American Golf is private, it does not disclose its financial information. Troon Golf LLC Estimated market share: 2.7% Headquartered in Scottsdale, AZ, Troon Golf is one of the largest golf course owners and management companies in the United States. Founded in 1990, the company owns or manages about 130 golf courses in the United States. Troon Golf has a significant presence in Arizona, California and Florida. In addition to being a large domestic player, Troon owns and manages facilities in Asia, Australia, Europe, the Middle East and Africa, making it one of the world s largest upscale golf course and country club operators. Electing to focus solely on high-end luxury golf properties and developments, Troon Golf successfully captures a dominant niche in the golf and hospitality industries. Troon Golf is a privately owned company and, as a result, does not disclose its financial information; IBISWorld expects Troon Golf generates $645.0 million in industry- specific revenue. Century Golf Partners Management Estimated market share: Less than 1.0% Founded in 2005 and based in Dallas, Texas, Century Golf Partners Management specializes in acquiring and managing country clubs, resorts and daily fee golf courses. The operator primarily invests throughout the United States. The company owns the sole rights to the Arnold Palmer Golf Management brand and consequently operates many of its clubs and courses under the Arnold Palmer Golf Management name. In June of 2014, Century Golf took over American Golf and its 92 golf courses; by the terms of the agreement, American Golf remains a stand-alone company and receives consulting services from Century Golf. Century Golf, which operates about 80 golf courses in the United States, is estimated to have earned $153.1 million in industry-specific revenue COLLIERS INTERNATIONAL VALUATION & ADVISORY SERVICES 32
39 NATIONAL GOLF MARKET ANALYSIS LOOKING AHEAD Over the past two years, the total number of rounds-played at golf courses has increased while the number of visitors to off-course facilities has grown at an even greater rate. With the positive economic indicators, there is reason to anticipate golf s overall consumer base will continue to show modest growth. How golf s participation numbers grow whether it s traditional green grass play or at a Topgolf facility will depend on whether interest is turned into actual trials. Golf courses and facilities will continue to close at a pace that outweighs new openings. The run-up of almost 5,000 new courses occurred over a 20-year period and the industry has just entered its second decade of contraction. Inevitably, the stories that accompany these course closings in local media outlets will lament they are further examples of golf s demise, without providing proper context or explaining that the gradual walk-back in supply is a natural market correction. It s essential to note that the quality and affordability of the remaining courses provide golfers with exceptional options to play. The game has also never been more accessible, with 75% of all facilities open to the public in some fashion. Provided the weather cooperates, there are more reasons for golfers to play today than ever. Independently-owned courses are expected to increasingly hire professional management companies to run operations, a trend driven in part by escalating competition and rising costs. The end result in most cases is that customer service levels improve, course conditions are enhanced, new technologies and amenities are added while best practice initiatives are introduced. While those are all positives for golfers, these management companies that run multiple facilities also help independent operators to save money by providing economies of scale on major purchases such as course equipment and other turf maintenance supplies. Golf continues to be an appealing draw, whether for juniors and Millennials or Generation X and the Baby Boomers. The traditional game isn t going anywhere. It is evolving, however, and so is the way golfers are engaging, whether through participation or purchases. The industry remains extremely competitive, no different from many other business sectors of the U.S. economy. Recognizing the challenges that golf faces and the changes that the sport is undergoing is how the most innovative and best-managed companies and operators will continue to grow and seize market share COLLIERS INTERNATIONAL VALUATION & ADVISORY SERVICES 33

40 NATIONAL GOLF MARKET ANALYSIS SOUTH CENTRAL GOLF SUBMARKET OVERVIEW The subject which is in the South Central region in the NGF regional profile, which consists of Louisiana, Arkansas, Mississippi, Alabama, Tennessee and Kentucky. Golf Participation The South Central region has the third best participation rate out of the nine regions at 2.9%. This participation rate is boosted by increases in AR, LA and MS COLLIERS INTERNATIONAL VALUATION & ADVISORY SERVICES 34
41 GOLF MARKET SUPPLY & DEMAND ANALYSIS In this section, market conditions that influence the subject are considered. The major factors requiring consideration are the supply and demand conditions that influence the competitive position of the property. SUPPLY ANALYSIS Existing Competitive Supply The following tables illustrate the physical and operating characteristics for the competitive set, while the map depicts the location of the competitors in relation to the subject. COMPETITIVE PROPERTY FACILITIES OVERVIEW General Property Information Property Name / Address Number of Holes Competitor Type Stonebridge Golf Club of New Orleans Stonebridge Drive, Gretna, Louisiana Timberlane Country Club 18 Primary 1 Timberlane Drive, Gretna, Louisiana Lakewood Golf Club 18 Primary 4801 General Degaulle Drive, New Orleans, Louisiana Joseph M. Bartholomew 18 Primary 6514 Congress Drive, New Orleans, Louisiana 2017 COLLIERS INTERNATIONAL VALUATION & ADVISORY SERVICES 35
42 GOLF MARKET SUPPLY & DEMAND ANALYSIS COMPETITIVE PROPERTIES - OPERATIONAL ANALYSIS Estimated 2017 Property Name Number of Rooms Primary/ Secondary Wtd. Room Count Rounds 18-Hole Low Rate 18-Hole Peak Rate Stonebridge Golf Club of New Orleans ,000 $32.00 $58.00 Timberlane Country Club 18 Primary 18 28,000 $25.00 $39.00 Lakewood Golf Club 18 Primary 18 30,000 $60.00 $ Joseph M. Bartholomew 18 Primary 18 35,000 $25.24 $30.00 Total/Average Including Subject ,500 $35.56 $59.25 Total/Average Excluding Subject ,000 $36.75 $59.67 COMPETITIVE PROPERTIES - PENETRATION ANALYSIS Property Name Hole Count Fair Share Est. Rounds Fair Share Rounds Pentration Index Stonebridge Golf Club of New Orleans 27 33% 29,000 40, Timberlane Country Club 18 22% 28,000 27, Lakewood Golf Club 18 22% 30,000 27, Joseph M. Bartholomew 18 22% 35,000 27, Total/Average Including Subject , % 2017 COLLIERS INTERNATIONAL VALUATION & ADVISORY SERVICES 36

43 GOLF MARKET SUPPLY & DEMAND ANALYSIS COMPETITIVE GOLF CLUB MAP COMPETITION MAP KEY Property Name Location Pin No. Stonebridge Golf Club of New Orleans Gretna, Louisiana S Timberlane Country Club Gretna, Louisiana 1 Lakewood Golf Club New Orleans, Louisiana 2 Joseph M. Bartholomew New Orleans, Louisiana COLLIERS INTERNATIONAL VALUATION & ADVISORY SERVICES 37
44 HIGHEST & BEST USE ANALYSIS INTRODUCTION The highest and best use of an improved property is defined as that reasonable and most probable use that will support its highest present value. The highest and best use, or most probable use, must be legally permissible, physically possible, financially feasible, and maximally productive. The highest and best use concept is based upon traditional appraisal theory and reflects the attitudes of typical buyers and sellers who recognize that value is predicated on future benefits. This theory is based upon the wealth maximization of the owner, with consideration given to community goals. A use which does not meet the needs of the public will not meet the above highest and best use criteria. In keeping with proper appraisal theory, the analysis will begin by analyzing the subject as though it is vacant without any consideration given to the existing improvements. Following this section, an analysis of the existing improvements will be considered. AS-VACANT ANALYSIS The legal factors influencing the highest and best use of the subject property are primarily government regulations such as zoning ordinances. The subject site is zoned R1A. The property is currently subject to restrictive covenants effective May 12, 1989 that restricts the use to a private or public golf course through May 11, After this date the property may be used for residential purposes, consistent with zoning. The site is level at street grade with good access. Stonebridge Golf Club of New Orleans property is situated within Stonebridge subdivision and Lake Timberlane Estates subdivision, on approximately 189 acres. The property fronts the south right-of-way of Stonebridge Drive, the east and west rights-of-way of Lake Timberlane Drive, the north right-of-way of Bayou Barataria, and the east and west rights-of-way of the Verret Canal. Financial feasibility, maximal productivity, marketability, legal, and physical factors have been considered and the highest and best use of the subject site as-vacant is to hold as vacant until demand substantiates the development of a residential subdivision. AS-IMPROVED ANALYSIS The legal factors influencing the highest and best use of the subject property are primarily governmental regulations such as zoning and building codes. The underlying zoning is currently single family residential. However, it is considered unlikely that the owners would ever be permitted to convert to an alternate use, due to neighborhood opposition. Given the zoning, and site restrictions, as well as the potential opposition to an alternative use, the highest and best use of the property is concluded to be for continued use as a golf and country club with renovation as market demand dictates. To the best of our knowledge, the subject is considered a legal, conforming use based on zoning requirements. The physical and locational characteristics of the property have been previously discussed in this report. We assume the property is of average quality construction and in fair condition, with adequate service amenities for a property of this type, throughout the holding period. Legal, physical, locational and marketability factors support the subject s use as the highest and best use of the subject site. Therefore, the property as improved, meets the physical and locational criteria as the highest and best use of the property. In addition to legal, physical and locational considerations, analysis of the subject property as if improved requires the treatment of alternative uses for the property. The five possible alternative treatments of the property are demolition, expansion, renovation, conversion, and continued use "as-is." Among the five alternative uses the Highest and Best Use of the subject property as improved is a lodging facility as it is currently improved and upgraded in line with market standards COLLIERS INTERNATIONAL VALUATION & ADVISORY SERVICES 38
45 VALUATION METHODS INTRODUCTION The following presentation of the appraisal process deals directly with the valuation of the subject property. The following paragraphs describe the standard approaches to value that were considered for this analysis. INCOME CAPITALIZATION APPROACH The Income Capitalization Approach is based on the premise that properties are purchased for their income producing potential. It considers both the annual return on the invested principal and the return of the invested principal. This valuation technique entails careful consideration of contract rents currently in place, projected market rents, other income sources, vacancy allowances, and projected expenses associated with the efficient operation and management of the property. The relationship of these income estimates to property value, either as a single stream or a series of projected streams, is the essence of the income approach. The three fundamental methods of this valuation technique include Discounted Cash Flow, Direct Capitalization, and Gross Income Multiplier (GIM). Discounted Cash Flow (DCF) The DCF analysis models a property s performance over a buyer s investment horizon from the date of acquisition through the projected sale of the property at the end of the holding period. Net cash flows from property operations and the reversion are discounted at a rate reflective of the property s economic and physical risk profile. Direct Capitalization This method analyzes the relationship of one year s stabilized net operating income to total property value. The stabilized net operating income is capitalized at a rate that implicitly considers expected growth in cash flow and growth in property value over a buyer s investment horizon. The implied value may be adjusted to account for non-stabilized conditions or required capital expenditures to reflect an as is value. Gross Income Multiplier (GIM) The multiplier method analyzes the relationship of the gross income a property generates with its sale price to arrive at a factor multiplier. The multipliers are extracted from comparables and market participants and an appropriate multiplier is then applied to the subject s income to arrive at the indicated value. SALES COMPARISON APPROACH The Sales Comparison Approach is based on the principle of substitution, which asserts that no one would pay more for a property than the value of similar properties in the market. This approach analyzes comparable sales by applying transactional and property adjustments in order to bracket the subject property on an appropriate unit value comparison. The sales comparison approach is applicable when sufficient data on recent market transactions is available. Alternatively, this approach may offer limited reliability because many properties have unique characteristics that cannot be accounted for in the adjustment process. COST APPROACH The Cost Approach is a set of procedures through which a value indication is derived for the fee simple interest in a property by estimating the current cost to construct a replacement for the existing structure, including an entrepreneurial incentive; deducting depreciation from the total cost; and adding the estimated land value. Adjustments may then be made to the indicated fee simple value of the subject property to reflect the value of the property interest being appraised. For investment properties, this valuation technique is most often relied upon as a test of financial feasibility for proposed construction COLLIERS INTERNATIONAL VALUATION & ADVISORY SERVICES 39
46 VALUATION METHODS We find that knowledgeable golf club buyers base their purchase decisions on economic factors, such as projected net income and return on investment. Because the cost approach does not reflect these income-related considerations and requires a number of highly subjective depreciation estimates, this approach is given minimal weight in the valuation process for existing properties that are subjected to depreciation, but is commonly used for newly-constructed assets as a cross-check to the primary approaches. RECONCILIATION OF VALUE CONCLUSIONS After each approach is considered in the valuation process, a reconciliation is performed and a final value conclusion is reached. Each approach is judged based on its applicability, reliability, and the quantity and quality of its data. We continually interact with numerous golf club buyers and sellers and we note that these participants typically base their purchase decisions on economic factors, such as cash on cash return, projected net income and return on investment. The procedures used in developing an opinion of market value by the Income Capitalization Approach are comparable to those employed by the pool of investors who are present in the marketplace. Accordingly, the Income Capitalization Approach produces the most supportable value opinion, and it is given the greatest weight in the golf club valuation process. It is our opinion that the Sales Comparison Approach might provide a useful value opinion in the case of simple forms of real estate such as vacant land and single-family homes where such investments can be easily compared to one another and the adjustments are relatively simple to apply. In the case of complex investments such as lodging facilities, operational characteristics are eccentric and labor intensive. Golf clubs are highly localized, in that operational characteristics are governed by their specific markets. As such, adjustments to comparable sales are numerous and more difficult to quantify, and as such, this approach loses a significant degree of reliability. We generally do not give the Sales Comparison Approach substantial consideration in the golf club valuation process beyond establishing a probable range of value. Lastly, regarding the Cost Approach, it is our opinion that this approach does not reflect the aforementioned income-related considerations and requires a number of highly subjective estimates, such as depreciation, obsolescence and other factors. Even for newly-constructed golf club facilities, this approach is generally secondary, and as a determinant for market value, is given minimal or no weight. We do note, however, that this approach is a useful tool in determining the value of any intangible components in real property. We have addressed these components in the Reconciliation section of this report COLLIERS INTERNATIONAL VALUATION & ADVISORY SERVICES 40
47 INCOME CAPITALIZATION APPROACH INTRODUCTION Capitalization is defined as the process of converting a series of anticipated future periodic installments of net income into present value. The anticipated net income stream is converted into a value opinion by a rate that attracts capital to purchase investments with similar characteristics, such as risk, terms and liquidity. The capitalization process takes into consideration the quantity, quality and durability of the income stream in determining which rates are appropriate for valuing a golf club property. The Income Capitalization Approach is based on the principle that the value of a property is indicated by the net return to the property, or what is also known as the present worth of future benefits. The future benefits of incomeproducing properties, such as golf clubs, is net income before debt service and depreciation, derived by a projection of income and expense, along with any expected reversionary proceeds from a sale. METHODOLOGY The three most common methods of converting net income into value are the discounted cash flow, direct capitalization and room revenue multiplier. In direct capitalization, net operating income is divided by an overall rate extracted from the market to indicate a value. In the discounted cash flow method, anticipated future net income streams and a reversionary value are discounted to provide an opinion of net present value at a chosen yield rate (internal rate of return or discount rate). In gross income multiplier, the multiplier is first calculated in the sales transactions by dividing the sales price by the gross income for the golf club being analyzed. The room revenue multiplier expresses the relationship between a sales price and the property's effective room revenue. Considering the physical and economic characteristics of the subject property, along with the likely highest and best use which would be considered by a potential investor, we have employed the following approaches: > Discounted Cash Flow > Direct Capitalization Approach > Gross Income Multiplier In this section of the report, we also provide an analysis of the actual operating performance and the performance of comparable properties in order to forecast all other revenues and expenses through a 10-year holding period. The projection begins on December 12, REVIEW OF OPERATING STATEMENTS The appraisers were provided with income and expense statements of the subject property, the results of which are presented on the following pages. These statements were provided by the management of the subject property, and are unaudited. (We call your attention to the Assumptions and Limiting Conditions of this report.) The income and expense statements summarize the subject s operating statistics for the following periods: > Calendar Years: 2015 and 2016 > Year-to-Date: 2016 and 2017 through September > Trailing 12-Month: 2017 through September The statements are organized in accordance with the Uniform System of Accounts for golf course properties COLLIERS INTERNATIONAL VALUATION & ADVISORY SERVICES 41
48 INCOME CAPITALIZATION APPROACH CALENDAR YEARS Statement of Historical Operations: Stonebridge Golf Club of New Orleans Calendar Year Through Month: December December Days Open: Rounds 27,180 23,343 Holes DEPARTMENTAL REVENUES $ % Total $/Round $/Hole $ % Total $/Round $/Hole Membership Dues $124, % $4.57 $4,603 $121, % $5.21 $4,506 Golf Playing Fees $255, % $9.38 $9,447 $204, % $8.76 $7,570 Golf Carts $230, % $8.48 $8,534 $198, % $8.50 $7,350 Driving Range $36, % $1.34 $1,351 $30, % $1.30 $1,128 Food & Beverage $298, % $10.97 $11,047 $268, % $11.51 $9,947 Pro Shop Merchandise $108, % $3.99 $4,013 $91, % $3.93 $3,395 Pro Shop $24, % $0.90 $908 $19, % $0.85 $732 Other Income $ % $0.02 $23 $3, % $0.14 $119 Total Departmental Revenues $1,078, % $39.66 $39,927 $938, % $40.19 $34,748 DEPARTMENTAL COSTS Golf Course Maintenance $530, % $19.52 $19,645 $540, % $23.14 $20,002 Golf Carts $72, % $2.66 $2,676 $71, % $3.08 $2,664 Driving Range $2, % $0.10 $104 $3, % $0.13 $112 Food & Beverage $206, % $7.58 $7,635 $174, % $7.45 $6,445 Pro Shop COGS $65, % $2.43 $2,443 $57, % $2.48 $2,143 Pro Shop $111, % $4.12 $4,143 $106, % $4.57 $3,948 Total Departmental Costs $989, % $36.40 $36,646 $953, % $40.85 $35,315 DEPARTMENTAL INCOME $88, % $3.26 $3,281 -$15, % -$0.66 -$567 UNDISTRIBUTED OPERATING EXPENSES Administrative & General $141, % $5.21 $5,247 $157, % $6.75 $5,840 Management Fees $92, % $3.40 $3,424 $90, % $3.87 $3,343 Marketing & Entertainment $17, % $0.66 $661 $11, % $0.49 $420 Professional Fees $22, % $0.83 $835 $24, % $1.06 $917 Repairs & Maintenance $37, % $1.39 $1,403 $30, % $1.29 $1,113 Utilities $30, % $1.10 $1,112 $32, % $1.40 $1,211 Total Undist. Oper. Expenses $342, % $12.60 $12,682 $346, % $14.86 $12,843 HOUSE PROFIT -$253, % -$9.34 -$9,401 -$362, % -$ $13,410 FIXED CHARGES Property Taxes $48, % $1.79 $1,804 $7, % $0.34 $294 Insurance $13, % $0.49 $491 $11, % $0.51 $442 Reserve for Replacement $0 0.0% $0.00 $0.00 $0 0.0% $0.00 $0.00 Total Fixed Charges $61, % $2.28 $2,295 $19, % $0.85 $ NET OPERATING INCOME -$315, % -$ $11,696 -$381, % -$ $14, COLLIERS INTERNATIONAL VALUATION & ADVISORY SERVICES 42
49 INCOME CAPITALIZATION APPROACH YEAR-TO-DATE Statement of Historical Operations: Stonebridge Golf Club of New Orleans Calendar Year Through Month: September September Days Open: Rounds 17,507 21,700 Holes DEPARTMENTAL REVENUES $ % Total $/Round $/Hole $ % Total $/Round $/Hole Membership Dues $92, % $5.27 $3,415 $129, % $5.96 $4,794 Golf Playing Fees $157, % $9.00 $5,838 $201, % $9.28 $7,458 Golf Carts $152, % $8.74 $5,664 $170, % $7.83 $6,297 Driving Range $23, % $1.34 $870 $26, % $1.23 $989 Food & Beverage $173, % $9.89 $6,411 $199, % $9.20 $7,395 Pro Shop Merchandise $69, % $3.99 $2,586 $51, % $2.37 $1,908 Pro Shop $15, % $0.87 $565 $13, % $0.64 $516 Other Income $2, % $0.12 $81 $2, % $0.12 $99 Total Departmental Revenues $686, % $39.22 $25,430 $795, % $36.65 $29,455 DEPARTMENTAL COSTS Golf Course Maintenance $409, % $23.39 $15,164 $291, % $13.43 $10,791 Golf Carts $53, % $3.05 $1,975 $44, % $2.04 $1,636 Driving Range $3, % $0.17 $112 $2, % $0.11 $91 Food & Beverage $132, % $7.55 $4,893 $131, % $6.07 $4,877 Pro Shop COGS $42, % $2.44 $1,581 $52, % $2.44 $1,958 Pro Shop $84, % $4.81 $3,120 $145, % $6.70 $5,386 Total Departmental Costs $724, % $41.40 $26,846 $667, % $30.78 $24,739 DEPARTMENTAL INCOME -$38, % -$2.18 -$1,416 $127, % $5.87 $4,716 UNDISTRIBUTED OPERATING EXPENSES Administrative & General $117, % $6.73 $4,365 $83, % $3.85 $3,098 Management Fees $67, % $3.87 $2,510 $36, % $1.66 $1,333 Marketing & Entertainment $10, % $0.59 $381 $16, % $0.75 $601 Professional Fees $18, % $1.06 $687 $6, % $0.29 $237 Repairs & Maintenance $21, % $1.25 $809 $37, % $1.72 $1,386 Utilities $25, % $1.46 $950 $48, % $2.23 $1,789 Total Undist. Oper. Expenses $261, % $14.96 $9,702 $227, % $10.51 $8,444 HOUSE PROFIT -$300, % -$ $11,118 -$100, % -$4.64 -$3,728 FIXED CHARGES Property Taxes $7, % $0.45 $290 $0 0.0% $0.00 $0 Insurance $9, % $0.54 $353 $35, % $1.63 $1,310 Reserve for Replacement $0 0.0% $0.00 $0.00 $0 0.0% $0.00 $0 Total Fixed Charges $17, % $0.99 $ $35, % $1.63 $1,310 NET OPERATING INCOME -$317, % -$ $11,761 -$136, % -$6.27 -$5, COLLIERS INTERNATIONAL VALUATION & ADVISORY SERVICES 43
50 INCOME CAPITALIZATION APPROACH TRAILING 12-MONTH Statement of Historical Operations: Stonebridge Golf Club of New Orleans Fiscal Year: 2017 Through Month: September Days Open: 365 Rounds 27,536 Holes 27 DEPARTMENTAL REVENUES $ % Total $ PAR $ POR Membership Dues $158, % $6 $5, Golf Playing Fees $248, % $9 $9, Golf Carts $215, % $8 $7, Driving Range $33, % $1 $1, Food & Beverage $295, % $11 $10, Pro Shop Merchandise $73, % $3 $2, Pro Shop $18, % $1 $ Other Income $3, % $0 $ Total Departmental Revenues $1,046, % $38 $38, DEPARTMENTAL COSTS Golf Course Maintenance $421, % $15 $15, Golf Carts $62, % $2 $2, Driving Range $2, % $0 $90.83 Food & Beverage $173, % $6 $6, Pro Shop COGS $68, % $2 $2, Pro Shop $167, % $6 $6, Total Departmental Costs $896, % $33 $33, DEPARTMENTAL INCOME $150, % $5 $5, UNDISTRIBUTED OPERATING EXPENSES Administrative & General $123, % $4 $4, Management Fees $58, % $2 $2, Marketing & Entertainment $17, % $1 $ Professional Fees $12, % $0 $ Repairs & Maintenance $45, % $2 $1, Utilities $55, % $2 $2, Total Undist. Oper. Expenses $312, % $11 $11, HOUSE PROFIT -$162, % -$6 -$6, FIXED CHARGES Property Taxes $ % $0 $3.93 Insurance $37, % $1 $1, Reserve for Replacement $0 0.0% $0 $0.00 Total Fixed Charges $37, % $1 $1, NET OPERATING INCOME -$200, % -$7 -$7, OPERATING BUDGET (PROFORMA) In addition to the actual operating data, we have considered operating projections provided by management. As is true with the above-illustrated data, the projections are unaudited and in no way are certified by the appraisers as an accurate or inaccurate account of anticipated economic benefits. The following figures represent management s forward-looking operating budget/proforma: 2017 COLLIERS INTERNATIONAL VALUATION & ADVISORY SERVICES 44
51 INCOME CAPITALIZATION APPROACH Statement of Budgeted Operations (Proforma) Stonebridge Golf Club of New Orleans Calendar Year: 2018 Through Month: December Rounds 30,000 Holes 27 DEPARTMENTAL REVENUES $ % TOTAL $/Round $/Hole Membership Dues $100, % $3.34 $3,707 Golf Playing Fees $367, % $12.24 $13,596 Driving Range $27, % $0.92 $1,018 Food & Beverage $207, % $6.93 $7,698 Pro Shop $94, % $3.15 $3,501 Other Income $5, % $0.19 $214 Total Departmental Revenues $802, % $26.76 $29,734 DEPARTMENTAL COSTS Golf Course Maintenance $161, % $5.40 $5,996 Golf Carts $59, % $1.98 $2,200 Food & Beverage $79, % $2.66 $2,960 Pro Shop COGS $71,566 - $2.39 $2,651 Pro Shop $462, % $15.43 $17,139 Total Departmental Costs $835, % $27.85 $30,946 DEPARTMENTAL INCOME -$32, % -$1.09 -$1,212 UNDISTRIBUTED OPERATING EXPENSES Administrative & General $206, % $6.90 $7,665 Management Fees $68, % $2.29 $2,542 Marketing & Entertainment $8, % $0.27 $297 Professional Fees $0 0.0% $0.00 $0 Repairs & Maintenance $52, % $1.75 $1,946 Total Undist. Oper. Expenses $336, % $11.21 $12,450 MANAGEMENT FEES Base Management Fee $0 0.0% $0.00 $0 HOUSE PROFIT -$368, % -$ $13,662 FIXED CHARGES Property Taxes $0 0.0% $0.00 $0 Insurance $0 0.0% $0.00 $0 Reserve for Replacement $0 0.0% $0.00 $0 Total Fixed Charges $0 0.0% $0.00 $0 NET OPERATING INCOME -$368, % -$ $13, COLLIERS INTERNATIONAL VALUATION & ADVISORY SERVICES 45
52 INCOME CAPITALIZATION APPROACH Statement of Budgeted Operations (Proforma) Stonebridge Golf Club of New Orleans Calendar Year: Through Month: December December Rounds 30,000 30,000 Holes DEPARTMENTAL REVENUES $ % TOTAL $/Round $/Hole $ % TOTAL $/Round $/Hole Membership Dues $139, % $4.65 $5,162 $177, % $5.91 $6,570 Golf Playing Fees $511, % $17.04 $18,932 $556, % $18.55 $20,613 Driving Range $37, % $1.25 $1,391 $39, % $1.31 $1,460 Food & Beverage $411, % $13.71 $15,232 $911, % $30.37 $33,745 Pro Shop $128, % $4.29 $4,772 $133, % $4.46 $4,950 Other Income 0 $7, % $0.26 $285 $7, % $0.26 $285 Total Departmental Revenues $1,235, % $41.20 $45,774 $1,825, % $60.86 $67,624 DEPARTMENTAL COSTS Golf Course Maintenance $224, % $7.49 $8,318 $236, % $7.87 $8,748 Golf Carts $82,719 - $2.76 $3,064 $93,324 - $3.11 $3,456 Food & Beverage $347, % $11.57 $12,860 $724, % $24.14 $26,819 Pro Shop COGS $97,539 - $3.25 $3,613 $112,433 - $3.75 $4,164 Pro Shop 0 $638, % $21.28 $23,644 $666, % $22.22 $24,692 Total Departmental Costs 0 $1,390, % $46.35 $51,498 $1,832, % $61.09 $67,879 DEPARTMENTAL INCOME -$154, % -$5.15 -$5,724 -$6, % -$0.23 -$255 UNDISTRIBUTED OPERATING EXPENSES Administrative & General $282, % $9.43 $10,479 $292, % $9.74 $10,820 Management Fees $93, % $3.13 $3,477 $96, % $3.23 $3,589 Marketing & Entertainment $24, % $0.82 $915 $36, % $1.22 $1,352 Professional Fees $0 0.0% $0.00 $0 $0 0.0% $0.00 $0 Repairs & Maintenance 0 $71, % $2.39 $2,661 $74, % $2.47 $2,748 Total Undist. Oper. Expenses $473, % $15.78 $17,533 $499, % $16.66 $18,509 MANAGEMENT FEES Base Management Fee 0 $0 0.0% $0.00 $0 $0 0.0% $0.00 $0 HOUSE PROFIT -$627, % -$ $23,257 -$506, % -$ $18,764 FIXED CHARGES Property Taxes $0 0.0% $0.00 $0 $0 0.0% $0.00 $0 Insurance $0 0.0% $0.00 $0 $0 0.0% $0.00 $0 Reserve for Replacement $0 0.0% $0.00 $0 $0 0.0% $0.00 $0 Total Fixed Charges $0 0.0% $0.00 $0 $0 0.0% $0.00 $0 NET OPERATING INCOME -$627, % -$ $23,257 -$506, % -$ $18, COLLIERS INTERNATIONAL VALUATION & ADVISORY SERVICES 46
53 INCOME CAPITALIZATION APPROACH COMPARABLE OPERATING DATA AND INDUSTRY AVERAGES In an effort to further support our forecast for the subject property, we have analyzed the operating performance of the subject against five comparable golf clubs. We have carefully analyzed all of the relevant ratios, and considered the data presented and in our files in order to prepare a well-supported forecast of income and expense for each line item. The following page summarizes the operating results of five assets which are known to have similar physical and/or economic characteristics COLLIERS INTERNATIONAL VALUATION & ADVISORY SERVICES 47
54 INCOME CAPITALIZATION APPROACH Operating Comparables for Analysis of Stonebridge Golf Club of New Orleans OPERATING COMPARABLES Property Number: Number of Rounds 35,390 23,170 33,714 20,763 25,000 Number of Holes DEPARTMENTAL REVENUES % Total $/Round $/Hole % Total $/Round $/Hole % Total $/Round $/Hole % Total $/Round $/Hole % Total $/Round $/Hole Membership Dues 15.4% $10.10 $13, % $21.06 $27, % $4.03 $7, % $4.82 $5, % $3.12 $4,333 Golf Playing Fees 23.1% $15.20 $19, % $22.10 $28, % $13.00 $24, % $4.70 $5, % $12.61 $17,520 Golf Carts 23.0% $15.10 $19, % $9.25 $11, % $14.97 $28, % $10.16 $11, % $32.76 $45,496 Driving Range 2.6% $1.70 $2, % $1.26 $1, % $1.30 $2, % $9.45 $10, % $9.44 $13,111 Food & Beverage 20.6% $13.54 $17, % $8.22 $10, % $4.67 $8, % $0.00 $0 2.8% $2.31 $3,209 Pro Shop Merchandise 14.8% $9.73 $12, % $4.67 $6, % $4.68 $8, % $3.25 $3, % $15.83 $21,987 Pro Shop 0.4% $0.26 $ % $0.00 $0 0.0% $0.00 $0 3.2% $1.08 $1, % $7.42 $10,311 Other Income 0.2% $0.14 $ % $0.02 $24 0.8% $0.35 $ % $0.12 $ % $0.00 $0 Total Departmental Revenues 100.0% $65.77 $86, % $66.59 $85, % $43.00 $80, % $33.59 $38, % $83.50 $115,967 DEPARTMENTAL COSTS Golf Course Maintenance 60.4% $15.28 $20, % $19.86 $25, % $13.77 $25, % $11.55 $13, % $20.94 $29,088 Golf Carts 13.8% $2.08 $2, % $2.56 $3, % $0.82 $1, % $0.13 $ % $2.80 $3,889 Driving Range 11.9% $0.20 $ % $0.24 $ % $0.00 $0 0.0% $0.00 $0 0.0% $0.00 $0 Food & Beverage 91.8% $12.43 $16, % $0.00 $0 0.0% $0.00 $0 0.0% $1.70 $1, % $10.47 $14,536 Pro Shop COGS 64.4% $6.27 $8, % $0.00 $0 0.0% $0.00 $ % $3.47 $3, % $11.91 $16,538 Pro Shop % $7.97 $10, % $0.00 $0 0.0% $0.00 $0 0.0% $0.00 $0 0.0% $0.00 $0 Other 0.0% $0.00 $ % $0.09 $ % $0.00 $ % $0.23 $ % $0.00 $0 Total Departmental Costs 67.2% $44.22 $57, % $22.75 $29, % $14.58 $27, % $17.07 $19, % $46.12 $64,052 DEPARTMENTAL INCOME 32.8% $21.55 $28, % $43.84 $56, % $28.41 $53, % $16.52 $19, % $37.38 $51,915 UNDISTRIBUTED OPERATING EXPENSES Administrative & General 12.7% $8.35 $10, % $8.49 $10, % $5.18 $9, % $0.90 $1, % $2.65 $3,674 Management Fees 0.0% $0.00 $0 0.0% $0.00 $0 0.0% $0.00 $0 0.0% $0.00 $0 4.6% $3.81 $5,297 Marketing & Entertainment 1.2% $0.76 $ % $1.30 $1, % $0.62 $1, % $0.25 $ % $1.89 $2,625 Professional Fees 0.3% $0.19 $ % $0.48 $ % $0.00 $0 1.2% $0.42 $ % $0.00 $0 Repairs & Maintenance 0.8% $0.53 $ % $1.14 $1, % $0.00 $0 0.3% $0.09 $ % $0.59 $819 Utilities 3.3% $2.16 $2, % $0.61 $ % $2.21 $4, % $0.79 $ % $3.79 $5,263 Total Undist. Oper. Expenses 18.2% $11.99 $15, % $12.01 $15, % $8.02 $15, % $2.45 $2, % $12.73 $17,678 HOUSE PROFIT 14.5% $9.56 $12, % $31.83 $40, % $20.40 $38, % $14.07 $16, % $24.65 $34,237 FIXED CHARGES Property Taxes 0.6% $0.42 $ % $2.16 $2, % $2.38 $4, % $0.94 $1, % $1.85 $2,565 Insurance 1.7% $1.10 $1, % $1.78 $2, % $1.27 $2, % $0.64 $ % $2.40 $3,327 Reserve for Replacement 0.0% $0.00 $0 0.0% $0.00 $0 0.0% $0.00 $0 0.0% $0.00 $0 0.0% $0.00 $0 Total Fixed Charges 2.3% $1.52 $1, % $3.94 $5, % $3.65 $6, % $1.59 $1, % $4.24 $5,893 NET OPERATING INCOME 12.2% $8.04 $10, % $27.89 $35, % $16.74 $31, % $12.48 $14, % $20.41 $28, COLLIERS INTERNATIONAL VALUATION & ADVISORY SERVICES 48
55 INCOME CAPITALIZATION APPROACH FINANCIAL PROJECTIONS Details regarding the underlying support and rational behind our assumptions is presented in the following paragraphs. It is important to note that the operating results presented herein rely on the golf club being efficiently and effectively managed by a competent operator. A golf club to successfully compete in the market requires a well-coordinated marketing plan and an appropriately-crafted yield management strategy. It is also assumed that management of the golf club will maintain all facilities in good working order and sufficient enough to render the property fully competitive in the relevant marketplace throughout the holding period. UNDERLYING GROWTH ASSUMPTIONS Our projections account for the integration of general price inflation based upon economic projections from various sources, including the Bureau of Labor Statistics and the U.S. Congressional Budget Office. We have also implemented our observations and various accounts derived from perspectives both locally and nationally. To appropriately reflect potential price level changes, we have assumed that the consumer price index (CPI) will adequately account for inflation levels predicated to the hospitality industry, and that the rate will increase by 3.0% per year on average throughout the 10-year projection period. FIXED AND VARIABLE COST COMPONENTS The income and expense line items for the subject property throughout the holding period are generated using sophisticated modeling software developed by Colliers International s Hospitality and Leisure Group. The software takes into account the varying degrees of fixed and variable components that each individual line item possesses. Specifically, fixed cost components are expenses or overheads that are not dependent on the level of goods or services produced by the business. They tend to be time-related, such as salaries or rents being paid. This is in contrast to variable cost components, which are costs that change in proportion to the good or service that a business produces. They can also be considered normal costs. Variable costs are sometimes called unit-level costs as they vary with the number of units produced. In this case, the units produced are golf rounds, and therefore the line item experiences future incremental changes based on utilization levels. After a thorough review of the subject property's actual operating data, industry averages, and the performance of comparable clubs, we have developed a 10-year projection of income and expense. Our projection begins on December 12, 2017 and, considering the current state of the competitive golf club market, we believe that the subject property will achieve stabilization by December 12, The projection of income and expense is, intuitively, a reflection of the expectations of a well-informed and prudent buyer pertaining to the subject property's operating results. Depending on the dynamics of the local market, anticipated economic benefits may be adjusted upward or downward relative to actual operating results. We have incorporated these factors into this analysis COLLIERS INTERNATIONAL VALUATION & ADVISORY SERVICES 49
56 INCOME CAPITALIZATION APPROACH Membership Dues Revenues Source RATIO $/Round $/Hole Operating Comparables Low 3.7% $3.12 $4,333 High 31.6% $21.06 $27,115 Average 14.9% $8.63 $11,559 Subject Historicals % $4.57 $4, % $5.21 $4,506 TTM Ending September % $5.77 $5,886 Base-Year Conclusion: 13.0% $5.88 $6,000 First Projection Year (2017/18) 12.5% $5.56 $6,180 Stabilized Year (2020/21) 11.8% $5.21 $6,753. Golf Playing Fees Revenues Source RATIO $/Round $/Hole Operating Comparables Low 14.0% $4.70 $5,422 High 33.2% $22.10 $28,454 Average 23.1% $13.52 $19,133 Subject Historicals % $9.38 $9, % $8.76 $7,570 TTM Ending September % $9.01 $9,191 Base-Year Conclusion: 24.3% $11.00 $11,218 First Projection Year (2017/18) 25.4% $11.33 $12,589 Stabilized Year (2020/21) 26.3% $11.61 $15,046 Golf Carts Revenues Source RATIO $/Round $/Hole Operating Comparables Low 13.9% $9.25 $11,725 High 39.2% $32.76 $45,496 Average 28.2% $16.45 $23,390 Subject Historicals % $8.48 $8, % $8.50 $7,350 TTM Ending September % $7.83 $7,982 Base-Year Conclusion: 19.9% $9.00 $9,179 First Projection Year (2017/18) 20.8% $9.27 $10,300 Stabilized Year (2020/21) 22.9% $10.13 $13,131 Driving Range Revenues Source RATIO $/Round $/Hole Operating Comparables Low 1.9% $1.26 $1,624 High 28.1% $9.45 $13,111 Average 9.4% $4.63 $6,059 Subject Historicals % $1.34 $1, % $1.30 $1,128 TTM Ending September % $1.22 $1,246 Base-Year Conclusion: 3.5% $1.59 $1,625 First Projection Year (2017/18) 3.4% $1.51 $1,674 Stabilized Year (2020/21) 3.2% $1.41 $1, COLLIERS INTERNATIONAL VALUATION & ADVISORY SERVICES 50
57 INCOME CAPITALIZATION APPROACH Food & Beverage Revenues Source RATIO $/Round $/Hole Operating Comparables Low 0.0% $0.00 $0 High 20.6% $13.54 $17,750 Average 9.3% $5.75 $8,055 Subject Historicals % $10.97 $11, % $11.51 $9,947 TTM Ending September % $10.72 $10,931 Base-Year Conclusion: 26.0% $11.77 $12,000 First Projection Year (2017/18) 25.0% $11.12 $12,360 Stabilized Year (2020/21) 23.6% $10.42 $13,506 Pro Shop Merchandise Revenues Source RATIO $/Round $/Hole Operating Comparables Low 7.0% $3.25 $3,754 High 19.0% $15.83 $21,987 Average 12.3% $7.63 $10,655 Subject Historicals % $3.99 $4, % $3.93 $3,395 TTM Ending September % $2.66 $2,717 Base-Year Conclusion: 10.8% $4.90 $5,000 First Projection Year (2017/18) 10.4% $4.64 $5,150 Stabilized Year (2020/21) 9.8% $4.34 $5,628 Pro Shop Revenues Source RATIO $/Round $/Hole Operating Comparables Low 0.0% $0.00 $0 High 8.9% $7.42 $10,311 Average 2.5% $1.75 $2,380 Subject Historicals % $0.90 $ % $0.85 $732 TTM Ending September % $0.67 $683 Base-Year Conclusion: 2.2% $0.98 $1,000 First Projection Year (2017/18) 2.1% $0.93 $1,030 Stabilized Year (2020/21) 2.0% $0.87 $1,126 Other Income Revenues Source RATIO $/Round $/Hole Operating Comparables Low 0.0% $0.00 $0 High 0.8% $0.35 $664 Average 0.3% $0.13 $203 Subject Historicals % $0.02 $ % $0.14 $119 TTM Ending September % $0.13 $137 Base-Year Conclusion: 0.4% $0.20 $200 First Projection Year (2017/18) 0.4% $0.19 $206 Stabilized Year (2020/21) 0.4% $0.17 $ COLLIERS INTERNATIONAL VALUATION & ADVISORY SERVICES 51
58 INCOME CAPITALIZATION APPROACH DEPARTMENTAL EXPENSES Departmental expenses are based on expense items that are attributable to a specific profit center. Golf Course Maintenance Expenses Source RATIO $/Round $/Hole Operating Comparables Low 46.0% $11.55 $13,317 High 133.1% $20.94 $29,088 Average 88.3% $16.28 $22,756 Subject Historicals % $19.52 $19, % $23.14 $20,002 TTM Ending September % $15.32 $15,629 Base-Year Conclusion: 90.8% $15.32 $15,500 First Projection Year (2017/18) 85.8% $14.49 $16,098 Stabilized Year (2020/21) 80.7% $13.57 $17,591 Golf Carts Expenses Source RATIO $/Round $/Hole Operating Comparables Low 1.3% $0.13 $150 High 27.7% $2.80 $3,889 Average 11.4% $1.68 $2,319 Subject Historicals % $2.66 $2, % $3.08 $2,664 TTM Ending September % $2.28 $2,325 Base-Year Conclusion: 25.3% $2.28 $2,325 First Projection Year (2017/18) 23.2% $2.16 $2,395 Stabilized Year (2020/21) 19.9% $2.02 $2,617 Driving Range Expenses Source RATIO $/Round $/Hole Operating Comparables Low 0.0% $0.00 $0 High 18.8% $0.24 $305 Average 6.1% $0.09 $114 Subject Historicals % $0.10 $ % $0.13 $112 TTM Ending September % $0.09 $91 Base-Year Conclusion: 7.3% $0.12 $90 First Projection Year (2017/18) 7.3% $0.11 $122 Stabilized Year (2020/21) 7.3% $0.10 $133 Food & Beverage Expenses Source RATIO $/Round $/Hole Operating Comparables Low 0.0% $0.00 $0 High 453.0% $12.43 $16,288 Average 136.2% $4.92 $6,556 Subject Historicals % $7.58 $7, % $7.45 $6,445 TTM Ending September % $6.30 $6,429 Base-Year Conclusion: 55.0% $6.47 $6,600 First Projection Year (2017/18) 55.0% $6.12 $6,798 Stabilized Year (2020/21) 55.0% $5.73 $7, COLLIERS INTERNATIONAL VALUATION & ADVISORY SERVICES 52
59 INCOME CAPITALIZATION APPROACH Pro Shop COGS Expenses Source RATIO $/Round $/Hole Operating Comparables Low 0.0% $0.00 $0 High 106.5% $11.91 $16,538 Average 49.2% $4.33 $5,750 Subject Historicals % $2.43 $2, % $2.48 $2,143 TTM Ending September % $2.47 $2,520 Base-Year Conclusion: 55.0% $2.70 $2,750 First Projection Year (2017/18) 55.0% $2.55 $2,833 Stabilized Year (2020/21) 55.0% $2.39 $3,095 Pro Shop Expenses Source RATIO $/Round $/Hole Operating Comparables Low 0.0% $0.00 $0 High % $7.97 $10,443 Average % $1.59 $2,089 Subject Historicals % $4.12 $4, % $4.57 $3,948 TTM Ending September % $6.09 $6,213 Base-Year Conclusion: 470.0% $4.61 $4,700 First Projection Year (2017/18) 470.0% $4.36 $4,841 Stabilized Year (2020/21) 470.0% $4.08 $5,290 UNDISTRIBUTED OPERATING EXPENSES Undistributed, or non-direct operating expenses are costs shouldered by the overall club operation and not attributable to any one specific department or profit center. Administrative & General Expenses Source RATIO $/Round $/Hole Operating Comparables Low 2.7% $0.90 $1,041 High 12.7% $8.49 $10,950 Average 8.7% $5.11 $7,260 Subject Historicals % $5.21 $5, % $6.75 $5,840 TTM Ending September % $4.48 $4,573 Base-Year Conclusion: 7.5% $3.40 $3,467 First Projection Year (2017/18) 7.2% $3.21 $3,571 Stabilized Year (2020/21) 6.8% $3.01 $3,902 Management Fees Expenses Source RATIO $/Round $/Hole Operating Comparables Low 0.0% $0.00 $0 High 4.6% $3.81 $5,297 Average 0.9% $0.76 $1,059 Subject Historicals % $3.40 $3, % $3.87 $3,343 TTM Ending September % $2.12 $2,167 Base-Year Conclusion: 3.0% $1.36 $1,387 First Projection Year (2017/18) 3.0% $1.34 $1,485 Stabilized Year (2020/21) 2.8% $1.25 $1, COLLIERS INTERNATIONAL VALUATION & ADVISORY SERVICES 53
60 INCOME CAPITALIZATION APPROACH FIXED EXPENSES Professional Fees Expenses Source RATIO $/Round $/Hole Operating Comparables Low 0.0% $0.00 $0 High 1.2% $0.48 $615 Average 0.4% $0.22 $269 Subject Historicals % $0.83 $ % $1.06 $917 TTM Ending September % $0.46 $466 Base-Year Conclusion: 1.0% $0.46 $466 First Projection Year (2017/18) 1.0% $0.43 $480 Stabilized Year (2020/21) 0.9% $0.40 $524 Repairs & Maintenance Expenses Source RATIO $/Round $/Hole Operating Comparables Low 0.0% $0.00 $0 High 1.7% $1.14 $1,463 Average 0.7% $0.47 $615 Subject Historicals % $1.39 $1, % $1.29 $1,113 TTM Ending September % $1.66 $1,690 Base-Year Conclusion: 3.0% $1.37 $1,400 First Projection Year (2017/18) 2.9% $1.30 $1,442 Stabilized Year (2020/21) 2.8% $1.22 $1,576 Fixed expenses includes any expenses that relate to the ownership of the golf club, including property taxes, building and contents insurance, reserve for replacement and any applicable land, building, and equipment rent. Property Taxes A discussion of the subject's real estate tax burden was included in an earlier section of this report. Our forecast of the subject's property taxes per annum is as follows. Property Taxes Expenses Source RATIO $/Round $/Hole Tax Comparables (RE Only) Low - $3, $3,845 High - $8, $8,410 Average - $5, $5,480 Operating Comparables Low 0.6% $0.42 $555 High 5.5% $2.38 $4,456 Average 2.9% $1.55 $2,289 Subject Historicals % $1.79 $1, % $0.34 $294 TTM Ending September % $0.00 $4 Base-Year Conclusion: 3.6% $1.62 $1,649 First Projection Year (2017/18) 3.4% $1.53 $1,699 Stabilized Year (2020/21) 3.2% $1.43 $1, COLLIERS INTERNATIONAL VALUATION & ADVISORY SERVICES 54
61 INCOME CAPITALIZATION APPROACH Insurance Expenses Source RATIO $/Round $/Hole Operating Comparables Low 1.7% $0.64 $744 High 3.0% $2.40 $3,327 Average 2.4% $1.44 $2,037 Subject Historicals % $0.49 $ % $0.51 $442 TTM Ending September % $1.37 $1,399 Base-Year Conclusion: 2.8% $1.27 $1,300 First Projection Year (2017/18) 2.7% $1.21 $1,339 Stabilized Year (2020/21) 2.6% $1.13 $1,463 Reserve for Replacement Reserves for replacement are funds set aside that provide for the periodic replacement of building components that wear out more rapidly than the building itself and therefore must be replaced during the building s economic life. These components are largely inclusive of furniture, fixtures, and equipment (FF&E), the replacement of which is generally funded from a club s cash flow. In theory, a sufficient amount of money is available to replace FF&E at the end of its useful life. In the event that the replacement fund is insufficient, a capital deduction at the point of a transaction (i.e. a property improvement plan) might be assessed to address the shortfall. The items a club s reserve account address are considered to be short-lived components, since the average economic life is predominantly less than ten years. These components typically include the replacement of the roof, heating, ventilation, and air conditioning (HVAC) systems, parking lot resurfacing, etc. Note that replacement reserves do not include minor repairs and maintenance such as broken doorknobs or lightbulbs. These minor expenses are considered routine property operation and maintenance expenses, not irregular capital expenditures Industry data indicates that a reserve for replacement of 2.0% to 5.0% of total revenue is generally sufficient to provide for the replacement or total repair of FF&E. In order to ensure that the subject property is maintained in a competitive position throughout the holding period, we deducted a reserve for replacement equal to 2.00% of total revenues per year. We believe our estimate of capital reserves should be adequate to account for all typical future capital expenditures throughout the holding period. As discussed, the subject property s facilities overall condition is considered to be average. The buyer plans to undergo capital improvements to add community amenities to appeal to the surrounding property owners. This motivation is specific to the buyer. In our opinion the club could reasonably remain competitive in the local golf landscape with typical maintenance and upkeep. Our year one projection of reserves allowance is $26,724, or $990 per room. Net Operating Income The following table summarizes our overall conclusion of net operating income of the subject property: 2017 COLLIERS INTERNATIONAL VALUATION & ADVISORY SERVICES 55
62 INCOME CAPITALIZATION APPROACH NET OPERATING INCOME Source RATIO $/Round $/Hole Operating Comparables Low 12.2% $8.04 $10,542 High 41.9% $27.89 $35,900 Average 30.9% $17.11 $24,109 Subject Historicals % ($11.62) ($11,696) % ($16.36) ($14,146) TTM Ending September % ($7.28) ($7,423) Base-Year Conclusion: 3.5% $1.58 $1,613 First Projection Year (2017/18) 6.9% $3.08 $3,420 Stabilized Year (2020/21) 11.9% $5.24 $6,791 PROJECTION OF INCOME AND EXPENSE On the following pages we present our forecast of income and expense for the subject property on a detailed basis for the first few years of operation, along with a summary presentation of the same line items over the entire 10-year holding period. The projection begins December 12, As discussed, stabilization is anticipated to occur on or about December 12, The statements are expressed in future values for each projection year COLLIERS INTERNATIONAL VALUATION & ADVISORY SERVICES 56
63 INCOME CAPITALIZATION APPROACH DETAILED FORECAST OF INCOME AND EXPENSE - FIRST FIVE PROJECTION YEARS Stonebridge Golf Club of New Orleans Period: 2017/ / / /21 (Stabilized) 2021/22 Projection Year: Rounds 30,000 32,000 35,000 35,000 35,000 Holes DEPARTMENTAL REVENUES $ % Total $ PAR $ POR $ % Total $ PAR $ POR $ % Total $ PAR $ POR $ % Total $ PAR $ POR $ % Total $ PAR $ POR Membership Dues $166, % $5.56 $6,180 $171, % $5.37 $6,365 $177, % $5.06 $6,556 $182, % $5.21 $6,753 $187, % $5.37 $6,956 Golf Playing Fees $339, % $11.33 $12,589 $350, % $10.94 $12,967 $394, % $11.27 $14,608 $406, % $11.61 $15,046 $418, % $11.96 $15,497 Golf Carts $278, % $9.27 $10,300 $305, % $9.55 $11,316 $344, % $9.83 $12,748 $354, % $10.13 $13,131 $365, % $10.43 $13,525 Driving Range $45, % $1.51 $1,674 $46, % $1.45 $1,724 $47, % $1.37 $1,776 $49, % $1.41 $1,829 $50, % $1.45 $1,884 Food & Beverage $333, % $11.12 $12,360 $343, % $10.74 $12,731 $354, % $10.12 $13,113 $364, % $10.42 $13,506 $375, % $10.73 $13,911 Pro Shop Merchandise $139, % $4.64 $5,150 $143, % $4.48 $5,305 $147, % $4.21 $5,464 $151, % $4.34 $5,628 $156, % $4.47 $5,796 Pro Shop $27, % $0.93 $1,030 $28, % $0.90 $1,061 $29, % $0.84 $1,093 $30, % $0.87 $1,126 $31, % $0.89 $1,159 Other Income $5, % $0.19 $206 $5, % $0.18 $212 $5, % $0.17 $219 $6, % $0.17 $225 $6, % $0.18 $232 Total Departmental Revenues $1,336, % $44.54 $49,489 $1,395, % $43.61 $51,681 $1,500, % $42.87 $55,576 $1,545, % $44.16 $57,243 $1,591, % $45.48 $58,960 DEPARTMENTAL COSTS Golf Course Maintenance $434, % $14.49 $16,098 $447, % $13.99 $16,581 $461, % $13.17 $17,078 $474, % $13.57 $17,591 $489, % $13.98 $18,118 Golf Carts $64, % $2.16 $2,395 $66, % $2.08 $2,466 $68, % $1.96 $2,540 $70, % $2.02 $2,617 $72, % $2.08 $2,695 Driving Range $3, % $0.11 $122 $3, % $0.11 $126 $3, % $0.10 $129 $3, % $0.10 $133 $3, % $0.11 $137 Food & Beverage $183, % $6.12 $6,798 $189, % $5.91 $7,002 $194, % $5.56 $7,212 $200, % $5.73 $7,428 $206, % $5.90 $7,651 Pro Shop COGS $76, % $2.55 $2,833 $78, % $2.46 $2,917 $81, % $2.32 $3,005 $83, % $2.39 $3,095 $86, % $2.46 $3,188 Pro Shop $130, % $4.36 $4,841 $134, % $4.21 $4,986 $138, % $3.96 $5,136 $142, % $4.08 $5,290 $147, % $4.20 $5,449 Total Departmental Costs $893, % $29.78 $33,086 $920, % $28.75 $34,079 $947, % $27.08 $35,101 $976, % $27.89 $36,154 $1,005, % $28.73 $37,239 DEPARTMENTAL INCOME $442, % $14.76 $16,403 $475, % $14.85 $17,602 $552, % $15.79 $20,475 $569, % $16.27 $21,089 $586, % $16.76 $21,722 UNDISTRIBUTED OPERATING EXPENSES Administrative & General $96, % $3.21 $3,571 $99, % $3.10 $3,678 $102, % $2.92 $3,788 $105, % $3.01 $3,902 $108, % $3.10 $4,019 Management Fees $40, % $1.34 $1,485 $41, % $1.29 $1,529 $42, % $1.22 $1,575 $43, % $1.25 $1,622 $45, % $1.29 $1,671 Marketing & Entertainment $20, % $0.67 $742 $20, % $0.65 $775 $0 0.0% $0.00 $0 $23, % $0.66 $859 $23, % $0.68 $884 Professional Fees $12, % $0.43 $480 $13, % $0.42 $494 $13, % $0.39 $509 $14, % $0.40 $524 $14, % $0.42 $540 Repairs & Maintenance $38, % $1.30 $1,442 $40, % $1.25 $1,485 $41, % $1.18 $1,530 $42, % $1.22 $1,576 $43, % $1.25 $1,623 Utilities $33, % $1.11 $1,236 $34, % $1.07 $1,273 $35, % $1.01 $1,311 $36, % $1.04 $1,351 $37, % $1.07 $1,391 Total Undist. Oper. Expenses $241, % $8.06 $8,956 $249, % $7.79 $9,235 $235, % $6.72 $8,713 $265, % $7.59 $9,833 $273, % $7.81 $10,128 HOUSE PROFIT $201, % $6.70 $7,447 $225, % $7.06 $8,367 $317, % $9.07 $11,761 $303, % $8.68 $11,256 $313, % $8.94 $11,593 FIXED CHARGES Property Taxes $45, % $1.53 $1,699 $47, % $1.48 $1,750 $48, % $1.39 $1,802 $50, % $1.43 $1,856 $51, % $1.47 $1,912 Insurance $36, % $1.21 $1,339 $37, % $1.16 $1,379 $38, % $1.10 $1,421 $39, % $1.13 $1,463 $40, % $1.16 $1,507 Reserve for Replacement $26, % $0.89 $990 $27, % $0.87 $1,034 $30, % $0.86 $1,112 $30, % $0.88 $1,145 $31, % $0.91 $1,179 Total Fixed Charges $108, % $3.62 $4,027 $112, % $3.51 $4,162 $117, % $3.34 $4,334 $120, % $3.44 $4,464 $124, % $3.55 $4,598 NET OPERATING INCOME $92, % $3.08 $3,420 $113, % $3.55 $4,205 $200, % $5.73 $7,427 $183, % $5.24 $6,791 $188, % $5.40 $6, COLLIERS INTERNATIONAL VALUATION & ADVISORY SERVICES 57
64 INCOME CAPITALIZATION APPROACH Stonebridge Golf Club of New Orleans Ten-Year Projection of Income and Expense Period: 2017/ / / /21 (Stabilized) 2021/ / / / / /27 Projection Year: Rounds Holes DEPARTMENTAL REVENUES $ % T otal $ % T otal $ % T otal $ % T otal $ % T otal $ % T otal $ % T otal $ % T otal $ % T otal $ % T otal Membership Dues $166, % $171, % $177, % $182, % $187, % $193, % $199, % $205, % $211, % $217, % Golf Playing Fees $339, % $350, % $394, % $406, % $418, % $430, % $443, % $457, % $470, % $485, % Golf Carts $278, % $305, % $344, % $354, % $365, % $376, % $387, % $399, % $411, % $423, % Driving Range $45, % $46, % $47, % $49, % $50, % $52, % $53, % $55, % $57, % $58, % Food & Beverage $333, % $343, % $354, % $364, % $375, % $386, % $398, % $410, % $422, % $435, % Pro Shop Merchandise $139, % $143, % $147, % $151, % $156, % $161, % $166, % $171, % $176, % $181, % Pro Shop $27, % $28, % $29, % $30, % $31, % $32, % $33, % $34, % $35, % $36, % Other Income $5, % $5, % $5, % $6, % $6, % $6, % $6, % $6, % $7, % $7, % Total Departmental Revenues $1,336, % $1,395, % $1,500, % $1,545, % $1,591, % $1,639, % $1,688, % $1,739, % $1,791, % $1,845, % DEPARTMENTAL COSTS Golf Course Maintenance $434, % $447, % $461, % $474, % $489, % $503, % $518, % $534, % $550, % $567, % Golf Carts $64, % $66, % $68, % $70, % $72, % $74, % $77, % $79, % $81, % $84, % Driving Range $3, % $3, % $3, % $3, % $3, % $3, % $3, % $4, % $4, % $4, % Food & Beverage $183, % $189, % $194, % $200, % $206, % $212, % $219, % $225, % $232, % $239, % Pro Shop COGS $76, % $78, % $81, % $83, % $86, % $88, % $91, % $94, % $96, % $99, % Pro Shop $130, % $134, % $138, % $142, % $147, % $151, % $156, % $160, % $165, % $170, % Total Departmental Costs $893, % $920, % $947, % $976, % $1,005, % $1,035, % $1,066, % $1,098, % $1,131, % $1,165, % DEPARTMENTAL INCOME $442, % $475, % $552, % $569, % $586, % $604, % $622, % $640, % $660, % $679, % UNDISTRIBUTED OPERATING EXPENSES Administrative & General $96, % $99, % $102, % $105, % $108, % $111, % $115, % $118, % $122, % $125, % Management Fees $40, % $41, % $42, % $43, % $45, % $46, % $47, % $49, % $50, % $52, % Marketing & Entertainment $20, % $20, % $0 0.0% $23, % $23, % $24, % $25, % $26, % $26, % $27, % Professional Fees $12, % $13, % $13, % $14, % $14, % $15, % $15, % $15, % $16, % $16, % Repairs & Maintenance $38, % $40, % $41, % $42, % $43, % $45, % $46, % $47, % $49, % $50, % Utilities $33, % $34, % $35, % $36, % $37, % $38, % $39, % $41, % $42, % $43, % Total Undist. Oper. Expenses $241, % $249, % $235, % $265, % $273, % $281, % $290, % $298, % $307, % $317, % HOUSE PROFIT $201, % $225, % $317, % $303, % $313, % $322, % $332, % $342, % $352, % $362, % FIXED CHARGES Property Taxes $45, % $47, % $48, % $50, % $51, % $53, % $54, % $56, % $58, % $59, % Insurance $36, % $37, % $38, % $39, % $40, % $41, % $43, % $44, % $45, % $47, % Reserve for Replacement $26, % $27, % $30, % $30, % $31, % $32, % $33, % $34, % $35, % $36, % Total Fixed Charges $108, % $112, % $117, % $120, % $124, % $127, % $131, % $135, % $139, % $143, % NET OPERATING INCOME $92, % $113, % $200, % $183, % $188, % $194, % $200, % $206, % $212, % $218, % 2017 COLLIERS INTERNATIONAL VALUATION & ADVISORY SERVICES 58

65 INCOME CAPITALIZATION APPROACH The following is a graphical analysis of the subject property s operating expense characteristics. The top of the graph represents total revenue, while the bottom represents net operating income. Expense Characteristics $2,000,000 Golf Course Maintenance Golf Carts Driving Range $1,500,000 Food & Beverage Pro Shop COGS Pro Shop $1,000,000 $500,000 Administrative & General Management Fees Marketing & Entertainment Professional Fees Repairs & Maintenance Utilities Base Management Fee $ TTM / / / / /22 Property Taxes Insurance -$500,000 Historical / Projection Period As illustrated, there are generally moderate modifications that have been applied to the subject s expense line items. As discussed earlier in this report, we have compared the subject s actual operating levels with comparable operating statements and industry averages. In instances where these line items were not consistent with industry norms, or were omitted altogether, we have applied the adjustments in our projections. The following sections discuss how this cash flow (net operating income) projection is converted into market value for the subject property. YIELD CAPITALIZATION Yield capitalization is a method of converting future income from an investment into present value by discounting each year's income using an appropriate discount rate or by using one overall rate that reflects the investment. The anticipated economic benefits which is typically the net operating income stream is converted into a value opinion using investment rates that are applicable to investments with similar characteristics. The yield capitalization process takes into consideration the risk profile of the income stream in determining which rates are appropriate for arriving at a value conclusion for the subject golf club. Our analysis refers to an all-cash purchase. The following paragraphs detail our analysis and assumptions. Terminal Capitalization Rate A terminal capitalization rate is a rate used to estimate the resale value of a property at the end of the holding period. The expected net operating income (NOI) per year is divided by the terminal cap rate (expressed as a percentage) to get the terminal value. Terminal capitalization rates are based on forecasts and estimates and changes based on the person doing the calculation. This rate is also known as the reversionary capitalization rate COLLIERS INTERNATIONAL VALUATION & ADVISORY SERVICES 59
66 INCOME CAPITALIZATION APPROACH Investor surveys, discussions with market participants and the subject s investment characteristics were considered in developing our opinion of the terminal capitalization rate for the subject. The following table provides a historical illustration of terminal rate statistics as surveyed by The Society of Golf Appraisers (SGA) that we believe are relevant to the subject property. TERMINAL CAPITALIZATION RATE CONCLUSION SOURCE QUARTER RANGE AVG SGA 2017 Survey Golf % to 15.00% 11.20% Going-In Vs Terminal Spread 90 bps AVERAGE 8.00% to 15.00% 11.20% TERMINAL CAPITALIZATION RATE CONCLUSION - Discount Rate The discount rate, or internal rate of return, is the rate of discount on an investment that equates the present value of the investment's cash outflows with the present value of the investment's cash inflows. The rate is expressed as the real return anticipated in the golf club investment and considers any change in value as well as all associated risk premiums. It is the average annual rate of return necessary to attract capital based upon the overall investment characteristics. We continually interact with investors and brokers of golf club properties throughout the world, and discuss the investment parameters and various rates with industry experts. Furthermore, we consider published rates, and those rates which are implied in actual transactions of lodging facilities. The following graph provides a historical illustration of discount rate statistics as surveyed by PricewaterhouseCoopers that we believe are relevant to the subject property. DISCOUNT RATE (IRR) CONCLUSIONS SOURCE QUARTER RANGE AVG RealtyRates.com Golf 3Q % to 18.36% 13.33% Capitalization Vs Discount Spread 70 bps Public Daily Fee Courses 3Q % to 18.13% 13.02% Capitalization Vs Discount Spread 75 bps Semi-Private Clubs 3Q % to 18.36% 13.47% Capitalization Vs Discount Spread 45 bps SGA 2017 Survey Golf % to 20.00% 13.80% Capitalization Vs Discount Spread 350 bps DISCOUNT RATE IRR CONCLUSION (CASH FLOW) 11.25% DISCOUNT RATE IRR CONCLUSION (REVERSION) 10.25% 14.50% DISCOUNT RATE (IRR) 13.50% 12.50% 11.50% 10.50% RealtyRates.com 3Q 08 3Q 09 3Q 10 3Q 11 3Q 12 3Q 13 3Q 14 3Q 15 3Q 16 3Q 17 RR Golf RR Public Daily Fee Courses RR Semi-Private Clubs 2017 COLLIERS INTERNATIONAL VALUATION & ADVISORY SERVICES 60
67 INCOME CAPITALIZATION APPROACH Subject Property Considerations Other observations about the subject property which had a bearing on our selection of investment parameters include the following: The subject includes land that is not currently needed to support the existing improvement but has not been subdivided from the property. Surplus land does not have an independent highest and best use but it does contribute to the overall value. In fact during contract negotiations, current ownership proposed subdividing up to 15 residential lots from the golf hole corridors. The buyers were not agreeable to this. This is noted here because the presence of surplus land and the possibility of subdividing it at some later point decreases the investment risk of the subject relative to other similar properties. This situation is reflected in our yield and cap rate conclusions. The subject's rate structure is typical in the marketplace. We believe the subject will be able to post increases in green fees/cart fees/member fees prior to the date of stabilization, with gains approximately representative of inflation each year thereafter. The subject property is currently owned on a Fee Simple basis with no known encumbering characteristics which would negatively impact its marketability. As previously discussed, the subject is expected to post improving operating performance over the next few years. While we believe this improvement is supported, it is still considered to be speculative and possess a certain degree of uncertainty. Such uncertainty plays a direct role in the return requirements a potential investor would command from the subject property. Over the assumed 10-year holding period, more volatile changes are noted early in the projection as the subject is expected to post improvement. Following the stabilized year, growth rates are expected to moderate and represent growth indicative of inflation. The following table illustrates growth rates for various departmental income and expense line items, measured in increments that are relevant to the stabilization period and the 10-year holding period. DEPARTMENTAL REVENUES Base Year to Year 1 Year 1 to Stabilized Year Year 1 to Year 10 Stabilized Year to Year 10 Membership Dues 2.5% 3.0% 3.0% 3.0% Golf Playing Fees 17.5% 6.1% 4.0% 3.0% Golf Carts 14.0% 8.4% 4.8% 3.0% Driving Range 16.3% 3.0% 3.0% 3.0% Food & Beverage 6.5% 3.0% 3.0% 3.0% Pro Shop Merchandise 38.8% 3.0% 3.0% 3.0% Pro Shop 23.4% 3.0% 3.0% 3.0% Other Income 23.2% 3.0% 3.0% 3.0% Total Departmental Revenues 13.3% 5.0% 3.7% 3.0% DEPARTMENTAL COSTS Golf Course Maintenance 1.5% 3.0% 3.0% 3.0% Golf Carts 1.5% 3.0% 3.0% 3.0% Driving Range 16.3% 3.0% 3.0% 3.0% Food & Beverage 2.9% 3.0% 3.0% 3.0% Pro Shop COGS 6.2% 3.0% 3.0% 3.0% Pro Shop -12.0% 3.0% 3.0% 3.0% Total Departmental Costs -0.2% 3.0% 3.0% 3.0% DEPARTMENTAL INCOME 74.1% 8.7% 4.9% 3.0% UNDISTRIBUTED OPERATING EXPENSES Administrative & General -11.9% 3.0% 3.0% 3.0% Management Fees -17.6% 3.0% 3.0% 3.0% Marketing & Entertainment 7.9% 5.0% 3.7% 3.0% Professional Fees 1.5% 3.0% 3.0% 3.0% Repairs & Maintenance -7.8% 3.0% 3.0% 3.0% Utilities -22.9% 3.0% 3.0% 3.0% Total Undist. Oper. Expenses -12.4% 3.2% 3.1% 3.0% HOUSE PROFIT % 6.8% 3.0% As will be further discussed, we have researched various golf transactions in the region. Based on information which was revealed during our verification process of these golf club sales, capitalization rates ranged from 8.50% to 17.03% with an average of 11.37%. The following table summarizes this transaction information: 2017 COLLIERS INTERNATIONAL VALUATION & ADVISORY SERVICES 61
68 INCOME CAPITALIZATION APPROACH Transactional Summary - Comparable Improved Sales Range Level Sale Date Sale Price $/Hole GIM OAR Low Dec-12 $996,000 $44, % Average Feb-16 $2,195,200 $101, % High Aug-17 $5,150,000 $286, % Transactional Summary - Supplemental Investment Metrics Low Jul-14 $750,000 $41, % Average Aug-16 $3,100,833 $180, % High Dec-17 $11,800,000 $655, % DISCOUNTED CASH FLOW CONCLUSION The projection of net operating income and the resulting discounted cash flow are presented on the following tables. The following are key inputs to the valuation: Discount Rate: Terminal Capitalization Rate: Holding Period: Closing Costs: 11.25% (annually) 10.25% (applied to the 11 th year NOI) 10 years Projection Commencement: December 12, % (deducted from the projected sale price) Date of Stabilization: December 12, 2020 (Year 4) Reversion Year: 2026/27 (Year 10) Calculation of Market Value, As Is Stonebridge Golf Club of New Orleans Discounted Cash Flow Analysis Projection Projection Net Operating Discount Present Value Cash on Composition Period Year Income (NOI) Factor of NOI Cash Return of Value 11.25% /18 $92,332 x $82, % 4.78% /19 $113,529 x $91, % 5.28% /20 $200,538 x $145, % 8.39% /21 (Stabilized) $183,370 x $119, % 6.90% /22 $188,871 x $110, % 6.39% /23 $194,537 x $102, % 5.91% /24 $200,374 x $95, % 5.47% /25 $206,385 x $87, % 5.07% /26 $212,576 x $81, % 4.69% /27 $218,954 x $75, % 4.34% Total/Net Present Value of NOI: $1,811,466 $993, % 57.23% Reversion Analysis Proj. Projection NOI Concluded Reversion Period Year (EBITDA) Terminal Rate Value /28 $225, % $2,200,217 Less: Transactional Costs x 2.00% -$44,004 Net Reversion $2,156,212 Discount Factor Total Present Value of Reversion $742,491 Composition of Value 42.77% Value Prior to Capital Deductions $1,735, COLLIERS INTERNATIONAL VALUATION & ADVISORY SERVICES 62
69 INCOME CAPITALIZATION APPROACH Stonebridge Golf Club of New Orleans Valuation Analysis Indicated Calculation of Market Value, As Is $1,735,810 Rounded $1,740,000 Number of Rooms Value Estimate Per Room $58 Historical First Stabilized Analysis Period: Trailing-12 Month 2017/ /21 Projection Period: Gross Income Multiplier Net Operating Income* $43,561 $92,332 $183,370 Implied Capitalization Rate 2.51% 5.32% 10.56% * Historical year data expressed to reflect market-oriented operations, management fees and reserves for replacement. OPINION OF PROSPECTIVE MARKET VALUE UPON STABILIZATION A prospective value opinion is defined as: The value expected at a specified future date. A prospective value opinion is most frequently sought in connection with real estate projects that are proposed, under construction, or under conversion to a new use, or that have not achieved sellout or a stabilized level of long-term occupancy at the time the appraisal report is written. In this analysis we have considered an opinion of the Prospective Market Value Upon Stabilization for the subject property. Based upon our projections as detailed in the Income Capitalization Approach, this event is assumed to occur on or about December 12, Please note that the IRR selected for the stabilized holding period is lower than the IRR selection for the initial 10-year projection. The lower investment return is due to the notion that there is less ramp-up risk inherent in the cash flows for the latter projection period. Furthermore, beyond the stabilized year, it is likely that a prudent investor would recognize that the property will have achieved a fairly stable patron base with repeat accommodations. On the following pages are the net operating income projections and the discounted cash flow analysis for the Prospective Market Value Upon Stabilization COLLIERS INTERNATIONAL VALUATION & ADVISORY SERVICES 63
70 INCOME CAPITALIZATION APPROACH Ten-Year Projection of Income and Expense - Prospective Market Value Upon Stabilization STONEBRIDGE GOLF CLUB OF NEW ORLEANS Period: 2020/21 (Stabilized) 2021/ / / / / / / / /30 Projection Year: Days Open: Rounds 35,000 35,000 35,000 35,000 35,000 35,000 35,000 35,000 35,000 35,000 Holes DEPARTMENTAL REVENUES $ % T otal $ % T otal $ % T otal $ % T otal $ % T otal $ % T otal $ % T otal $ % T otal $ % T otal $ % T otal Membership Dues $182, % $187, % $193, % $199, % $205, % $211, % $217, % $224, % $230, % $237, % Golf Playing Fees $406, % $418, % $430, % $443, % $457, % $470, % $485, % $499, % $514, % $530, % Golf Carts $354, % $365, % $376, % $387, % $399, % $411, % $423, % $436, % $449, % $462, % Driving Range $49, % $50, % $52, % $53, % $55, % $57, % $58, % $60, % $62, % $64, % Food & Beverage $364, % $375, % $386, % $398, % $410, % $422, % $435, % $448, % $461, % $475, % Pro Shop Merchandise $151, % $156, % $161, % $166, % $171, % $176, % $181, % $186, % $192, % $198, % Pro Shop $30, % $31, % $32, % $33, % $34, % $35, % $36, % $37, % $38, % $39, % Other Income $6, % $6, % $6, % $6, % $6, % $7, % $7, % $7, % $7, % $7, % Total Departmental Revenues $1,545, % $1,591, % $1,639, % $1,688, % $1,739, % $1,791, % $1,845, % $1,900, % $1,957, % $2,016, % DEPARTMENTAL COSTS Golf Course Maintenance $474, % $489, % $503, % $518, % $534, % $550, % $567, % $584, % $601, % $619, % Golf Carts $70, % $72, % $74, % $77, % $79, % $81, % $84, % $86, % $89, % $92, % Driving Range $3, % $3, % $3, % $3, % $4, % $4, % $4, % $4, % $4, % $4, % Food & Beverage $200, % $206, % $212, % $219, % $225, % $232, % $239, % $246, % $254, % $261, % Pro Shop COGS $83, % $86, % $88, % $91, % $94, % $96, % $99, % $102, % $105, % $109, % Pro Shop $142, % $147, % $151, % $156, % $160, % $165, % $170, % $175, % $180, % $186, % Total Departmental Costs $976, % $1,005, % $1,035, % $1,066, % $1,098, % $1,131, % $1,165, % $1,200, % $1,236, % $1,273, % DEPARTMENTAL INCOME $569, % $586, % $604, % $622, % $640, % $660, % $679, % $700, % $721, % $742, % UNDISTRIBUTED OPERATING EXPENSES Administrative & General $105, % $108, % $111, % $115, % $118, % $122, % $125, % $129, % $133, % $137, % Management Fees $43, % $45, % $46, % $47, % $49, % $50, % $52, % $53, % $55, % $57, % Marketing & Entertainment $23, % $23, % $24, % $25, % $26, % $26, % $27, % $28, % $29, % $30, % Professional Fees $14, % $14, % $15, % $15, % $15, % $16, % $16, % $17, % $17, % $18, % Repairs & Maintenance $42, % $43, % $45, % $46, % $47, % $49, % $50, % $52, % $53, % $55, % Utilities $36, % $37, % $38, % $39, % $41, % $42, % $43, % $44, % $46, % $47, % Total Undist. Oper. Expenses $265, % $273, % $281, % $290, % $298, % $307, % $317, % $326, % $336, % $346, % HOUSE PROFIT $303, % $313, % $322, % $332, % $342, % $352, % $362, % $373, % $384, % $396, % FIXED CHARGES Property Taxes $50, % $51, % $53, % $54, % $56, % $58, % $59, % $61, % $63, % $65, % Insurance $39, % $40, % $41, % $43, % $44, % $45, % $47, % $48, % $50, % $51, % Reserve for Replacement $30, % $31, % $32, % $33, % $34, % $35, % $36, % $38, % $39, % $40, % Total Fixed Charges $120, % $124, % $127, % $131, % $135, % $139, % $143, % $148, % $152, % $157, % NET OPERATING INCOME $183, % $188, % $194, % $200, % $206, % $212, % $218, % $225, % $232, % $239, % 2017 COLLIERS INTERNATIONAL VALUATION & ADVISORY SERVICES 64
71 INCOME CAPITALIZATION APPROACH Discounted Cash Flow Analysis Calculation of Prospective Market Value, Upon Stabilization Stonebridge Golf Club of New Orleans Projection Projection Net Operating Discount Present Value Cash on Composition Period Year Income (NOI) Factor of NOI Cash Return of Value 10.75% (in 2020/21 dollars) /21 (Stabilized) $183,370 x $165, % 8.00% /22 $188,871 x $153, % 7.44% /23 $194,537 x $143, % 6.92% /24 $200,374 x $133, % 6.44% /25 $206,385 x $123, % 5.99% /26 $212,576 x $115, % 5.57% /27 $218,954 x $107, % 5.18% /28 $225,522 x $99, % 4.82% /29 $232,288 x $92, % 4.48% /30 $239,257 x $86, % 4.16% Total/Net Present Value of NOI: $2,102,134 $1,220, % 58.99% Reversion Analysis Proj. Projection NOI Concluded Reversion Period Year (EBITDA) Terminal Rate Value /31 $246, % $2,404,236 Less: Transactional Costs x 2.00% -$48,085 Net Reversion $2,356,151 Discount Factor Total Present Value of Reversion $848,723 Composition of Value 41.01% Value Prior to Capital Deductions $2,069, COLLIERS INTERNATIONAL VALUATION & ADVISORY SERVICES 65

72 INCOME CAPITALIZATION APPROACH DIRECT CAPITALIZATION METHOD Direct capitalization is a method used to convert an opinion of a single year s income expectancy into an indication of value. The single year s income is typically designed to reflect a golf club s stabilized level of operation and revenue potential. The conversion into a value indication is accomplished in one direct step by dividing the income by an appropriate capitalization rate. The direct capitalization rate is also known as the goingin rate and the overall rate (OAR). Development of Capitalization Rate The OAR can be determined using several sources and methods. In developing our opinion of OAR, the following techniques were used: Comparable Sales (Sales Comparison Approach) Investor Surveys Band of Investment Technique Comparable Sales The following table presents a summary of the overall rates that were observed from the comparable sales used in the Sales Comparison Approach, which will be detailed later in this report: Transactional Summary - Comparable Improved Sales Range Level Sale Date Sale Price $/Hole GIM OAR Low Dec-12 $996,000 $44, % Average Feb-16 $2,195,200 $101, % High Aug-17 $5,150,000 $286, % Investor Surveys The potential investor pool for the subject asset includes national, regional and local investors. While all of these groups place emphasis on local cap rates, regional and national investors would also strongly consider national cap rate trends from investor surveys due to the potential to invest in other regions that are offering competitive rates of return. The following table provides a historical illustration of capitalization rate statistics. CAPITALIZATION RATE SURVEYS (OAR) SOURCE QUARTER RANGE AVG RealtyRates.com Golf 3Q % to 18.20% 12.63% Public Daily Fee Courses 3Q % to 17.67% 12.27% Semi-Private Clubs 3Q % to 18.20% 13.02% SGA 2017 Survey Golf % to 15.00% 10.30% AVERAGE 6.31% 18.02% 12.06% Band of Investment Technique Because most properties are purchased with debt and equity capital, the overall capitalization rate must satisfy the market return requirements of both investment positions. Lenders must anticipate receiving a competitive interest rate commensurate with the perceived risk of the investment or they will not make funds available. Lenders also require that the principal amount of the loan be repaid through amortization payments. Similarly, equity investors must anticipate receiving a competitive equity cash return commensurate with the perceived risk or they will invest their funds elsewhere COLLIERS INTERNATIONAL VALUATION & ADVISORY SERVICES 66
73 INCOME CAPITALIZATION APPROACH To analyze the capitalization rate from a financial position, the Band of Investment Technique is used. Available financing information indicates the following terms: Equity dividend rates vary depending upon motivations of buyers and financing terms. The previous terms and an appropriate equity dividend rate are used in the Band of Investments calculations, which are presented on the following chart. As previously discussed, we have determined that a terminal capitalization rate of 10.25% is appropriate and supportable for the subject asset. In determining the overall, or going in rate, we have considered all of the risk characteristics of the subject property and its local market. Based on our analysis, we believe that a going-in capitalization rate that would be recognized by a prudent investor would have a spread of 100 bps from the terminal capitalization rate. A spread is normally accounted for and intended to reflect the difference in uncertainty in market conditions between the two time periods, as well as the overall expected condition of the subject property and its competitive position in the market. As will be further discussed, we have researched various golf property transactions in the region. Based on information which was revealed during our verification process of these sales, capitalization rates ranged from 8.50% to 17.03% with an average of 11.37%. In addition, we routinely conduct participant interviews regarding capitalization rates and investment parameters for assets such as the subject. Responses seem to be in-line with our conclusions, although we have not relied on these responses given the respondents lack of knowledge of the subject s economics. Capitalization Rate Selection BAND OF INVESTMENT ASSUMPTIONS Loan Amortization Period We have considered all aspects of the subject property that would influence the overall rate. Our analysis suggests that a going-in capitalization rate (Ro) of 9.25% represents reasonable investor criteria under market conditions which are expected to exist in the stabilized year. This selected rate is supported by both the investor survey and the Mortgage-Equity analysis presented earlier in this section. Direct Capitalization Consideration of the Stabilized Year 30 Years Interest Rate 7.00% Loan-to-Value (LTV) Ratio 70% Mortgage Constant 7.98% BAND OF INVESTMENT CALCULATION Mortgage Component 70% x 7.98% = 5.589% Equity Component 30% x 12.00% = 3.600% Indicated Capitalization Rate 9.189% INDICATED CAPITALIZATION RATE 9.19% In an effort to employ the Direct Capitalization Method, we first developed an opinion of prospective market value upon stabilization by dividing the stabilized year s net operating income by our selected overall capitalization rate. The following table illustrates the projected operating performance for the subject upon stabilization COLLIERS INTERNATIONAL VALUATION & ADVISORY SERVICES 67
74 INCOME CAPITALIZATION APPROACH Stabilized Year Statement of Operations Stonebridge Golf Club of New Orleans Period: 2020/21 (Stabilized) Projection Year: 4 Number of Rounds 35,000 Number of Holes 27 DEPARTMENTAL REVENUES $ % T otal $ PAR $ POR Membership Dues $182, % $5.21 $6,753 Golf Playing Fees $406, % $11.61 $15,046 Golf Carts $354, % $10.13 $13,131 Driving Range $49, % $1.41 $1,829 Food & Beverage $364, % $10.42 $13,506 Pro Shop Merchandise $151, % $4.34 $5,628 Pro Shop $30, % $0.87 $1,126 Other Income $6, % $0.17 $225 Total Departmental Revenues $1,545, % $44.16 $57,243 DEPARTMENTAL COSTS Golf Course Maintenance $474, % $13.57 $17,591 Golf Carts $70, % $2.02 $2,617 Driving Range $3, % $0.10 $133 Food & Beverage $200, % $5.73 $7,428 Pro Shop COGS $83, % $2.39 $3,095 Pro Shop $142, % $4.08 $5,290 Total Departmental Costs $976, % $27.89 $36,154 DEPARTMENTAL INCOME $569, % $16.27 $21,089 UNDISTRIBUTED OPERATING EXPENSES Administrative & General $105, % $3.01 $3,902 Management Fees $43, % $1.25 $1,622 Marketing & Entertainment $23, % $0.66 $859 Professional Fees $14, % $0.40 $524 Repairs & Maintenance $42, % $1.22 $1,576 Utilities $36, % $1.04 $1,351 Total Undist. Oper. Expenses $265, % $7.59 $9,833 HOUSE PROFIT $303, % $8.68 $11,256 FIXED CHARGES Property Taxes $50, % $1.43 $1,856 Insurance $39, % $1.13 $1,463 Reserve for Replacement 0 $30,911 $0 2.0% 0.0% $0.88 $1,145 Total Fixed Charges $120, % $3.44 $4,464 NET OPERATING INCOME $183, % $5.24 $6,791 0 $0 $0 To recap, we have considered all aspects of the subject property that would influence the overall rate. Our analysis suggests that a capitalization rate of 9.25% during this projection year represents reasonable investor criteria under market conditions anticipated to exist during the selected stabilized year of operations. Our conclusion using the Direct Capitalization Method on a stabilized basis is as follows. DIRECT CAPITALIZATION METHOD Calculation of Prospective Market Value, Upon Stabilization Net Operating Income $183,370 Sensitivity Analysis (0.25% OAR Spread) Value Per Hole Based on Low Range of 8.75% $2,095,659 $77,617 Based on Reduced Rate of 9.00% $2,037,447 $75,461 Based on Most Probable Range of 9.25% $1,982,380 $73,421 Based on Elevated Rate of 9.50% $1,930,213 $71,489 Based on High Range of 9.75% $1,880,720 $69,656 Indicated Prospective Market Value $1,982,380 $73,421 ROUNDED PROSPECTIVE MARKET VALUE $1,980,000 $73,333 To account for the interim cash flows that occur between the present and the future date of property stabilization, we have made adjustments to the stabilized value estimate in order to arrive at the market value of the subject property at the commencement of the holding period. It is important to note that the interim discount rate 2017 COLLIERS INTERNATIONAL VALUATION & ADVISORY SERVICES 68
75 INCOME CAPITALIZATION APPROACH employed in this analysis is higher than the discount rate used in the 10-year DCF. This is due to the notion that a higher degree of risk, as reflected in the revenue growth rates, being taken on during this interim period. Lastly, deductions for capital expenditures are also applied, as appropriate. PRESENT VALUE CALCULATION Prospective Stabilized Market Value Value Per Hole Conclusion $1,980,000 $73,333 Stabilization Year 4 Resulting Holding Period 3 Spread over Primary Discount Rate 100 bps Interim Discount Rate 12.25% Calculation of As Is Market Value Year 1 Cash Flow $92,332 Year 2 Cash Flow $113,529 Year 3 Cash Flow $200,538 Present Value of Interim Cash Flows at 12.25% IRR $314,145 $11,635 Present Value of Stabilized Market Value at 12.25% IRR $1,399,929 $51,849 Subtotal $1,714,074 $63,484 Indicated Market Value As Is $1,714,074 $63,484 As Is Market Value $1,710,000 $63, COLLIERS INTERNATIONAL VALUATION & ADVISORY SERVICES 69
76 INCOME CAPITALIZATION APPROACH GROSS INCOME MULTIPLIER ANALYSIS The gross income multiplier (GIM) is calculated in the sales transactions by dividing the sales price by the projected income of the first stabilized year for the subject property. The GIM expresses the relationship between a sales price and the property's gross income. The principal advantage of using economic units of comparison is that the reflection of value is direct, i.e. no adjustments are necessary. If the comparable properties have some advantage over the subject property in terms of the various elements of comparison, the difference in actual revenues and efficiencies of operations primarily reflect the extent of this advantage. However, there are other variables that affect the price/income relationship such as the condition of the property, the stability of the income stream, the likelihood of near term change (up or down), and the ratio of operating expenses to income. For golf properties, the multiplier is a useful valuation tool used by buyers in the marketplace. These buyers are typically only concerned with income being generated by the golf club. The general attitude is that they can operate the property more efficiently than the previous owner. Additionally, these buyers are often very handson and are more operationally efficient by keeping payroll low. The comparable sales, in which we were able to extract RRMs, ranged from 1.20 to 3.49 with an average of (Additional information regarding these comparable sales are presented in the next section of this report.) In addition to the comparable sales, we discussed golf pricing with several golf/broker specialists such as Hilda Allen of Hilda R. Allen Real Estate, Steve Ekovich with Marcus & Millichap s National Golf & Resort Properties Group, and Brett Miller of Miller Management. Further, we have recently discussed market conditions with representatives of several active buying entities such as Concert Golf Properties, Heritage Golf, Escalante, ClubCorp, McConnell Golf, etc. There are several groups who have access to capital and are actively seeking buying opportunities. These groups tend to be targeting clubs with over $3.0 to $4.0 million in gross revenues and recently, we have seen several groups pursuing the same properties, which has resulted in higher pricing. Nonetheless, pricing is still within the range of 1.0 to 1.50 times annual gross Given the subject s current condition, historical operating performance, effective age, location, and risk characteristics in the market discussed earlier in this report, we believe our selected stabilized year income multiplier is reasonable. The following table summarizes the prospective market value of the subject property upon stabilization employing the GIM method COLLIERS INTERNATIONAL VALUATION & ADVISORY SERVICES 70
77 INCOME CAPITALIZATION APPROACH Room Revenue Multiplier (RRM) Adjustment Analysis Sale No. Name and Location Sales Price Gross Income GIM 1 Highlands Ridge, Avon Park, FL $1,600,000 $1,333,333 = Pete Dye Golf Club, Bridgeport, WV $2,322,000 $1,022,907 = Tallgrass Country Club, Wichita, KS $1,300,000 $773,810 = Club at Pelican Bay, Daytona Beach, FL $3,060,000 $876,791 = Eagle Ridge Golf Club, Summerfield, FL $3,500,000 $2,134,146 = 1.64 S1 Hollytree County Club, Tyler, TX $11,800,000 $8,805,970 = 1.34 S2 Imperial Lakewoods Golf Club, Palmetto, FL $1,275,000 $996,094 = 1.28 S3 Hidden Valley Golf Course, Morgantown, KY $995,000 $759,542 = 1.31 S4 Stuart Place Golf Resort, Harlingen, TX $885,000 $737,500 = 1.20 Range Analysis GIM Subject Stabilized Gross Income Indicated Value Per Hole Low 1.20 $1,545,563 $1,850,000 $68,519 Average 1.71 $1,545,563 $2,650,000 $98,148 High 3.49 $1,545,563 $5,390,000 $199,630 Value Conclusion Value Per Hole Indicated Stabilized RRM 1.25 Subject First Stabilized Year Rooms Revenue $1,545,563 Indicated Stabilized Value $1,931,953 (Rounded) $1,930,000 $71,481 To account for the interim cash flows that occur between the present and the future date of property stabilization, we have made adjustments to the stabilized value estimate in order to arrive at the market value of the subject property as of the commencement of the holding period. As discussed earlier, the interim discount rate employed in this analysis is higher than the discount rate used in the 10-year DCF. This is due to the notion that a higher degree of risk, as reflected in the revenue growth rates, being taken on during this interim period. Lastly, deductions for capital expenditures are also applied, as appropriate. A detailed calculation of the present value adjustment is presented below. PRESENT VALUE CALCULATION Prospective Stabilized Market Value Value Per Room Conclusion $1,930,000 $71,481 Stabilization Year 4 Resulting Holding Period 3 Spread over Primary Discount Rate 100 bps Interim Discount Rate 12.25% Calculation of As Is Market Value Year 1 Cash Flow $92,332 Year 2 Cash Flow $113,529 Year 3 Cash Flow $200,538 Present Value of Interim Cash Flows at 12.25% IRR $314,145 $11,635 Present Value of Stabilized Market Value at 12.25% IRR $1,364,578 $50,540 Subtotal $1,678,722 $62,175 As Is Market Value $1,680,000 $62, COLLIERS INTERNATIONAL VALUATION & ADVISORY SERVICES 71
78 INCOME CAPITALIZATION APPROACH RECONCILIATION WITHIN THE INCOME APPROACH The following summarizes the final value conclusions for all values and approaches considered in this analysis: RECONCILIATION: INCOME APPROACH Income Approach As Is Upon Stabilization Discounted Cash Flow $1,740,000 $2,070,000 Direct Capitalization Approach $1,710,000 $1,980,000 Gross Income Multiplier $1,680,000 $1,930,000 Reconciled Value via Income Approach $1,740,000 $2,070,000 We have placed primary emphasis on the Discounted Cash Flow because this mirrors the methodology used by investors of this type of property COLLIERS INTERNATIONAL VALUATION & ADVISORY SERVICES 72
79 SALES COMPARISON APPROACH INTRODUCTION The Sales Comparison Approach is based on the principle of substitution, which asserts that a buyer would not pay more for a property than the value of similar properties in the market. This approach analyzes comparable sales by applying transactional and property adjustments to bracket the subject property within an appropriate unit value comparison. UNIT OF COMPARISON The most relevant unit of comparison is the price per hole. This indicator best reflects the analysis used by buyers and sellers in this market for improved properties with similar design and utility. COMPARABLE SELECTION We performed a thorough search for similar improved sales in terms of property type, location, physical characteristics, and date of sale. In selecting comparables, emphasis was placed on confirming recent improved sales of properties that match the highest and best use, and buyer/seller profile of the subject property. Overall, the sales selected represent the best comparables available for this analysis. PRESENTATION The following table summarizes the improved sales data. Following these items, the comparable sales are adjusted for applicable elements of comparison and the opinion of value by the Sales Comparison Approach is concluded COLLIERS INTERNATIONAL VALUATION & ADVISORY SERVICES 73
80 SALES COMPARISON APPROACH SALES COMPARABLE SUMMATION TABLE Property Information Transaction Information No. Property Name Address, City, State S SUBJECT PROPERTY Stonebridge Drive Gretna, Louisiana Club Type Number of Holes Grantor Grantee Sale Date Sale Price $/Hole GIM OAR Daily Fee Highlands Ridge Carter Creek Lane Avon Park, FL Daily Fee 36 Mink Realty Associates, LLC CDS Air Freight Sep-16 $1,600,000 $44, % 2 Pete Dye Golf Club Aaron Smith Drive Bridgeport, WV 3 Tallgrass Country Club North Tallgrass Wichita, KS Private 18 Pete Dye Golf Club John Howard Motors Aug-16 $2,322,000 $129, % Private 18 Heritage Golf Group Rick Farrant Jun-16 $1,300,000 $72, % 4 Club at Pelican Bay Pelican Bay Drive Daytona Beach, FL Daily Fee 36 Cpb Management Llc Caporaletti Golf Management L.P. Sep-14 $3,060,000 $85, % 5 Feather Sound Country Club Feather Sound Drive Clearwater, FL 6 Eagle Ridge Golf Club Del Webb Boulevard Summerfield, FL 7 Ridgepointe County Club Ridgepointe Drive Jonesboro, AR 8 Marcus Pointe Golf Club Oak Pointe Drive Pensacola, FL 9 Hombre Golf Club Coyote Pass Panama City Beach, FL 10 Scenic Hills Country Club Burning Tree Road Pensacola, FL 11 Heritage Golf Course Twin Oaks Country Club Heritage Road Oneonta, AL Private 18 Fore Golf Partners, LLC Dale Schmidt Mar-14 $5,150,000 $286, % Daily Fee 36 PulteGroup, Inc. Brown Golf Management Dec-12 $3,500,000 $97, % Daily Fee 18 Jim Lyons Jim Cooper Jun-17 $2,069,202 $114, Daily Fee 18 Martine's Corporation Marcus Pointe Golf Club Dec-16 $2,000,000 $111, Daily Fee 18 Edgewater Estates Inc Hombre Dev Llc Aug-16 $1,150,000 $63, Daily Fee 18 University of West Florida RNL Investment Group Aug-17 $1,000,000 $55, Daily Fee 18 John Currier John Boyd Sep-16 $996,000 $55, Transactional Summary - Comparable Improved Sales Range Level Sale Date Sale Price $/Hole GIM OAR Low Dec-12 $996,000 $44, % Average Feb-16 $2,195,200 $101, % High Aug-17 $5,150,000 $286, % 2017 COLLIERS INTERNATIONAL VALUATION & ADVISORY SERVICES 74
81 SALES COMPARISON APPROACH OVERVIEW Golf property investments are considered to be relatively eccentric when compared to other types of commercial real estate. Due to this implicit characteristic, any adjustments that are applied are highly subjective in nature and greatly diminish the reliability of the conclusions. As observers of golf transactions, we note it is difficult to ascertain the actual motivation behind the buyer and/or seller. This is information that is crucial for determining the relevance of the transactions in an open-market environment. Because an appraiser has no way of measuring these influences, it is impossible to determine with any degree of certainty whether the purchase price paid reflects an arm s-length transaction or, ultimately, market value. The level of comparability between the subject property and those in the selected set is usually so vague that any adjustments that are actually applied are heavily subjective in nature. Due to the potential for error in these adjustments, the reliability of this approach is limited. As such, it is our opinion that the use of the Sales Comparison Approach in valuing golf courses is generally useful in establishing a range of value indicated by the Income Capitalization Approach. Some of the differences between the comparable sales and the subject property can also include market conditions, market orientation, management, rate structure, the highest and best use of the land and the anticipated profitability of the operation. Circumstances surrounding a sale, including financing terms, tax considerations, income guarantees, sales of partial interests, duress on the part of the buyer or seller, or a particular deal structure, result in disparities between the actual sales price and pure market value. Additionally, it is usually very difficult to obtain the marketing period, and an accurate capitalization rate, for the comparable sales. In practice, it is virtually impossible to quantify the appropriate adjustment factors accurately because of their number and complexity, as well as the difficulty in obtaining specific, detailed information. The following table illustrates a summary of our adjusted value ranges, overall adjustments and prospective value conclusion upon stabilization applied in the Sales Comparison Approach: Percent Adjustment Method Summary Unadjusted Unit Rage $44,444 to $286,111 Adjusted Unit Rage $44,444 to $286,111 Rounded Adjusted Unit Range $44,000 to $286,000 Market Value Upon Stabilization Indicated Value per Unit $77,000 Number of Units 27 Indicated Prospective Value $2,079,000 Rounded to nearest $10,000 $2,080,000 Per unit $77,037 To account for the interim cash flows that occur between the present and the future date of property stabilization, we have made adjustments to the stabilized value estimate in order to arrive at the market value of the subject property as of the commencement of the holding period. It is important to note that the interim discount rate employed in this analysis is higher than the discount rate used in the 10-year DCF. This is due to the notion that a higher degree of risk, as reflected in the revenue growth rates, being taken on during this interim period. Lastly, deductions for capital expenditures are also applied, as appropriate COLLIERS INTERNATIONAL VALUATION & ADVISORY SERVICES 75
82 SALES COMPARISON APPROACH PRESENT VALUE CALCULATION Prospective Stabilized Market Value Value Per Hole Conclusion $2,080,000 $77,037 Stabilization Year 4 Resulting Holding Period 3 Spread over Primary Discount Rate 100 bps Interim Discount Rate 12.25% Calculation of As Is Market Value Year 1 Cash Flow $92,332 Year 2 Cash Flow $113,529 Year 3 Cash Flow $200,538 PV of Interim Cash Flows at 12.25% IRR $314,145 $11,635 PV of Stabilized Market Value at 12.25% IRR $1,470,633 $54,468 Subtotal $1,784,778 $66,103 Indicated Market Value As Is $1,784,778 $66,103 As Is Market Value $1,780,000 $65, COLLIERS INTERNATIONAL VALUATION & ADVISORY SERVICES 76
83 RECONCILIATION OF VALUE CONCLUSIONS INTRODUCTION The Reconciliation of Value Conclusions is the final step in the appraisal process and involves the weighing of the individual valuation techniques in relationship to their substantiation by market data, and the reliability and applicability of each valuation technique to the subject property. Understanding the profiles of potential buyers and their typical reliance on each approach to value strongly influences the weighting process. As addressed earlier in this report, the cost approach has limited reliability in the valuation of existing golf clubs. We find there is considerable difficulty in accurately quantifying physical deterioration, and it is our experience that experienced purchasers of complex golf club properties are more concerned with the economics of the investment. Hence, we have not placed any emphasis on the Cost Approach. The price per hole method has been presented in the Sales Comparison Approach. The subject would sell at a price point where market participants typically put minimal emphasis on this approach. Recognizing the shifting market conditions, investors would typically give limited weight to the Sales Comparison Approach in determining value. Therefore, minimal weight is given to the Sales Comparison Approach in this analysis but rather was employed in estimating a range in value for the subject property and as a test of reasonableness for our conclusion via the Income Capitalization Approach. The Income Approach to value is generally considered to be the best and most accurate measure of the value of income-producing properties. In this analysis, the Discounted Cash Flow was developed and relied most heavily upon in arriving at final determination of value. The value estimate by this approach best reflects the analysis that knowledgeable buyers and sellers carry out in their decision-making processes regarding this type of property. Sufficient market data was available to reliably estimate gross income, expenses and capitalization and discount rates for the subject property. We have also considered the inclusion of the Direct Capitalization approach and the Gross Income Multiplier methods and, depending on the subject s operating characteristics (number of years to stabilization, etc.), may have some degree of reliability. The Discounted Cash Flow is generally given primary emphasis within the Income Capitalization Approach. Our opinion of value reflects current conditions and the likely actions of market participants as of the date of value. It is based on the available information gathered and provided to us, as presented in this report, and does not predict future performance. Changing market or property conditions can and likely will have an effect on the subject's value. RECONCILIATION OF VALUE CONCLUSIONS We have placed primary emphasis on the Income Capitalization Approach and, more specifically, the Discounted Cash Flow method as this mirrors the methodology of purchasers of this type of property. After considering all factors relevant to the valuation of the subject property, the subject s value conclusions and final reconciliation are presented in the following table: 2017 COLLIERS INTERNATIONAL VALUATION & ADVISORY SERVICES 77
84 RECONCILIATION OF VALUE CONCLUSIONS ANALYSIS OF VALUE CONCLUSIONS Methodology for As Is Upon Stabilization Market Value Conclusions December 12, 2017 December 12, 2020 Sales Comparison Approach Concluded Value $1,780,000 $2,080,000 Income Approach Discounted Cash Flow $1,740,000 $2,070,000 Direct Capitalization Approach $1,710,000 $1,980,000 Gross Income Multiplier $1,680,000 $1,930,000 Reconciled Value via Income Approach $1,740,000 $2,070,000 Reconciled Value Conclusion $1,740,000 $2,070,000 Per Hole $64,444 $76,667 CONTRIBUTORY VALUE OF THE FURNITURE, FIXTURES AND EQUIPMENT Business personal property for golf clubs includes furniture and fixtures typically found in the clubhouses and maintenance equipment such as mowers, tractors, aerators, etc. Business personal property is often referred to as FF&E; furniture, fixtures, and equipment. It is common for golf carts and some maintenance equipment to be leased. In these cases, the total going concern value analyses include considerations for lease expenses so that they are effectively excluded from the value opinions. The subject includes a clubhouse with modest furnishings, kitchen equipment, some office type equipment such as desks, cash register, telephones, etc. In the local market, business owners have to file annual reports with the parish assessor s office providing a depreciated schedule of business personal property. The most recent filing with Jefferson Parish indicates the depreciated value of business personal property is $28,020. Given the equipment lease arrangement, as well as the age and amount of the subject FF&E, the reported value is considered reasonable. This appraisal uses a rounded allowance for business personal property of $28,000. The following table summarizes our value and depreciation estimates for the FF&E components that are employed in this appraisal. FF&E: VALUE AND DEPRECIATION Summary As Is Upon Stabilization Percent Depreciated 42.9% 57.1% Estimated Value $28,000 $24,000 Please note, the effective ages of the FF&E tend to fluctuate depending on the timing of the analysis. CONTRIBUTORY VALUE OF BUSINESS AND OTHER INTANGIBLE COMPONENTS (GOING CONCERN) Going Concern Overview A going concern is a business that functions without the threat of liquidation for the foreseeable future, usually regarded as at least within 12 months. It implies for the business the basic declaration of intention to keep running its activities at least for the next year, which is a basic assumption to prepare financial statements considering the conceptual framework of the IFRS. Hence, the declaration of going concern means that the entity has neither the intention nor the need to liquidate or curtail materially the scale of its operations. Definition The going concern assumption is universally understood and accepted by accounting professionals; however, it has never been formally incorporated into U.S. GAAP. In October 2008, FASB issued an Exposure Draft called, going concern. It discusses the following possible pronouncements for the going concern: Reconsideration of defining and incorporating the terms going concern and substantial doubt into U.S. GAAP; The time horizon over which management would evaluate the entity s ability to meet its obligations; 2017 COLLIERS INTERNATIONAL VALUATION & ADVISORY SERVICES 78
85 RECONCILIATION OF VALUE CONCLUSIONS The type of information that management should consider in evaluating the entity s ability to meet its obligations; The effect of subsequent events on management s evaluation of the entity s ability to meet its obligations; Whether to provide guidance on the liquidation basis of accounting A current definition of the going concern assumption can be found in the AICPA Statement on Auditing Standards No.1 Codification of Auditing Standards and Procedures, Section 341, The Auditor s Consideration of an Entity s Ability to Continue as a Going Concern (AU Section 341) The 'going concern' concept assumes that the business will remain in existence long enough for all the assets of the business to be fully utilized. Utilized assets means obtaining the complete benefit from their earning potential. (i.e. if you recently purchased equipment costing $5,000 that had 5 years of productive/useful life, then under the going concern assumption, the accountant would only write off one year's value $1,000 (1/5th ) this year, leaving $4,000 to be treated as a fixed asset with future economic value for the business) Accounting This accounting principle assumes that, a company will continue to exist long enough to carry out its objectives and commitments and will not liquidate in the foreseeable future. If the company's financial situation is such that the accountant believes the company will not be able to continue on, the accountant is required to disclose this assessment. The going concern principle allows the company to defer some of its prepaid expenses until future accounting periods. The going concern assumption is a fundamental principle in the preparation of financial statements. Under the going concern assumption, an entity is ordinarily viewed as continuing in business for the foreseeable future with neither the intention nor the necessity of liquidation, ceasing trading or seeking protection from creditors pursuant to laws or regulations. Accordingly, unless the going concern assumption is inappropriate in the circumstances of the entity, assets and liabilities are recorded on the basis that the entity will be able to realize its assets, discharge its liabilities, and obtain refinancing (if necessary) in the normal course of business. An entity is assumed to be a going concern in the absence of significant information to the contrary. An example of such contrary information is an entity s inability to meet its obligations as they come due without substantial asset sales or debt restructurings. If such were not the case, an entity would essentially be acquiring assets with the intention of closing its operations and reselling the assets to another party. If the accountant believes that an entity may no longer be a going concern, then this brings up the issue of whether its assets are impaired, which may call for the write-down of their carrying amount to their liquidation value. Thus, the value of an entity that is assumed to be a going concern is higher than its breakup value, since a going concern can potentially continue to earn profits. The going concern concept is not clearly defined anywhere in generally accepted accounting principles, and so is subject to a considerable amount of interpretation regarding when an entity should report it. However, generally accepted auditing standards (GAAS) do instruct an auditor regarding the consideration of an entity s ability to continue as a going concern. The auditor evaluates an entity s ability to continue as a going concern for a period not greater than one year following the date of the financial statements being audited. The auditor considers such items as negative trends in operating results, loan defaults, denial of trade credit from suppliers uneconomical long-term commitments, and legal proceedings in deciding if there is a substantial doubt about an entity s ability to continue as a going concern. If so, the auditor must qualify the audit report with a statement about the problem. This Guidance provides a framework to assist directors, audit committees and finance teams in determining whether it is appropriate to adopt the going concern basis for preparing financial statements and in making balanced, 2017 COLLIERS INTERNATIONAL VALUATION & ADVISORY SERVICES 79
86 RECONCILIATION OF VALUE CONCLUSIONS proportionate and clear disclosures. Separate standards and guidance have been issued by the Auditing Practices Board to address the work of auditors in relation to going concern. Assumption Under the going concern assumption, an entity is viewed as continuing in business for the foreseeable future. General purpose financial statements are prepared on a going concern basis, unless management either intends to liquidate the entity or to cease operations, or has no realistic alternative but to do so. Special purpose financial statements may or may not be prepared in accordance with a financial reporting framework for which the going concern basis is relevant (for example, the going concern basis is not relevant for some financial statements prepared on a tax basis in particular jurisdictions). When the use of the going concern assumption is appropriate, assets and liabilities are recorded on the basis that the entity will be able to realize its assets and discharge its liabilities in the normal course of business. Auditing Continuation of an entity as a going concern is assumed in financial reporting in the absence of significant information to the contrary. Ordinarily, information that significantly contradicts the going concern assumption relates to the entity's inability to continue to meet its obligations as they become due without substantial disposition of assets outside the ordinary course of business, restructuring of debt, externally forced revisions of its operations, or similar actions. Responsibilities The auditor has a responsibility to evaluate whether there is substantial doubt about the entity's ability to continue as a going concern for a reasonable period of time, not to exceed one year beyond the date of the financial statements being audited (hereinafter referred to as a reasonable period of time). The auditor's evaluation is based on his or her knowledge of relevant conditions and events that exist at or have occurred prior to the date of the auditor's report. Information about such conditions or events is obtained from the application of auditing procedures planned and performed to achieve audit objectives that are related to management's assertions embodied in the financial statements being audited, as described in Auditing Standard No. 15, Audit Evidence. The auditor should evaluate whether there is substantial doubt about the entity's ability to continue as a going concern for a reasonable period of time in the following manner: The auditor considers whether the results of his procedures performed in planning, gathering evidential matter relative to the various audit objectives, and completing the audit identify conditions and events that, when considered in the aggregate, indicate there could be substantial doubt about the entity's ability to continue as a going concern for a reasonable period of time. It may be necessary to obtain additional information about such conditions and events, as well as the appropriate evidential matter to support information that mitigates the auditor's doubt. If the auditor believes there is substantial doubt about the entity's ability to continue as a going concern for a reasonable period of time, he should obtain information about management's plans that are intended to mitigate the effect of such conditions or events, and assess the likelihood that such plans can be effectively implemented. After the auditor has evaluated management's plans, he concludes whether he has substantial doubt about the entity's ability to continue as a going concern for a reasonable period of time. If the auditor concludes there is substantial doubt, he should consider the adequacy of disclosure about the entity's possible inability to continue as a going concern for a reasonable period of time, and include an explanatory paragraph (following the opinion paragraph) in his audit report to reflect his conclusion. If the auditor concludes that substantial doubt does not exist, he should consider the need for disclosure COLLIERS INTERNATIONAL VALUATION & ADVISORY SERVICES 80
87 RECONCILIATION OF VALUE CONCLUSIONS The auditor is not responsible for predicting future conditions or events. The fact that the entity may cease to exist as a going concern subsequent to receiving a report from the auditor that does not refer to substantial doubt, even within one year following the date of the financial statements, does not, in itself, indicate inadequate performance by the auditor. Accordingly, the absence of reference to substantial doubt in an auditor's report should not be viewed as providing assurance as to an entity's ability to continue as a going concern. Procedures It is not necessary to design audit procedures solely to identify conditions and events that, when considered in the aggregate, indicate there could be substantial doubt about the entity's ability to continue as a going concern for a reasonable period of time. The results of auditing procedures designed and performed to achieve other audit objectives should be sufficient for that purpose. The following are examples of procedures that may identify such conditions and events: Analytical procedures Review of subsequent events Review of compliance with the terms of debt and loan agreements Reading of minutes of meetings of stockholders, board of directors, and important committees of the board Inquiry of an entity's legal counsel about litigation, claims, and assessments Confirmation with related and third parties of the details of arrangements to provide or maintain financial support Conditions and Events In performing audit procedures such as those presented in paragraph.05, the auditor may identify information about certain conditions or events that, when considered in the aggregate, indicate there could be substantial doubt about the entity's ability to continue as a going concern for a reasonable period of time. The significance of such conditions and events will depend on the circumstances, and some may have significance only when viewed in conjunction with others. The following are examples of such conditions and events: Negative trends for example, recurring operating losses, working capital deficiencies, negative cash flows from operating activities, adverse key financial ratios Other indications of possible financial difficulties for example, default on loan or similar agreements, arrearages in dividends, denial of usual trade credit from suppliers, restructuring of debt, noncompliance with statutory capital requirements, need to seek new sources or methods of financing or to dispose of substantial assets Internal matters for example, work stoppages or other labor difficulties, substantial dependence on the success of a particular project, uneconomic long-term commitments, need to significantly revise operations External matters that have occurred for example, legal proceedings, legislation, or similar matters that might jeopardize an entity's ability to operate; loss of a key franchise, license, or patent; loss of a principal customer or supplier; uninsured or underinsured catastrophe such as a drought, earthquake, or flood. Management s Plans If, after considering the identified conditions and events in the aggregate, the auditor believes there is substantial doubt about the ability of the entity to continue as a going concern for a reasonable period of time, he should consider management's plans for dealing with the adverse effects of the conditions and events. The auditor should obtain information about the plans and consider whether it is likely the adverse effects will be mitigated for a reasonable period of time and that such plans can be effectively implemented. The auditor's considerations relating to management plans may include the following: 2017 COLLIERS INTERNATIONAL VALUATION & ADVISORY SERVICES 81
88 RECONCILIATION OF VALUE CONCLUSIONS Plans to dispose of assets Restrictions on disposal of assets, such as covenants limiting such transactions in loan or similar agreements or encumbrances against assets Apparent marketability of assets that management plans to sell Possible direct or indirect effects of disposal of assets Plans to borrow money or restructure debt Availability of debt financing, including existing or committed credit arrangements, such as lines of credit or arrangements for factoring receivables or sale-leaseback of assets Existing or committed arrangements to restructure or subordinate debt or to guarantee loans to the entity Possible effects on management's borrowing plans of existing restrictions on additional borrowing or the sufficiency of available collateral Plans to reduce or delay expenditures Apparent feasibility of plans to reduce overhead or administrative expenditures, to postpone maintenance or research and development projects, or to lease rather than purchase assets Possible direct or indirect effects of reduced or delayed expenditures Plans to increase ownership equity Apparent feasibility of plans to increase ownership equity, including existing or committed arrangements to raise additional capital Existing or committed arrangements to reduce current dividend requirements or to accelerate cash distributions from affiliates or other investors When evaluating management's plans, the auditor should identify those elements that are particularly significant to overcoming the adverse effects of the conditions and events and should plan and perform auditing procedures to obtain evidential matter about them. For example, the auditor should consider the adequacy of support regarding the ability to obtain additional financing or the planned disposal of assets. When prospective financial information is particularly significant to management's plans, the auditor should request management to provide that information and should consider the adequacy of support for significant assumptions underlying that information. The auditor should give particular attention to assumptions that are Material to the prospective financial information. Especially sensitive or susceptible to change. Inconsistent with historical trends. The auditor's consideration should be based on knowledge of the entity, its business, and its management and should include (a) reading of the prospective financial information and the underlying assumptions and (b) comparing prospective financial information in prior periods with actual results and comparing prospective information for the current period with results achieved to date. If the auditor becomes aware of factors, the effects of which are not reflected in such prospective financial information, he should discuss those factors with management and, if necessary, request revision of the prospective financial information. Financial Statement Effects When, after considering management's plans, the auditor concludes there is substantial doubt about the entity's ability to continue as a going concern for a reasonable period of time, the auditor should consider the possible effects on the financial statements and the adequacy of the related disclosure. Some of the information that might be disclosed include: 2017 COLLIERS INTERNATIONAL VALUATION & ADVISORY SERVICES 82
89 RECONCILIATION OF VALUE CONCLUSIONS Pertinent conditions and events giving rise to the assessment of substantial doubt about the entity's ability to continue as a going concern for a reasonable period of time. The possible effects of such conditions and events. Management's evaluation of the significance of those conditions and events and any mitigating factors. Possible discontinuance of operations. Management's plans (including relevant prospective financial information). Information about the recoverability or classification of recorded asset amounts or the amounts or classification of liabilities. When, primarily because of the auditor's consideration of management's plans, he concludes that substantial doubt about the entity's ability to continue as a going concern for a reasonable period of time is alleviated, he should consider the need for disclosure of the principal conditions and events that initially caused him to believe there was substantial doubt. The auditor's consideration of disclosure should include the possible effects of such conditions and events, and any mitigating factors, including management's plans. Use in Risk Management If a public company and a private company reports that its auditors have doubts about its ability to continue as a going concern, investors may take that as a sign of increased risk, although an emphasis of matter paragraph in an audit report does not necessarily indicate that a company is on the verge of insolvency. Despite this, some fund managers may be required to sell the stock to maintain an appropriate level of risk in their portfolios. A negative judgment may also result in the breach of bank loan covenants or lead a debt rating firm to lower the rating on the company's debt, making the cost of existing debt increase and/or preventing the company from obtaining additional debt financing. Because of such responses to expressed concerns by auditors, in the 1970s, the American Institute of Certified Public Accountants' Cohen commission concluded that an auditor's expression of uncertainty about the entity's ability to continue as a going concern "tends to be a self-fulfilling prophecy. The auditor's expression of uncertainty about the company's ability to continue may contribute to making its failure a certainty." Businesses should also communicate with business advisors as well as their auditors in the time of trouble. Communication can let advisors and auditors help when needed. They can help business review their internal risk management along with other internal controls. Applicability to Golf Properties The ownership of golf clubs involves the bundling of rights that can be a combination of tangible and intangible real estate. One must analyze the level of operational efficiencies and effectiveness, as an example, to assess the business over and above the real estate value. There are a number of publications and theories that have been promulgated in an effort to systematically isolate and quantify the intangible (business) component of a golf club. Typical practice in underwriting and determining the value of a golf club is to consider, and account for, the cost of third-party managing agents to operate a property in return for a management fee. The management fee is paid to the operator as a normal operating expense. Below this line is identified net income available for debt service and a metric that can be used to calculate the equity ownership s position. With a competent golf club management company operating the property, the golf club owner does not need to be involved in the day-today operation of the asset. The market value of a property s going concern is typically determined by capitalizing its anticipated cash flow while implementing certain in-place strategies. Although we attempt to make adjustments to the profit-and-loss assumptions so the projections are market-oriented, we are relying on in-place controls which suggest that the market-oriented cash flow could render a capitalization result that includes certain value components that are not part of market value as defined by Interagency Appraisal and Evaluation Guidelines COLLIERS INTERNATIONAL VALUATION & ADVISORY SERVICES 83
90 RECONCILIATION OF VALUE CONCLUSIONS We note the following: The tangible real and personal property components of the subject property have been valued in this appraisal using the aforementioned techniques. These valuation methods account for and extract intangible value by the deduction of a market-oriented management fee and all applicable franchise and/or licensing costs. The subject property is located in a market with competitive pressure from other golf clubs. The feasibility in adding supply of golf properties to the market is limited. The subject is not considered an asset that currently has, or is expected to have at any point in the holding period, a sustainable competitive advantage that would generate excess rent or revenue to any of its departments. Furthermore, the subject property does not enjoy a sustained competitive advantage that would insulate it from an equilibrium environment. The market value of the subject property is deemed to be well below its replacement cost, including consideration for entrepreneurial profit. The application of the discount rate used in this appraisal reflects a relatively risky commercial real estate investment. The resulting market value when applying this discount rate (and other investment parameters) is not considerably in excess of comparable sales of similar asset types in the area. The subject s projected stabilized net operating income ratio is well within the range of comparable properties and is generally reflective of industry performance. By accounting for these factors, there is no business value included in our conclusion of market value. Furthermore, since it has been determined that there is no value to any component other than those to be recognized as part of market value in this appraisal, the going concern value in this document is concluded to be the same as market value. ALLOCATION OF PROPERTY COMPONENTS After considering the contributory value of the subject s FF&E as well as any intangible components, we have concluded to the following allocation of property components under the various scenarios: ALLOCATION OF PROPERTY COMPONENTS Component As Is Upon Stabilization Real Property $1,712,000 $2,046,000 Furniture, Fixtures and Equipment $28,000 $24,000 Business $0 $0 Total $1,740,000 $2,070, COLLIERS INTERNATIONAL VALUATION & ADVISORY SERVICES 84
91 CERTIFICATION OF APPRAISAL We certify that, to the best of our knowledge and belief: The statements of fact contained in this report are true and correct. The reported analyses, opinions, and conclusions of the signer(s) are limited only by the reported assumptions and limiting conditions, and are our personal, impartial, and unbiased professional analyses, opinions, and conclusions. The signer(s) of this report have no present or prospective interest in the property that is the subject of this report, and no personal interest with respect to the parties involved. None of the undersigned have performed services, as an appraiser or in any other capacity regarding the property that is the subject of this report, within the three-year period immediately preceding acceptance of this assignment. The undersigned are not biased with respect to the property that is the subject of this report or to the parties involved with this assignment. The engagement in this assignment was not contingent upon developing or reporting predetermined results. The compensation for completing this assignment is not contingent upon the development or reporting of a predetermined value or direction in value that favors the cause of the client, the amount of the value opinion, the attainment of a stipulated result, or the occurrence of a subsequent event directly related to the intended use of this appraisal. The reported analysis, opinions, and conclusions were developed, and this report has been prepared, in conformity with the Uniform Standards of Professional Appraisal Practice and the Code of Professional Ethics and Standards of Professional Appraisal Practice of the Appraisal Institute. Jason Lindsey, MAI inspected the property that is the subject of this report. No one provided significant real property appraisal assistance (general market research, property inspection) to the appraisers signing the certification. As of the date of this report, Jason Lindsey, MAI and Thomas Bogdon, MAI have completed the continuing education requirements of the Appraisal Institute. The use of this report is subject to the requirements of the Appraisal Institute relating to review by its duly authorized representatives. Jason Lindsey, MAI Valuation Services Director Hospitality and Leisure Group Certified General Real Estate Appraiser State of Louisiana License #G-1762 Expires 12/31/2019 Thomas Bogdon, MAI Executive Managing Director Valuation and Advisory Certified General Real Estate Appraiser State of Louisiana License # G-3786 Expires 12/31/ COLLIERS INTERNATIONAL VALUATION & ADVISORY SERVICES 85
92 ASSUMPTIONS & LIMITING CONDITIONS This appraisal is subject to the following assumptions and limiting conditions: The appraisers may or may not have been provided with a survey of the subject property. If further verification is required, a survey by a registered surveyor is advised. We assume no responsibility for matters legal in character, nor do we render any opinion as to title, which is assumed to be marketable. All existing liens, encumbrances, and assessments have been disregarded, unless otherwise noted, and the property is appraised as though free and clear, under responsible ownership, and competent management. The exhibits in this report are included to assist the reader in visualizing the property. We have made no survey of the property and assume no responsibility in connection with such matters. Unless otherwise noted herein, it is assumed that there are no encroachments, zoning, or restrictive violations existing in the subject property. The appraisers assume no responsibility for determining if the property requires environmental approval by the appropriate governing agencies, nor if it is in violation thereof, unless otherwise noted herein. Information presented in this report has been obtained from reliable sources, and it is assumed that the information is accurate. This report shall be used for its intended purpose only, and by the party to whom it is addressed. Possession of this report does not include the right of publication. The appraiser may not be required to give testimony or to appear in court by reason of this appraisal, with reference to the property in question, unless prior arrangements have been made therefore. The statements of value and all conclusions shall apply as of the dates shown herein. There is no present or contemplated future interest in the property by the appraiser which is not specifically disclosed in this report. Without the written consent or approval of the authors neither all, nor any part of, the contents of this report shall be conveyed to the public through advertising, public relations, news, sales, or other media. This applies particularly to value conclusions and to the identity of the appraiser and the firm with which the appraisers are connected. This report must be used in its entirety. Reliance on any portion of the report independent of others, may lead the reader to erroneous conclusions regarding the property values. Unless approval is provided by the authors no portion of the report stands alone. The valuation stated herein assumes professional management and operation of the buildings throughout the lifetime of the improvements, with an adequate maintenance and repair program. The liability of Colliers International Valuation & Advisory Services, its principals, agents, and employees is limited to the client. Further, there is no accountability, obligation, or liability to any third party. If this report is placed in the hands of anyone other than the client, the client shall make such party aware of all limiting conditions and assumptions of the assignment and related discussions. The appraisers are in no way responsible for any costs incurred to discover or correct any deficiency in the property. The appraisers are not qualified to detect the presence of toxic or hazardous substances or materials which may influence or be associated with the property or any adjacent properties, has made no investigation or analysis as to the presence of such materials, and expressly disclaims any duty to note the degree of fault. Colliers International Valuation & Advisory Services and its principals, agents, employees, shall not be liable for any costs, expenses, assessments, or penalties, or diminution in value, property damage, or personal 2017 COLLIERS INTERNATIONAL VALUATION & ADVISORY SERVICES 86
93 ASSUMPTIONS & LIMITING CONDITIONS injury (including death) resulting from or otherwise attributable to toxic or hazardous substances or materials, including without limitation hazardous waste, asbestos material, formaldehyde, or any smoke, vapors, soot, fumes, acids, alkalis, toxic chemicals, liquids, solids or gasses, waste materials or other irritants, contaminants or pollutants. The appraisers assume no responsibility for determining if the subject property complies with the Americans with Disabilities Act (ADA). Colliers International Valuation & Advisory Services, its principals, agents, and employees, shall not be liable for any costs, expenses, assessments, penalties or diminution in value resulting from non-compliance. This appraisal assumes that the subject meets an acceptable level of compliance with ADA standards; if the subject is not in compliance, the eventual renovation costs and/or penalties would negatively impact the present value of the subject. If the magnitude and time of the cost were known today, they would be reduced from the reported value conclusion. No evidence of asbestos materials on-site was noted or reported. This analysis assumes that no asbestos or other hazardous materials are stored or found in or on the subject property. If evidence of hazardous materials of any kind occurs, the reader should seek qualified professional assistance. If hazardous materials are discovered and if future market conditions indicate an impact on value and increased perceived risk, a revision of the concluded values may be necessary. A detailed soils study was not reviewed for this analysis. The subject's soils and sub-soil conditions are assumed to be suitable based upon a visual inspection, which did not indicate evidence of excessive settling or unstable soils. No certification is made regarding the stability or suitability of the soil or sub-soil conditions. The estimated operating results presented in this report are based on an evaluation of the overall economy, and neither take into account nor make provision for the effect of any sharp rise or decline in local or national economic conditions. To the extent that wages and other operating expenses may advance during the economic life of the property, we expect that the prices of green fees, food, beverages, and services will be adjusted to at least offset these advances. We do not warrant that the estimates will be attained, but they have been prepared on the basis of information obtained during the course of this study and are intended to reflect the expectations of typical investors. Appraising golf clubs is both a science and an art. Although this analysis employs various mathematical calculations to provide value indications, the final estimate is subjective and may be influenced by our experience and other factors not specifically set forth in this report. Any distribution of the total value between the land and improvements or between partial ownership interests applies only under the stated use. Moreover, separate allocations between components are not valid if this report is used in conjunction with any other analysis. We assume that the subject could be sold free and clear of any and all licensing agreements that are currently in place, but that the property would continue to operate under its current (or similar) brand For the purposes of this report, we assumed that the subject will be operated by competent and experienced management familiar with the operation of golf properties in the United States, and more specifically, in Gretna, Louisiana. In the event that any of the above conditions are not consistent with the subject s actual status, it could have an impact on the subject s overall marketability and underlying market value. It is assumed that the subject would secure all licenses to operate all departments of the property, including liquor licenses (if applicable). Our financial analyses are based on estimates and assumptions which were developed in connection with this appraisal engagement. It is, however, inevitable that some assumptions will not materialize and that unanticipated events may occur which will cause actual achieved operating results to differ from the financial 2017 COLLIERS INTERNATIONAL VALUATION & ADVISORY SERVICES 87
94 ASSUMPTIONS & LIMITING CONDITIONS analyses contained in this report, and these differences may be material. It should be further noted that we are not responsible for the effectiveness of future management and marketing efforts upon which the projected results contained in this report may depend. This analysis assumes that the financial information provided for this appraisal, including historical income and expense statements; accurately reflect the current and historical operations of the subject property COLLIERS INTERNATIONAL VALUATION & ADVISORY SERVICES 88
95 ADDENDA Engagement Letter Purchase Agreement Historical Financial Statements Qualifications of the CIVAS Golf Club and Resort Practice Valuation Glossary Qualifications & State Licenses of Appraisers 2017 COLLIERS INTERNATIONAL VALUATION & ADVISORY SERVICES 89
96
97
98
99

100
101
102
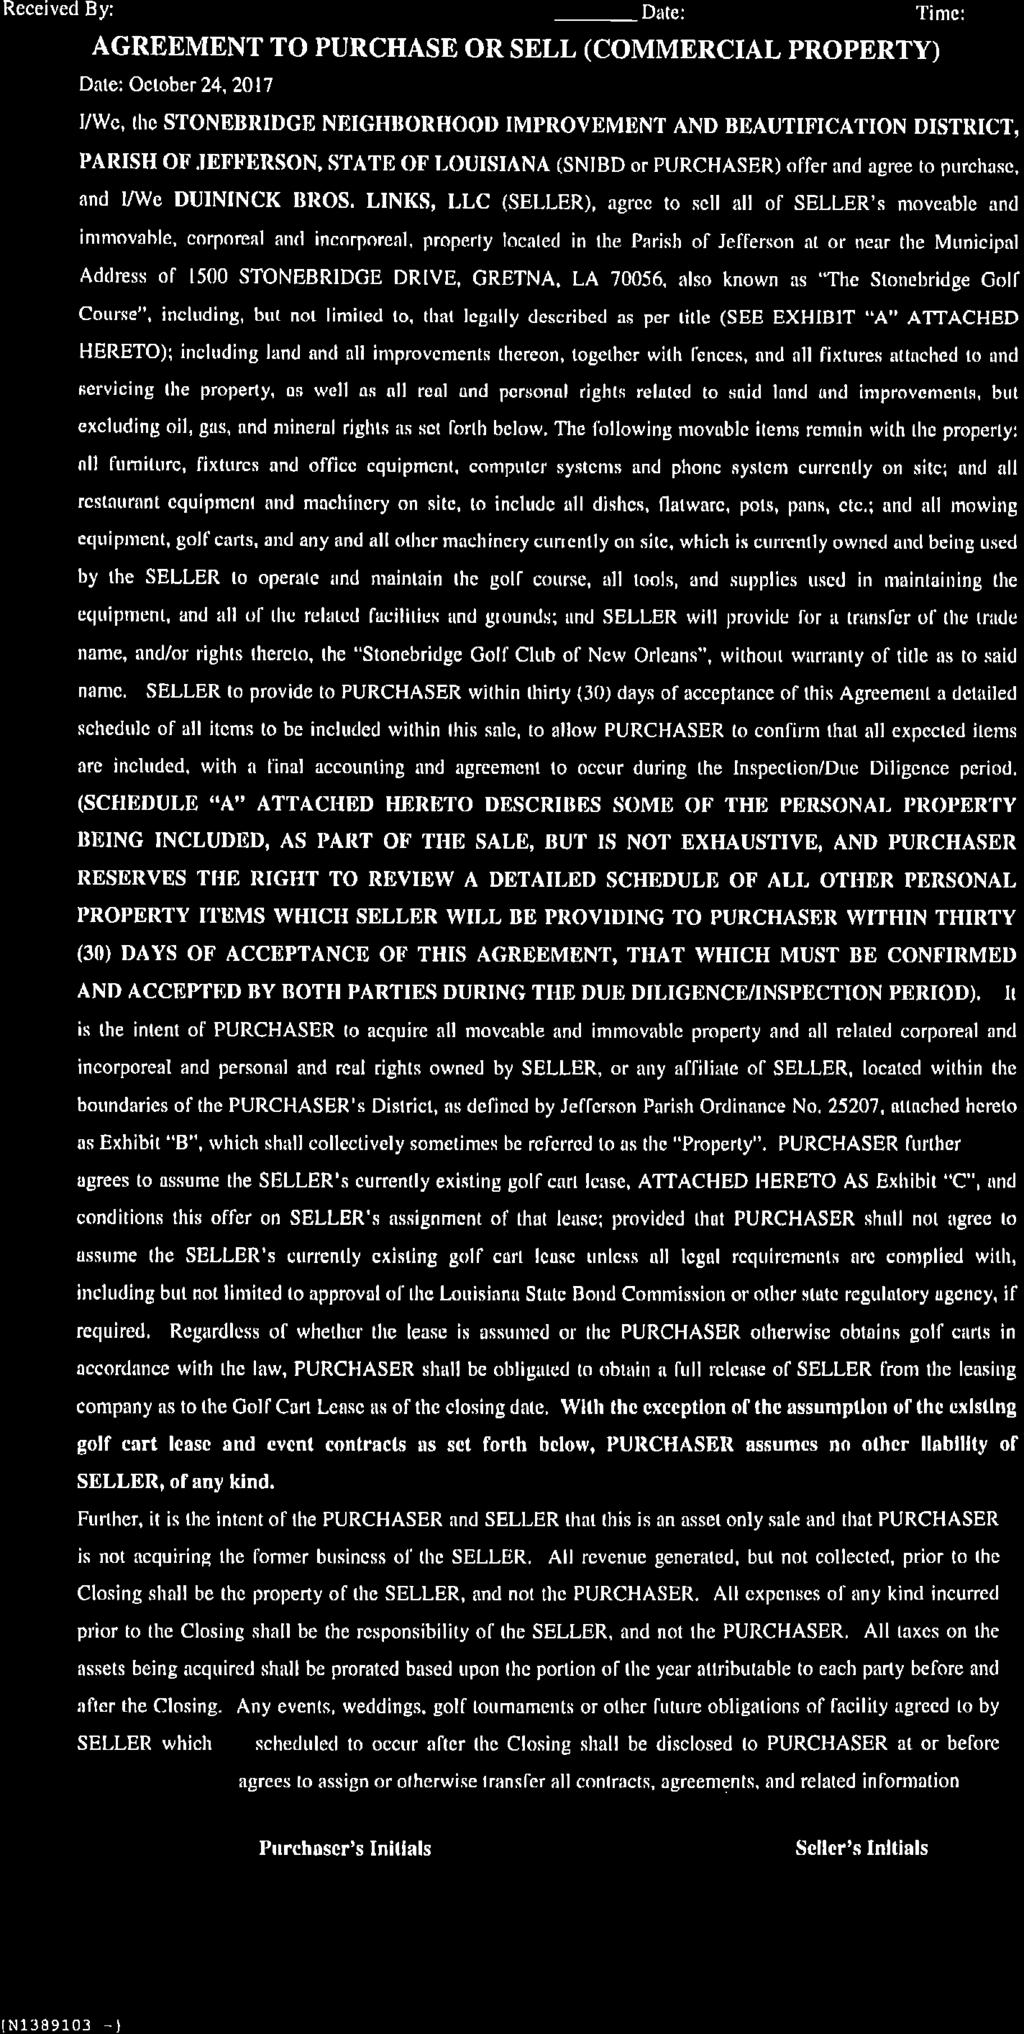
103

104
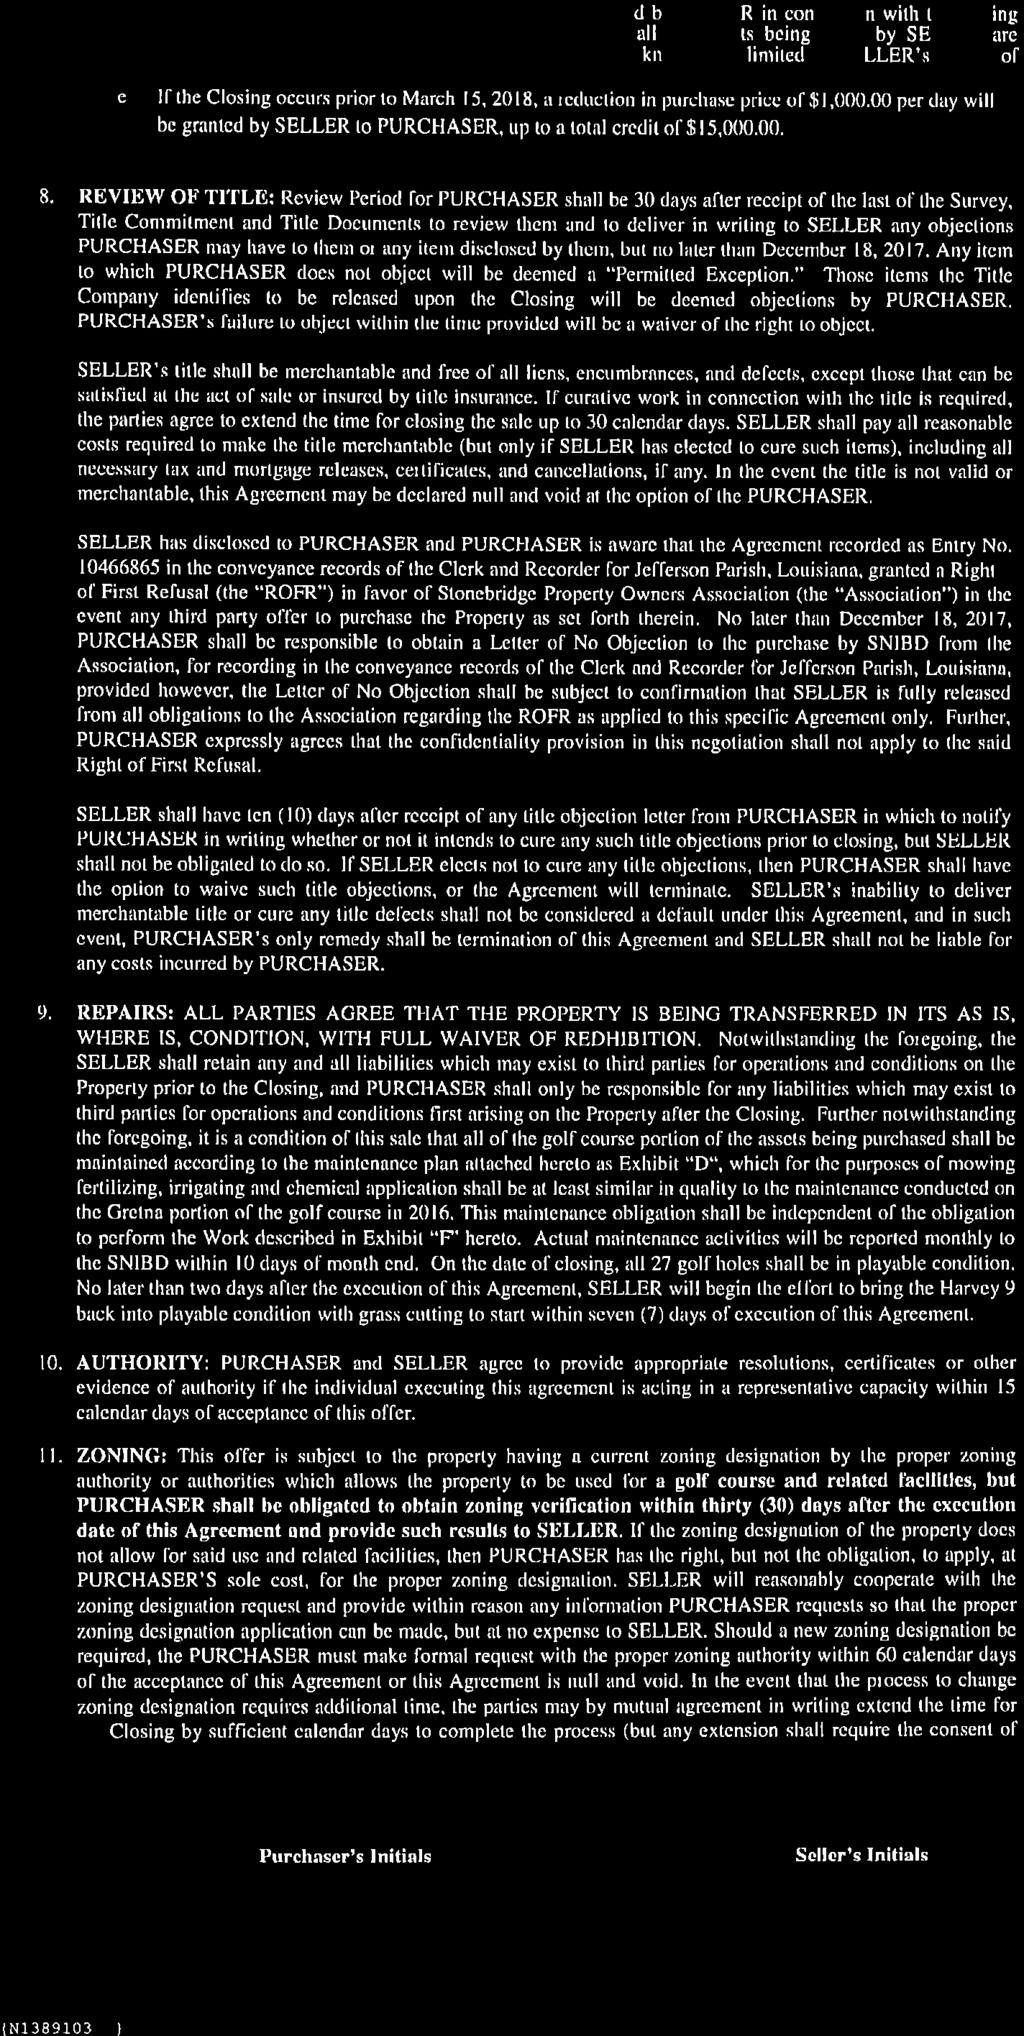
105
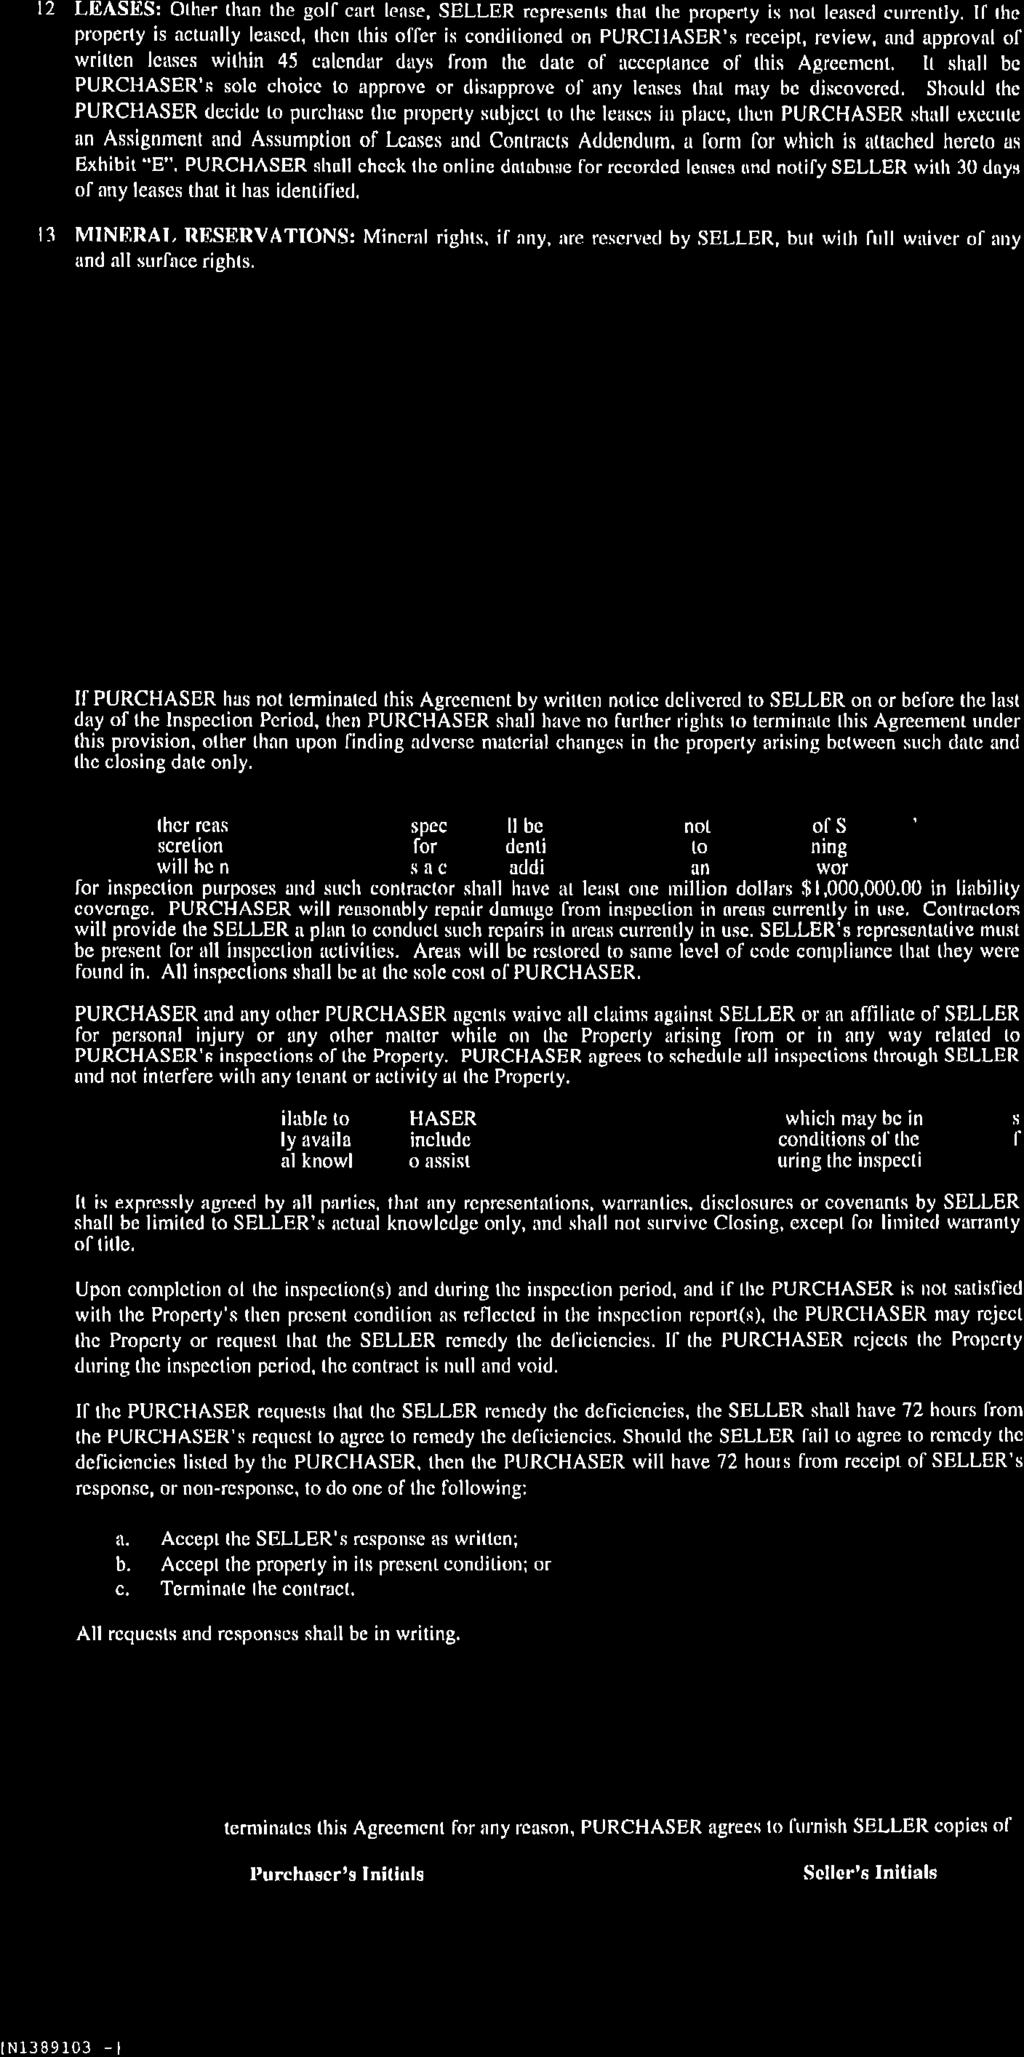
106

107
108

109
110 Stonebridge Golf Club of New Orleans Summary Income Statement For the Twelve Months Ending December 31, 2016 MTD % of MTD % of YTD % of YTD % of Annual Rolling Actual Budget Budget Prior Year PY Actual Budget Budget Prior Year PY Budget 12 Months REVENUES 20,846 37,386 56% 24,148 86% Green Fees & Cart Fees 402, ,204 76% 485,497 83% 530, ,839 4,855 7,042 69% 4, % Merchandise 91, ,079 77% 108,357 85% 119,079 91, % % Other Pro Shop 19,770 26,395 75% 24,519 81% 26,395 19,770 1,548 2,234 69% 1,796 86% Range 30,450 39,432 77% 36,464 84% 39,432 30,450 22,735 25,317 90% 33,167 69% Food and Beverage 271, ,294 94% 298,858 91% 288, ,287 9,513 10,130 94% 10,247 93% Membership Dues 121, ,895 97% 124,286 98% 124, , % 0 0% Other G&A Income % % ,961 83,084 72% 74,419 81% TOTAL REVENUE 938,188 1,128,299 83% 1,078,016 87% 1,128, ,188 COST OF SALES 5,131 4, % 2, % Merchandise 57,873 80,092 72% 65,969 88% 80,092 57,873 3,590 4,254 84% 5,338 67% Food & Beverage 61,626 61, % 75,084 82% 61,540 61,626 8,721 9,006 97% 7, % TOTAL COGS 119, ,632 84% 141,053 85% 141, , % 67.5% 156.6% 58.7% 180.0% COGS - Merchandise % 63.1% 67.3% 93.9% 60.9% 103.7% 67.3% 772.5% 26.1% 24.6% 106.2% 36.2% 72.2% COGS - Food % 39.9% 29.1% 137.2% 36.3% 110.0% 29.1% 483.6% PAYROLL 30,368 27, % 26, % Course and Grounds 355, , % 331, % 335, ,467 3,021 3,595 84% 2, % Carts, Range, Starters, Etc. 46,140 42, % 43, % 42,600 46,140 2,048 4,947 41% 4,393 47% Pro Shop 48,411 59,116 82% 57,183 85% 59,116 48,411 6,287 6,420 98% 11,075 57% Food and Beverage 82,627 76, % 80, % 76,496 82,627 10,241 10,816 95% 7, % General and Administrative 125, ,383 97% 105, % 129, ,489 51,965 53,148 98% 51, % TOTAL PAYROLL 658, , % 618, % 643, ,133 OPERATING EXPENSES 8,099 13,260 61% 10,648 76% Course and Grounds 184, ,850 92% 199,080 93% 200, ,593 6,701 5, % 5, % Carts, Range, Starters, Etc. 74,957 78,673 95% 75, % 78,673 74,957 1, % % Pro Shop 12,043 9, % 11, % 9,767 12,043 1,424 2,837 50% 4,499 32% Food and Beverage 29,756 35,036 85% 50,149 59% 35,036 29,756 8,048 6, % 6, % General and Administrative 119, ,861 97% 133,815 89% 122, , ,100 0% 1,250 0% Marketing 6,879 15,424 45% 10,720 64% 15,424 6,879 25,941 30,871 84% 29,210 89% TOTAL OPERATING EXPENSES 427, ,610 92% 480,077 89% 462, ,489 86,627 93,025 93% 88,761 98% TOTAL EXPENSES 1,205,120 1,247,409 97% 1,239,837 97% 1,247,409 1,205,120 (26,666) (9,941) 268% (14,342) 186% EBITDA (266,932) (119,110) 224% (161,822) 165% (119,110) (266,932) 491 1,298 38% % Paid Rounds 15,802 20,993 75% 19,510 81% 20,993 15, % % Member Rounds 5,456 5,497 99% 5, % 5,497 5, % % Other Rounds 2,085 2,873 73% 2,466 85% 2,873 2,085 1,612 1,994 81% 1, % Total Rounds 23,343 29,363 79% 27,180 86% 29,363 23, % % Revenue/Paid Rounds % % % 49 76% Revenue/Total Rounds % % % % Green Fees / Cart Fees per Paid Rounds % % % 16 81% Green Fees / Cart Fees per Total Rounds % 18 97% % 22 65% F&B Revenue/Total Rounds % % % 3 104% Merchandise Revenue/Total Rounds % 4 98% 4 46
111 Stonebridge Golf Club of New Orleans Unaudited Summary Income Statements Plan Revenue: Green Fees & Cart Fees $ 589,885 $ 554,386 $ 497,610 $ 485,497 $ 402,839 $ 624,750 Range $ 41,338 $ 43,811 $ 39,811 $ 36,464 $ 30,450 $ 46,100 Membership Dues $ 129,276 $ 148,003 $ 133,547 $ 124,286 $ 121,674 $ 122,000 Membership Initiation Fees $ 8,602 $ 1,650 $ - $ - $ - $ - Golf Revenue $ 769,101 $ 747,850 $ 670,968 $ 646,247 $ 554,963 $ 792,850 Merchandise $ 154,637 $ 111,692 $ 106,188 $ 108,357 $ 91,661 $ 92,000 Other Pro Shop $ 13,245 $ 19,742 $ 17,093 $ 24,519 $ 22,987 $ 22,520 Food and Beverage $ 292,376 $ 300,620 $ 270,961 $ 298,858 $ 268,577 $ 315,719 F&B and Merchandise Revenue $ 460,258 $ 432,054 $ 394,242 $ 431,734 $ 383,225 $ 430,239 Total Revenue $ 1,229,360 $ 1,179,904 $ 1,065,210 $ 1,077,981 $ 938,188 $ 1,223,089 COGS and Operating Expenses $ 1,537,171 $ 1,484,892 $ 1,386,740 $ 1,380,579 $ 1,416,479 $ 1,449,295 Operating Loss, before depreciation $ ( 307,811 ) $ ( 304,988 ) $ ( 321,530 ) $ ( 302,598 ) $ ( 478,291 ) $ ( 226,206 ) Depreciation Expense $36,810 $30,369 $120,088 $183,058 $121,977 $82,000 Bunker Repairs $0 $0 $110,000 $0 $0 $0 Unreimbursed Trapp Canal Expenses $49,224 $46,110 $74,715 $22,000 $12,000 Other (Income)/Expense $ 78 $ - $ ( 49,148 ) $ ( 92,409 ) $ - $ - Net Loss, before interest expense $ ( 344,700 ) $ ( 384,582 ) $ ( 548,580 ) $ ( 467,962 ) $ ( 622,268 ) $ ( 320,206 ) Paid Rounds 22,345 20,032 19,343 19,510 15,802 Member Rounds 4,701 5,162 5,839 5,204 5,456 Other Rounds 1,951 1,732 3,408 2,466 2,085 Total Rounds 28,997 26,926 28,590 27,180 23,343 35,733 Golf revenue per paid rounds $ $ $ $ $ Golf revenue per total rounds $ $ $ $ $ $ F&B and merchandise revenue per paid rounds $ $ $ $ $ F&B and merchandise revenue per total rounds $ $ $ $ $ $ Total revenue per paid rounds $ $ $ $ $ Total revenue per total rounds $ $ $ $ $ $ Notes: - The impact of the canal improvment project has been significant. Costs isolated above are only direct costs for cart path and irrigation repair plus legal and manager time. The impact on revenue is not reflected here but is considered significant. We have lost several golf events due to this project The project is expected to be completed in early Maintaining 27-holes of golf creates excessive maintenance costs for this property. Costs are exected to decrease no later than May 2019 when the restricted use covenants expire.
 Golf Group brings a wide and comprehensive set of skills and experience to golf valuation assignments.")
112 MAIN COLLIERS HEADLINE INTERNATIONAL HERE WHITE GOLF PAPER CLUB AND SEASON RESORT AND DISCIPLINE YEAR HERE GOLF CLUB AND RESORT DISCIPLINE COLLIERS INTERNATIONAL, HOSPITALITY AND LEISURE GROUP The Colliers Valuation & Advisory Services (CIVAS) Golf Group brings a wide and comprehensive set of skills and experience to golf valuation assignments. With a reported economic impact of $70 billion and over 24 million participants in the U.S., the golf industry remains one of the biggest games in our town that is real estate. Golf industry fundamentals remain very challenging with plenty of headwinds still blowing. However, the sector remains dynamic with value-add and stable signature assets in the market. Due to these countering and separately strong forces, analyzing golf assets involves careful consideration of each recurring revenue and cost component in order to ensure inherent value is not overlooked and the going-concern of the operation is given proper and due respect. CIVAS is apt and able to handle the spectrum of golf course assignments, from owner-operated daily-fee courses to championship private club and internationally known facilities. CIVAS has a team of seasoned professionals that is able to leverage high-powered modeling software and a comprehensive database to serve clients and market participants. Knowledge and professional presentation are critical to our mission; however, meeting and exceeding client expectations is our foremost goal. Please do not hesitate to contact us for industry expertise or insight on markets at any time. P. 1


113 COLLIERS INTERNATIONAL GOLF CLUB AND RESORT DISCIPLINE MAIN HEADLINE HERE WHITE PAPER SEASON AND YEAR HERE Updated November 2017 For more information, please contact: Ryan Sikorski MAI, CFA Ryan Williams MAI Jason Lindsey MAI Colliers International 833 E. Michigan Street Suite 500 Milwaukee, WI United States Colliers International 255 South Orange Avenue Suite 1300 Orlando, FL United States Colliers International 139 S. Hennessey Street New Orleans, LA United States Valuation Services Director Hospitality & Leisure Group Valuation & Advisory Services Direct Mobile Valuation Services Director Hospitality & Leisure Group Valuation & Advisory Services Direct Mobile Valuation Services Director Hospitality & Leisure Group Valuation & Advisory Services Direct P. 2
114 Valuation Glossary Valuation & Advisory Services CONTACT DETAILS DIR FAX Colliers International 601 Union Street Suite 4800 Seattle, WA These definitions were extracted from the following sources or publications: The Dictionary of Real Estate Appraisal, Sixth Edition, Appraisal Institute, Chicago, Illinois, 2015 (Dictionary). Uniform Standards of Professional Appraisal Practice, Edition (USPAP). The Appraisal of Real Estate, Fourteenth Edition, Appraisal Institute, Chicago, Illinois, 2013 (14 th Edition). Marshall Valuation Service, Marshall & Swift, Los Angeles, California (MVS). Absolute Net Lease A lease in which the tenant pays all expenses including structural maintenance, building reserves, and management; often a long-term lease to a credit tenant. (Dictionary) Ad Valorem Tax A real estate tax based on the assessed value of the property, which is not necessarily equivalent to its market value. (14 th Edition) Aggregate of Retail Values (ARV) The sum of the separate and distinct market value opinions for each of the units in a condominium; subdivision development, or portfolio of properties, as of the date of valuation. The aggregate of retail values does not represent the value of all the units as sold together in a single transaction; it is simply the total of the individual market value conclusions. Also called sum of the retail values. (Dictionary) Arm s-length Transaction A transaction between unrelated parties who are each acting in his or her own best interest. (Dictionary) As-Is Market Value The estimate of the market value of real property in its current physical condition, use, and zoning as of the appraisal date. (Dictionary) Assessed Value The value of a property according to the tax rolls in ad valorem taxation; may be higher or lower than market value, or based on an assessment ratio that is a percentage of market value. (14 th Edition) Average Daily Room Rate (ADR) In the lodging industry, the net rooms revenue derived from the sale of guest rooms divided by the number of paid occupied rooms. (Dictionary) Band of Investment A technique in which the capitalization rates attributable to components of an investment are weighted and combined to derive a weighted-average rate attributable to the total investment. (Dictionary) Cash-Equivalent Price The price of a property with nonmarket financing expressed as the price that would have been paid in an all-cash sale. (Dictionary) Common Area The total area within a property that is not designed for sale or rental but is available for common use by all owners, tenants, or their invitees, e.g., parking and its appurtenances, malls, sidewalks, landscaped areas, recreation areas, public toilets, truck and service facilities. (Dictionary)
115 Valuation Glossary Valuation & Advisory Services CONTACT DETAILS DIR FAX Colliers International 601 Union Street Suite 4800 Seattle, WA Contract Rent The actual rental income specified in a lease. (14th Edition) Cost Approach A set of procedures through which a value indication is derived for the fee simple interest in a property by estimating the current cost to construct a reproduction of (or replacement for) the existing structure, including an entrepreneurial incentive; deducting depreciation from the total cost; and adding the estimated land value. Adjustments may then be made to the indicated fee simple value of the subject property to reflect the value of the property interest being appraised. (14th Edition) Curable Functional Obsolescence An element of depreciation; a curable defect caused by a flaw in the structure, materials, or design, which can be practically and economically corrected. (Dictionary) Debt Coverage Ratio (DCR) The ratio of net operating income to annual debt service, which measures the relative ability of a property to meet its debt service out of net operating income; also called debt service coverage ratio (DSCR). (Dictionary) Deferred Maintenance Items of wear and tear on a property that should be fixed now to protect the value or income-producing ability of a property. (Dictionary) Depreciation In appraisal, a loss in property value from any cause; the difference between the cost of an improvement on the effective date of the appraisal and the market value of the improvement on the same date. (Dictionary) Direct Costs Expenditures for the labor and materials used in the construction of improvements; also called hard costs. (Dictionary) Discounted Cash Flow (DCF) Analysis The procedure in which a discount rate is applied to a set of projected income streams and a reversion. The analyst specifies the quantity, variability, timing, and duration of the income streams and the quantity and timing of the reversion, and discounts each to its present value at a specified yield rate. (Dictionary) Discount Rate A rate of return on capital used to convert future payments or receipts into present value; usually considered to be a synonym for yield rate. (Dictionary) Disposition Value The most probable price that a specified interest in property should bring under the following conditions: 1. Consummation of a sale within a specified time, which is shorter than the typical exposure time for such a property in that market. 2. The property is subjected to market conditions prevailing as of the date of valuation. 3. Both the buyer and seller are acting prudently and knowledgeably. 4. The seller is under compulsion to sell. 5. The buyer is typically motivated. 6. Both parties are acting in what they consider their best interests. 7. An adequate marketing effort will be made during the exposure time.
116 Valuation Glossary Valuation & Advisory Services CONTACT DETAILS DIR FAX Colliers International 601 Union Street Suite 4800 Seattle, WA Payment will be made in cash in U.S. dollars (or the local currency) or in terms of financial arrangements comparable thereto. 9. The price represents the normal consideration for the property sold, unaffected by special or creative financing or sales concessions granted by anyone associated with the sale. This definition can also be modified to provide for valuation with specified financing terms. (Dictionary) Easement The right to use another s land for a stated purpose. Access or right-of-way easements may be acquired by private parties or public utilities. Governments may be the beneficiaries of easements placed on privately owned land that is dedicated to conservation, open space, or preservation. (14 th Edition) Economic Life The period over which improvements to real property contribute to property value. (Dictionary) Effective Age The age of property that is based on the amount of observed deterioration and obsolescence it has sustained, which may be different from its chronological age. (Dictionary) Effective Date The date on which the appraisal or review opinion applies (SVP) (Dictionary) Effective Gross Income (EGI) The anticipated income from all operations of the real estate after an allowance is made for vacancy and collection losses and an addition is made for any other income. (Dictionary) Effective Gross Income Multiplier (EGIM) The ratio between the sale price (or value) of a property and its effective gross income. (Dictionary) Effective Rent The rental rate net of financial concessions such as periods of free rent during the lease term and above or below-market tenant improvements (TIs). (14 th Edition) Eminent Domain The right of government to take private property for public use upon the payment of just compensation. The Fifth Amendment of the U.S. Constitution, also known as the takings clause, guarantees payment of just compensation upon appropriation of private property. (Dictionary) Entrepreneurial Incentive The amount an entrepreneur expects to receive for his or her contribution to a project. Entrepreneurial incentive may be distinguished from entrepreneurial profit (often called developer s profit) in that it is the expectation of future profit as opposed to the profit actually earned on a development or improvement. (Dictionary)
117 Valuation Glossary Valuation & Advisory Services CONTACT DETAILS DIR FAX Colliers International 601 Union Street Suite 4800 Seattle, WA Entrepreneurial Profit A market-derived figure that represents the amount an entrepreneur receives for his or her contribution to a project and risk; the difference between the total cost of a property (cost of development) and its market value (property value after completion), which represents the entrepreneur's compensation for the risk and expertise associated with development. An entrepreneur is motivated by the prospect of future value enhancement (i.e., the entrepreneurial incentive). An entrepreneur who successfully creates value through new development, expansion, renovation, or an innovative change of use is rewarded by entrepreneurial profit. Entrepreneurs may also fail and suffer losses. (Dictionary) Excess Land Land that is not needed to serve or support the existing improvement. The highest and best use of the excess land may or may not be the same as the highest and best use of the improved parcel. Excess land has the potential to be sold separately and is valued separately. (Dictionary) Excess Rent The amount by which contract rent exceeds market rent at the time of the appraisal; created by a lease favorable to the landlord (lessor) and may reflect unusual management, unknowledgeable or unusually motivated parties, a lease execution in an earlier, stronger rental market, or an agreement of the parties. Due to the higher risk inherent in the receipt of excess rent, it may be calculated separately and capitalized or discounted at a higher rate in the income capitalization approach. (14 th Edition) Expense Stop A clause in a lease that limits the landlord's expense obligation, which results in the lessee paying any operating expenses above a stated level or amount. (Dictionary) Exposure Time The estimated length of time that the property interest being appraised would have been offered on the market prior to the hypothetical consummation of a sale at market value on the effective date of the appraisal; Comment: Exposure time is a retrospective opinion based on an analysis of past events assuming a competitive and open market. (Dictionary) External Obsolescence A type of depreciation; a diminution in value caused by negative external influences and generally incurable on the part of the owner, landlord, or tenant. The external influence may be temporary or permanent. (Dictionary) Extraordinary Assumption An assumption, directly related to a specific assignment, as of the effective date of the assignment results, which, if found to be false, could alter the appraiser's opinions or conclusions. Extraordinary assumptions presume as fact otherwise uncertain information about physical, legal, or economic characteristics of the subject property; or about conditions external to the property such as market conditions or trends; or about the integrity of data used in an analysis. An extraordinary assumption may be used in an assignment only if: It is required to properly develop credible opinions and conclusions; The appraiser has a reasonable basis for the extraordinary assumption; Use of the extraordinary assumption results in a credible analysis; and The appraiser complies with the disclosure requirements set forth in USPAP for extraordinary assumptions. (USPAP)
118 Valuation Glossary Valuation & Advisory Services CONTACT DETAILS DIR FAX Colliers International 601 Union Street Suite 4800 Seattle, WA Fair Market Value In nontechnical usage, a term that is equivalent to the contemporary usage of market value. As used in condemnation, litigation, income tax, and property tax situations, a term that is similar in concept to market value but may be defined explicitly by the relevant agency. (Dictionary) Feasibility Analysis A study of the cost-benefit relationship of an economic endeavor. (USPAP) Fee Simple Estate Absolute ownership unencumbered by any other interest or estate, subject only to the limitations imposed by the governmental powers of taxation, eminent domain, police power and escheat. (Dictionary) Floor Area Ratio (FAR) The relationship between the above-ground floor area of a building, as described by the zoning or building code, and the area of the plot on which it stands; in planning and zoning, often expressed as a decimal, e.g., a ratio of 2.0 indicates that the permissible floor area of a building is twice the total land area. (Dictionary) Functional Obsolescence The impairment of functional capacity of improvements according to market tastes and standards. (Dictionary) Functional Utility The ability of a property or building to be useful and to perform the function for which it is intended according to current market tastes and standards; the efficiency of a building s use in terms of architectural style, design and layout, traffic patterns, and the size and type of rooms. (Dictionary) Furniture, Fixtures, and Equipment (FF&E) Business trade fixtures and personal property, exclusive of inventory. (Dictionary) Going-concern An established and operating business having an indefinite future life. (Dictionary) Going-concern Value An outdated label for the market value of all the tangible and intangible assets of an established and operating business with an indefinite life, as if sold in aggregate; more accurately termed the market value of the going concern or market value of the total assets of the business. (Dictionary) Gross Building Area (GBA) Total floor area of a building, excluding unenclosed areas, measured from the exterior of the walls of the above-grade area. This includes mezzanines and basements if and when typically included in the market area of the type of property involved. (Dictionary) Gross Leasable Area (GLA) - Commercial Total floor area designed for the occupancy and exclusive use of tenants, including basements and mezzanines; measured from the center of joint partitioning to the outside wall surfaces. (Dictionary)
119 Valuation Glossary Valuation & Advisory Services CONTACT DETAILS DIR FAX Colliers International 601 Union Street Suite 4800 Seattle, WA Gross Living Area (GLA) - Residential Total area of finished, above-grade residential area; calculated by measuring the outside perimeter of the structure and includes only finished, habitable, above-grade living space. (Finished basements and attic areas are not generally included in total gross living area. Local practices, however, may differ.) (Dictionary) Highest & Best Use The reasonably probable use of property that results in the highest value. The four criteria that the highest and best use must meet are legal permissibility, physical possibility, financial feasibility, and maximum productivity. The use of an asset that maximizes its potential and that is possible, legally permissible, and financially feasible. The highest and best use may be for continuation of an asset s existing use or for some alternative use. This is determined by the use that a market participant would have in mind for that asset when formulating the price that it would be willing to bid (IVS). (Dictionary) Hypothetical Condition A condition, directly related to a specific assignment, which is contrary to what is known by the appraiser to exist on the effective date of the assignment results, but is used for the purpose of analysis. Hypothetical conditions are contrary to known facts about physical, legal, or economic characteristics of the subject property; or about conditions external to the property, such as market conditions or trends; or about the integrity of data used in an analysis. (USPAP) Income Capitalization Approach In the income capitalization approach, an appraiser analyzes a property s capacity to generate future benefits and capitalizes the income into an indication of present value. The principle of anticipation is fundamental to this approach. Techniques and procedures from this approach are used to analyze comparable sales data and to measure obsolescence in the cost approach. (14th Edition) Incurable Functional Obsolescence An element of depreciation; a defect caused by a deficiency or superadequacy in the structure, materials, or design that cannot be practically or economically corrected as of the effective date of the appraisal. (Dictionary) Indirect Costs Expenditures or allowances for items other than labor and materials that are necessary for construction, but are not typically part of the construction contract. Indirect costs may include administrative costs, professional fees, financing costs and the interest paid on construction loans, taxes and the builder's or developer's all-risk insurance during construction, and marketing, sales, and lease-up costs incurred to achieve occupancy or sale. Also called soft costs. (Dictionary) Insurable Replacement Cost The cost estimate, at current prices as of the effective date of valuation, of a substitute for the building being valued, using modern materials and current standards, design and layout for insurance coverage purposes guaranteeing that damaged property is replaced with a new property (i.e., depreciation is not deducted). (Dictionary)
120 Valuation Glossary Valuation & Advisory Services CONTACT DETAILS DIR FAX Colliers International 601 Union Street Suite 4800 Seattle, WA Interim Use The temporary use to which a site or improved property is put until a different use becomes maximally productive. (Dictionary) Investment Value The value of a property to a particular investor or class of investors based on the investor s specific requirements. Investment value may be different from market value because it depends on a set of investment criteria that are not necessarily typical of the market. (Dictionary) Liquidation Value The most probable price that a specified interest in real property should bring under the following conditions: 1. Consummation of a sale within a short time period. 2. The property is subjected to market conditions prevailing as of the date of valuation. 3. Both the buyer and seller are acting prudently and knowledgeably. 4. The seller is under extreme compulsion to sell. 5. The buyer is typically motivated. 6. Both parties are acting in what they consider to be their best interests. 7. A normal marketing effort is not possible due to the brief exposure time. 8. Payment will be made in cash in U.S. dollars (or the local currency) or in terms of financial arrangements comparable thereto. 9. The price represents the normal consideration for the property sold, unaffected by special or creative financing or sales concessions granted by anyone associated with the sale. This definition can also be modified to provide for valuation with specified financing terms. (Dictionary) Leased Fee Interest The ownership interest held by the lessor, which includes the right to receive the contract rent specified in the lease plus the reversion right when the lease expires. (Dictionary) Leasehold Interest The right held by the lessee to use and occupy real estate for a stated term and under the conditions specified in the lease. (Dictionary) Legally Nonconforming Use A use that was lawfully established and maintained, but no longer conforms to the use regulations of its current zoning; also known as a grandfathered use. (Dictionary) Market Area The geographic region from which a majority of demand comes and in which the majority of competition is located. Depending on the market, a market area may be further subdivided into components such as primary, secondary, and tertiary market areas. (Dictionary) Market Rent The most probable rent that a property should bring in a competitive and open market reflecting all conditions and restrictions of the lease agreement, including permitted uses, use restrictions, expense obligations, term, concessions, renewal and purchase options, and tenant improvements (TIs). (14th Edition)
121 Valuation Glossary Valuation & Advisory Services CONTACT DETAILS DIR FAX Colliers International 601 Union Street Suite 4800 Seattle, WA Market Study An analysis of the market conditions of supply, demand, and pricing for a specific property type in a specific area. (Dictionary) Market Value (Interagency Guidelines) The most probable price which a property should bring in a competitive and open market under all conditions requisite to a fair sale, the buyer and seller each acting prudently and knowledgeably, and assuming the price is not affected by undue stimulus. Implicit in this definition is the consummation of a sale as of a specified date and the passing of title from seller to buyer under conditions whereby: 1. buyer and seller are typically motivated; 2. both parties are well informed or well advised, and acting in what they consider their own best interests; 3. a reasonable time is allowed for exposure in the open market; 4. payment is made in terms of cash in U.S. dollars or in terms of financial arrangements comparable thereto; and 5. the price represents the normal consideration for the property sold unaffected by special or creative financing or sales concessions granted by anyone associated with the sale. (Interagency Appraisal and Evaluation Guidelines, December 10, 2010, Federal Register, Volume 75 Number 237, Page 77472) Marketability Analysis The study of how a specific property is expected to perform in a specific market. A marketability analysis expands on a market analysis by addressing a specific property.(dictionary) Neighborhood Analysis The objective analysis of observable or quantifiable data indicating discernible patterns of urban growth, structure, and change that may detract from or enhance property values; focuses on four sets of considerations that influence value: social, economic, governmental, and environmental factors. (Dictionary) Net Operating Income (NOI) The actual or anticipated net income that remains after all operating expenses are deducted from effective gross income but before mortgage debt service and book depreciation are deducted. Note: This definition mirrors the convention used in corporate finance and business valuation for EBITDA (earnings before interest, taxes, depreciation, and amortization). (14th Edition) Obsolescence One cause of depreciation; an impairment of desirability and usefulness caused by new inventions, changes in design, improved processes for production, or external factors that make a property less desirable and valuable for a continued use; may be either functional or external. (Dictionary)
122 Valuation Glossary Valuation & Advisory Services CONTACT DETAILS DIR FAX Colliers International 601 Union Street Suite 4800 Seattle, WA Off-site Costs Costs incurred in the development of a project, excluding on-site costs such as grading and construction of the building and other improvements; also called common costs or offsite improvement costs. (Dictionary) On-site Costs Costs incurred for the actual construction of buildings and improvements on a particular site. (Dictionary) Overage Rent The percentage rent paid over and above the guaranteed minimum rent or base rent; calculated as a percentage of sales in excess of a specified breakeven sales volume. (14 th Edition) Overall Capitalization Rate (OAR) The relationship between a single year s net operating income expectancy and the total property price or value. (Dictionary) Parking Ratio The ratio of parking area or parking spaces to an economic or physical unit of comparison. Minimum required parking ratios for various land uses are often stated in zoning ordinances.(dictionary) Potential Gross Income (PGI) The total income attributable to property at full occupancy before vacancy and operating expenses are deducted. (Dictionary) Potential Gross Income Multiplier (PGIM) The ratio between the sale price (or value) of a property and its annual potential gross income. (Dictionary) Present Value (PV) The value of a future payment or series of future payments discounted to the current date or to time period zero. (Dictionary) Prospective Opinion of Value A value opinion effective as of a specified future date. The term does not define a type of value. Instead, it identifies a value opinion as effective at some specific future date. An opinion of value as of a prospective date is frequently sought in connection with projects that are proposed, under construction, or under conversion to a new use, or those that have not achieved sellout or a stabilized level of long-term occupancy. (Dictionary) Qualitative Adjustment An indication that one property is superior, inferior, or the same as another property. Note that the common usage of the term is a misnomer in that an adjustment to the sale price of a comparable property is not made. Rather, the indication of a property s superiority or inferiority to another is used in relative comparison analysis, bracketing, and other forms of qualitative analysis. (Dictionary) Quantitative Adjustment A numerical (dollar or percentage) adjustment to the indicated value of the comparable property to account for the effect of a difference between two properties on value. (Dictionary) Rentable Area The amount of space on which the rent is based; calculated according to local practice. (Dictionary)
123 Valuation Glossary Valuation & Advisory Services CONTACT DETAILS DIR FAX Colliers International 601 Union Street Suite 4800 Seattle, WA Replacement Cost The estimated cost to construct, at current prices as of a specific date, a substitute for a building or other improvements, using modern materials and current standards, design, and layout. (Dictionary) Reproduction Cost The estimated cost to construct, at current prices as of the effective date of the appraisal, an exact duplicate or replica of the building being appraised, using the same materials, construction standards, design, layout, and quality of workmanship and embodying all the deficiencies, superadequacies, and obsolescence of the subject building. (Dictionary) Retrospective Value Opinion A value opinion effective as of a specified historical date. The term retrospective does not define a type of value. Instead, it identifies a value opinion as being effective at some specific prior date. Value as of a historical date is frequently sought in connection with property tax appeals, damage models, lease renegotiation, deficiency judgments, estate tax, and condemnation. Inclusion of the type of value with this term is appropriate, e.g., retrospective market value opinion. (Dictionary) Sales Comparison Approach The process of deriving a value indication for the subject property by comparing sales of similar properties to the property being appraised, identifying appropriate units of comparison, and making adjustments to the sale prices (or unit prices, as appropriate) of the comparable properties based on relevant, market-derived elements of comparison. The sales comparison approach may be used to value improved properties, vacant land, or land being considered vacant when an adequate supply of comparable sales is available. (Dictionary) Scope of Work The type and extent of research and analysis in an appraisal or appraisal review assignment. Scope of work includes, but is not limited to: The extent to which the property is identified; The extent to which tangible property is inspected; The type and extent of data researched; and The type and extent of analysis applied to arrive at opinions or conclusions. (USPAP) Shopping Center Types Neighborhood Shopping Center: The smallest type of shopping center, generally with a gross leasable area of between 30,000 and 100,000 square feet. Typical anchors include supermarkets. Neighborhood shopping centers offer convenience goods and personal services and usually depend on a market population support of 3,000 to 40,000 people. Community Shopping Center: A shopping center of 100,000 to 400,000 square feet that usually contains one junior department store, a variety store, discount or department store. A community shopping center generally has between 20 and 70 retail tenants and a market population support of 40,000 to 150,000 people. Regional Shopping Center: A shopping center of 300,000 to 900,000 square feet that is built around one or two full-line department stores of approximately 200,000 square feet each plus small tenant spaces. This type of center is typically supported by a minimum population of 150,000 people.
124 Valuation Glossary Valuation & Advisory Services CONTACT DETAILS DIR FAX Colliers International 601 Union Street Suite 4800 Seattle, WA Shopping Center Types (cont.) Super-Regional Center: A large center of 600,000 to 2.0 million square feet anchored by three or more full-line department stores. This type of center is typically supported by a population area of 300,000 people. (14 th Edition) Superadequacy An excess in the capacity or quality of a structure or structural component; determined by market standards. (Dictionary) Surplus Land Land that is not currently needed to support the existing use but cannot be separated from the property and sold off for another use. Surplus land does not have an independent highest and best use and may or may not contribute value to the improved parcel. (Dictionary) Tenant Improvements (TIs) 1. Fixed improvements to the land or structures installed for use by a lessee. 2. The original installation of finished tenant space in a construction project; subject to periodic change for succeeding tenants. (Dictionary) Triple Net Lease An alternative term for a type of net lease. In some markets, a net net net lease is defined as a lease in which the tenant assumes all expenses (fixed and variable) of operating a property except that the landlord is responsible for structural maintenance, building reserves, and management. Also called NNN, triple net lease, or fully net lease. (Dictionary) Usable Area The area that is actually used by the tenants measured from the inside of the exterior walls to the inside of walls separating the space from hallways and common areas. (Dictionary) Useful Life The period of time over which a structure or a component of a property may reasonably be expected to perform the function for which it was designed. (Dictionary) Vacancy and Collection Loss A deduction from potential gross income (PGI) made to reflect income deductions due to vacancies, tenant turnover, and non-payment of rent; also called vacancy and credit loss or vacancy and contingency loss. (Dictionary) Yield Capitalization A method used to convert future benefits into present value by 1) discounting each future benefit at an appropriate yield rate, or 2) developing an overall rate that explicitly reflects the investment's income pattern, holding period, value change, and yield rate. (Dictionary)

125 Jason Lindsey, MAI VALUATION SERVICES DIRECTOR Valuation & Advisory Services EDUCATION AND QUALIFICATIONS Bachelor of Business Administration Finance/Economics Texas Tech University Lubbock, TX STATE CERTIFICATION Louisiana Texas Virginia CONTACT DETAILS MOB FAX Colliers International 139 S. Hennessey Street New Orleans, LA Jason Lindsey, MAI has been active in the appraisal and consulting industry since 2000 and has expertise in complex financial analysis of commercial investment properties. He has extensive experience in the valuation of existing and proposed hotels, country clubs, and golf clubs in major markets throughout the U.S., including New Orleans, Dallas, Atlanta, Charlotte, and Washington, D.C. Mr. Lindsey also has appraisal experience in retail, office, multi-family, mixed-use, historic, and various other commercial and residential properties. Purposes of these assignments are wide ranging, from transaction and loan-related work to tax appeals and feasibility studies. EXPERIENCE Senior Appraiser, The McEnery Company, New Orleans, Louisiana Senior Appraiser, Hotel and Club Associates, Greensboro, North Carolina APPRAISAL INSTITUTE COURSES Advanced Concepts & Case Studies Advanced Income Capitalization Business Practices and Ethics General Appraiser Site Valuation & Cost Approach General Appraiser Report Writing and Case Studies General Appraiser Sales Comparison Approach General Market Analysis and Highest & Best Use Real Estate Finance Statistics and Valuation Modeling OTHER RELATED COURSES Hotel Sector Update & Forecast-2016 Real Estate Valuation Conference: Local, National, & Global Issues-2015 MEMBERSHIPS, LICENSES AND PROFESSIONAL AFFILIATIONS MAI Designation Appraisal Institute

126

127 Thomas M. Bogdon, MAI EXECUTIVE MANAGING DIRECTOR Valuation & Advisory Services EDUCATION AND QUALIFICATIONS BBA Management, Texas Tech University Lubbock, TX STATE CERTIFICATION Arkansas Kansas Louisiana Oklahoma Missouri Tennessee Texas CONTACT DETAILS MOB DIR FAX Colliers International 1717 McKinney Avenue Suite 900 Dallas, TX EXPERIENCE Mr. Bogdon has been engaged in real estate valuation and consultation since These valuations and consulting assignments have pertained to a wide variety of purposes; i.e., sale, loan, arbitration, litigation, tax, dissolution, leased fee and leasehold interest, easements, and current value portfolio appraisals and reviews. Valuations have been performed on various property types including, but not limited to; industrial sites, buildings and parks; commercial land and buildings, shopping centers, regional malls, restaurants, low- and high-rise office buildings; hotels, motels, multifamily uses, residential subdivisions; commercial and industrial acreage, self-storage, marinas, schools, churches and special purpose properties. Valuation clients served include developers and investors, fund advisors, attorneys, lenders, public agencies, institutional advisors. Mr. Bogdon has also provided expert witness testimony before Superior Courts of Dallas County as well as Federal Bankruptcy Court. APPRAISAL INSTITUTE COURSES Basic Valuation Procedures Appraisal Principles Capitalization Theory & Tech, Part A Capitalization Theory & Tech, Part B Case Studies in Real Estate Valuation Valuation Analysis & Report Writing Standards of Professional Practice OTHER RELATED AFFILIATIONS Texas Real Estate Broker License No PROFESSIONAL MEMBERSHIPS AND ACCREDITATIONS Appraisal Institute Member No. 8312

128 Certified General Appraiser License A CERTIFIED GENERAL APPRAISER license for the period covered through is granted to : Chairman License Number: G Secretary Certified General Appraiser License Having complied with the license requirements as set forth in in R.S.1950 Title 37, Chapter 51, and Amendatory Acts, and the Real Estate Appraisers Board Rules and Regulations, a Certified General Appraiser License is hereby granted to In Testimony Whereof, This license has been issued by the Authority of the Louisiana Real Estate Appraisers Board. Period Covered: Through Chairman License Number: G Secretary


129 Colliers International Valuation & Advisory Services Services Offered Single Asset Valuation Portfolio Valuation Institutional Asset Valuation Loan Pool Valuation Appraisal Review Appraisal Management Lease and Cost Analysis Insurance Valuation Arbitration & Consulting Feasibility Studies Investment Analysis Highest and Best Use Studies Tax Appeals Litigation Support Segregated-Cost Analysis Experience That Counts Office Industrial Retail Multifamily Mixed-Use Properties Senior Housing Land Self-Storage Manufactured Housing Net Lease Hospitality Health Care Subdivisions Embassies & Consulates GSA Properties Special Use Properties Telecommunications Real estate valuations play a pivotal role in today s business climate. An accurate and well supported opinion of property value can mean the difference between reaching a critical goal securing a loan, closing a sale, reporting to investors, choosing the best asset or failing to achieve it altogether. Colliers Valuation & Advisory Services reports are designed to deliver insight into a property s fundamentals, its competition and the overall market dynamics affecting value. A solid valuation report can be a strategic asset for investors, lenders and owners, provided that it addresses both a property s unique characteristics and the most current market conditions. Commitment to high-end client service, coupled with Colliers International s unparalleled market intelligence and resources, differentiates us as the firm of choice in the real estate industry. PROFESSIONALS Our professionals share a commitment to deliver the highest level of service and consistent results. We go the extra mile for our clients, whether this means meeting a tight deadline or working with a complex and challenging property. TECHNOLOGY Our unmatched report creation technology speeds appraisals through the pipeline. This secure, centralized production system generates a wide range of reports and high volume portfolio orders without delays. INFORMATION Today s business climate places valuation in a more pivotal position than ever before. All our appraisals are evaluated and approved by an experienced review team to ensure our clients receive concise and timely appraisals. With clear, prompt reporting and a comprehensive, big picture approach, Colliers International s Valuation and Advisory reports give our clients the information they need to make better business decisions. VALUATION & ADVISORY SERVICES Colliers International
Appraisal and Market Analysis of Indoor Waterpark Resorts
 Appraisal and Market Analysis of Indoor Waterpark Resorts By David J. Sangree, MAI, CPA, ISHC An appraisal of an indoor waterpark resort is similar to other appraisals in that it is a professional appraiser
RESTRICTED APPRAISAL REPORT
 Restricted Use Appraisal Report Thomas J. Schulte & Associates Page #1 RESTRICTED APPRAISAL REPORT SUBJECT ASSIGNMENT Property City: Zip Code: County: Legal Description: Assessor's Parcel #: Tax Year:
How to Read a Real Estate Appraisal Report
 How to Read a Real Estate Appraisal Report Much of the private, corporate and public wealth of the world consists of real estate. The magnitude of this fundamental resource creates a need for informed
To all Appraisers: Brief Overview:
 To all Appraisers: As the appraisal industry continues to change, the demand for alternative valuation solutions grows. That is why is excited to announce the addition of a new product - the Desktop Appraisal
A Demonstration Appraisal Report. Of a. Located at. Date of Appraisal. Prepared for. Prepared by
 A Demonstration Appraisal Report Of a Located at Date of Appraisal Prepared for Prepared by International Association of Assessing Officers Professional Designation Subcommittee 314 West 10 th Street Kansas
Multi-Family Methodology Analysis
 Multi-Family Methodology 2018 Analysis Assessment Department February, 2018 2018 Multi-Family Assessment Methodology Property assessments in the City of Medicine Hat reflect the fee simple market value
A Demonstration Appraisal Report. Of a. Located at. Date of Appraisal. Prepared for. Prepared by
 A Demonstration Appraisal Report Of a Located at Date of Appraisal Prepared for Prepared by International Association of Assessing Officers Professional Designation Subcommittee 314 W. 10 th Street Kansas
Copyright, 1999, 2002, 2004, Freddie Mac. All Rights Reserved.
 Page 1 of 13 Engineering Requirements/Chapter 12: Appraiser and Appraisal Requirements/12.1: General requirements 12.1: General requirements For all multifamily purchase programs and products, the Seller/Servicer
As Of: Prepared For: Prepared By:
 of 216 SW 131st St As Of: 06/11/11 Prepared For: Prime Pacific Bank 2502 196th St SW Lynnwood WA 98036 Prepared By: Cynthia A. Nagle, CREA 922 N Cedar St Tacoma, WA 98406 RESTRICTED APPRAISAL REPORT Restriction
BUSI 330 Suggested Answers to Review and Discussion Questions: Lesson 1
 BUSI 330 Suggested Answers to Review and Discussion Questions: Lesson 1 1. The three characteristics necessary to gain professional recognition are: Integrity, Competence, and Provide Quality Work. Students
CONTENTS. Executive Summary 1. Southern Nevada Economic Situation 2 Household Sector 5 Tourism & Hospitality Industry
 CONTENTS Executive Summary 1 Southern Nevada Economic Situation 2 Household Sector 5 Tourism & Hospitality Industry Residential Trends 7 Existing Home Sales 11 Property Management Market 12 Foreclosure
Mike Dalton Jr. and Associates. Christina Adams INVOICE NUMBER Mike Dalton Jr. and Associates 8191 Wethersfield Drive. PB125 Germantown, TN 38138
 Mike Dalton Jr. and Associates FROM: INVOICE Christina Adams INVOICE NUMBER Mike Dalton Jr. and Associates 8191 Wethersfield Drive Germantown, TN 38138 DATE 08/14/2016 Telephone Number: (901) 674-0239
REED APPRAISAL COMPANY REAL PROPERTY APPRAISERS AND CONSULTANTS
 REAL PROPERTY APPRAISERS AND CONSULTANTS 100 SOUTH KENTUCKY AVENUE #230 ip.o. BOX 1645 ilakeland, FLORIDA 33802-1645 OFFICE: (863) 688-6718 ifax: (863) 688-5993iEMAIL: stan@reedappraisalco.com TO: Henry
MULTI-FAMILY REPORT 25TH SPECIAL EDITION. Spring Number 25
 Number 25 Spring 2015 MULTI-FAMILY REPORT 25TH SPECIAL EDITION Obtain reproduction permission by contacting Madderra & Cazalot, Larry G. Schedler & Associates, Inc., or The MultiFamily Advisory Group,
HOW LONG WILL THE HOUSING DEMAND SURGE CONTINUE? WADE R. RAGAS, PHD MAI SRA REAL PROPERTY ASSOCIATES, (504) ( ) WADERAGAS.
 ( ) WADERAGAS.") HOW LONG WILL THE HOUSING DEMAND SURGE CONTINUE? WADE R. RAGAS, PHD MAI SRA REAL PROPERTY ASSOCIATES, (504) (324-3994) WADERAGAS.COM LOUISIANA EMPLOYMENT BY METRO AREA DECEMBER 2015, JANUARY 2015 AND JANUARY
HOW LONG WILL THE HOUSING DEMAND SURGE CONTINUE? WADE R. RAGAS, PHD MAI SRA REAL PROPERTY ASSOCIATES, (504) (324-3994) WADERAGAS.COM LOUISIANA EMPLOYMENT BY METRO AREA DECEMBER 2015, JANUARY 2015 AND JANUARY
Anatomy Of An Appraisal
 Anatomy Of An Appraisal Leslie A. Fields The most important thing to know about an appraisal report is how to review and critique it. Leslie A. Fields a partner with the Law Firm of Faegre & Benson LLP,
Appraisal Review: Analyzing the 1004
 Appraisal Review: Analyzing the 1004 1 LIVE ONLINE PARTICIPANT GUIDE Version: 8.12 Table of Contents The Purpose of the Appraisal... 3 Define Market Value... 3 Scenario 1 (John Johnson report) - 1004 Uniform
Industrial and Commercial Real Estate Appraisal Procedures
 Property Valuation Thought Leadership Industrial and Commercial Real Estate Appraisal Procedures John C. Ramirez The application of the asset-based approach to business valuation often involves the appraisal
WALLER COUNTY APPRAISAL DISTRICT MASS APPRAISAL REPORT APPRAISAL YEAR 2018
 WALLER COUNTY APPRAISAL DISTRICT MASS APPRAISAL REPORT APPRAISAL YEAR 2018 ADDENDUM TO WCAD REAPPRAISAL PLAN FOR 2017 AND 2018 WALLER COUNTY APPRAISAL DISTRICT Uniform Standards of Professional Appraisal
BADGER Appraisals, LLC
 BADGER Appraisals, LLC PO Box 2222 Appleton, WI 54912 T (920) 687-9000 / F (920) 687-9244 info@badgerappraisals.com www.badgerappraisals.com Appraisal Service Brown * Calumet * Outagamie * Winnebago APPRAISAL
FIRST AMENDMENT TO LEASE
 Attachment 1 FIRST AMENDMENT TO LEASE THIS FIRST AMENDMENT TO LEASE, dated, 2013 ( First Amendment ), by and between the State of California, acting by and through its Department of General Services, (hereinafter
Guide Note 15 Assumptions and Hypothetical Conditions
 Guide Note 15 Assumptions and Hypothetical Conditions Introduction Appraisal and review opinions are often premised on certain stated conditions. These include assumptions (general, and special or extraordinary)
Guide Note 6 Consideration of Hazardous Substances in the Appraisal Process
 Guide Note 6 Consideration of Hazardous Substances in the Appraisal Process Introduction The consideration of environmental conditions along with social, economic, and governmental conditions is fundamental
Land, Agricultural Improvements, CAFO, Rural Residence, Farm
 *--FSA Appraisal Guidelines Land, Agricultural Improvements, CAFO, Rural Residence, Farm The following information elements and content descriptions are provided as guidelines to assist lenders and appraisers
Dear Valuation Professional
 Dear Valuation Professional First American Mortgage Solutions LLC has a new product offering that we would like you to consider adding to your list of services with us - (Property Assessment Collateral
Interagency Appraisal and
 Interagency Appraisal and Evaluation (IAEG) Workshop Purpose (77456) Supersedes the 1994 Interagency Appraisal & Evaluation Guidelines Address supervisory matters relating to real estate appraisal and
Post-Katrina housing affordability challenges continue in 2008, worsening among Orleans Parish very low income renters
 Post-Katrina housing affordability challenges continue in 2008, worsening among Orleans Parish very low income renters Based on 2004, 2007 and 2008 American Community Survey data from the U.S. Census Bureau
AG-AMERICA COMMERCIAL FARM AND RANCH COLLATERAL VALUATION GUIDE
 AG-AMERICA COMMERCIAL FARM AND RANCH COLLATERAL VALUATION GUIDE Table of Contents CHAPTER CV101 COLLATERAL VALUATION STANDARDS AND GUIDES... 1 CV101.1 Overview... 1 General Guidance on Terms:... 1 CHAPTER
Cycle Monitor Real Estate Market Cycles Third Quarter 2017 Analysis
 Cycle Monitor Real Estate Market Cycles Third Quarter 2017 Analysis Real Estate Physical Market Cycle Analysis of Five Property Types in 54 Metropolitan Statistical Areas (MSAs). Income-producing real
Ontario Rental Market Study:
 Ontario Rental Market Study: Renovation Investment and the Role of Vacancy Decontrol October 2017 Prepared for the Federation of Rental-housing Providers of Ontario by URBANATION Inc. Page 1 of 11 TABLE
BADGER Appraisals, LLC
 BADGER Appraisals, LLC PO Box 2222 Appleton, WI 54912 T (920) 687-9000 / F (920) 687-9244 info@badgerappraisals.com www.badgerappraisals.com Residential Appraisal Service Brown * Calumet * Outagamie *
Case 9:15-cv DMM Document Entered on FLSD Docket 11/22/2017 Page 1 of 12
 Case 9:15-cv-80946-DMM Document 181-5 Entered on FLSD Docket 11/22/2017 Page 1 of 12 APPRAISAL OF A 1.31 ACRE SITE LOCATED AT: XXX 77th Trl N (long legal description/see page #1) Palm Beach Gardens, FL
Source: Reg. Y, 55 FR 27771, July 5, 1990, unless otherwise noted.
 Subpart G Appraisal Standards for Federally Related Transactions Source: Reg. Y, 55 FR 27771, July 5, 1990, unless otherwise noted. 225.61 Authority, purpose, and scope. (a) Authority. This subpart is
S. The Grove Drive, Los Angeles, California 90036
 101-189 S. The Grove Drive, Los Angeles, California 90036 1-1 Copyright 2011 Hayward Appraisal Company, Inc. DATE OF VALUE: DECEMBER 31, 2010 Subject Photographs SUBJECT PHOTOGRAPHS Maggianos Wood Ranch
ECONOMIC CURRENTS. Vol. 5 Issue 2 SOUTH FLORIDA ECONOMIC QUARTERLY. Key Findings, 2 nd Quarter, 2015
 ECONOMIC CURRENTS THE Introduction SOUTH FLORIDA ECONOMIC QUARTERLY Economic Currents provides an overview of the South Florida regional economy. The report presents current employment, economic and real
Following is an example of an income and expense benchmark worksheet:
 After analyzing income and expense information and establishing typical rents and expenses, apply benchmarks and base standards to the reappraisal area. Following is an example of an income and expense
[Code of Federal Regulations] [Title 12, Volume 5] [Revised as of January 1, 2004] From the U.S. Government Printing Office via GPO Access
![[Code of Federal Regulations] [Title 12, Volume 5] [Revised as of January 1, 2004] From the U.S. Government Printing Office via GPO Access](/thumbs/80/82487200.jpg "[Code of Federal Regulations] [Title 12, Volume 5] [Revised as of January 1, 2004] From the U.S. Government Printing Office via GPO Access") [Code of Federal Regulations] [Title 12, Volume 5] [Revised as of January 1, 2004] From the U.S. Government Printing Office via GPO Access TITLE 12--BANKS AND BANKING CHAPTER V--OFFICE OF THRIFT SUPERVISION,
[Code of Federal Regulations] [Title 12, Volume 5] [Revised as of January 1, 2004] From the U.S. Government Printing Office via GPO Access TITLE 12--BANKS AND BANKING CHAPTER V--OFFICE OF THRIFT SUPERVISION,
ECONOMIC CURRENTS. Vol. 4, Issue 3. THE Introduction SOUTH FLORIDA ECONOMIC QUARTERLY
 ECONOMIC CURRENTS THE Introduction SOUTH FLORIDA ECONOMIC QUARTERLY Vol. 4, Issue 3 Economic Currents provides an overview of the South Florida regional economy. The report presents current employment,
ECONOMIC CURRENTS. Vol. 3, Issue 1. THE SOUTH FLORIDA ECONOMIC QUARTERLY Introduction
 ECONOMIC CURRENTS THE SOUTH FLORIDA ECONOMIC QUARTERLY Introduction Economic Currents provides an overview of the South Florida regional economy. The report contains current employment, economic and real
Demonstration Appraisal Report Utilizing a Form Report
 Demonstration Appraisal Report Utilizing a Form Report National Association of Independent Fee Appraisers 330 North Wabash Avenue, Suite 2000 Chicago, IL 60611 Phone: (312) 321-6830 Fax: (312) 673-6652
Uniform Residential Appraisal Report (URAR) Model Appraisal
 Model Appraisal") Basic Appraisal Procedures Residential Applications & Model Appraisals 15-13 Uniform Residential Appraisal Report (URAR) Model Appraisal On the following pages are examples of a completed Fannie Mae/Freddie
Basic Appraisal Procedures Residential Applications & Model Appraisals 15-13 Uniform Residential Appraisal Report (URAR) Model Appraisal On the following pages are examples of a completed Fannie Mae/Freddie
Guide Note 12 Analyzing Market Trends
 Guide Note 12 Analyzing Market Trends Introduction Since the value of a property is equal to the present value of all of the future benefits it brings to its owner, market value is dependent on the expectations
Cycle Monitor Real Estate Market Cycles Second Quarter 2018 Analysis
 Black Creek Research Cycle Monitor Real Estate Market Cycles Second Quarter 0 Analysis Real Estate Market Cycle analysis of five property types in Metropolitan Statistical Areas (MSAs). Important note:
EvaluePro Real Estate Restricted Appraisal Report
 EvaluePro Real Estate Restricted Appraisal Report EvaluePro Highlights Property Street: 1000 Main Street City: Anytown State: NC Zip: 12345 Property Owner: Mr. & Mrs. Property Owner Estimated Market Value:
Interagency. Appraisal and Evaluation. Guidelines
 Interagency Appraisal and Evaluation Guidelines (December 2, 2010) Interagency Appraisal and Evaluation Guidelines Table of Contents I. Purpose..............................................................
concepts and techniques
 concepts and techniques S a m p l e Timed Outline Topic Area DAY 1 Reference(s) Learning Objective The student will learn Teaching Method Time Segment (Minutes) Chapter 1: Introduction to Sales Comparison
RESIDENTIAL APPRAISAL SUMMARY REPORT
 SUBJECT ASSIGNMENT MARKET AREA DESCRIPTION Property City: Zip Code: County: Legal Description: Assessor's Parcel #: Tax Year: R.E. Taxes: $ Special Assessments: $ Borrower (if applicable): Current Owner
Profile of International Home Buyers in Florida
 Profile of International Home Buyers in Florida Research Division National Association of REALTORS 2009 Prepared for the Florida Association of REALTORS 2009 National Association of REALTORS Profile of
RAINS COUNTY APPRAISAL DISTRICT
 RAINS COUNTY APPRAISAL DISTRICT 2017 MASS APPRAISAL SUMMARY REPORT mass appraisal report 2017 uspap_appr_report RAINS COUNTY APPRAISAL DISTRICT 2017 MASS APPRAISAL SUMMARY REPORT Identification of Subject:
APPRAISING COMMERCIAL INVESTMENT PROPERTY
 APPRAISING COMMERCIAL INVESTMENT PROPERTY Cydney G. Bender-Reents, MAI President Jared M. Calabrese, MAI Senior Appraiser YOUR HOUSE AS SEEN BY: Yourself Your Lender YOUR HOUSE AS SEEN BY: Your Buyer Your
CONTENTS. Executive Summary. Southern Nevada Economic Situation 1 Household Sector 4 Tourism & Hospitality Industry
 CONTENTS Executive Summary Southern Nevada Economic Situation 1 Household Sector 4 Tourism & Hospitality Industry Residential Trends 6 Existing Home Sales 10 Property Management Market 11 Foreclosure Situation
SUBJECT: The Appraisal of Real Property That May Be Impacted by Environmental Contamination
 1 ADVISORY OPINION 9 (AO-9) 1 2 3 4 This communication by the Appraisal Standards Board (ASB) does not establish new standards or interpret existing standards. Advisory Opinions are issued to illustrate
Valbridge Valuation Advisory
 Valbridge Valuation Advisory Re: Attn: Multi-Family Property Taxes Lenders and Purchasers Cash is king, and property taxes can kill the cash flow of a multi-family property. What does that mean to you?
2018 ECONOMIC OUTLOOK & REAL ESTATE FORECAST KEY POINTS LACEY MERRICK CONWAY, CCIM
 218 ECONOMIC OUTLOOK & REAL ESTATE FORECAST Presented by: LACEY MERRICK CONWAY, CCIM President/Principal Broker, Latter & Blum, Inc. KEY POINTS WHAT S DRIVING THE MARKET? REAL ESTATE TRENDLINE CURRENT
Chapter 35. The Appraiser's Sales Comparison Approach INTRODUCTION
 Chapter 35 The Appraiser's Sales Comparison Approach INTRODUCTION The most commonly used appraisal technique is the sales comparison approach. The fundamental concept underlying this approach is that market
PROPERTY TAX IS A PRINCIPAL REVENUE SOURCE
 TAXABLE PROPERTY VALUES: EXPLORING THE FEASIBILITY OF DATA COLLECTION METHODS Brian Zamperini, Jennifer Charles, and Peter Schilling U.S. Census Bureau* INTRODUCTION PROPERTY TAX IS A PRINCIPAL REVENUE
The TAUREAN Residential Valuation System An Overview
 The TAUREAN Residential Valuation System An Overview By Michael L. Robbins, Ph.D., CRE Taurean Residential Valuation Services, LLC 150 N. Sunny Slope Road, Suite 225, Brookfield, WI 53005 Phone: (262)
REAL ESTATE MARKET AND YOUR TAX
 REAL ESTATE MARKET AND YOUR TAX ASSESSMENT All of us Island property owners received our tax assessment notices from the County recently. As real estate agents we have been fielding many questions about
Appraiser Qualifications Board
 Appraiser Qualifications Board Course Analysis Course Name Provider Date of Approval Course Expiration Date This detailed breakdown of the subject content of this course is provided by the AQB as part
METROPOLITAN COUNCIL S FORECASTS METHODOLOGY
 METROPOLITAN COUNCIL S FORECASTS METHODOLOGY FEBRUARY 28, 2014 Metropolitan Council s Forecasts Methodology Long-range forecasts at Metropolitan Council are updated at least once per decade. Population,
BUSI 398 Residential Property Guided Case Study
 BUSI 398 Residential Property Guided Case Study PURPOSE AND SCOPE The Residential Property Guided Case Study course BUSI 398 is intended to give the real estate appraisal student a working knowledge of
APPRAISAL OF REAL PROPERTY LOCATED AT: FOR: AS OF: BY:
 APPRAISAL OF REAL PROPERTY LOCATED AT: 489 MEADOWS EDGE COURT DEED BOOK 2896, PAGE 2759 CLEMMONS, NC 27012 FOR: ESTATE OF WILLIAM C. McINTOSH % BAILEY & THOMAS P.O. BOX 52 WINSTON-SALEM, NC 27102 AS OF:
METHODOLOGY GUIDE VALUING LANDS IN TRANSITION IN ONTARIO. Valuation Date: January 1, 2016
 METHODOLOGY GUIDE VALUING LANDS IN TRANSITION IN ONTARIO Valuation Date: January 1, 2016 August 2017 August 22, 2017 The Municipal Property Assessment Corporation (MPAC) is responsible for accurately assessing
Basic Appraisal Procedures
 Hondros Learning Basic Appraisal Procedures Timed Outline Topic Area Reference(s) Learning Objectives The student will be able to identify and/or apply: Teaching Method Time Segment (Minutes) Day 1 Chapter
Residential Evaluation Report (RER) April, 2016
 April, 2016") Residential Evaluation Report (RER) ensuring compliance with the Interagency Guidelines (IAG) and USPAP April, 2016 Definitions RER shall mean a Residential Evaluation Report and is deemed to be a restricted
Residential Evaluation Report (RER) ensuring compliance with the Interagency Guidelines (IAG) and USPAP April, 2016 Definitions RER shall mean a Residential Evaluation Report and is deemed to be a restricted
WATERFRONT LOCAL IMPROVEMENT DISTRICT OVERVIEW. November 2017
 WATERFRONT LOCAL IMPROVEMENT DISTRICT OVERVIEW November 2017 LOCAL IMPROVEMENT DISTRICT Funding tool by which property owners financially contribute to a project that will increase the value of their property
86 years in the making Caspar G Haas 1922 Sales Prices as a Basis for Estimating Farmland Value
 2 Our Journey Begins 86 years in the making Caspar G Haas 1922 Sales Prices as a Basis for Estimating Farmland Value Starting at the beginning. Mass Appraisal and Single Property Appraisal Appraisal
MODULE 7-A: APPRAISALS, BPOS AND USPAP
 MODULE 7-A: APPRAISALS, BPOS AND USPAP LEARNING OBJECTIVES One of the most challenging aspects of the real estate business is the development of prices or values of the rights to real estate. Buyers and
2016 MAP Guidelines: Presentation Title Chapter 7 Issues
 2016 MAP Guidelines: Presentation Title Chapter 7 Issues Your companyinformation National Council of Housing Market Analysts Baltimore, MD April 19, 2016 Agenda MAP Market Study Guidelines Robert Lefenfeld
BUSI 452 Case Studies in Appraisal II
 BUSI 452 Case Studies in Appraisal II PURPOSE AND SCOPE The Case Studies in Appraisal II course (BUSI 452) is a continuation of BUSI 442. This course is intended to introduce further practical applications
Mass Appraisal of Income-Producing Properties
 Chapter 10 Mass Appraisal of Income-Producing Properties Whether valuing income-producing property or residential property, you can use similar information and methods for collecting and analyzing data
Individual Cooperative Interest Appraisal Report
 PURPOSE Individual Cooperative Interest Appraisal Report The purpose of this appraisal report is to provide the client with a credible opinion of the defined value of the subject property, given the intended
APPRAISAL OF 1117 MONROE STREET, VICKSBURG, MS 39180
 APPRAISAL OF 1117 MONROE STREET, VICKSBURG, MS 39180 CLIENT/INTENDED USER: GLENN TRIPLETT INTENDED USE/USER: TO ASSIST THE CLIENT IN MAKING A PURCHASING DECISION. THIS REPORT IS NOT INTENDED FOR ANY OTHER
Appraisers and Assessors of Real Estate
 http://www.bls.gov/oco/ocos300.htm Appraisers and Assessors of Real Estate * Nature of the Work * Training, Other Qualifications, and Advancement * Employment * Job Outlook * Projections Data * Earnings
MULTIPLE CHALLENGES REAL ESTATE APPRAISAL INDUSTRY FACES QUALITY CONTROL. Issues. Solution. By, James Molloy MAI, FRICS, CRE
 REAL ESTATE APPRAISAL INDUSTRY FACES MULTIPLE CHALLENGES By, James Molloy MAI, FRICS, CRE QUALITY CONTROL Third-party real estate appraisal firms are production-driven businesses designed to complete assignments
Table of Contents. Chapter 1: Introduction (Mobile Technology Evolution) 1
 1") Chapter 1: Introduction (Mobile Technology Evolution) 1 I. WHY APPRAISAL IS IMPORTANT (p. 3) II. DEFINITION OF APPRAISAL (p. 4) A. Opinion (p. 4) B. Value (p. 5) C. Appraisal Art or Science? (p. 5) D.
Chapter 1: Introduction (Mobile Technology Evolution) 1 I. WHY APPRAISAL IS IMPORTANT (p. 3) II. DEFINITION OF APPRAISAL (p. 4) A. Opinion (p. 4) B. Value (p. 5) C. Appraisal Art or Science? (p. 5) D.
LOCAL IMPROVEMENT DISTRICT APPRAISER PRESENTATION. November 2017
 LOCAL IMPROVEMENT DISTRICT APPRAISER PRESENTATION November 2017 SPECIAL BENEFIT STUDY WHY? A special benefit study is a tool consistently used with LID projects. Municipality retains an expert consultant
Greenville is a tenant s market
 Research & Forecast Report GREENVILLE SPARTANBURG ANDERSON SOUTH CAROLINA OFFICE Q2 2018 Greenville is a tenant s market Crystal Baker Research Coordinator South Carolina Key Takeaways > > Large blocks
Housing Price Forecasts. Illinois and Chicago PMSA, October 2014
 Housing Price Forecasts Illinois and Chicago PMSA, October 2014 Presented To Illinois Association of Realtors From R E A L Regional Economics Applications Laboratory, Institute of Government and Public
Assessor s offices may observe rules or policy items that
 Understanding the Scope of Work Rule and Advisory Opinion 32 Kenneth L. Joyner, RES, AAS The statements made or opinions expressed by authors in Fair & Equitable do not necessarily represent a policy position
Avoiding Common Errors in Appraisals for Financial
 Avoiding Common Errors in Appraisals for Financial Institutions Panelists: Brian Bailey, CCIM, Senior Financial Analyst Commercial Real Estate, Federal Reserve Bank of Atlanta James Murrett, MAI, Director
MARKET STRATEGY VIEWPOINT U.S. Housing Decelerating
 Jan-01 Oct-01 Jul-02 Apr-03 Jan-0 Oct-0 Jul-05 Apr-0 Jan-07 Oct-07 Jul-08 Apr-09 Jan-10 Oct-10 Jul-11 Apr-12 Jan-13 Oct-13 Jul-1 Apr-15 Jan-1 Oct-1 Jul-17 Apr-18 U.S. Housing Decelerating August 27, 2018
CBRE Houston ViewPoint
 CBRE Houston ViewPoint DOWNTOWN HOUSTON: THE NEW GATEWAY MARKET? by Sara R. Rutledge Director, Research and Analysis INTRODUCTION Investor interest from both domestic and foreign sources has revived in
Real Estate Appraisal / Finance 322 Spring, 2011
 Instructor: Office: / Spring, 2011 Rich Hall Finance Dept. / 134 Rehn Hall 6:30 PM - 7:00 PM Tuesday or any time by appointment. Rehn Hall Room 134 (Finance Office) 453-2459 email: hallr@siu.edu / 529-5500
METHODOLOGY GUIDE VALUING MOTELS IN ONTARIO. Valuation Date: January 1, 2016
 METHODOLOGY GUIDE VALUING MOTELS IN ONTARIO Valuation Date: January 1, 2016 AUGUST 2016 August 22, 2016 The Municipal Property Assessment Corporation (MPAC) is responsible for accurately assessing and
DETACHED MULTI-UNIT APPROVALS
 HIA New Home Sales DETACHED MULTI-UNIT APPROVALS SALES MULTI-UNIT DETACHED A monthly update on the sales of new homes December 217 TAX BURDEN TAKES TOLL ON New Home Sales during 217 Sales still post modest
Modeling your Appraisal Report to Meet your Client's Needs in the Commercial Marketplace
 Modeling your Appraisal Report to Meet your Client's Needs in the Commercial Marketplace Myth #1 The Final Estimate of Value is the Only Area of the Report Anyone Reads Financial Institutions -Interagency
SUBJECT: Interagency Appraisal and Evaluation Guidelines
 BOARD OF GOVERNORS OF THE FEDERAL RESERVE SYSTEM WASHINGTON, D. C. 20551 DIVISION OF BANKING SUPERVISION AND REGULATION TO THE OFFICER IN CHARGE OF SUPERVISION AT EACH FEDERAL RESERVE BANK SUBJECT: Interagency
General Market Analysis and Highest & Best Use. Learning Objectives
 General Market Analysis and Highest & Best Use Learning Objectives Module & Title Module 1 Real Estate Markets and Analysis Module 2 Types and Levels of Market Analysis Module 3 The Six-Step Process and
619 STANDARD 2: REAL PROPERTY APPRAISAL, REPORTING
 619 STANDARD 2: REAL PROPERTY APPRAISAL, REPORTING 620 In reporting the results of a real property appraisal, an appraiser must communicate each analysis, 621 opinion, and conclusion in a manner that is
Asking Price Index Released 12/02/16 February 2016
 EMBARGOED UNTIL 12/02/16 HOME.CO UK ASKING PRICE INDEX February 2016 Released: 12/02/2016 1 of 6 Asking Price Index Released 12/02/16 February 2016 England Prices Take a Spring Leap Headlines England prices
San Francisco Bay Area to Napa County Housing and Economic Outlook
 San Francisco Bay Area to 019 Napa County Housing and Economic Outlook Bay Area Economic Forecast Summary Presented by Pacific Union International, Inc. and John Burns Real Estate Consulting, LLC On Nov.
Office of the Comptroller of the Currency Federal Deposit Insurance Corporation Federal Reserve Board Office of Thrift Supervision
 Office of the Comptroller of the Currency Federal Deposit Insurance Corporation Federal Reserve Board Office of Thrift Supervision Purpose Interagency Appraisal and Evaluation Guidelines October 27, 1994
US Views on Valuation Methodology
 US Views on Valuation Methodology Trevor R. Ellis, FAusIMM, CPG, CMA, CGA Mineral Property Valuer Ellis International Services, Inc. Denver, Colorado USA President American Institute of Minerals Appraisers
Multifamily Seller/Servicer Guide Chapter 12: Appraiser and Appraisal Requirements
 Multifamily Seller/Servicer Guide Chapter 12: Appraiser and Appraisal Requirements Please contact Marty Skolnik at Martin_Skolnik@freddiemac.com if you have questions about Freddie Mac s appraisal requirements.
MARKET VALUE BASIS OF VALUATION
 4.2 INTERNATIONAL VALUATION STANDARDS 1 MARKET VALUE BASIS OF VALUATION This Standard should be read in the context of the background material and implementation guidance contained in General Valuation
Restricted Use Appraisal Report Residential
 Client File #: Appraisal File #: Restricted Use Appraisal Report Residential Appraisal Company: Address: Form 200.04* Phone: Fax: Website: Appraiser: Co-Appraiser: AI Membership (if any): SRA MAI SRPA
Integra Realty Resources Memphis. Appraisal of Real Property
 Integra Realty Resources Memphis Appraisal of Real Property Retail Property 1219 1295 Main Street Southaven, Desoto County, Mississippi 38671 Prepared For: Presidential Bank Effective Date of the Appraisal:
LAND APPRAISAL REPORT
 IDENTIFICATION LAND APPRAISAL REPORT Page #1 File No. Borrower None Census Tract * Map Reference 462820011000315 Property Address NWC Gaar and Pleasant View Roads City Richmond County Wayne State IN Zip
VALUE FINDING APPRAISAL REPORT
 RE 90 Rev. 01-2014 VALUE FINDING APPRAISAL REPORT (Compensation not to exceed $65,000) COUNTY John Doe 2880 Lancaster-Newark Rd. (SR 37), Pleasant Twp., 43030 Owner Mailing Address of Owner East side of