2017 UBS Global Real Estate CEO/CFO Conference November 28-29, 2017
|
|
|
- Alaina Simon
- 5 years ago
- Views:
Transcription


1 2017 UBS Global Real Estate CEO/CFO Conference November 28-29, 2017
2 Forward-Looking Statement This slide presentation contains statements that constitute forward-looking statements within the meaning of the Securities Act of 1933 and the Securities Exchange Act of 1934 as amended by the Private Securities Litigation Reform Act of These forward-looking statements include, among others, our statements regarding (1) strategic initiatives with respect to our assets, operations and capital and (2) the assumptions underlying our expectations. Prospective investors are cautioned that any such forward-looking statements are not guarantees of future performance and involve risks and uncertainties, and that actual results may differ materially from those contemplated by such forward-looking statements. A number of important factors could cause actual results to differ materially from those contemplated by forward-looking statements in this slide presentation. Many of these factors are beyond our ability to control or predict. Factors that could cause actual results to differ materially from those contemplated in this slide presentation include the factors set forth in our filings with the Securities and Exchange Commission, including our annual report on Form10-K, quarterly reports on Form 10-Q and current reports on Form 8-K. We believe these forward-looking statements are reasonable, however, undue reliance should not be placed on any forward-looking statements, which are based on current expectations. We do not assume any obligation to update any forward-looking statements as a result of new information or future developments or otherwise. Certain of the financial measures appearing in this slide presentation are or may be considered to be non- GAAP financial measures. Management believes that these non-gaap financial measures provide additional appropriate measures of our operating results. While we believe these non-gaap financial measures are useful in evaluating our company, the information should be considered supplemental in nature and not a substitute for the information prepared in accordance with GAAP. We have provided for your reference supplemental financial disclosure for these measures, including the most directly comparable GAAP measure and an associated reconciliation in the appendix to this presentation as well as in our most recent quarter supplemental report and earnings release, the latter two of which are available on our website at Our most recent quarter supplemental report also includes the information necessary to recalculate certain operational ratios and ratios of financial position. The calculation of these non-gaap measures may differ from the methodology used by other REITs, and therefore, may not be comparable. 2

3 Contents Who We Are Why Duke Realty 4 Key Business Drivers 7 Asset Strategy Operating Portfolio 13 Development 20 Acquisitions 29 Operating Strategy 35 Capital Strategy 39 Why Duke Realty & ESG 42 3
 Baa1/BBB+ credit ratings; very strong corporate governance 21 major U.S. logistics markets; 980 Tenants WHO WE ARE 4")
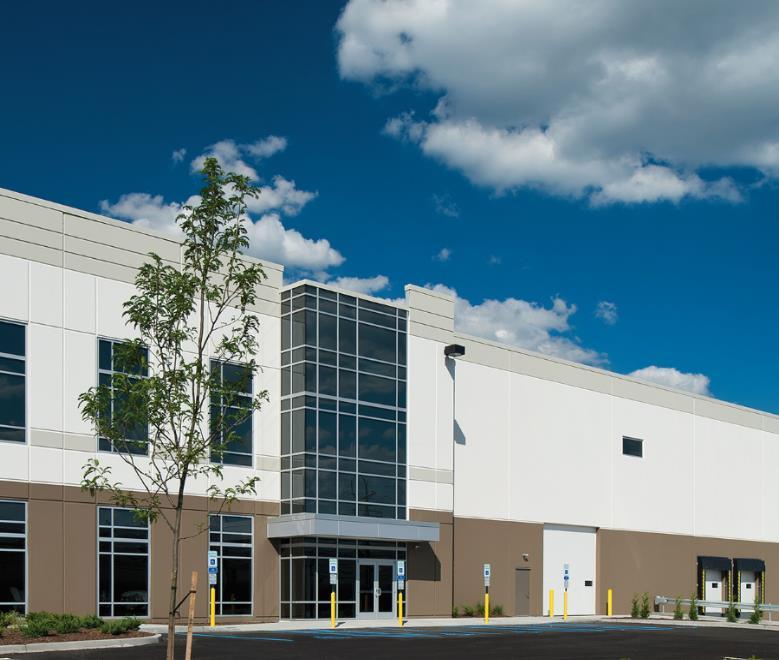
4 Who We Are Largest pure play domestic-only industrial REIT Founded 1972, IPO 1993; enterprise value ~$12 billion 486 modern facilities; 144 million Sq Ft Member of S&P 500 Index Camp Creek, Atlanta, GA (Dick s Sporting Goods) Baa1/BBB+ credit ratings; very strong corporate governance 21 major U.S. logistics markets; 980 Tenants WHO WE ARE 4


5 Why Duke Realty? Why Duke Realty? Superior Asset Quality Deep and Experienced Management Team; Vertically Integrated 45 Year Development Track Record; Significant Value Creation Core Portfolio supports Low Volatility, Property NOI Growth Best in Class Balance Sheet; Consistent AFFO Growth Conservative Dividend Payout Ratio with Dividend Upside Chesapeake Commerce 5501 (Amazon), Baltimore, MD WHO WE ARE 5
6 Industrial Advantage 45 Years of industrial operating and development experience as primary driver of company growth MODERN BULK DISTRIBUTION big-box focus resulting in higher credit quality tenants with fewer overall tenants to manage TIER 1 MARKETS focus in key trucking, rail, air cargo and shipping corridors GROWING NOI STREAM with contractual rent escalations and increasing rental rates on rollover; capture strong market rent growth; low capex and highly occupied development project deliveries E-COMMERCE & SUPPLY CHAIN RECONFIGURATION secular trends driving an extended cycle of incremental demand for modern industrial product WHO WE ARE 6

7 KEY INDUSTRIAL BUSINESS DRIVERS & STATE OF THE MARKET 7
8 Demand: Macroeconomic Indicators / Drivers Correlation (1) Growth Forecast Trend E-Commerce Sales 75% correlated to modern logistics facility (2) absorption 13-15% (3) Retail Sales (4) 40% % (4) Brick n Mortar Sales (4) GDP Inbound Port Traffic, Intermodal Rail, Retail Inventories, Industrial Production 40% % (4) 55% % (5) 50-60% % (6) (1) Per CoStar Portfolio Strategy (CPS) Leading Economic Indicators for logistics ; (2) Modern, logistics facility defined as >1995 age and 250K+ SF size; correlation is to square feet of absorption and assumes 1-4 quarter lead; (3) Forecasts per CPS; (4) Retail Sales represents Retail Sales & Food services, ex Auto & Gas, as of Q2 per Census Bureau and CPS, Brick n Mortar Sales represents Retail ex-a&g less E-comm; (5) Per 9/20/17 FOMC projections; (6) Represents 2017 forecast for industrial production, per Moody s Analytics. MARKET OVERVIEW 8
9 E-Commerce penetration and growth rate signal continued outsized growth E-comm sales capturing greater proportion of overall retail sales projections are a rise to 15-20% by 2020 E-comm sales growing approximately 15% annually ~ 4x to 5x rate of bricks and mortar E-commerce as a % of Total Retail Sales 2.5% 2.9%3.4%3.6% 4.0% 4.4%4.8% 5.3% 5.8%6.4% 8.7% 8.0% 7.2% YOY % 35% 25% 15% 5% -5% Growth Rate: E-commerce vs. in-store sales E-COMMERCE 16% 3% IN-STORE -15% Source: Retail sales (incl A&G) and Ecomm sales as of Q2 per Census Bureau; if exclude A&G, penetration rises from 8.7% to 13.3%. E-comm sales capture in 2020 per emarketer. MARKET OVERVIEW 9
 from 2017 through 2020 could drive approximately 292 million SF of incremental demand 89 Incremental SF estimated from E-Comm per year (square feet millions) 77 67 58 51 42 38 29 31 30 24")
10 Demand: New industrial square footage needed to keep up with growth in e-commerce sales $1 billion of E-commerce sales requires approximately 1 million SF of fulfillment space (1) Projected E-comm sales (2) from 2017 through 2020 could drive approximately 292 million SF of incremental demand 89 Incremental SF estimated from E-Comm per year (square feet millions) (1) Metric per CBRE, Cushman & Wakefield, NAIOP. (2) Assumes continued E-comm sales growth from run rate of 15% MARKET OVERVIEW 10
 in a modern fulfillment center compared to traditional warehouse space that")
 (1) Per CBRE, a 3:1 ratio is an approximation of needed space comparing the two distribution models.")
11 Demand: E-Commerce warehousing different from traditional distribution requires more square footage E-commerce sales requires approximately 3x the square footage (1) in a modern fulfillment center compared to traditional warehouse space that support bricks and mortar stores Traditional Warehousing Inventory (stacking, pallets) E-Commerce Inventory (aisles, bins, SKU s, returns) (1) Per CBRE, a 3:1 ratio is an approximation of needed space comparing the two distribution models. MARKET OVERVIEW 11
* 2.8% 1.9% -0.9% -4.4% -2.9% -0.2% UC % of Stock 1.8% 3.6% 5.0% 6.2% 6.5% 5.")
12 Supply: Supply in better shape than last cycle, supported by stronger occupancy and rent growth backdrop Under Construction (MSF)* Market Rent Growth (Y/Y)* 2.8% 1.9% -0.9% -4.4% -2.9% -0.2% UC % of Stock 1.8% 3.6% 5.0% 6.2% 6.5% 5.1% Under Construction as % of Stock 4% 3% 2% 1% 0% Total Under Construction as % of Stock at ~1.6% compared to nearly 2% at the last peak + Vacancy Rates today at ~4.5% are 350 basis points lower than last peak = Stronger Rent Growth this cycle Source: CoStar s all industrial *National index comprising 54 major Core Based Statistical Areas (CBSAs) as defined by U.S.OMB. As of 8/17/2017 MARKET OVERVIEW 12

13 Park 840 (Starbucks), Nashville, TN ASSET STRATEGY OPERATING PORTFOLIO 13

14 Portfolio Geography Diversified in 21 major industrial logistics markets Growth focus in Tier 1 markets 55% Tier 1 market exposure Northern California Southern California Seattle Minneapolis-St. Paul Chicago Indianapolis St. Louis Dallas Cincinnati Nashville Eastern/Central Pennsylvania Columbus Atlanta Raleigh Baltimore Washington DC Savannah New Jersey Houston RELIABLE. Central ANSWERS. Florida South Florida Concentration by NAV $100MM $300MM $300MM $500MM $500MM $750MM > $750M Note: Cap rate estimates for NAV per CBRE semi-annual cap rate survey plus an adjustment factor per DRE relative portfolio quality by market. PORTFOLIO 14

 120 170 177 188 205 287 EGP FR DCT PLD LPT STAG DRE Source: Estimates based on domestic, industrial-only facilities per Q3 2017 company")
15 In-Service Industrial Portfolio Peer Comparison < 100K SF U.S. Industrial Size Exposure (in millions of square feet, at pro rata ownership) 100K-500K SF > 500K SF DRE PLD DRE LPT DCT STAG FR EGP Source: Estimates based on pro rata ownership percent of domestic, industrial-only facilities per Q3 supplemental reports. Square feet by size allocations per CoStar database Average Building Size (000 s square feet) EGP FR DCT PLD LPT STAG DRE Source: Estimates based on domestic, industrial-only facilities per Q company supplementals (LPT and EGP per CoStar October, 2017). No adjustment for partial property ownership interests. DRE LPT DCT EGP PLD FR STAG Average Building Age (in years) Source: Per CoStar database based on wtd avg RBA basis, flex & industrial, in-service, only; October DRE per internal records. No adjustment for partial property ownership interests. PORTFOLIO 15

16 Modern Portfolio Advantage 32'+ Clear Height Capturing Outsized Demand Portfolio Average Clear Height (in feet) Peers DRE Peers include DCT, EGP, FR, LPT, PLD, and STAG. Per CoStar as of November 2017; DRE Q actual Clear Height driving majority of absorption growth, contributing to strong second generation leasing and development opportunities. DUKE REALTY PORTFOLIO BEST POSITIONED Ceiling Clear Height Stratification Duke Realty Duke Peers U.S. 54 Major Metros 31% 28% 25% 24% 25% 23% 19% 12% 2% 42% 20% 16% 19% 8% 6% 32 + Clear Height Ranking (as % of each data set total portfolio) 61% 28% 22% % of Total Absorption Represented By 32 + Clear Height (as % of CoStar54 total inventory) 70% 50% 30% 10% 70% 58% 0-23 feet feet feet feet >35 feet PORTFOLIO 16
17 Modern, Big Box Facilities Producing Strong Rent Growth and Low Capex... Drives AFFO Growth Duke Realty Renewal Rent Growth by Building Size 5% 8% ( ) 11% 9% Duke Realty Average TIs/LCs 15% 13% <100K SF 100K-500K SF (as % of Net Effective Rent*) 11% 13% >500K SF Total <100K SF 100K-500K SF Older than or Newer >500K SF Total National Average Rent By Age * $5.75 $ % higher rents $0.15 * Net Effective Rent ( NER ) is the total rent excluding expense reimbursements collected over the life of a lease. Capex comprises second generation TI s and LC s. ( ) Duke Realty Average Building Improvements ** -- Size Stratification Age Stratification -- $0.06 $0.06 (per square foot) $0.08 $0.13 $0.06 *Asking rents for logistics facilities only per CoStar, as of mid-august Comprises 38 Core Based Statistical Areas (CBSAs) as defined by the U.S. OMB where Duke owns logistics properties. Rent observations are equal-weighted at the building level, not weighted by market size. $0.02 $ Total ** Capital costs to maintain the quality and functionality of a building - primarily roof, HVAC, parking and truck court replacements. ( ) PORTFOLIO 17
18 Tenant Profile and Risk Management Rank Tenant Industrial AGLV % of Total Industrial AGLV 1 Amazon.com $ % Publishing 3% Technology 4% Health Services Chemical 2% Products 2% Other (1) 3% 2 Wayfair Inc % 3 Home Depot % 4 NFI Industries % 5 Crate and Barrel % 6 HD Supply Inc % 7 Lagardere Group % 8 Wal Mart % 9 Mars, Incorporated % Textiles 4% Food products 6% Consumer Services 6% Wholesale Goods 10% Retail 10% Transportation 18% Manufactured Products 16% E-commerce 16% 10 XPO Logistics % Total $ % (1) Other includes government agencies, construction, financial services, utilities, and agriculture Strong Financial Review Protocols Due Diligence on prospective tenants Credit analysis reviews Rent reserve protocols Bad debt expense since 2007 has averaged only 0.20% Watch-lists Biannual business unit review meetings Proactive Asset Management Strong tenant relationships Regular physical inspections Aggressive accounts receivable control Operating expense & capital expenditure control Location strategy, standard facility build-outs and strong regional operations teams contribute to reduced risk on re-leasing space and maintaining long term functionality PORTFOLIO 18


19 Operating Platform Aligned with E-commerce Growth 16% of tenant base e-commerce oriented and growing 41% of development starts since 2013 e- commerce related 519,000 square feet average e- commerce lease size since 2013 PORTFOLIO 19

20 Legacy Commerce Center (Brownfield development), Linden, NJ ASSET STRATEGY DEVELOPMENT CAPABILITIES 20
21 Development Strategic Advantages 45 Years of development experience STRATEGIC LAND locations that can support approximately 31 million square feet of industrial development (including land options) 70% REPEAT BUSINESS INTERNAL TEAM since 2010 with national customers; growing track record in executing e-commerce facilities.. 20% of current pipeline e-commerce related provides competitive advantage in all aspects of development, including preconstruction and construction, to deliver lowest cost projects on schedule STRONG RISK MANAGEMENT policies in place to govern speculative exposure and development pipeline size DEVELOPMENT 21
 57% of projects build-to-suit; 62% of projects > 50% preleased Yields and profit margins of 6.")
22 Development Strategic Advantages Activity Since 2010 $2.6B investment and 106 development projects $590 million estimated value creation (2) 57% of projects build-to-suit; 62% of projects > 50% preleased Yields and profit margins of 6.7% and 22%, respectively (1) (1) Based on stabilized cash yield; (2) Value creation uses market cap rates at delivery date, with cap rate sources per CBRE and internal records DEVELOPMENT 22


23 2017 Development Starts 2017 YTD Starts in Aggregate $639 million projected costs 9.5 million square feet 59% pre-leased 6.5% initial yield, mid 20 s% range estimated margin Minneapolis One spec development 375,000 SF 46% pre-leased; currently 100% leased Columbus Three spec developments 1.1 million SF 0% pre-leased; currently 39% leased Pennsylvania Two spec developments 1.8 million SF, 0% pre-leased Southern California 1.2 million SF in two projects One build-to-suit One build-to-suit expansion Indianapolis 1.3 million SF in three projects Two build-to-suits One spec development; 65% preleased; currently 100% leased St. Louis One 300,000 SF spec development Atlanta One 337,000 SF spec development Dallas 1.6 million SF in three projects Two build-to-suits One spec development; 0% preleased Houston 1.0 million SF build-to-suit South Florida One spec development 166,000 SF 0% pre-leased; currently 28% leased Central Florida 170,000 SF build-to-suit DEVELOPMENT 23

24 Speculative Development: Proven execution 39 speculative projects since 2010 Successful lease-up average stabilization 7 months after in-service 12% average pre-leased at start; 79% leased at 9/30/2017 $811 million investment; 25-30% margins DEVELOPMENT 24


 (4) Build-to-Suit data")

25 In-Fill Redevelopment: Core Expertise 27 industrial projects 7.4 million square feet $600 million investment 30% profit margins Example In-fill Redevelopment Process Washington D.C. Dulles Submarket (1) (2) TransDulles Centre (3) (4) Build-to-Suit data centers for Amazon, 1 re-development, 2 ground-up BTS, 149,000 SF each; completed projects expected to be sold DEVELOPMENT 25


26 In-fill Redevelopment: SoCal Mid-Counties submarket Phoebe Ave Trojan Way Alondra Blvd Northam St & Trojan Way La Mirada TROJAN WAY 477,000 SF UNDER CONSTRUCTION TROJAN WAY 497,000 SF Desman Rd 2015 in-fill land acquisition of brownfield site, adjacent to existing DRE facility Successfully worked through site remediation contingencies and various government approvals Late 2016 executed 477,000 SF build-to-suit project with UPS Logistics Estimated profit margin > 40% RELIABLE. ANSWERS. DEVELOPMENT 26


27 In-fill Redevelopment: SoCal South Bay submarket Long Beach Airport (8 Miles) Port of Los Angeles & Long Beach (11 Miles) 2700 East Imperial Hwy & Alameda St Lynwood 2015 in-fill land acquisition of brownfield site, adjacent to existing DRE facility Successfully completed a remediation plan with government agencies, demolished an old manufacturing facility, remediated the site and completed the entitlement process Early 2017 commenced 201,000 SF spec development, late 2017 signed lease for 100% of space Estimated profit margin near 80% range Alameda St 201,000 SF UNDER CONSTRUCTION 2700 East Imperial Hwy 323,000 SF Alameda St 201,000 SF UNDER CONSTRUCTION 2700 East Imperial Hwy, 323,000 SF DEVELOPMENT 27

28 Strong Relative Development Pipeline Total U.S. Pipeline Size (in $ millions) Pipeline Pre-leasing Track Record 3 Yr Avg Pre-lease Current Pre-lease $796 80% $696 60% 3 Yr Avg 62% $475 $403 40% 38% peer 3 yr avg $92 $193 20% PLD DRE LPT DCT EGP FR 0% PLD DRE LPT DCT EGP FR Note: Pipeline size and pre-lease % only include domestic, industrial projects under development and exclude pre-stabilized in-service developments. Source: Q and historical company supplementals DEVELOPMENT 28

29 17791 Perris Boulevard (Deckers Outdoor Corp), Inland Empire East Submarket ASSET STRATEGY ACQUISITIONS 29
30 Acquisition Strategy MARKET focused on growth in Tier 1, primarily high barrier markets, such as Southern California, Northern New Jersey and South Florida PRODUCT Modern, Class A distribution product and older product in strategic infill locations with potential for redevelopment INVESTMENT PROFILE PLATFORM RELATIONSHIPS Core, value add, or opportunistic Use acquisitions to build economies of scale and leverage regional operations and development platform in targeted markets Leverage relationships with brokers, principals and tenants to focus on both marketed and off-market transactions EFFICIENCY Internal due diligence teams and excellent access to capital allow for a highly efficient due diligence and funding process ACQUISITIONS 30
31 2017 Acquisition Summary Total (in $millions) Bridge 1 (1) (in $millions) non-bridge (in $millions) In-place Occup In-place cap rate Stabilized Cap Rate YTD Acq $ 630 $ 219 $ % 2.6% 4.7% Q4 Acq (est d) 2017 Acq (guidance or est d) (est d, subject to closing) % (est d) $ 700-1,100 $ 516 $ % (est d) 2.4%-2.7% ~4.6% 2.4%-2.7% 4.6%-4.7% Assets located in top submarkets in Tier 1 MSA s Average age < 2 years, average clear height > 33 Stabilized Cap Rate projected to meet or exceed MOB cap rate, with new assets having stronger long term growth characteristics (1) Portfolio acquisition from Bridge Development Partners, announced in Q3 2017, encompassing 10 completed or under-construction assets acquired in stages in Q3 and Q4 2017, totaling 3.4M SF and $516M in purchase price. Two (2) land parcels are expected to be acquired in late Q4 / early Q1, on which two properties totaling 853,000 square feet will be constructed, which when completed are expected to total $ M in total investment. ACQUISITIONS 31


32 Acquisitions Year-To-Date Southern California Mid Counties submarket 219,000 SF; 100% leased Lockport Portfolio I-55 submarket Three buildings; 803,000 SF; 63% leased North New Jersey Meadowlands submarket 156,000 SF; 100% leased Southern California Inland Empire West & San Gabriel Valley Four buildings; 752,000 SF; 71% leased NJ Bridge Portfolio (see details following page) Southern California Bridge Portfolio Inland Empire West & San Gabriel Valley Two buildings; 866,000 SF; 55% leased South Florida Bridge Portfolio Central Broward submarket Two buildings; 306,000 SF; 77% leased Southern California Inland Empire East 794,000 SF; 100% leased South Florida Medley submarket Three buildings; 677,000 SF; 30% leased ACQUISITIONS 32


33 Acquisitions Bridge New Jersey Point Carlstadt (land) 194,000 SF; 2018 development 429 Delancy St. (land) 659,000 SF; 2018 development 900 Federal Boulevard 207,000 SF; 100% leased E-Port (1000, 980, & 960 High St.) 1,293,000 SF; 56% leased Davidson Mill Rd. 489,000 SF; 100% leased 10 Broadway Road 264,000 SF; 100% leased ACQUISITIONS 33


34 2017 Capital Redeployment Summary $ 1) Debt Paydowns 2) Expected Return of Capital 4Q17 3) New Developments & Acquisitions $2.995 Billion Portfolio Sale $2.95 billion monetization of MOB portfolio at a 4.6% cap rate, generating capital for accretive re-deployment opportunities Sale generated an approximate 5% increase to street NAV estimates Selective redeployment into Tier 1 market acquisitions with valueadd leasing component at cap rates approximating or in excess of MOB cap rate. Fund development pipeline at yields significantly in excess of MOB cap rate. Return of capital to shareholders and better positioned balance sheet and asset profile for long term growth CAPITAL REDEPLOYMENT 34
, Airport Submarket, Indianapolis, IN")
35 AllPoints Midwest Building 3 (Walmart.com), Airport Submarket, Indianapolis, IN OPERATING STRATEGY 35
36 Exceptional Leasing Performance Record Occupancy and Balanced Supply-Demand Continues to Support Rent Growth Key Metrics Driving Performance (1) Stabilized Portfolio Occupancy (stabilized in-service assets) 97.8% 98.1% 98.0% 98.2% average stabilized occupancy 19% average rent growth 3.9% YTD same property NOI growth 95.8% 97.1% 7.1 years average lease term at signing 5.8 years average lease term remaining (representative of all leases in-place at 9/30/2017) Q % average lease renewal rate (1) Statistics above year-to-date 2017 (unless otherwise noted); Rent growth and renewal metrics based on second generation leasing only. Average lease term includes first generation leases, typically new development starts. OPERATIONS 36
 $33.8 $87.6 38.")
37 Strong Overall NOI Growth Q3 Actual NOI (annualized) NOI Growth Upside ($ s in millions) DRE better positioned for overall NOI growth because of higher percentage of properties in nonsame property population with significant upside $13-17 $ % forward 12-month growth assumption (escalators + rent growth + Flat to -0.5% occupancy) $33.8 $ % growth upside to Stabilization 17-18% embedded near term total NOI upside from Q3 $43.0 $93.8 $518.2 Upside Existing Same Property NOI Non-Same Property NOI In-service Under Dev NOI (future 2018 & 2019) Total NOI Occupancy DRE Q3 97.4% 75.0% 62.9% 93.2% - occupancy upside to stabilization (~96-98%) stabilized % % % Occupancy DRE 2Y Avg 97.5% Occupancy Peers Q3 96.7% Occupancy Peers 2Y Avg 96.0% DRE achieved peak sameproperty occupancy sooner than peers In-service NOI % - DRE Q3 83% 17% In-service NOI % - Peer Avg Q3 88% 12% DRE has much larger non-same property pool than peers with significant occupancy upside Peers = PLD,DCT,LPT,FR; EGP did not disclose. NOI figures on a cash basis. Under Development NOI incorporates unfunded capital requirements to complete construction of facilities. OPERATIONS 37

38 Consistent Historical Cash Flow Growth Dividends Integral to Investment Returns AFFO Regular Dividends Special Dividends ~6% CAGR (1) with major asset repositioning and de-leveraging. Normalized AFFO growth rate expected to return for Regular common dividend rate raised 5.9%, 5.6% and 5.3% in fourth quarters of 2015, 2016 and 2017, respectively. Significant dispositions in 2015 contributed to $70 million special dividend from MOB sale estimated between $252-$415 million. +$ % quarterly dividend increase announced for Q4 Special Dividend Range ($ in millions) $330 $296 $228 $223 $231 $185 +$252 $395 (2) $378 $355 +$70 $258 $277 $241 RELIABLE. ANSWERS Guidance mid-point AFFO Payout 83% 76% 71% 68% 69% 71% Wtd Avg Shares (1) Represents compounded annual growth rate of AFFO on a shared-adjusted basis. (2) 2017 AFFO approximates 2017 Range of Estimates Growth in AFFO mid-point of 2.8%. OPERATIONS 38

39 Yusen Logistics, O Hare submarket, Chicago, IL CAPITAL STRATEGY 39


40 Strong Credit Ratings Moody s Baa1 (stable outlook) S&P BBB+ (stable outlook) 9/30 DEBT MATURITIES Recently renewed $1.2 billion line of credit, extending maturity to 2022 and reducing borrowing costs. Borrowing rate currently ~ 2.0% Leverage levels and liquidity / borrowing capacity provides dry powder for significant growth CAPITAL 40
 Debt Profile % (3) Debt Profile (3) Fixed / Unsecured / Wtd Avg Variable% Secured % Rate % DRE 100 / 0 85 / 15 4.5 PLD 87 / 13 84 / 16 3.1 EGP 87 / 13 81 / 19 3.")
41 Conservative Capital Structure with Refinancing Upside Fixed Charge Coverage Ratio (1),(2) Net Debt / EBITDA (1),(2) Average: 4.3x Average: 5.7x 4.8x 4.6x 5.1x 4.6x 3.7x 4.1x 4.1x 4.3x 4.8x 5.7x 5.9x 5.7x 5.1x 6.1x Debt Profile % (3) Debt Profile % (3) Debt Profile (3) Fixed / Unsecured / Wtd Avg Variable% Secured % Rate % DRE 100 / 0 85 / PLD 87 / / EGP 87 / / DCT 81 / / LPT 90 / / FR 89 / / Refinancing upside to current rates 73% AFFO Payout Ratio (4) Average: 76% 84% 84% 76% 66% 68% (1) Peers are 9/30/17 current quarter annualized per Wells Fargo Credit research. (2) Source: DRE 9/30/17 Actual Fixed Charge Coverage (FCC) and Net Debt/EBITDA current quarter annualized, DRE Forecast TTM Proforma. (3) Source: 9/30/17 Company Supplementals. Figures in % s. (4) Source: Average of Factset and SNL as of 11/3/17. Based on consensus dividend and consensus median AFFO estimates. Due to special div, DRE based on 2017 dividend rate and mid-point of AFFO growth (share-adjusted) expectations. CAPITAL 41

42 Freeport IX, DFW submarket, Dallas, TX WHY DUKE REALTY? 42
43 Why Duke Realty? Why Duke Realty? Superior Asset Quality Youngest portfolio in industry and 287,000 square foot average building size produces lower capex, lower turnover, and higher credit tenants including fast growing e-commerce customers Benefit from tenant flight to quality in down cycle, more cash flow resilience Industry leading Management Team 45 Year Development Track Record of Creating Value Highly renowned executive team with proven success; vertically integrated platform with deep customer relationships Industrial development starts have averaged $445 million since 2012 and averaged 65% pre-leased. Estimated margins historically near 20% generating significant value creation. Strategic land bank and land acquisitions fuels long term NAV growth potential Best in Class Balance Sheet Lowest Debt/EBITDA ratio in sector Excellent access to capital; emphasis on self-funding Positioned for offense as opportunities arise Consistent Cash Flow Growth 6.2% CAGR in AFFO for last 5 years with strong portfolio dynamics to drive continued growth Low Dividend Payout Ratio with Dividend Increases Dividend increases last three years (5.9%, 5.6% and 5.3%, respectively) and positioned for future increases WHY DUKE REALTY 43


44 Sustainability at Duke Realty Environmental LEED CERTIFICATIONS PROJECTS DELIVERED SINCE 2008 LEED ACCREDITED PROFESSIONALS IN-HOUSE Social $198M 12, VENDOR SPEND WITH SMALL AND DIVERSE BUSINESSES TOTAL 2016 ASSOCIATE VOLUNTEER HOURS Governance GOVERNANCE QUALITY SCORE OF 4 ** OVER 30% FEMALE BOARD MEMBERS PART OF GLOBAL WOMEN S INDEX FUND ** ISS QualityScore based on four pillars - Board Structure, Shareholder Rights, Compensation and Audit. In aggregate, over 100 variables drive the composite score. Peer set is S&P 500 firms as of 8/1/17. ESG / SUSTAINABILITY 44
45 2017 Range of Estimates (dollars in millions except per share amounts) Revised October 25th, 2017 Metrics 2016 Actual 2017 YTD Range of Estimates Pessimistic Optimistic Key Assumptions Net Income per Share Attributable to Common Shareholders - Diluted NAREIT FFO per Share Attributable to Common Shareholders - Diluted $0.88 $4.03 $4.45 $ Previous guidance of $4.40 to $ Significant gains on property sales. $1.21 $0.94 $1.22 $ Previous guidance of $1.20 to $ Includes net gains on land sales, debt extinguishment costs and promote income. Core FFO per Share Attributable to Common Shareholders - Diluted $1.20 $0.94 $1.21 $ Previous guidance of $1.20 to $ Accretive development projects placed in service. - Relatively flat occupancy with strong rent growth. - Overall strong property results offset decline in service operations. - Includes lease buyout income, net of tax, of $0.02 per share. Growth in AFFO - Share Adjusted 5.0% 7.4% 0.9% 4.7% - Driven by same factors impacting Core FFO. Average Percentage Leased (in service, bulk distribution) Same Property NOI Growth (bulk distribution only) Building Acquisitions (Duke share) Building Dispositions (Duke share) 96.5% 96.9% 96.4% 97.0% - Excludes impact of 2017 acquisitions. - Strong leasing economics. - Leased significant speculative development. - Near peak occupancy and limited up-side on operating portfolio. 6.0% 3.9% 3.0% 3.8% - Continued solid rent growth expected, embedded lease escalators. $170 $630 $700 $1,100 - Focused on Tier 1 markets. $686 $2,848 $3,000 $3,200 - Dispose of medical office portfolio. - Dispose of residual office and prune industrial. Land Sale Proceeds $70 $29 $40 $60 - Non-strategic inventory is shrinking. Development Starts (JVs at 100%) $697 $660 $700 $900 - Strong start and good pipeline of BTS prospects. - Speculative industrial starts in targeted growth markets. Service Operations Income $11 $4 $2 $4 - Focus on development over third party work. - Lower fees from joint ventures. General & Administrative Expense $55 $41 $56 $52 - Stable overhead levels. Effective Leverage (Gross Book Basis) 36% 26% 31% 27% - Reflects short-term impact of medical office properties disposition. Fixed Charge Coverage (proforma TTM) (1) Net Debt to Core EBITDA (proforma TTM) (2) 3.6X 4.8X 4.4X 4.8X - Strong operational performance. - Full year impact of 2016 refinancing savings. 5.1X 4.2X 5.0X 4.5X - Reflects short-term impact of medical office properties disposition. - Increase to fund development and acquisitions. - Maintain Baa1/BBB+ ratings. Special Dividend per Share $ $ $0.70 $ Impacted by development and acquisition opportunities (1) Fixed charge coverage ratio for YTD 2017 is based on most recent quarter. (2) Net debt to core EBITDA for YTD 2017 is based on proforma current quarter annualized. GUIDANCE 45
46 CoStar Disclaimer THESE COSTAR PORTFOLIO STRATEGY MATERIALS CONTAIN FINANCIAL AND OTHER INFORMATION FROM A VARIETY OF PUBLIC AND PROPRIETARY SOURCES. COSTAR GROUP, INC. AND ITS AFFILIATES (COLLECTIVELY, COSTAR ) HAVE ASSUMED AND RELIED UPON, WITHOUT INDEPENDENT VERIFICATION, THE ACCURACY AND COMPLETENESS OF SUCH THIRD PARTY INFORMATION IN PREPARING THESE MATERIALS. THE MODELING, CALCULATIONS, FORECASTS, PROJECTIONS, EVALUATIONS, ANALYSES, SIMULATIONS, OR OTHER FORWARD-LOOKING INFORMATION PREPARED BY COSTAR AND PRESENTED HEREIN (THE MATERIALS ) ARE BASED ON VARIOUS ASSUMPTIONS CONCERNING FUTURE EVENTS AND CIRCUMSTANCES, WHICH ARE SPECULATIVE, UNCERTAIN AND SUBJECT TO CHANGE WITHOUT NOTICE. YOU SHOULD NOT RELY UPON THE MATERIALS AS PREDICTIONS OF FUTURE RESULTS OR EVENTS, AS ACTUAL RESULTS AND EVENTS MAY DIFFER MATERIALLY. ALL MATERIALS SPEAK ONLY AS OF THE DATE REFERENCED WITH RESPECT TO SUCH DATA AND MAY HAVE MATERIALLY CHANGED SINCE SUCH DATE. COSTAR HAS NO OBLIGATION TO UPDATE ANY OF THE MATERIALS INCLUDED IN THIS DOCUMENT. YOU SHOULD NOT CONSTRUE ANY OF THE DATA PROVIDED HEREIN AS INVESTMENT, TAX, ACCOUNTING OR LEGAL ADVICE. COSTAR DOES NOT REPRESENT, WARRANT OR GUARANTY THE ACCURACY OR COMPLETENESS OF THE INFORMATION PROVIDED HEREIN AND SHALL NOT BE HELD RESPONSIBLE FOR ANY ERRORS IN SUCH INFORMATION. ANY USER OF THE INFORMATION PROVIDED HEREIN ACCEPTS THE INFORMATION AS IS WITHOUT ANY WARRANTIES WHATSOEVER. TO THE MAXIMUM EXTENT PERMITTED BY LAW, COSTAR DISCLAIMS ANY AND ALL LIABILITY IN THE EVENT ANY INFORMATION PROVIDED HEREIN PROVES TO BE INACCURATE, INCOMPLETE OR UNRELIABLE COSTAR REALTY INFORMATION, INC. NO REPRODUCTION OR DISTRIBUTION WITHOUT PERMISSION. 46
47 Definitions Supplemental Performance Measures Funds from Operations ( FFO ): FFO is computed in accordance with standards established by the National Association of Real Estate Investment Trusts ( NAREIT ). NAREIT defines FFO as net income (loss) excluding gains (losses) on sales of depreciable property and impairment charges related to depreciable real estate assets; plus real estate related depreciation and amortization, and after similar adjustments for unconsolidated joint ventures. We believe FFO to be most directly comparable to net income as defined by generally accepted accounting principles ( GAAP ). We believe that FFO should be examined in conjunction with net income (as defined by GAAP) as presented in the financial statements accompanying this release. FFO does not represent a measure of liquidity, nor is it indicative of funds available for our cash needs, including our ability to make cash distributions to shareholders. Core Funds from Operations ( Core FFO ): Core FFO is computed as FFO adjusted for certain items that are generally non-cash in nature and that materially distort the comparative measurement of company performance over time. The adjustments include gains on sale of undeveloped land, impairment charges not related to depreciable real estate assets, tax expenses or benefits related to (i) changes in deferred tax asset valuation allowances, (ii) changes in tax exposure accruals that were established as the result of the previous adoption of new accounting principles, or (iii) taxable income (loss) related to other items excluded from FFO or Core FFO (collectively referred to as other income tax items ), gains (losses) on debt transactions, gains (losses) on and related costs of acquisitions, gains on the sale of merchant buildings, promote income and charges related to major overhead restructuring activities, including severance. Although our calculation of Core FFO differs from NAREIT s definition of FFO and may not be comparable to that of other REITs and real estate companies, we believe it provides a meaningful supplemental measure of our operating performance. Adjusted Funds from Operations ( AFFO ): AFFO is a supplemental performance measure defined by the company as Core FFO (as defined above), less recurring building improvements and total second generation capital expenditures (the leasing of vacant space that had previously been under lease by the company is referred to as second generation lease activity) related to leases commencing during the reporting period, and adjusted for certain non-cash items including straight line rental income and expense, non-cash components of interest expense and stock compensation expense, and after similar adjustments for unconsolidated partnerships and joint ventures. Core EBITDA: Core EBITDA is earnings, including share of joint ventures, before interest, taxes, depreciation and amortization adjusted to exclude gains or losses on land or other property sales, gains or losses pertaining to acquisitions, impairment charges, capital transactions, promote income and severance charges related to major overhead restructuring activities. Property Level Net Operating Income - Cash Basis ("PNOI"): PNOI is comprised of rental revenues from continuing operations less rental expenses and real estate taxes from continuing operations, along with adjustments to exclude the amortization of above and below market rents, amortization of lease concessions, lease termination fees as well as an adjustment to add back intercompany rent. PNOI, as we calculate it, may not be directly comparable to similarly titled, but differently calculated, measures for other REITs. We believe that PNOI is another useful supplemental performance measure, as it is an input in many REIT valuation models and it provides a means by which to evaluate the performance of the properties within our Rental Operations segments. Same Property Performance Net Operating Income ("SPNOI"): We evaluate the performance of our properties, including our share of properties we jointly control, on a "same property" basis, using PNOI with certain minor adjustments. We view same property net operating income as a useful supplemental performance measure because it improves comparability between periods by eliminating the effects of changes in the composition of our portfolio. We define our same property portfolio as those industrial and medical office properties that have been owned and in operation throughout the twenty-four months preceding the most recent reporting period. In addition to excluding properties that have not been owned and in operation for the most recent twenty-four months, we also exclude properties from our same property portfolio where revenues from individual lease buyouts in excess of $250,000 have been recognized.. 47 KEY DEFINITIONS
48 FFO, Core FFO and AFFO (in thousands) Guidance Actual Actual Actual Actual Actual Net income attributable to common shareholders $ 1,635,023 $ 312,143 $ 615,310 $ 204,893 $ 153,044 $ (126,145) Add back: Noncontrolling interest in earnings of unitholders 16,342 3,089 6,404 2,627 2,094 Net Income Attributable to Common Shareholders-Diluted $ 1,651,365 $ 315,232 $ 621,714 $ 207,520 $ 155,138 $ (126,145) Reconciliation to Funds From Operations ("FFO") Net Income Attributable to Common Shareholders $ 1,635,023 $ 312,143 $ 615,310 $ 204,893 $ 153,044 $ (126,145) Adjustments: Depreciation and amortization 292, , , , , ,419 Joint Venture share of adjustments (44,427) (40,405) 13,336 (56,422) (19,987) 32,795 Gains on property sales, net of taxes and impairments (1,448,768) (159,979) (651,941) (167,947) (192,421) (13,811) Noncontrolling interest share of adjustments 12,003 (1,157) 3,265 (2,030) (2,645) (7,054) NAREIT FFO Attributable to Common Shareholders - Basic 446, , , , , ,204 Noncontrolling interest in income of unitholders 16,342 3,089 6,404 2,627 2,094 (2,273) Noncontrolling interest share of adjustments (12,003) 1,157 (3,265) 2,030 2,645 7,054 NAREIT FFO Attributable to Common Shareholders - Diluted $ 451,084 $ 432,666 $ 303,955 $ 367,768 $ 351,780 $ 269,985 Gain on land sales, including share of joint ventures (10,058) (13,040) (35,054) (10,441) (9,547) Gain on non-depreciable property sale - joint venture (119) (6,156) Loss on debt extinguishment, including share of joint ventures 26,103 35,526 85, ,433 Adjustments for redemption/repurchase of preferred shares 13,752 5,932 5,730 Land impairment charges, including joint ventures 3,622 14,299 41,637 33,700 3,777 Other income tax items (2,619) (641) (103) Overhead restructuring charges 7,422 2,664 Promote income (20,007) (26,299) Acquisition-related activity (7,176) 8,499 1,099 3,093 4,192 Core FFO Attributable to Common Shareholders - Diluted $ 448,006 $ 429,820 $ 412,172 $ 406,161 $ 363,827 $ 282,468 Adjusted FFO Core FFO - Diluted $ 448,006 $ 429,820 $ 412,172 $ 406,161 $ 363,827 $ 282,468 Adjustments: Straight-line rental income and expense (18,329) (17,107) (23,232) (22,170) (17,552) (24,759) Amortization of above/below market rents and concessions 1,469 1,526 3,659 5,348 9,054 8,867 Recurring capital expenditures (58,645) (60,894) (61,693) (81,447) (82,799) (61,240) Other 22,897 24,749 23,804 22,127 23,917 22,277 Adjusted FFO - Diluted $ 395,398 $ 378,094 $ 354,710 $ 330,019 $ 296,447 $ 227,613 Dividends Declared (Excluding Special Dividends) $ 277,000 $ 257,822 $ 241,293 $ 231,178 $ 223,286 $ 185,183 Special Dividends $ 252, ,000 $ $ 69,055 $ $ $ RECONCILIATION 48
49 SPNOI (unaudited and in thousands) Same Property Net Operating Income (Industrial Only) Three Months Ended September 30, 2017 September 30, 2016 Income from continuing operations before income taxes $ 42,368 $ 108,232 Share of same property NOI from unconsolidated joint ventures 3,824 4,094 Income and expense items not allocated to segments 85,605 14,717 Earnings from service operations (1,138) (2,169) Properties not included and other adjustments (23,000) (19,532) Same property NOI $ 107,659 $ 105,342 Percent Increase 2.2% Nine Months Ended September 30, 2017 September 30, 2016 Income from continuing operations before income taxes $ 235,812 $ 257,378 Share of same property NOI from unconsolidated joint ventures 11,297 12,454 Income and expense items not allocated to segments 150, ,000 Earnings from service operations (4,115) (8,216) Properties not included and other adjustments (69,971) (53,589) Same property NOI $ 323,087 $ 311,027 Percent Increase 3.9% Twelve Months Ended December 31, 2016 December 31, 2015 Income from continuing operations before income taxes $ 312,682 $ 185,277 Share of same property NOI from unconsolidated joint ventures 20,964 20,694 Income and expense items not allocated to segments 286, ,505 Earnings from service operations (8,343) (14,197) Properties not included and other adjustments (207,059) (221,362) Same property NOI $ 405,228 $ 379,917 Percent Increase 6.7% Twelve Months Ended December 31, 2015 December 31, 2014 Income from continuing operations before income taxes $ 185,277 $ 214,746 Share of same property NOI from unconsolidated joint ventures 21,910 20,667 Income and expense items not allocated to segments 409, ,204 Earnings from service operations (14,197) (24,469) Properties not included and other adjustments (248,121) (252,504) Same property NOI $ 354,374 $ 339,644 Percent Increase 4.3% Twelve Months Ended December 31, 2014 December 31, 2013 Income from continuing operations before income taxes $ 225,125 $ 56,320 Share of same property NOI from unconsolidated joint ventures 19,546 18,319 Income and expense items not allocated to segments 442, ,315 Earnings from service operations (24,469) (22,763) Properties not included and other adjustments (338,972) (303,517) Same property NOI $ 323,998 $ 310,674 Percent Increase 4.3% Twelve Months Ended December 31, 2013 December 31, 2012 Income (Loss) from continuing operations before income taxes $ 54,422 $ (80,538) Share of same property NOI from unconsolidated joint ventures 17,347 15,922 Income and expense items not allocated to segments 562, ,503 Earnings from service operations (22,763) (20,201) Properties not included and other adjustments (310,799) (252,807) Same property NOI $ 300,522 $ 290,879 Percent Increase 3.3% RECONCILIATION 49
Citigroup Global REIT CEO Conference March 5-6, 2018
 Citigroup Global REIT CEO Conference March 5-6, 2018 Forward-Looking Statement This slide presentation contains statements that constitute forward-looking statements within the meaning of the Securities
Table of Contents Page
 Table of Contents Page Page Company, Common Stock, and Earnings Call Information 1 Debt Information Definitions 2-3 Debt Maturities 20 Financial Information Unsecured Public Debt Covenants 21 Balance Sheets
FIRST INDUSTRIAL REALTY TRUST REPORTS FIRST QUARTER 2018 RESULTS
 First Industrial Realty Trust, Inc. 311 South Wacker Drive Suite 3900 Chicago, IL 60606 312/344-4300 FAX: 312/922-9851 MEDIA RELEASE FIRST INDUSTRIAL REALTY TRUST REPORTS FIRST QUARTER 2018 RESULTS Occupancy
MARCH 2019 CITI 2019 GLOBAL PROPERTY CEO CONFERENCE
 MARCH 2019 CITI 2019 GLOBAL PROPERTY CEO CONFERENCE SAFE HARBOR This presentation contains forward-looking statements within the meaning of Section 27A of the Securities Act of 1933, and Section 21E of
FIRST INDUSTRIAL REALTY TRUST REPORTS FIRST QUARTER 2019 RESULTS
 First Industrial Realty Trust, Inc. 1 North Wacker Drive Suite 4200 Chicago, IL 60606 312/344-4300 MEDIA RELEASE FIRST INDUSTRIAL REALTY TRUST REPORTS FIRST QUARTER 2019 RESULTS Signed 1.8 Million Square
Definitions. CPI is a lease in which base rent is adjusted based on changes in a consumer price index.
 Annualized Rental Income is rental revenue under our leases on Operating Properties on a straight-line basis, which includes the effect of rent escalations and any tenant concessions, such as free rent,
Industrial Income Trust Inc.
 UNITED STATES SECURITIES AND EXCHANGE COMMISSION Washington, D.C. 20549 FORM 8-K CURRENT REPORT Pursuant to Section 13 or 15(d) of The Securities Exchange Act of 1934 Date of Report (Date of earliest event
Supplemental Information. December 31, 2009
 Supplemental Information December 31, 2009 Page Page Company, Product and Investor Information 1-5 Tenant Industry Profile & Largest Tenants Summary 22 Financial Information Same Property Performance 23
DCT INDUSTRIAL TRUST REPORTS FOURTH QUARTER AND FULL-YEAR 2017 RESULTS. Net Earnings of $0.22 per Diluted Share in Q4; $1.11 per Diluted Share in 2017
 Press Release FOR IMMEDIATE RELEASE: DCT INDUSTRIAL TRUST REPORTS FOURTH QUARTER AND FULL-YEAR 2017 RESULTS Net Earnings of $0.22 per Diluted Share in Q4; $1.11 per Diluted Share in 2017 FFO, as adjusted,
Supplemental Information. September 30, 2010
 Supplemental Information September 30, 2010 Page Page Company, Product and Investor Information 1-5 Tenant Industry Profile & Largest Tenants Summary 19 Financial Information Same Property Performance
FOR IMMEDIATE RELEASE
 FOR IMMEDIATE RELEASE American Finance Trust Announces Second Quarter Operating Results New York, August 9, - American Finance Trust, Inc. (Nasdaq: AFIN) ( AFIN or the Company ), a real estate investment
NON-GAAP FINANCIAL MEASURES
 NON-GAAP FINANCIAL MEASURES Welltower Inc. (HCN) believes that revenues, net operating income from continuing operations (NOICO), net income and net income attributable to common stockholders (NICS), as
STAG INDUSTRIAL ANNOUNCES SECOND QUARTER 2018 RESULTS
 STAG INDUSTRIAL ANNOUNCES SECOND QUARTER 2018 RESULTS Boston, MA July 31, 2018 - STAG Industrial, Inc. (the Company ) (NYSE:STAG), today announced its financial and operating results for the quarter ended
Investor Presentation September 2017
 Investor Presentation September 2017 1 Table of Contents Company Overview & 2017 Guidance 3 6 Multifamily Fundamentals 7 11 Camden s Portfolio 12 22 Real Estate Transactions 23 29 Capital Structure & Liquidity
Investor Presentation November 2017
 Investor Presentation November 2017 1 Table of Contents Company Overview & 2017 Highlights 3 6 Multifamily Fundamentals 7 11 Camden s Portfolio 12 22 Real Estate Transactions 23 29 Capital Structure &
Clipper Realty Inc. Announces Third Quarter 2018 Results Reports Record Revenues, Income From Operations and Adjusted Funds From Operations
 Clipper Realty Inc. Announces Third Quarter 2018 Results Reports Record Revenues, Income From Operations and Adjusted Funds From Operations NEW YORK, November 1, 2018 /Business Wire/ -- Clipper Realty
Achieved record annual revenues of $110.0 million for 2018, representing an increase of 5.8%
 Clipper Realty Inc. Announces Fourth Quarter and Full-Year 2018 Results Reports Record Annual Revenues, Record Annual Income from Operations and Record Quarterly and Annual Adjusted Funds from Operations
AGREE REALTY CORPORATION REPORTS OPERATING RESULTS FOR THE SECOND QUARTER 2015
 FOR IMMEDIATE RELEASE CONTACT: Joey Agree Chief Executive Officer (248) 737-4190 AGREE REALTY CORPORATION REPORTS OPERATING RESULTS FOR THE SECOND QUARTER 2015 BLOOMFIELD HILLS, MI (July 27, 2015) - Agree
WP Glimcher Reports Second Quarter 2016 Results
 NEWS RELEASE WP Glimcher Reports Second Quarter 2016 Results COLUMBUS, OH August 3, 2016 WP Glimcher Inc. (NYSE: WPG) today reported financial and operating results for the second quarter ended June 30,
Carter Validus Mission Critical REIT, Inc. Reports Second Quarter 2016 Results
 Carter Validus Mission Critical REIT, Inc. Reports Second Quarter 2016 Results TAMPA, FL (September 1, 2016) - Carter Validus Mission Critical REIT, Inc. (the Company ) announced today its operating results
MARCH 2018 CITI 2018 GLOBAL PROPERTY CEO CONFERENCE
 MARCH 2018 CITI 2018 GLOBAL PROPERTY CEO CONFERENCE SAFE HARBOR This presentation contains forward-looking statements within the meaning of Section 27A of the Securities Act of 1933, and Section 21E of
Investor Presentation. First Quarter 2015
 Investor Presentation First Quarter 2015 1 CAUTIONARY STATEMENTS Today s session and our answers to questions contain statements that constitute forward-looking statements about expected future events
PS Business Parks, Inc. Reports Results for the Quarter Ended March 31, 2017
 News Release PS Business Parks, Inc. 701 Western Avenue Glendale, CA 91201-2349 psbusinessparks.com For Release: Immediately Date: April 25, 2017 Contact: Edward A. Stokx (818) 244-8080, Ext. 1649 PS Business
2014 Operating and Financial Highlights
 FINANCIAL HIGHLIGHTS > 2014 Operating and Financial Highlights Operating Results Executed 203 leasing transactions representing approximately 2.8 million square feet, the highest gross leasing volume in
Extra Space Storage Inc. Reports 2018 Fourth Quarter and Year-End Results
 Extra Space Storage Inc. Reports 2018 Fourth Quarter and Year-End Results February 20, 2019 SALT LAKE CITY, Feb. 20, 2019 /PRNewswire/ -- Extra Space Storage Inc. (NYSE: EXR) (the "Company"), a leading
Retail Opportunity Investments Corp. Reports Strong First Quarter Results & Raises FFO Guidance
 April 27, 2016 Retail Opportunity Investments Corp. Reports Strong First Quarter Results & Raises FFO Guidance $17.4% increase in FFO Per Diluted Share 7.6% Increase in Same-Center Cash Net Operating Income
Industrial Income Trust Inc.
 UNITED STATES SECURITIES AND EXCHANGE COMMISSION Washington, D.C. 20549 FORM 8-K CURRENT REPORT Pursuant to Section 13 or 15(d) of The Securities Exchange Act of 1934 Date of Report (Date of earliest event
NEWS RELEASE For immediate release
 NEWS RELEASE For immediate release Laura Clark 904 598 7831 LauraClark@RegencyCenters.com Regency Centers Reports Second Quarter 2018 Results JACKSONVILLE, FL. (August 2, 2018) Regency Centers Corporation
Extra Space Storage Inc. Reports 2017 Fourth Quarter and Year-End Results
 Extra Space Storage Inc. Reports 2017 Fourth Quarter and Year-End Results February 20, 2018 SALT LAKE CITY, Feb. 20, 2018 /PRNewswire/ -- Extra Space Storage Inc. (NYSE: EXR) (the "Company"), a leading
SUPPLEMENTAL INFORMATION
 SUPPLEMENTAL INFORMATION UNAUDITED FOURTH QUARTER 2018 STAG SUPPLEMENTAL INFORMATION FOURTH QUARTER 2018 1 Forward-Looking Statements This supplemental information package contains certain forward-looking
NEWS RELEASE For immediate release
 NEWS RELEASE For immediate release Laura Clark 904 598 7831 LauraClark@RegencyCenters.com Regency Centers Reports Third Quarter 2018 Results Company Increases 2018 Guidance JACKSONVILLE, FL. (October 25,
NAREIT Presentation June George Ellison, CEO Robin Lowe, CFO. welcome. home Front Yard Residential. All rights reserved.
 NAREIT Presentation June 2018 George Ellison, CEO Robin Lowe, CFO welcome home. 2018 Front Yard Residential. All rights reserved. 1 Forward-looking Statements This presentation contains forward-looking
SITE CENTERS NOVEMBER 2018
 SITE CENTERS NOVEMBER 2018 JOINT VENTURE WITH CHINESE INSTITUTIONAL INVESTORS $607MM JOINT VENTURE ALLOWS SITE CENTERS TO ACCELERATE OPPORTUNISTIC INVESTING AND FURTHER IMPROVE THE BALANCE SHEET Dividend
Senior Housing Properties Trust Announces Fourth Quarter and Year End 2017 Results
 Senior Housing Properties Trust NEWS RELEASE Senior Housing Properties Trust Announces Fourth Quarter and Year End 2017 Results 2/27/2018 NEWTON, Mass.--(BUSINESS WIRE)-- Senior Housing Properties Trust
FOR IMMEDIATE RELEASE
 FOR IMMEDIATE RELEASE GLOBAL NET LEASE ANNOUNCES OPERATING RESULTS FOR SECOND QUARTER 2018 New York, August 8, 2018 Global Net Lease, Inc. (NYSE: GNL) ( GNL or the Company ), a real estate investment trust
Glendale, California - PS Business Parks, Inc. (AMEX: PSB), reported operating results for the fourth quarter and the year ending December 31, 2001.
, reported operating results for the fourth quarter and the year ending December 31, 2001.") News Release PS Business Parks, Inc. 701 Western Avenue P.O. Box 25050 Glendale, CA 91221-5050 www.psbusinessparks.com For Release: Immediately Date: January 30, 2002 Contact: Mr. Jack Corrigan (818) 244-8080,
News Release PS Business Parks, Inc. 701 Western Avenue P.O. Box 25050 Glendale, CA 91221-5050 www.psbusinessparks.com For Release: Immediately Date: January 30, 2002 Contact: Mr. Jack Corrigan (818) 244-8080,
PS Business Parks, Inc. Reports Results for the Quarter Ended September 30, 2018
 News Release PS Business Parks, Inc. 701 Western Avenue Glendale, CA 91201-2349 psbusinessparks.com For Release: Immediately Date: October 23, 2018 Contact: Jeff Hedges (818) 244-8080, Ext. 1649 PS Business
EastGroup Properties Announces Second Quarter 2018 Results
 EastGroup Properties Announces Second Quarter 2018 Results Contact: Marshall Loeb, President and CEO Brent Wood, CFO (601) 354-3555 Net Income Attributable to Common Stockholders of $.52 Per Share Compared
RESI Update 4 th Quarter 2016
 RESI Update 4 th Quarter 2016 Supplemental Investor Information George Ellison, CEO Robin Lowe, CFO 2017 Altisource Residential Corporation. All rights reserved. Forward Looking Statements This presentation
PS Business Parks, Inc. Reports Results for the Quarter and Year Ended December 31, 2018
 News Release PS Business Parks, Inc. 701 Western Avenue Glendale, CA 91201-2349 psbusinessparks.com For Release: Immediately Date: February 20, 2019 Contact: Jeff Hedges (818) 244-8080, Ext. 1649 PS Business
Highwoods Reports Third Quarter 2015 Results
 FOR IMMEDIATE RELEASE Ref: 15-22 Contact: Mark Mulhern Senior Vice President and Chief Financial Officer 919-875-6682 Reports Third Quarter 2015 Results $0.77 FFO per Share (Including $0.01 per Share of
FOR IMMEDIATE RELEASE
 FOR IMMEDIATE RELEASE GLOBAL NET LEASE ANNOUNCES OPERATING RESULTS FOR THIRD QUARTER 2018 New York, November 7, 2018 Global Net Lease, Inc. (NYSE: GNL) ( GNL or the Company ), a real estate investment
NEWS RELEASE For immediate release
 NEWS RELEASE For immediate release Laura Clark 904 598 7831 LauraClark@RegencyCenters.com Regency Centers Reports First Quarter 2018 Results JACKSONVILLE, FL. (April 30, 2018) Regency Centers Corporation
MANAGEMENT PRESENTATION. November 7, 2017
 MANAGEMENT PRESENTATION November 7, 2017 DISCLAIMER This presentation includes time-sensitive information that may be accurate only as of today s date, November 7, 2017. Estimates of future net income
MARGARITAVILLE RESORT CASINO TRANSACTION OVERVIEW JUNE 19, 2018
 MARGARITAVILLE RESORT CASINO TRANSACTION OVERVIEW JUNE 19, 2018 DISCLAIMERS Forward-Looking Statements This presentation contains forward-looking statements within the meaning of the federal securities
Naturally Occurring Affordable Housing
 Naturally Occurring Affordable Housing NAAHL Annual Conference December 1, 2016 page 1 Slicing And Dicing Rental Housing U.S. Rental Housing Inventory By Units Rent Subsidized 3.3 Million 8% Market Rate
Public Storage Reports Results for the Quarter Ended March 31, 2017
 News Release Public Storage 701 Western Avenue Glendale, CA 91201-2349 www.publicstorage.com For Release Immediately Date April 26, 2017 Contact Clemente Teng (818) 244-8080, Ext. 1141 Public Storage Reports
Highwoods Reports Third Quarter 2018 Results
 FOR IMMEDIATE RELEASE Ref: 18-18 Contact: Brendan Maiorana Senior Vice President, Finance and Investor Relations 919-431-1529 Highwoods Reports Third Quarter 2018 Results $0.32 Net Income per Share $0.86
Front Yard Residential Corporation Announces Transformative Acquisition and Reports Second Quarter 2018 Results
 Front Yard Residential Corporation Announces Transformative Acquisition and Reports Second Quarter 2018 Results August 9, 2018 CHRISTIANSTED, U.S. Virgin Islands, Aug. 09, 2018 (GLOBE NEWSWIRE) -- Front
PS Business Parks, Inc. Reports Results for the Quarter Ended March 31, 2018
 News Release PS Business Parks, Inc. 701 Western Avenue Glendale, CA 91201-2349 psbusinessparks.com For Release: Immediately Date: April 24, 2018 Contact: Maria R. Hawthorne (818) 244-8080, Ext. 1370 PS
Front Yard Residential Corporation Reports Third Quarter 2018 Results
 Front Yard Residential Corporation Reports Third Quarter 2018 Results November 7, 2018 CHRISTIANSTED, U.S. Virgin Islands, Nov. 07, 2018 (GLOBE NEWSWIRE) -- Front Yard Residential Corporation ( Front Yard
FIRST QUARTER Supplemental Operating and Financial Data. Camden Sotelo - Tempe, AZ
 FIRST QUARTER 2014 Supplemental Operating and Financial Data Camden Sotelo - Tempe, AZ Camden Las Olas - Ft. Lauderdale, FL Year Built - 2004 420 Apartment Homes 97% Average 1st Quarter 2014 Occupancy
Highwoods Reports Third Quarter 2017 Results
 FOR IMMEDIATE RELEASE Ref: 17-20 Contact: Brendan Maiorana Senior Vice President, Finance and Investor Relations 919-431-1529 Highwoods Reports Third Quarter 2017 Results $0.55 Net Income per Share $0.86
FOR IMMEDIATE RELEASE AUGUST 2, 2018 ARTIS REAL ESTATE INVESTMENT TRUST RELEASES SECOND QUARTER RESULTS
 FOR IMMEDIATE RELEASE AUGUST 2, 2018 ARTIS REAL ESTATE INVESTMENT TRUST RELEASES SECOND QUARTER RESULTS Today Artis Real Estate Investment Trust ( Artis or the "REIT") issued its financial results and
ALEXANDER & BALDWIN. May 8, 2018
 1 ALEXANDER & BALDWIN F I R S T Q U A R T E R 2 0 1 8 E A R N I N G S P R E S E N T A T I O N May 8, 2018 SAFE HARBOR STATEMENT 2 Statements in this call and presentation that are not historical facts
January 23, NEW YORK--(BUSINESS WIRE)--Jan. 23, SL Green Realty Corp. (NYSE: SLG): Financial and Operating Highlights
--Jan. 23, SL Green Realty Corp. (NYSE: SLG): Financial and Operating Highlights") SL Green Realty Corp. Reports Fourth Quarter Loss Per Share of $0.73; Full Year 2018 Earnings Per Share of $2.67; Fourth Quarter and Full Year 2018 FFO of $1.61 and $6.62 Per Share January 23, 2019 NEW
SL Green Realty Corp. Reports Fourth Quarter Loss Per Share of $0.73; Full Year 2018 Earnings Per Share of $2.67; Fourth Quarter and Full Year 2018 FFO of $1.61 and $6.62 Per Share January 23, 2019 NEW
Alexander & Baldwin, Inc. PREMIER HAWAII REAL ESTATE COMPANY
 1 Alexander & Baldwin, Inc. PREMIER HAWAII REAL ESTATE COMPANY 1Q17 Earnings Call May 4, 2017 Disclosure 2 Statements in this call and presentation that are not historical facts, including potential benefits,
-- Expanding relationship with Brookdale by creating a $1.2 billion CCRC joint venture and amending existing Emeritus leases
 Page 1 of 11 Print Page Close Window News Release HCP Announces Results for Quarter Ended March 31, 2014 HIGHLIGHTS -- FFO per share was $0.75; FAD per share was $0.63; and EPS was $0.56 -- Achieved year-over-year
CHOICE PROPERTIES REAL ESTATE INVESTMENT TRUST. Management s Discussion and Analysis of Financial Condition and Results of Operations
 CHOICE PROPERTIES REAL ESTATE INVESTMENT TRUST Management s Discussion and Analysis of Financial Condition and Results of Operations (in thousands of Canadian dollars except where otherwise indicated)
Investor Presentation December 2017
 Investor Presentation December 2017 Cautionary Statement This presentation includes statements concerning our expectations, beliefs, plans, objectives, goals, strategies, future events or performance and
HCP 3.0 Post-Spin Outlook Presentation. Senior Housing Life Science Medical Office
 HCP 3.0 Post-Spin Outlook Presentation Senior Housing Life Science Medical Office November 1, 2016 HCP s Near-Term Strategic Priorities Execute the Spin-off of the HCR ManorCare Portfolio Completed on
Highwoods Properties Reports Fourth Quarter and Full Year 2011 Results
 FOR IMMEDIATE RELEASE Ref: 12-06 Contact: Tabitha Zane Vice President, Investor Relations 919-431-1529 Highwoods Properties Reports Fourth Quarter and Full Year 2011 Results $0.70 FFO per Share for Fourth
ALEXANDER & BALDWIN, INC.
 Artist Rendering ALEXANDER & BALDWIN, INC. Third Quarter 2016 Operating & Financial Results October 27, 2016 DISCLOSURE Statements in this call and presentation that are not historical facts, including
Investor Presentation September 2014
 Investor Presentation September 2014 Forward Looking Statements This presentation may contain various forward-looking statements. You can identify forward-looking statements by the use of forward-looking
Highwoods Reports Second Quarter 2018 Results
 FOR IMMEDIATE RELEASE Ref: 18-14 Contact: Brendan Maiorana Senior Vice President, Finance and Investor Relations 919-431-1529 Highwoods Reports Second Quarter 2018 Results $0.49 Net Income per Share $0.87
3rd Quarter Quarterly Supplemental
 Quarterly Supplemental 3rd Quarter 2018 Mkt at Springwoods Village Spring, TX Calhoun Commons Minneapolis, MN Mellody Farm Vernon Hills, IL El Camino Shopping Center Woodland Hills, CA Mellody Farm Vernon
General Growth Properties, Inc.
 General Growth Properties, Inc. Supplemental Financial Information For the Three and Nine Months Ended September 30, 2009 This presentation contains forward-looking statements. Actual results may differ
4th Quarter Quarterly Supplemental
 Quarterly Supplemental 4th Quarter 2017 The Hub Hillcrest Market San Diego, CA Aventura Shopping Center Aventura, FL 4S Commons Town San Diego, CA Investor Relations irinfo@regencycenters.com One Independent
Q2 18 Earnings Results
 July 26, 2018 Q2 18 Earnings Results (NYSE: SAFE) Forward-Looking Statements and Other Matters This release may contain forward-looking statements. All statements other than statements of historical fact
4th Quarter Quarterly Supplemental
 Quarterly Supplemental 4th Quarter 2018 Ballard Blocks Seattle, WA 4S Commons Town Center San Diego, CA Nocatee Town Center Ponte Vedra, FL Investor Relations irinfo@regencycenters.com One Independent
Supplemental Information September 30, 2017
 Conference Call 888-632-3384 ID - EastGroup October 20, 2017 11:00 a.m. Eastern Daylight Time webcast available at www.eastgroup.net Supplemental Information September 30, 2017 Steele Creek Commerce Park
Investor Presentation 2007
 Investor Presentation 2007 1 Forward Looking Statements This presentation contains forward-looking statements within the meaning of the federal securities laws. These statements reflect management s current
NEWS RELEASE For immediate release
 NEWS RELEASE For immediate release Laura Clark 904 598 7831 LauraClark@RegencyCenters.com Regency Centers Updates 2017 and Introduces 2018 Earnings Guidance JACKSONVILLE, Fla. (January 11, 2018) Regency
Supplemental Information December 31, 2017
 Conference Call 888-632-3384 ID - EastGroup February 1, 2018 11:00 a.m. Eastern Standard Time webcast available at www.eastgroup.net Supplemental Information December 31, 2017 Alamo Ridge Business Park
PRIMARIS RETAIL REIT Announces Third Quarter Results
 PRIMARIS RETAIL REIT Announces Third Quarter Results Toronto (Ontario) November 8, 2011 Primaris Retail REIT (TSX:PMZ.UN) is pleased to report positive operating results for the third quarter of 2011.
AGREE REALTY CORPORATION REPORTS OPERATING RESULTS FOR THE FOURTH QUARTER AND FULL YEAR 2014
 FOR IMMEDIATE RELEASE CONTACT: Brian Dickman Chief Financial Officer (248) 737-4190 AGREE REALTY CORPORATION REPORTS OPERATING RESULTS FOR THE FOURTH QUARTER AND FULL YEAR 2014 BLOOMFIELD HILLS, MI (February
FOR IMMEDIATE RELEASE CONTACT: John Bucksbaum 312/ General Growth Properties, Inc. Reports Operating Results for the Third Quarter 2005
 News Release General Growth Properties, Inc. 110 North Wacker Drive Chicago, IL 60606 (312) 960-5000 FAX (312) 960-5475 FOR IMMEDIATE RELEASE CONTACT: John Bucksbaum 312/960-5005 Bernie Freibaum 312/960-5252
Q3 18 Earnings Results
 October 25, 2018 Q3 18 Earnings Results (NYSE: SAFE) Forward-Looking Statements and Other Matters This release may contain forward-looking statements. All statements other than statements of historical
... ARMADA HOFFLER PROPERTIES REPORTS FOURTH QUARTER 2013 RESULTS
 PRESS RELEASE.......................................... ARMADA HOFFLER PROPERTIES REPORTS FOURTH QUARTER 2013 RESULTS Core FFO of $7.1 Million, $0.22 Per Diluted Share Operating Property Portfolio at 94.4%
Positioned for Performance. j u n e Fine Arts Building Berkeley, CA
 Positioned for Performance j u n e 2009 Fine Arts Building Berkeley, CA Trump Place New York, NY 180 Riverside Equity Residential has a portfolio of high-quality assets focused in high-growth markets where
FOR IMMEDIATE RELEASE: Equity One Reports Fourth Quarter and Year End 2014 Operating Results
 Equity One, Inc. For additional information: 410 Park Avenue, Suite 1220 Mark Langer, EVP and New York, NY 10022 Chief Financial Officer 212-796-1760 FOR IMMEDIATE RELEASE: Equity One Reports Fourth Quarter
Taubman Centers, Inc. Taubman/Starwood Capital Group Transaction
 Taubman Centers, Inc. Taubman/Starwood Capital Group Transaction June 18, 2014 Forward Looking Language and Use of Non-GAAP Measures For ease of use, references in this presentation to Taubman Centers,
Listed on the New York Stock Exchange (KIM)
") Kimco Realty Reports Third Quarter 2017 Results Solid Operating Performance Leads Board to Approve Increase in Common Stock Dividend; Company Adds a New Signature Series Asset with the Acquisition of Whittwood
Kimco Realty Reports Third Quarter 2017 Results Solid Operating Performance Leads Board to Approve Increase in Common Stock Dividend; Company Adds a New Signature Series Asset with the Acquisition of Whittwood
Select Income REIT Announces Third Quarter 2017 Results
 FOR IMMEDIATE RELEASE Contact: Christopher Ranjitkar, Director, Investor Relations (617) 796-8320 Select Income REIT Announces Third Quarter 2017 Results Third Quarter Net Income of $0.35 Per Share Third
GREEN BRICK PARTNERS INVESTOR CONFERENCE PRESENTATION NOVEMBER 2017
 GREEN BRICK PARTNERS INVESTOR CONFERENCE PRESENTATION NOVEMBER 2017 1 FORWARD LOOKING STATEMENTS This presentation and the oral statements made by representatives of the Company during the course of this
UNITED STATES SECURITIES AND EXCHANGE COMMISSION Washington, D.C FORM 10-Q
 UNITED STATES SECURITIES AND EXCHANGE COMMISSION Washington, D.C. 20549 FORM 10-Q ý QUARTERLY REPORT PURSUANT TO SECTION 13 OR 15(d) OF THE SECURITIES EXCHANGE ACT OF 1934 For the Quarterly Period Ended
Our Objectives. Our Strategy
 2005 Third Quarter Report» Management s Discussion and Analysis Management s Discussion and Analysis This Management s Discussion and Analysis has been dated as at November 3, 2005. All dollar amounts
Extra Space Storage Inc. Reports 2017 Third Quarter Results
 Extra Space Storage Inc. Reports 2017 Third Quarter Results November 1, 2017 SALT LAKE CITY, Nov. 1, 2017 /PRNewswire/ -- Extra Space Storage Inc. (NYSE: EXR) (the "Company"), a leading owner and operator
News Release. PS Business Parks, Inc. 701 Western Avenue P.O. Box Glendale, CA
 News Release PS Business Parks, Inc. 701 Western Avenue P.O. Box 25050 Glendale, CA 91221-5050 www.psbusinessparks.com For Release: Immediately Date: May 3, 2001 Contact: Mr. Jack Corrigan (818) 244-8080,
2nd Quarter Quarterly Supplemental
 Quarterly Supplemental 2nd Quarter 2018 Roosevelt Square Seattle, WA Cameron Village Raleigh, NC Grand Ridge Plaza Issaquah, WA Village at Tustin Legacy Tustin, CA Shops at Erwin Mill Durham, NC Investor
DREAM GLOBAL ANNOUNCES FOURTH QUARTER RESULTS, 24% ANNUAL NET ASSET VALUE GROWTH AND OVER 6% FOURTH QUARTER COMPARATIVE NOI GROWTH
 DREAM GLOBAL ANNOUNCES FOURTH QUARTER RESULTS, 24% ANNUAL NET ASSET VALUE GROWTH AND OVER 6% FOURTH QUARTER COMPARATIVE NOI GROWTH TORONTO, FEBRUARY 20, 2019 DREAM GLOBAL REIT (TSX:DRG.UN, FRA:DRG) (or
INVESTOR PRESENTATION MAY 2013
 INVESTOR PRESENTATION MAY 2013 Forward-Looking Statements This presentation includes forward-looking statements. These statements are subject to a number of risks, uncertainties and other factors that
SEC Reg. G Compliance - Non-GAAP Financial Measures
 SEC Reg. G Compliance - Non-GAAP Financial Measures Funds From Operations (FFO) Reconciliation, Including Non-Cash Items 1 ($ in 000s, except per share amounts) Tentative Estimates Preliminary and Midpoint
FOURTH QUARTER Supplemental Operating and Financial Data
 FOURTH QUARTER 2012 Supplemental Operating and Financial Data Camden Belleview Station - Denver, CO Year Built -2009 270 Apartment Homes Acquired December 20, 2012 Camden Property Trust Three Greenway
Conference Call ID EastGroup October 19, :00 a.m. Eastern Time webcast available at EastGroup.net
 Table of Contents 2018 THIRD QUARTER Conference Call 877-876-9176 ID EastGroup October 19, 2018 11:00 a.m. Eastern Time webcast available at EastGroup.net Supplemental Information 2018 400 W. Parkway Place,
AMH Corporate Update 2
 June 2014 Disclaimer The information in this presentation has been prepared solely for informational purposes. We, AMH, AH4R, the Company, the REIT, our and us refer to American Homes 4 Rent, a Maryland
Great Elm Capital Group, Inc. An Introduction to the Fort Myers Transaction & GEC s Real Estate Strategy
 Great Elm Capital Group, Inc. An Introduction to the Fort Myers Transaction & GEC s Real Estate Strategy March 6, 2018 2018 Great Elm Capital Group, Inc. Disclaimer Statements in this presentation that
STAG IS AN OWNER AND OPERATOR OF INDUSTRIAL REAL ESTATE
 INVESTOR PRESENTATION SUMMER 2018 OVERVIEW STAG IS AN OWNER AND OPERATOR OF INDUSTRIAL REAL ESTATE Focused on the acquisition and operation of single-tenant industrial properties throughout the US DIVERSE
Fourth Quarter & Full Year 2013 Operating & Financial Results February 20, 2014
 Fourth Quarter & Full Year 2013 Operating & Financial Results February 20, 2014 DISCLOSURE Statements in this presentation that are not historical facts are forward-looking statements, within the meaning
Comstock Holding Companies, Inc. NASDAQ: CHCI. New Business Model Update June 12, 2018
 NASDAQ: CHCI New Business Model Update June 12, 2018 DISCLAIMER This release includes "forward looking" statements that are made pursuant to the safe harbor provisions of the Private Securities Litigation