STAG IS AN OWNER AND OPERATOR OF INDUSTRIAL REAL ESTATE
|
|
|
- Paul Porter
- 5 years ago
- Views:
Transcription

1 INVESTOR PRESENTATION SUMMER 2018
2 OVERVIEW STAG IS AN OWNER AND OPERATOR OF INDUSTRIAL REAL ESTATE Focused on the acquisition and operation of single-tenant industrial properties throughout the US DIVERSE PORTFOLIO (1) Portfolio is broadly diversified across geography, industry, tenancy and lease term buildings across 37 states tenants with a well-laddered lease maturity schedule and a weighted average lease term of 4.7 years - Warehouse, distribution and light manufacturing facilities ACTIVE ASSET MANAGEMENT PLATFORM (1) Achieved approximately 70% tenant retention since IPO through active tenant relationship management Leased ~37 million square feet since IPO Active in-house engineering expertise with a dedicated Capital Projects Group - Manage all capital expenditure projects - Oversee building expansion projects nationwide - Identify and execute asset repositioning opportunities REAL ESTATE PLATFORM FOCUSED ON THE ACQUISITION AND OPERATION OF SINGLE-TENANT INDUSTRIAL REAL ESTATE (1) Data as of Q
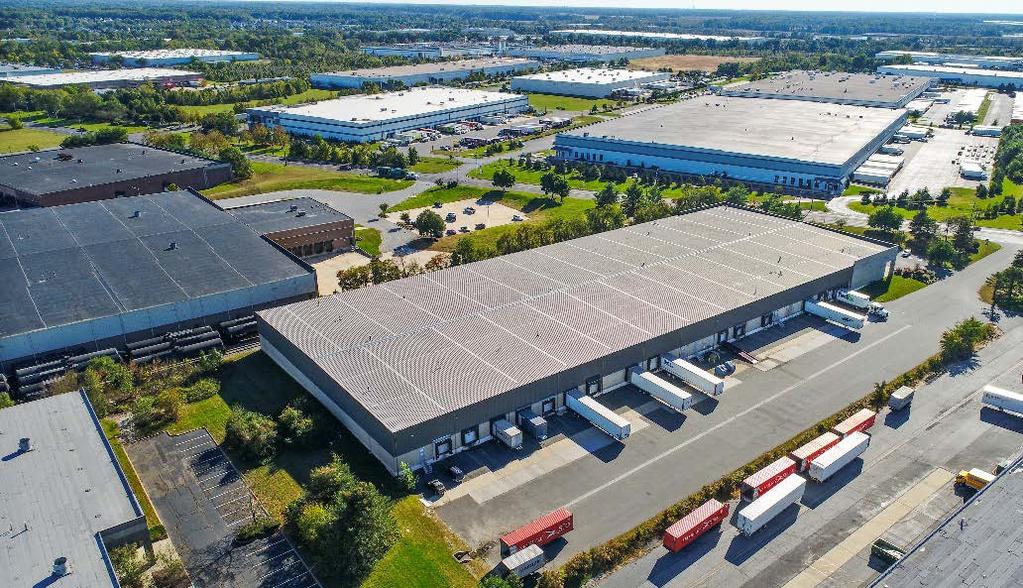
3 RECENT ACQUISITIONS 2
4 INVESTMENT APPROACH INDIVIDUAL SINGLE-TENANT PROPERTIES ARE PERSISTENTLY MISPRICED Binary risk of single-tenancy creates higher potential volatility in cash flows compared to multi-tenancy - Single-tenant buildings are either fully occupied or completely vacant - Investors apply higher risk premiums/discount rates when evaluating individual single-tenant assets The aggregation of binary risk cash flows with an emphasis on portfolio construction can mitigate correlation and the binary risk, creating cash flows with a less volatile profile - Investors apply relatively lower risk premiums/discount rates to relatively less volatile cash flows INDUSTRIAL REAL ESTATE PROVIDES THE BEST OPPORTUNITY U.S. industrial real estate features attractive characteristics for the aggregation of a portfolio of binary risk cash flows - Large, stable and developed market with ~$1 trillion of fungible assets - Highly fragmented ownership with the largest participant owning approximately 2% of stock - Smaller average investment size provides granular acquisition opportunity ($5 - $15 million average asset size) - Assets typically have relatively low individual correlation - Low capex and high retention relative to other real estate asset classes (1) ATTRACTIVE OPPORTUNITY SET TO CREATE VALUE THROUGH THOUGHTFUL PORTFOLIO CONSTRUCTION (1) Source: CBRE-EA Industrial Outlook 3
5 TARGET MARKET SIZE LARGE TARGET MARKET U.S. industrial market is over $1 trillion in total size (1) STAG s Target Assets: single-tenant industrial properties that meet our investment criteria $1 Trillion Total Industrial Market (1) Estimated $500 Billion Single-Tenant Asset Universe (1) $250 Billion Target Asset Universe (1) STAG s Share of Target Asset Universe is ~1% LARGE SCALE OPPORTUNITY (1) Per CoStar, RCA and STAG management s estimates using publicly available data 4
6 INDUSTRIAL MARKET DYNAMICS WAREHOUSE OCCUPANCY (1) 94% 92% 90% Historical Primary and Secondary market occupancy levels are similar 88% 86% 84% 82% 80% "Super" Primary Primary Secondary Super Primary markets historically operate at an occupancy level above both Primary and Secondary markets Mar-08 Mar-09 Mar-10 Mar-11 Mar-12 Mar-13 Mar-14 Mar-15 Mar-16 Mar-17 Mar-18 WAREHOUSE RENT GROWTH (INDEX: 2005 = 1) (1) Secondary market rent growth has performed in-line with Primary market rent growth over the past ten years Mar-08 Mar-09 "Super" Primary Primary Secondary Mar-10 Mar-11 Mar-12 Mar-13 Mar-14 Mar-15 Mar-16 Mar-17 Mar-18 Super Primary market rent growth has displayed greater volatility over the past ten years compared to Primary and Secondary markets DATA DOES NOT SUPPORT CONVENTIONAL WISDOM (1) Source: CBRE; Super Primary markets include Chicago, Dallas, Los Angeles, Miami, Northern New Jersey, and Riverside; Primary markets contain greater than 200M SF; Secondary markets contain 25M 200M SF 5
7 DISCERNING & FINDING RELATIVE VALUE Probabilistic Risk Assessment Model allows for evaluation of cash flows on a risk-neutral basis SELECTIVITY & DISCIPLINE 1,250+ TRANSACTIONS PASS INITIAL TRIAGE All markets All credit profiles All lease terms 364 UNDERWRITTEN 42 CLOSED In 2017, acquired $613 million (24% growth) (1) of industrial real estate at a weighted average Capitalization Rate of 7.4% PLATFORM DESIGNED TO STREAMLINE ACQUISITION PROCESS WHILE EMPHASIZING INVESTMENT DISCIPLINE (1) 2017 acquisition volume compared to Real Estate Cost Basis at Q
8 AGGREGATION REDUCES VOLATILITY FREE CASH FLOW EXAMPLE SINGLE ASSET PORTFOLIO ENTERPRISE $1,500 $1,250 $1,000 $750 $500 $250 $0 $60,000 $50,000 $40,000 $30,000 $20,000 $10,000 $0 $500,000 $400,000 $300,000 $200,000 $100,000 $0 SINGLE TENANT INDUSTRIAL ASSET ACQUISITION CASH FLOW ($000s) PORTFOLIO CASH FLOW ACQUISITIONS ($000s) COMPANY CASH FLOW ($000s) (1) EXTERNAL GROWTH INTERNAL GROWTH DIVERSE PORTFOLIOS ARE VALUED GREATER THAN INDIVIDUAL ASSETS (1) Illustrates cash flow from acquiring the 2017 portfolio every year for ten years, and then operating the aggregated portfolio (without further acquisitions) for the next ten years 7


 Number of Buildings 6 341 Square Feet 1.6 million 68.")
9 SOUTHEAST PORTFOLIO SALE ATLANTA - FOUR BUILDINGS / 981K SF CHARLOTTE - TWO BUILDINGS / 589K SF TOTAL - SIX BUILDINGS / 1.6M SF On November 14 th, 2016 STAG sold a Southeast Portfolio of six industrial buildings located in Atlanta and Charlotte - Gross proceeds of $81 million / $51.61 PSF - 6.9% Capitalization Rate - Unlevered IRR of 15% These assets were acquired individually at a weighted average Capitalization Rate of 9.2% Profile of the Southeast Portfolio assets is consistent with the characteristics of the broader STAG Operating Portfolio CHARACTERISTICS SOUTHEAST PORTFOLIO REIT OPERATING PORTFOLIO (2) Number of Buildings Square Feet 1.6 million 68.5 million Average Building Size 261,593 SF 200,984 SF WA Lease Term 4.2 years (1) 4.7 years Average Clear Height (1) Reflects exercising of lease termination option for one tenant (2) As of Q1 2018; as defined in supplemental reporting package 8


10 OPPORTUNISTIC DISPOSITIONS LOCATION SOLD BUILDING SIZE (SF) PURCHASE PRICE ($) DISPOSITION PROCEEDS ($) PURCHASE PRICE (PSF) DISPOSITION PROCEEDS (PSF) UNLEVERED IRR Gresham, OR Q ,690 SF $14.3 million $22.3 million $34 PSF $53 PSF 17% Orangeburg, SC Q ,000 SF $4.6 million $8.8 million $14 PSF $28 PSF 38% New Berlin, WI Q ,665 SF $4.3 million $5.9 million $53 PSF $73 PSF 22% Georgetown, KY Q ,680 SF $3.8 million $5.2 million $40 PSF $54 PSF 13% Pittsburgh, PA Q ,065 SF $7.4 million $9.3 million $50 PSF $63 PSF 10% Chicago, IL Q ,380 SF $4.9 million $5.8 million $56 PSF $66 PSF 11% Piscataway, NJ Q ,000 SF $10.3 million $17.8 million $46 PSF $74 PSF 18% Springfield, OH Q ,500 SF $9.7 million $11.0 million $28 PSF $31 PSF 11% Charlotte, NC Q ,025 SF $20.1 million $31.9 million $41 PSF $65 PSF 14% Longmont, CO Q ,611 SF $13.9 million $18.5 million $87 PSF $116 PSF 12% GRESHAM, OR ORANGEBURG, SC NEW BERLIN, WI COMBINING A RELATIVE VALUE ACQUISITION STRATEGY AND AN INSTITUTIONAL REAL ESTATE OPERATING PLATFORM CREATES VALUE 9
11 PORTFOLIO DIVERSIFICATION # TENANT ABR % (1) 1 General Services Admin. 2.5% 2 XPO Logistics 2.0% 3 Deckers Outdoor 1.6% 4 Solo Cup 1.4% 5 TriMas Corporation 1.3% 6 DHL 1.1% 7 FedEx 1.0% 8 Generation Brands 1.0% 9 Carolina Beverage Group 0.9% 10 Emerson Electric 0.9% Other 86.3% # INDUSTRY ABR % (1) 1 Capital Goods 13.6% 2 Automobiles & Components 12.9% 3 Materials 11.6% 4 Transportation 9.9% Consumer Durables & Apparel Food, Beverage & Tobacco Commercial & Prof. Services 9.7% 8.5% 7.4% 8 Retailing 5.4% 9 Household & Personal Products 5.0% 10 Food & Staples Retailing 3.7% Other 12.3% FURTHER DIVERSITY IN CAPITAL GOODS Direct Exposure: ABR % (1) Sample Tenant Client: Industrial Machinery 4.1% FURTHER DIVERSITY IN AUTOMOTIVE CATEGORY ACROSS: TriMas, Stanley Black & Decker, Trane Building Products 3.5% Johnson Controls, Ferguson Electrical Components & Equipment 3.1% Aerospace & Defense 1.3% Construction Machinery & Heavy Trucks Emerson Electric, Schneider Electric, Eaton General Dynamics, Wesco Aircraft 0.7% Amsted Industries Heavy Electrical Equipment 0.6% WEG Electric Industrial Conglomerates 0.3% Honeywell Total 13.6% Total 100.0% Total 100.0% Geography 14 states East, South, Midwest, West OEM Relationships Ford, Fiat-Chrysler, GM, BMW, Toyota, Hyundai, etc. Auto Plant Relationships Nine plants Jeep Cherokee, Ford 150, Ram 1500, Camaro, etc. Supply Chain Participation OEM, Tier 1 suppliers, Tier 2 suppliers, logistics providers, after market parts, etc. Products Exhaust systems, seating, engines, interior molding, fuel injectors, tires, suspension, etc. EMPHASIS ON DIVERSIFICATION ENHANCES STABILITY OF PORTFOLIO CASH FLOWS (1) As of Q
12 MARKET DIVERSIFICATION # MARKET (1) STAG OWNERSHIP (000 s SF) # OF BUILDINGS % OF SQUARE FEET % OF ABR 1 Philadelphia, PA 6, % 10.2% 2 Chicago, IL 5, % 9.1% 3 Greenville/Spartanburg, SC 4, % 5.0% 4 Milwaukee/Madison, WI 3, % 3.8% 5 Cincinnati/Dayton, OH 2, % 3.3% 6 Charlotte, NC 2, % 3.2% 7 Detroit, MI 1, % 3.2% 8 Houston, TX 1, % 2.8% 9 West Michigan, MI 1, % 2.6% 10 El Paso, TX 1, % 2.6% Subtotal 31, % 45.8% , % 19.2% Other 26, % 35.0% Total 70, % 100% (1) As of Q1 2018; defined by CoStar RELATIVE VALUE EXISTS ACROSS ALL INDUSTRIAL MARKETS 11
13 OPERATIONS ASSET MANAGEMENT PLATFORM STAG operates a comprehensive operating platform - Capable of addressing every physical aspect and tenant scenario related to industrial real estate ownership - Consistently outperform local market owners and operators at all points in the cycle In-house construction and engineering professionals oversee value-add capital projects including expansions, roof replacements, general site and tenant-specific work 40,000 35,000 30,000 25,000 20,000 15,000 CUMULATIVE LEASING ACTIVITY - SQUARE FEET (000) (1) 33,488 22,289 16,723 12,333 36, % 80% 60% 40% 74% 84% 59% RETENTION 71% 70% 70% 59% (2) 83% 10,000 5, ,398 4,285 1, % 0% IN-HOUSE REAL ESTATE EXPERTS DIRECTLY MANAGE TENANT RELATIONSHIPS & LEVERAGE NETWORK OF LOCAL THIRD PARTIES (1) Includes new, renewal and expansion leases executed (2) Certain operational decisions were made that reduced the retention metric from 73% to 59%; decisions resulted in enhanced rental rates and attractive opportunistic disposition returns 12
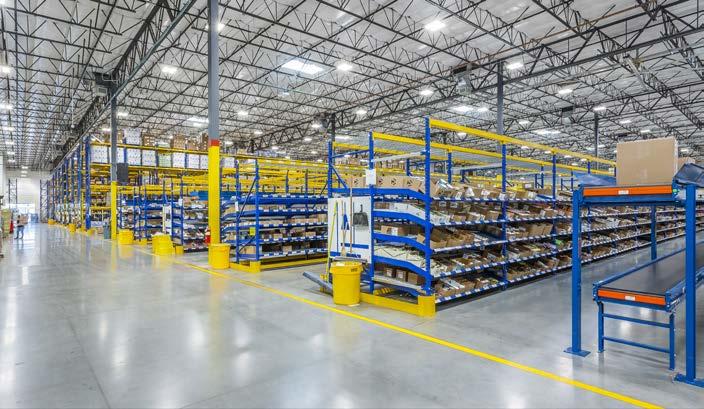
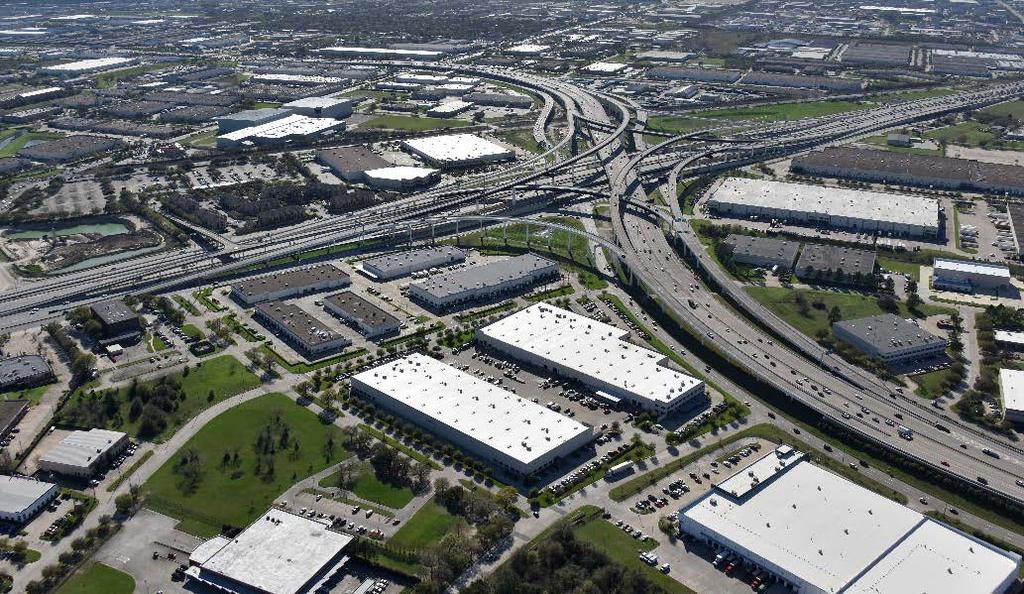
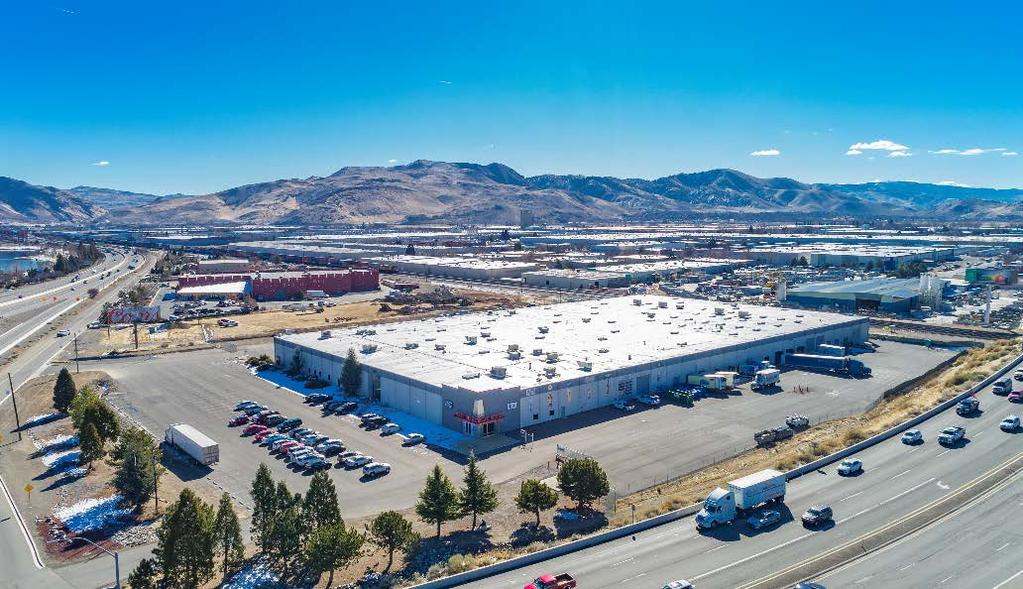
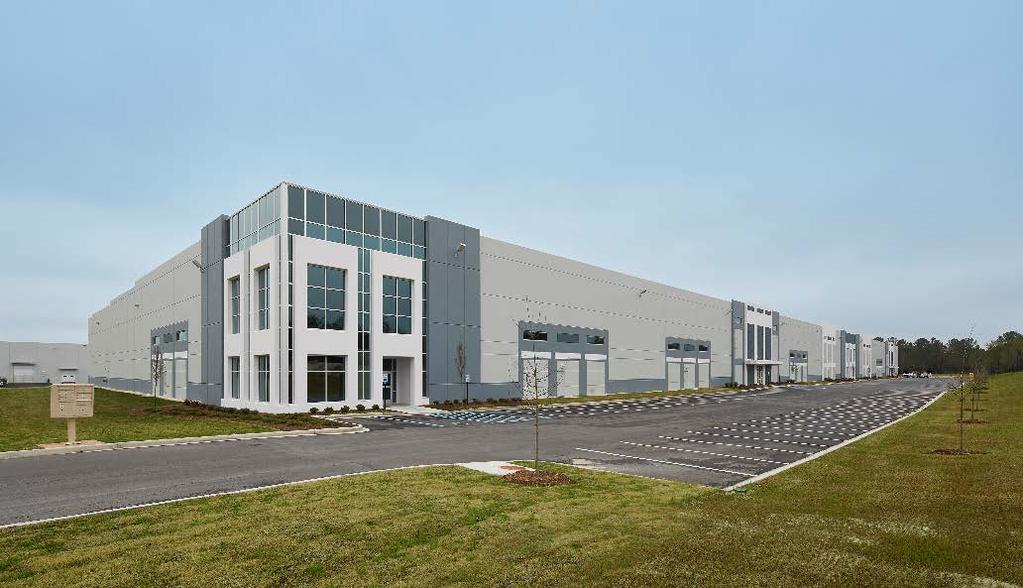
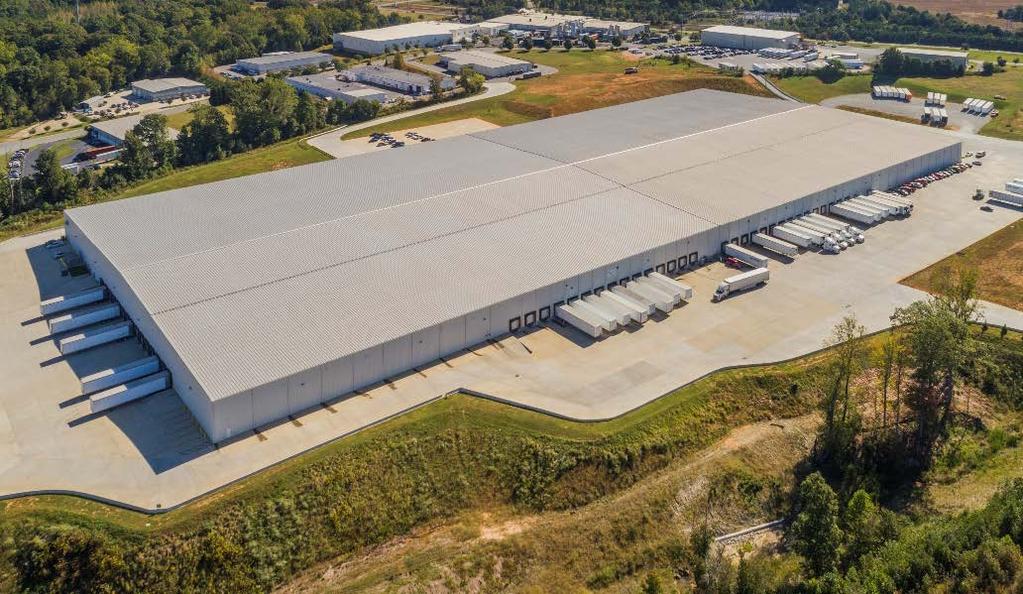
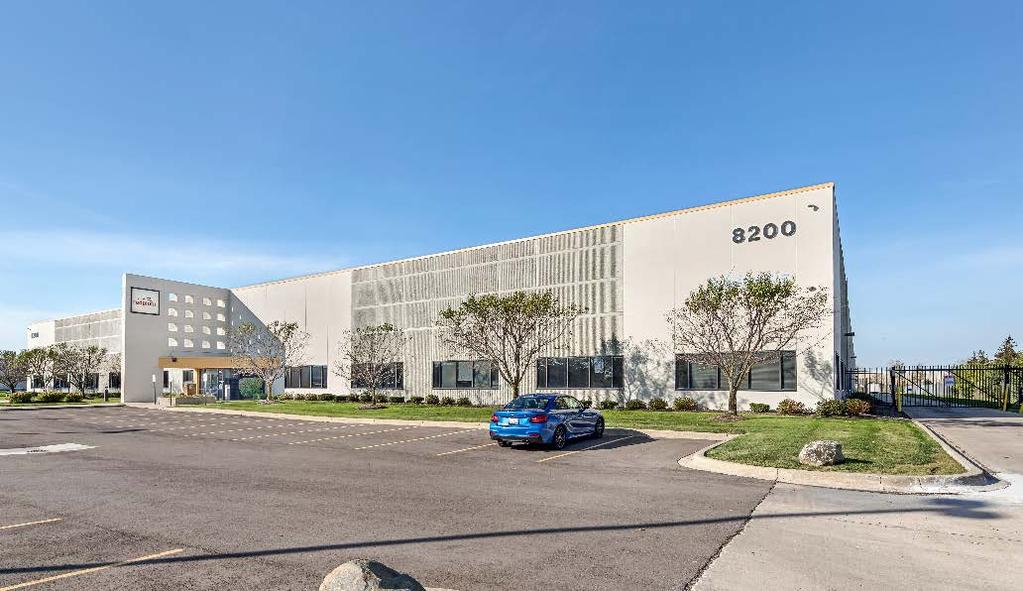
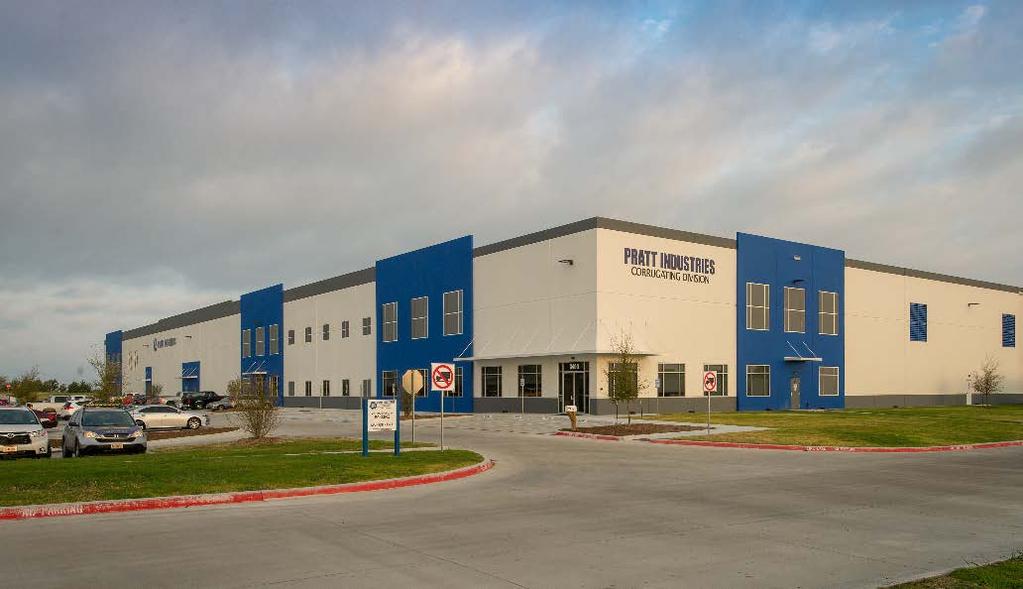
14 FEATURED PROPERTIES 13


 Acquisition cap rate compared to management s estimate of current exit cap rate VALUE")
15 VALUE ADDED THROUGH OPERATIONS MULTI-FACETED APPROACH TO CREATING VALUE ACQUIRED VACANCY GARLAND, TX Vacant at time of acquisition Capital spent to enhance marketability 100% leased for eight years Exit cap rate ~260bps below acquisition cap rate 1 ACQUIRED VACANCY OKLAHOMA CITY, OK Build-to-suit takeout with vacant suite 56% occupied at time of acquisition Leased vacant suite for ten years Exit cap rate ~230bps below acquisition cap rate 1 REDEVELOPMENT NORTH JACKSON, OH Repositioned asset from manufacturing use to warehouse / distribution use Installed sprinkler system and cross-docks along with other improvements Exit cap rate ~310bps below acquisition cap rate 1 BUILDING EXPANSION SMITHFIELD, NC Expanded existing building by ~116K SF Executed lease renewal for additional fifteen years to existing tenant Exit cap rate ~250bps below acquisition cap rate 1 NEW LEASING GOLDEN, CO Original tenant exercised termination option and paid ~$1M termination fee Executed new lease with zero downtime New lease for five years with 3% annual rental escalators Exit cap rate ~345bps below acquisition cap rate 1 RENEWAL LEASING EL PASO, TX Two years of remaining lease term at time of acquisition Executed renewal lease with in-place tenant for ten years Exit cap rate ~210bps below acquisition cap rate 1 (1) Acquisition cap rate compared to management s estimate of current exit cap rate VALUE CREATION THROUGH OPERATIONS 14


16 VALUE CREATION CASE STUDIES VALUE CREATION THROUGH REAL ESTATE SOLUTIONS VALUE CREATION THROUGH LEASING Background 260K SF facility located in Biddeford, ME originally built for a national baked goods company who left the facility in 2012 Building was acquired by a private equity group in 2014 with the intention of selling the existing equipment and repositioning the asset to warehouse / distribution use Value Creation Global shipping/packaging/logistics company identified the location as a regional hub Private equity group committed to the scope of redevelopment for the identified tenant but could not execute the project due to limited real estate and development expertise STAG acquired the asset from the private equity group, assumed the redevelopment responsibility and completed the redevelopment project Result Long term lease to a credit tenant committed to the facility with a stabilized yield of 9.3% Background 491K SF facility located in Charlotte, NC occupied by a smaller retail credit Building was acquired at a 9.2% cap rate, which reflected the smaller credit and short lease term Value Creation Tenant has operated out of the facility since 1978, which serves as the only distribution center for ~2,000 retail locations Identifying the critical nature of the facility to the tenants operations during the acquisition process, STAG extended the tenant s lease by ~15 years with 2.5% rental escalators Given the attractiveness of a long term lease to various real estate investor profiles, the asset was marketed for sale to realize the value creation Result Asset sold for $32M at 6.2% cap rate; compared to $21M at a 9.2% cap rate at acquisition 15
17 TENANT PROFILE TENANTS ARE SIGNIFICANT ENTERPRISES WITH LARGE SPACE REQUIREMENTS Single-tenant industrial real estate focus generally results in larger tenant sizes compared to multi-tenant strategy In-depth, initial and ongoing quantitative and qualitative credit analysis by dedicated Credit Team Historical credit loss of less than 0.1% of revenues since IPO TENANT PROFILE AS OF MARCH 31, 2018 (1) Number of Tenants 312 Average Tenant Size (Square Feet) 214,736 Average Annualized Base Rental Revenue Per Square Foot $4.13 Average Annualized Base Rental Revenue Per Tenant ($000s) $888 CREDIT PROFILE AS OF MARCH 31, 2018 (1) Tenants Publicly Rated 55.0% Tenants Rated Investment Grade 27.5% Tenant Revenue > $100 million 87.1% Tenant Revenue > $1 billion 62.0% PORTFOLIO OF LARGE AND SOPHISTICATED TENANTS (1) Based on Annualized Base Rental Revenue and the inclusion of tenants, guarantors, and / or non-guarantor parents 16
18 LEASE EXPIRATIONS LEASE EXPIRATION SCHEDULE AS OF MARCH 31, 2018 Lease Expiration Year Number of Leases Expiring Total Rentable SF Annualized Base Rental Revenue ($000s) % of Total Annualized Base Rental Revenue Available N/A 3,756,403 N/A N/A MTM 7 260,270 $1, % ,588,645 15, % ,410,299 38, % ,640,197 41, % ,655,672 44, % ,036,112 25, % ,859,589 26, % ,904,903 15, % ,737,758 11, % ,869,084 18, % ,768,969 7, % Thereafter 32 7,266,224 30, % Total / Weighted Average ,754,125 $277, % WELL-LADDERED EXPIRATION SCHEDULE 17
19 CAPITAL STRUCTURE LIQUIDITY Liquidity $312 mm CASH FLOW COVERAGE Net Debt / Run Rate Adj. EBITDA Annualized 5.1x DEBT, 32% Fixed Charge Coverage Ratio 4.2x Interest Coverage Ratio 5.3x LEVERAGE Net Debt / Total Real Estate Cost Basis 39.0% Debt / Total Enterprise Value 31.9% INVESTMENT GRADE CREDIT RATING PREFERRED EQUITY, 4% COMMON EQUITY, 64% Fitch BBB / Stable Outlook As of March 31, 2018 INVESTMENT GRADE BALANCE SHEET 18
20 COMPARATIVE EQUITY VALUATION METRICS PEER COMPARISON 7.5% DIVIDEND YIELD (1) FFO MULTIPLE FY (3) 25.0x 23.3x 5.0% 5.3% 20.0x 2.5% 2.7% 15.0x 10.0x 14.9x 0.0% STAG INDUSTRIAL PEER AVERAGE 5.0x STAG INDUSTRIAL PEER AVERAGE 8.0% IMPLIED CAP RATE - Q (2) AFFO MULTIPLE FY (3) 30.0x 28.6x 7.0% 6.0% 6.5% 25.0x 20.0x 15.0x 15.5x 5.0% 4.9% 10.0x 4.0% STAG INDUSTRIAL PEER AVERAGE 5.0x STAG INDUSTRIAL PEER AVERAGE Peers consist of DCT, DRE, EGP, FR, LPT, PLD, REXR & TRNO (1) Dividend Yield as of May 30, 2018 (2) Implied cap rate per Wall Street research (3) FFO and AFFO Multiple (including for STAG Industrial) incorporates published SNL Consensus FFO estimates based on closing share prices as of May 30,
21 ENVIRONMENTAL, SOCIAL & GOVERNANCE ENVIRONMENTAL Solar panel installation program: Installations completed and additional viable sites identified within the portfolio; actively pursuing opportunities nationwide LED lighting conversion program: Lighting upgrade from less efficient metal halide or fluorescent systems HVAC upgrade program: Replacement of older systems with new, higher efficiency units SOCIAL RESPONSIBILITY STAG Industrial s internal Charitable Action Committee is a proud supporter of Boston-based nonprofit organizations - Donated and coordinated fundraising for $350k+ to support thousands of children and young adults - Corporate Partner of the Year Heading Home (2015) - Chair of Home for Little Wanderers annual fundraiser (2017) - Actively involved in numerous other local charities including BASE and Room to Grow GOVERNANCE Board diversity with designated lead independent director Shareholder friendly bylaws including majority voting and shareholder ability to amend bylaws Alignment of management compensation with total shareholder return Stock ownership guidelines for executives & directors 20


22 SUMMARY VALUE CREATION Large and persisting opportunity to acquire mispriced industrial real estate assets Focus on relative value leads to evaluation of all markets, all credit profiles and all lease terms Emphasis on diversification enhances value and stability of portfolio cash flows Comprehensive operating platform capable of addressing every physical aspect and tenant scenario related to real estate ownership Capitalized with an investment grade balance sheet DELIVERING GROWTH AND INCOME TO OUR SHAREHOLDERS 21
23 DEFINITIONS 22
24 NON-GAAP FINANCIAL MEASURES & OTHER DEFINITIONS Acquisition Capital Expenditures: We define Acquisition Capital Expenditures as Recurring and Non-Recurring Capital Expenditures identified at the time of acquisition. Acquisition Capital Expenditures also include new lease commissions and tenant improvements for space that was not occupied under the Company's ownership. Earnings before Interest, Taxes, Depreciation, and Amortization (EBITDAre), Adjusted EBITDAre, Annualized Adjusted EBITDAre, and Run Rate Adjusted EBITDAre: We define EBITDAre in accordance with the standards established by the National Association of Real Estate Investment Trusts ( NAREIT ). EBITDAre represents net income (loss) (computed in accordance with GAAP) before interest expense, tax, depreciation and amortization, gains or losses on the sale of rental property, and loss on impairments. Adjusted EBITDAre further excludes property acquisition costs, termination income, straight-line rent adjustments, non-cash compensation, intangible amortization in rental income, gain or loss on involuntary conversion, loss on extinguishment of debt, loss on incentive fee, and other non-recurring items. We define Annualized Adjusted EBITDAre as Adjusted EBITDAre multiplied by four. We define Run Rate Adjusted EBITDAre as Adjusted EBITDAre plus incremental Adjusted EBITDAre adjusted for a full period of acquisitions and dispositions. Run Rate Adjusted EBITDAre does not reflect the Company s historical results and does not predict future results, which may be substantially different. EBITDAre, Adjusted EBITDAre, and Run Rate Adjusted EBITDAre should not be considered as an alternative to net income (determined in accordance with GAAP) as an indication of our performance, and we believe that to understand our performance further, EBITDAre, Adjusted EBITDAre, and Run Rate Adjusted EBITDAre should be compared with our reported net income or net loss in accordance with GAAP, as presented in our consolidated financial statements. We believe that EBITDAre, Adjusted EBITDAre, and Run Rate Adjusted EBITDAre are helpful to investors as supplemental measures of the operating performance of a real estate company because they are direct measures of the actual operating results of our properties. We also use these measures in ratios to compare our performance to that of our industry peers. Annualized Base Rental Revenue: We define Annualized Base Rental Revenue as the monthly base cash rent for the applicable property or properties (which is different from rent calculated in accordance with GAAP for purposes of our financial statements), multiplied by 12. If a tenant is in a free rent period, the annualized rent is calculated based on the first contractual monthly base rent amount multiplied by 12. Capitalization Rate: We define Capitalization Rate as the estimated weighted average cash Capitalization Rate, calculated by dividing (i) the Company s estimate of year one cash net operating income from the applicable property s operations stabilized for occupancy (post-lease-up for vacant properties), which does not include termination income, miscellaneous other income, capital expenditures, general and administrative costs, reserves, tenant improvements and leasing commissions, credit loss, or vacancy loss, by (ii) the GAAP purchase price plus estimated Acquisition Capital Expenditures. These Capitalization Rate estimates are subject to risks, uncertainties, and assumptions and are not guarantees of future performance, which may be affected by known and unknown risks, trends, uncertainties, and factors that are beyond our control, including those risk factors contained in our Annual Report on Form 10-K for the year ended December 31,
25 NON-GAAP FINANCIAL MEASURES & OTHER DEFINITIONS Funds from Operations (FFO), Core FFO, and Adjusted FFO (AFFO): We define FFO in accordance with the standards established by the National Association of Real Estate Investment Trusts ( NAREIT ). FFO represents net income (loss) (computed in accordance with GAAP), excluding gains (or losses) from sales of depreciable operating property, impairment writedowns of depreciable real estate, real estate related depreciation and amortization (excluding amortization of deferred financing costs and fair market value of debt adjustment) and after adjustments for unconsolidated partnerships and joint ventures. Core FFO and AFFO exclude property acquisition costs, intangible amortization in rental income, loss on extinguishment of debt, gain on involuntary conversion, gain (loss) on swap ineffectiveness, loss on incentive fee, and non-recurring other expenses. AFFO also excludes non-rental property depreciation and amortization, straight-line rent adjustments, non-cash portion of interest expense, non-cash compensation expense and deducts Recurring Capital Expenditures and lease renewal commissions and tenant improvements. None of FFO, Core FFO or AFFO should be considered as an alternative to net income (determined in accordance with GAAP) as an indication of our performance, and we believe that to understand our performance further, these measurements should be compared with our reported net income or net loss in accordance with GAAP, as presented in our consolidated financial statements. We use FFO as a supplemental performance measure because it is a widely recognized measure of the performance of REITs. FFO may be used by investors as a basis to compare our operating performance with that of other REITs. We and investors may use Core FFO and AFFO similarly as FFO. However, because FFO, Core FFO and AFFO exclude, among other items, depreciation and amortization and capture neither the changes in the value of our buildings that result from use or market conditions nor the level of capital expenditures and leasing commissions necessary to maintain the operating performance of our buildings, all of which have real economic effects and could materially impact our results from operations, the utility of these measures as measures of our performance is limited. In addition, other REITs may not calculate FFO in accordance with the NAREIT definition as we do, and, accordingly, our FFO may not be comparable to such other REITs FFO. Similarly, our calculations of Core FFO and AFFO may not be comparable to similarly titled measures disclosed by other REITs. Liquidity: We define Liquidity as the amount of aggregate undrawn nominal commitments the Company could immediately borrow under the Company s unsecured debt instruments, consistent with the financial covenants, plus unrestricted cash balances. Non-Recurring Capital Expenditures: We define Non-Recurring Capital Expenditures as capital items for upgrades or items that previously did not exist at a building or capital items which have a longer useful life, such as roof replacements. Non-Recurring Capital Expenditures funded by parties other than the Company and Acquisition Capital Expenditures are excluded. Real Estate Cost Basis: We define Real Estate Cost Basis as the book value of rental property and deferred leasing intangibles, exclusive of the related accumulated depreciation and amortization. Recurring Capital Expenditures: We define Recurring Capital Expenditures as capital items required to sustain existing systems and capital items which generally have a shorter useful life. Recurring Capital Expenditures funded by parties other than the Company are excluded. Renewal Lease: We define a Renewal Lease as a lease signed by an existing tenant to extend the term for twelve months or more, including (i) a renewal of the same space as the current lease at lease expiration, (ii) a renewal of only a portion of the current space at lease expiration and (iii) an early renewal or workout, which ultimately does extend the original term for twelve months or more. Retention: We define Retention as the percentage determined by taking Renewal Lease square footage commencing in the period divided by square footage of leases expiring in the period for assets included in the Operating Portfolio. 24
STAG INDUSTRIAL ANNOUNCES SECOND QUARTER 2018 RESULTS
 STAG INDUSTRIAL ANNOUNCES SECOND QUARTER 2018 RESULTS Boston, MA July 31, 2018 - STAG Industrial, Inc. (the Company ) (NYSE:STAG), today announced its financial and operating results for the quarter ended
SUPPLEMENTAL INFORMATION
 SUPPLEMENTAL INFORMATION UNAUDITED FOURTH QUARTER 2018 STAG SUPPLEMENTAL INFORMATION FOURTH QUARTER 2018 1 Forward-Looking Statements This supplemental information package contains certain forward-looking
Table of Contents Page
 Table of Contents Page Page Company, Common Stock, and Earnings Call Information 1 Debt Information Definitions 2-3 Debt Maturities 20 Financial Information Unsecured Public Debt Covenants 21 Balance Sheets
Definitions. CPI is a lease in which base rent is adjusted based on changes in a consumer price index.
 Annualized Rental Income is rental revenue under our leases on Operating Properties on a straight-line basis, which includes the effect of rent escalations and any tenant concessions, such as free rent,
FOR IMMEDIATE RELEASE
 FOR IMMEDIATE RELEASE GLOBAL NET LEASE ANNOUNCES OPERATING RESULTS FOR SECOND QUARTER 2018 New York, August 8, 2018 Global Net Lease, Inc. (NYSE: GNL) ( GNL or the Company ), a real estate investment trust
FOR IMMEDIATE RELEASE
 FOR IMMEDIATE RELEASE GLOBAL NET LEASE ANNOUNCES OPERATING RESULTS FOR THIRD QUARTER 2018 New York, November 7, 2018 Global Net Lease, Inc. (NYSE: GNL) ( GNL or the Company ), a real estate investment
FOR IMMEDIATE RELEASE
 FOR IMMEDIATE RELEASE American Finance Trust Announces Second Quarter Operating Results New York, August 9, - American Finance Trust, Inc. (Nasdaq: AFIN) ( AFIN or the Company ), a real estate investment
Clipper Realty Inc. Announces Third Quarter 2018 Results Reports Record Revenues, Income From Operations and Adjusted Funds From Operations
 Clipper Realty Inc. Announces Third Quarter 2018 Results Reports Record Revenues, Income From Operations and Adjusted Funds From Operations NEW YORK, November 1, 2018 /Business Wire/ -- Clipper Realty
Achieved record annual revenues of $110.0 million for 2018, representing an increase of 5.8%
 Clipper Realty Inc. Announces Fourth Quarter and Full-Year 2018 Results Reports Record Annual Revenues, Record Annual Income from Operations and Record Quarterly and Annual Adjusted Funds from Operations
FIRST INDUSTRIAL REALTY TRUST REPORTS FIRST QUARTER 2018 RESULTS
 First Industrial Realty Trust, Inc. 311 South Wacker Drive Suite 3900 Chicago, IL 60606 312/344-4300 FAX: 312/922-9851 MEDIA RELEASE FIRST INDUSTRIAL REALTY TRUST REPORTS FIRST QUARTER 2018 RESULTS Occupancy
AGREE REALTY CORPORATION REPORTS OPERATING RESULTS FOR THE SECOND QUARTER 2015
 FOR IMMEDIATE RELEASE CONTACT: Joey Agree Chief Executive Officer (248) 737-4190 AGREE REALTY CORPORATION REPORTS OPERATING RESULTS FOR THE SECOND QUARTER 2015 BLOOMFIELD HILLS, MI (July 27, 2015) - Agree
2014 Operating and Financial Highlights
 FINANCIAL HIGHLIGHTS > 2014 Operating and Financial Highlights Operating Results Executed 203 leasing transactions representing approximately 2.8 million square feet, the highest gross leasing volume in
Carter Validus Mission Critical REIT, Inc. Reports Second Quarter 2016 Results
 Carter Validus Mission Critical REIT, Inc. Reports Second Quarter 2016 Results TAMPA, FL (September 1, 2016) - Carter Validus Mission Critical REIT, Inc. (the Company ) announced today its operating results
Industrial Income Trust Inc.
 UNITED STATES SECURITIES AND EXCHANGE COMMISSION Washington, D.C. 20549 FORM 8-K CURRENT REPORT Pursuant to Section 13 or 15(d) of The Securities Exchange Act of 1934 Date of Report (Date of earliest event
SITE CENTERS NOVEMBER 2018
 SITE CENTERS NOVEMBER 2018 JOINT VENTURE WITH CHINESE INSTITUTIONAL INVESTORS $607MM JOINT VENTURE ALLOWS SITE CENTERS TO ACCELERATE OPPORTUNISTIC INVESTING AND FURTHER IMPROVE THE BALANCE SHEET Dividend
Supplemental Information September 30, 2017
 Conference Call 888-632-3384 ID - EastGroup October 20, 2017 11:00 a.m. Eastern Daylight Time webcast available at www.eastgroup.net Supplemental Information September 30, 2017 Steele Creek Commerce Park
PS Business Parks, Inc. Reports Results for the Quarter Ended March 31, 2017
 News Release PS Business Parks, Inc. 701 Western Avenue Glendale, CA 91201-2349 psbusinessparks.com For Release: Immediately Date: April 25, 2017 Contact: Edward A. Stokx (818) 244-8080, Ext. 1649 PS Business
Industrial Income Trust Inc.
 UNITED STATES SECURITIES AND EXCHANGE COMMISSION Washington, D.C. 20549 FORM 8-K CURRENT REPORT Pursuant to Section 13 or 15(d) of The Securities Exchange Act of 1934 Date of Report (Date of earliest event
Glendale, California - PS Business Parks, Inc. (AMEX: PSB), reported operating results for the fourth quarter and the year ending December 31, 2001.
, reported operating results for the fourth quarter and the year ending December 31, 2001.") News Release PS Business Parks, Inc. 701 Western Avenue P.O. Box 25050 Glendale, CA 91221-5050 www.psbusinessparks.com For Release: Immediately Date: January 30, 2002 Contact: Mr. Jack Corrigan (818) 244-8080,
News Release PS Business Parks, Inc. 701 Western Avenue P.O. Box 25050 Glendale, CA 91221-5050 www.psbusinessparks.com For Release: Immediately Date: January 30, 2002 Contact: Mr. Jack Corrigan (818) 244-8080,
Highwoods Reports Second Quarter 2018 Results
 FOR IMMEDIATE RELEASE Ref: 18-14 Contact: Brendan Maiorana Senior Vice President, Finance and Investor Relations 919-431-1529 Highwoods Reports Second Quarter 2018 Results $0.49 Net Income per Share $0.87
Highwoods Reports Third Quarter 2017 Results
 FOR IMMEDIATE RELEASE Ref: 17-20 Contact: Brendan Maiorana Senior Vice President, Finance and Investor Relations 919-431-1529 Highwoods Reports Third Quarter 2017 Results $0.55 Net Income per Share $0.86
Investor Presentation November 2017
 Investor Presentation November 2017 1 Table of Contents Company Overview & 2017 Highlights 3 6 Multifamily Fundamentals 7 11 Camden s Portfolio 12 22 Real Estate Transactions 23 29 Capital Structure &
WP Glimcher Reports Second Quarter 2016 Results
 NEWS RELEASE WP Glimcher Reports Second Quarter 2016 Results COLUMBUS, OH August 3, 2016 WP Glimcher Inc. (NYSE: WPG) today reported financial and operating results for the second quarter ended June 30,
Highwoods Reports Third Quarter 2018 Results
 FOR IMMEDIATE RELEASE Ref: 18-18 Contact: Brendan Maiorana Senior Vice President, Finance and Investor Relations 919-431-1529 Highwoods Reports Third Quarter 2018 Results $0.32 Net Income per Share $0.86
RESI Update 4 th Quarter 2016
 RESI Update 4 th Quarter 2016 Supplemental Investor Information George Ellison, CEO Robin Lowe, CFO 2017 Altisource Residential Corporation. All rights reserved. Forward Looking Statements This presentation
FIRST INDUSTRIAL REALTY TRUST REPORTS FIRST QUARTER 2019 RESULTS
 First Industrial Realty Trust, Inc. 1 North Wacker Drive Suite 4200 Chicago, IL 60606 312/344-4300 MEDIA RELEASE FIRST INDUSTRIAL REALTY TRUST REPORTS FIRST QUARTER 2019 RESULTS Signed 1.8 Million Square
Conference Call ID EastGroup October 19, :00 a.m. Eastern Time webcast available at EastGroup.net
 Table of Contents 2018 THIRD QUARTER Conference Call 877-876-9176 ID EastGroup October 19, 2018 11:00 a.m. Eastern Time webcast available at EastGroup.net Supplemental Information 2018 400 W. Parkway Place,
Investor Presentation September 2017
 Investor Presentation September 2017 1 Table of Contents Company Overview & 2017 Guidance 3 6 Multifamily Fundamentals 7 11 Camden s Portfolio 12 22 Real Estate Transactions 23 29 Capital Structure & Liquidity
DCT INDUSTRIAL TRUST REPORTS FOURTH QUARTER AND FULL-YEAR 2017 RESULTS. Net Earnings of $0.22 per Diluted Share in Q4; $1.11 per Diluted Share in 2017
 Press Release FOR IMMEDIATE RELEASE: DCT INDUSTRIAL TRUST REPORTS FOURTH QUARTER AND FULL-YEAR 2017 RESULTS Net Earnings of $0.22 per Diluted Share in Q4; $1.11 per Diluted Share in 2017 FFO, as adjusted,
EastGroup Properties Announces Second Quarter 2018 Results
 EastGroup Properties Announces Second Quarter 2018 Results Contact: Marshall Loeb, President and CEO Brent Wood, CFO (601) 354-3555 Net Income Attributable to Common Stockholders of $.52 Per Share Compared
Supplemental Information December 31, 2017
 Conference Call 888-632-3384 ID - EastGroup February 1, 2018 11:00 a.m. Eastern Standard Time webcast available at www.eastgroup.net Supplemental Information December 31, 2017 Alamo Ridge Business Park
Front Yard Residential Corporation Announces Transformative Acquisition and Reports Second Quarter 2018 Results
 Front Yard Residential Corporation Announces Transformative Acquisition and Reports Second Quarter 2018 Results August 9, 2018 CHRISTIANSTED, U.S. Virgin Islands, Aug. 09, 2018 (GLOBE NEWSWIRE) -- Front
NON-GAAP FINANCIAL MEASURES
 NON-GAAP FINANCIAL MEASURES Welltower Inc. (HCN) believes that revenues, net operating income from continuing operations (NOICO), net income and net income attributable to common stockholders (NICS), as
NEWS RELEASE For immediate release
 NEWS RELEASE For immediate release Laura Clark 904 598 7831 LauraClark@RegencyCenters.com Regency Centers Reports Third Quarter 2018 Results Company Increases 2018 Guidance JACKSONVILLE, FL. (October 25,
AMH Corporate Update 2
 June 2014 Disclaimer The information in this presentation has been prepared solely for informational purposes. We, AMH, AH4R, the Company, the REIT, our and us refer to American Homes 4 Rent, a Maryland
UNITED STATES SECURITIES AND EXCHANGE COMMISSION Washington, D.C FORM 10-Q
 UNITED STATES SECURITIES AND EXCHANGE COMMISSION Washington, D.C. 20549 FORM 10-Q ý QUARTERLY REPORT PURSUANT TO SECTION 13 OR 15(d) OF THE SECURITIES EXCHANGE ACT OF 1934 For the Quarterly Period Ended
MARCH 2019 CITI 2019 GLOBAL PROPERTY CEO CONFERENCE
 MARCH 2019 CITI 2019 GLOBAL PROPERTY CEO CONFERENCE SAFE HARBOR This presentation contains forward-looking statements within the meaning of Section 27A of the Securities Act of 1933, and Section 21E of
Front Yard Residential Corporation Reports Third Quarter 2018 Results
 Front Yard Residential Corporation Reports Third Quarter 2018 Results November 7, 2018 CHRISTIANSTED, U.S. Virgin Islands, Nov. 07, 2018 (GLOBE NEWSWIRE) -- Front Yard Residential Corporation ( Front Yard
AGREE REALTY CORPORATION REPORTS OPERATING RESULTS FOR THE FOURTH QUARTER AND FULL YEAR 2014
 FOR IMMEDIATE RELEASE CONTACT: Brian Dickman Chief Financial Officer (248) 737-4190 AGREE REALTY CORPORATION REPORTS OPERATING RESULTS FOR THE FOURTH QUARTER AND FULL YEAR 2014 BLOOMFIELD HILLS, MI (February
Highwoods Reports Third Quarter 2015 Results
 FOR IMMEDIATE RELEASE Ref: 15-22 Contact: Mark Mulhern Senior Vice President and Chief Financial Officer 919-875-6682 Reports Third Quarter 2015 Results $0.77 FFO per Share (Including $0.01 per Share of
FOR IMMEDIATE RELEASE AUGUST 2, 2018 ARTIS REAL ESTATE INVESTMENT TRUST RELEASES SECOND QUARTER RESULTS
 FOR IMMEDIATE RELEASE AUGUST 2, 2018 ARTIS REAL ESTATE INVESTMENT TRUST RELEASES SECOND QUARTER RESULTS Today Artis Real Estate Investment Trust ( Artis or the "REIT") issued its financial results and
Retail Opportunity Investments Corp. Reports Strong First Quarter Results & Raises FFO Guidance
 April 27, 2016 Retail Opportunity Investments Corp. Reports Strong First Quarter Results & Raises FFO Guidance $17.4% increase in FFO Per Diluted Share 7.6% Increase in Same-Center Cash Net Operating Income
PS Business Parks, Inc. Reports Results for the Quarter Ended March 31, 2018
 News Release PS Business Parks, Inc. 701 Western Avenue Glendale, CA 91201-2349 psbusinessparks.com For Release: Immediately Date: April 24, 2018 Contact: Maria R. Hawthorne (818) 244-8080, Ext. 1370 PS
CHOICE PROPERTIES REAL ESTATE INVESTMENT TRUST. Management s Discussion and Analysis of Financial Condition and Results of Operations
 CHOICE PROPERTIES REAL ESTATE INVESTMENT TRUST Management s Discussion and Analysis of Financial Condition and Results of Operations (in thousands of Canadian dollars except where otherwise indicated)
DREAM GLOBAL ANNOUNCES FOURTH QUARTER RESULTS, 24% ANNUAL NET ASSET VALUE GROWTH AND OVER 6% FOURTH QUARTER COMPARATIVE NOI GROWTH
 DREAM GLOBAL ANNOUNCES FOURTH QUARTER RESULTS, 24% ANNUAL NET ASSET VALUE GROWTH AND OVER 6% FOURTH QUARTER COMPARATIVE NOI GROWTH TORONTO, FEBRUARY 20, 2019 DREAM GLOBAL REIT (TSX:DRG.UN, FRA:DRG) (or
Investor Presentation September 2014
 Investor Presentation September 2014 Forward Looking Statements This presentation may contain various forward-looking statements. You can identify forward-looking statements by the use of forward-looking
NAREIT Presentation June George Ellison, CEO Robin Lowe, CFO. welcome. home Front Yard Residential. All rights reserved.
 NAREIT Presentation June 2018 George Ellison, CEO Robin Lowe, CFO welcome home. 2018 Front Yard Residential. All rights reserved. 1 Forward-looking Statements This presentation contains forward-looking
PS Business Parks, Inc. Reports Results for the Quarter Ended September 30, 2018
 News Release PS Business Parks, Inc. 701 Western Avenue Glendale, CA 91201-2349 psbusinessparks.com For Release: Immediately Date: October 23, 2018 Contact: Jeff Hedges (818) 244-8080, Ext. 1649 PS Business
Senior Housing Properties Trust Announces Fourth Quarter and Year End 2017 Results
 Senior Housing Properties Trust NEWS RELEASE Senior Housing Properties Trust Announces Fourth Quarter and Year End 2017 Results 2/27/2018 NEWTON, Mass.--(BUSINESS WIRE)-- Senior Housing Properties Trust
MARCH 2018 CITI 2018 GLOBAL PROPERTY CEO CONFERENCE
 MARCH 2018 CITI 2018 GLOBAL PROPERTY CEO CONFERENCE SAFE HARBOR This presentation contains forward-looking statements within the meaning of Section 27A of the Securities Act of 1933, and Section 21E of
News Release. PS Business Parks, Inc. 701 Western Avenue P.O. Box Glendale, CA
 News Release PS Business Parks, Inc. 701 Western Avenue P.O. Box 25050 Glendale, CA 91221-5050 www.psbusinessparks.com For Release: Immediately Date: May 3, 2001 Contact: Mr. Jack Corrigan (818) 244-8080,
MARGARITAVILLE RESORT CASINO TRANSACTION OVERVIEW JUNE 19, 2018
 MARGARITAVILLE RESORT CASINO TRANSACTION OVERVIEW JUNE 19, 2018 DISCLAIMERS Forward-Looking Statements This presentation contains forward-looking statements within the meaning of the federal securities
Extra Space Storage Inc. Reports 2018 Fourth Quarter and Year-End Results
 Extra Space Storage Inc. Reports 2018 Fourth Quarter and Year-End Results February 20, 2019 SALT LAKE CITY, Feb. 20, 2019 /PRNewswire/ -- Extra Space Storage Inc. (NYSE: EXR) (the "Company"), a leading
Public Storage Reports Results for the Quarter Ended March 31, 2017
 News Release Public Storage 701 Western Avenue Glendale, CA 91201-2349 www.publicstorage.com For Release Immediately Date April 26, 2017 Contact Clemente Teng (818) 244-8080, Ext. 1141 Public Storage Reports
... ARMADA HOFFLER PROPERTIES REPORTS FOURTH QUARTER 2013 RESULTS
 PRESS RELEASE.......................................... ARMADA HOFFLER PROPERTIES REPORTS FOURTH QUARTER 2013 RESULTS Core FFO of $7.1 Million, $0.22 Per Diluted Share Operating Property Portfolio at 94.4%
MANAGEMENT PRESENTATION. November 7, 2017
 MANAGEMENT PRESENTATION November 7, 2017 DISCLAIMER This presentation includes time-sensitive information that may be accurate only as of today s date, November 7, 2017. Estimates of future net income
General Growth Properties, Inc.
 General Growth Properties, Inc. Supplemental Financial Information For the Three and Nine Months Ended September 30, 2009 This presentation contains forward-looking statements. Actual results may differ
SECURITIES AND EXCHANGE COMMISSION. Washington, D.C FORM 8-K CURRENT REPORT
 SECURITIES AND EXCHANGE COMMISSION Washington, D.C. 20549 FORM 8-K CURRENT REPORT PURSUANT TO SECTION 13 OR 15(d) OF THE SECURITIES EXCHANGE ACT OF 1934 Date of Report (Date of earliest event reported):
PRIMARIS RETAIL REIT Announces Third Quarter Results
 PRIMARIS RETAIL REIT Announces Third Quarter Results Toronto (Ontario) November 8, 2011 Primaris Retail REIT (TSX:PMZ.UN) is pleased to report positive operating results for the third quarter of 2011.
FOR IMMEDIATE RELEASE CONTACT: John Bucksbaum 312/ General Growth Properties, Inc. Reports Operating Results for the Third Quarter 2005
 News Release General Growth Properties, Inc. 110 North Wacker Drive Chicago, IL 60606 (312) 960-5000 FAX (312) 960-5475 FOR IMMEDIATE RELEASE CONTACT: John Bucksbaum 312/960-5005 Bernie Freibaum 312/960-5252
Dream Global REIT 2018 Fourth Quarter 1
 EPRA Metrics The annual EPRA BPR Awards aim to recognize and commend upon the efforts of property companies that have successfully adopted the EPRA BPR Guidelines. Based on the assessment performed by
January 23, NEW YORK--(BUSINESS WIRE)--Jan. 23, SL Green Realty Corp. (NYSE: SLG): Financial and Operating Highlights
--Jan. 23, SL Green Realty Corp. (NYSE: SLG): Financial and Operating Highlights") SL Green Realty Corp. Reports Fourth Quarter Loss Per Share of $0.73; Full Year 2018 Earnings Per Share of $2.67; Fourth Quarter and Full Year 2018 FFO of $1.61 and $6.62 Per Share January 23, 2019 NEW
SL Green Realty Corp. Reports Fourth Quarter Loss Per Share of $0.73; Full Year 2018 Earnings Per Share of $2.67; Fourth Quarter and Full Year 2018 FFO of $1.61 and $6.62 Per Share January 23, 2019 NEW
Extra Space Storage Inc. Reports 2017 Fourth Quarter and Year-End Results
 Extra Space Storage Inc. Reports 2017 Fourth Quarter and Year-End Results February 20, 2018 SALT LAKE CITY, Feb. 20, 2018 /PRNewswire/ -- Extra Space Storage Inc. (NYSE: EXR) (the "Company"), a leading
Q2 18 Earnings Results
 July 26, 2018 Q2 18 Earnings Results (NYSE: SAFE) Forward-Looking Statements and Other Matters This release may contain forward-looking statements. All statements other than statements of historical fact
Select Income REIT Announces Second Quarter 2016 Results
 FOR IMMEDIATE RELEASE Contact: Christopher Ranjitkar, Director, Investor Relations (617) 796-8320 Select Income REIT Announces Second Quarter 2016 Results Second Quarter Net Income of $0.34 Per Share Second
Select Income REIT Announces Third Quarter 2017 Results
 FOR IMMEDIATE RELEASE Contact: Christopher Ranjitkar, Director, Investor Relations (617) 796-8320 Select Income REIT Announces Third Quarter 2017 Results Third Quarter Net Income of $0.35 Per Share Third
Retail Acquisition Example
 Property Information Retail Acquisition Example Project Assumptions Acquisition Assumptions Property Name Retail Acquisition Example Project Type Acquisition Location Austin, TX Acquisition Cost $1,800,000
Q EPRA KEY METRICS
 Q1 EPRA KEY METRICS EPRA KEY METRICS The European Public Real Estate Association (EPRA) is a not-for-profit association based in Brussels that represents the interests of both listed real estate companies
SEC Reg. G Compliance - Non-GAAP Financial Measures
 SEC Reg. G Compliance - Non-GAAP Financial Measures Funds From Operations (FFO) Reconciliation, Including Non-Cash Items 1 ($ in 000s, except per share amounts) Tentative Estimates Preliminary and Midpoint
Investors and Analyst
 KITE HEADQUARTERS Indianapolis, IN PRESENTED TO: Investors and Analyst 11.2011 DISCLAIMER This presentation contains certain statements that are not historical fact and may constitute forwardlooking statements
SAUL CENTERS, INC Wisconsin Avenue, Suite 1500, Bethesda, Maryland (301)
") SAUL CENTERS, INC. 7501 Wisconsin Avenue, Suite 1500, Bethesda, Maryland 20814-6522 (301) 986-6200 October 29, 2015, Bethesda, MD. Saul Centers, Inc. Reports Third Quarter 2015 Earnings Saul Centers, Inc.
SAUL CENTERS, INC. 7501 Wisconsin Avenue, Suite 1500, Bethesda, Maryland 20814-6522 (301) 986-6200 October 29, 2015, Bethesda, MD. Saul Centers, Inc. Reports Third Quarter 2015 Earnings Saul Centers, Inc.
Real Estate & REIT Modeling: Quiz Questions Module 1 Accounting, Overview & Key Metrics
 Real Estate & REIT Modeling: Quiz Questions Module 1 Accounting, Overview & Key Metrics 1. How are REITs different from normal companies? a. Unlike normal companies, REITs are not required to pay income
NEWS RELEASE For immediate release
 NEWS RELEASE For immediate release Laura Clark 904 598 7831 LauraClark@RegencyCenters.com Regency Centers Reports Second Quarter 2018 Results JACKSONVILLE, FL. (August 2, 2018) Regency Centers Corporation
3rd Quarter Quarterly Supplemental
 Quarterly Supplemental 3rd Quarter 2018 Mkt at Springwoods Village Spring, TX Calhoun Commons Minneapolis, MN Mellody Farm Vernon Hills, IL El Camino Shopping Center Woodland Hills, CA Mellody Farm Vernon
WHITE PAPER ON FUNDS FROM OPERATIONS
 WHITE PAPER ON FUNDS FROM OPERATIONS FOR IFRS REVISED: SEPTEMBER 2010 Page 1 of 17 I. Introduction and Background TABLE OF CONTENTS II. III. IV. Intended use of FFO FFO Definition Discussion of FFO Definition
-- Expanding relationship with Brookdale by creating a $1.2 billion CCRC joint venture and amending existing Emeritus leases
 Page 1 of 11 Print Page Close Window News Release HCP Announces Results for Quarter Ended March 31, 2014 HIGHLIGHTS -- FFO per share was $0.75; FAD per share was $0.63; and EPS was $0.56 -- Achieved year-over-year
SAUL CENTERS, INC Wisconsin Avenue, Suite 1500, Bethesda, Maryland (301)
") SAUL CENTERS, INC. 7501 Wisconsin Avenue, Suite 1500, Bethesda, Maryland 20814-6522 (301) 986-6200 Saul Centers, Inc. Reports Third Quarter 2016 Earnings November 1, 2016, Bethesda, MD. Saul Centers, Inc.
SAUL CENTERS, INC. 7501 Wisconsin Avenue, Suite 1500, Bethesda, Maryland 20814-6522 (301) 986-6200 Saul Centers, Inc. Reports Third Quarter 2016 Earnings November 1, 2016, Bethesda, MD. Saul Centers, Inc.
INVESTOR PRESENTATION MAY 2013
 INVESTOR PRESENTATION MAY 2013 Forward-Looking Statements This presentation includes forward-looking statements. These statements are subject to a number of risks, uncertainties and other factors that
Our Objectives. Our Strategy
 2005 Third Quarter Report» Management s Discussion and Analysis Management s Discussion and Analysis This Management s Discussion and Analysis has been dated as at November 3, 2005. All dollar amounts
PS Business Parks, Inc. Reports Results for the Quarter and Year Ended December 31, 2018
 News Release PS Business Parks, Inc. 701 Western Avenue Glendale, CA 91201-2349 psbusinessparks.com For Release: Immediately Date: February 20, 2019 Contact: Jeff Hedges (818) 244-8080, Ext. 1649 PS Business
Strategic Storage Growth Trust, Inc. Reports 2018 Third Quarter Results
 FOR IMMEDIATE RELEASE Contacts Julie Leber Damon Elder Spotlight Marketing Communications Spotlight Marketing Communications 949.427.1391 949.427.1377 julie@spotlightmarcom.com damon@spotlightmarcom.com
Investor Presentation. First Quarter 2015
 Investor Presentation First Quarter 2015 1 CAUTIONARY STATEMENTS Today s session and our answers to questions contain statements that constitute forward-looking statements about expected future events
Highwoods Properties Reports Fourth Quarter and Full Year 2011 Results
 FOR IMMEDIATE RELEASE Ref: 12-06 Contact: Tabitha Zane Vice President, Investor Relations 919-431-1529 Highwoods Properties Reports Fourth Quarter and Full Year 2011 Results $0.70 FFO per Share for Fourth
NEWS RELEASE For immediate release
 NEWS RELEASE For immediate release Laura Clark 904 598 7831 LauraClark@RegencyCenters.com Regency Centers Reports First Quarter 2018 Results JACKSONVILLE, FL. (April 30, 2018) Regency Centers Corporation
SAUL CENTERS, INC Wisconsin Avenue, Suite 1500, Bethesda, Maryland (301)
") SAUL CENTERS, INC. 7501 Wisconsin Avenue, Suite 1500, Bethesda, Maryland 20814-6522 (301) 986-6200 Saul Centers, Inc. Reports Third Quarter 2017 Earnings November 2, 2017, Bethesda, MD. Saul Centers, Inc.
SAUL CENTERS, INC. 7501 Wisconsin Avenue, Suite 1500, Bethesda, Maryland 20814-6522 (301) 986-6200 Saul Centers, Inc. Reports Third Quarter 2017 Earnings November 2, 2017, Bethesda, MD. Saul Centers, Inc.
American Tower Corporation: An Overview. November 2012
 American Tower Corporation: An Overview November 2012 Forward-Looking Statements Safe Harbor Statement under the Private Securities Litigation Reform Act of 1995: This presentation contains forward-looking
Highwoods Properties Reports Third Quarter Results. $0.58 FFO per Diluted Share (Excluding Debt Extinguishment Loss and Property Acquisition Costs)
") FOR IMMEDIATE RELEASE Ref: 10-28 Contact: Tabitha Zane Vice President, Investor Relations 919-431-1529 Highwoods Properties Reports Third Quarter Results $0.58 FFO per Diluted Share (Excluding Debt Extinguishment
FOR IMMEDIATE RELEASE Ref: 10-28 Contact: Tabitha Zane Vice President, Investor Relations 919-431-1529 Highwoods Properties Reports Third Quarter Results $0.58 FFO per Diluted Share (Excluding Debt Extinguishment
FIRST QUARTER Supplemental Operating and Financial Data. Camden Sotelo - Tempe, AZ
 FIRST QUARTER 2014 Supplemental Operating and Financial Data Camden Sotelo - Tempe, AZ Camden Las Olas - Ft. Lauderdale, FL Year Built - 2004 420 Apartment Homes 97% Average 1st Quarter 2014 Occupancy
Supplemental information provided by
 Supplemental information provided by Quarterly Supplemental 2nd Quarter 2015 Persimmon Place Grand Opening Dublin, CA Investor Relations irinfo@regencycenters.com One Independent Drive, Suite 114 Jacksonville,
Taubman Centers, Inc. Taubman/Starwood Capital Group Transaction
 Taubman Centers, Inc. Taubman/Starwood Capital Group Transaction June 18, 2014 Forward Looking Language and Use of Non-GAAP Measures For ease of use, references in this presentation to Taubman Centers,
Extra Space Storage Inc. Reports 2017 Third Quarter Results
 Extra Space Storage Inc. Reports 2017 Third Quarter Results November 1, 2017 SALT LAKE CITY, Nov. 1, 2017 /PRNewswire/ -- Extra Space Storage Inc. (NYSE: EXR) (the "Company"), a leading owner and operator
SAUL CENTERS, INC Wisconsin Avenue, Suite 1500, Bethesda, Maryland (301)
") May 3, 2018, Bethesda, MD. SAUL CENTERS, INC. 7501 Wisconsin Avenue, Suite 1500, Bethesda, Maryland 20814-6522 (301) 986-6200 Saul Centers, Inc. Reports First Quarter 2018 Earnings Saul Centers, Inc. (NYSE:
May 3, 2018, Bethesda, MD. SAUL CENTERS, INC. 7501 Wisconsin Avenue, Suite 1500, Bethesda, Maryland 20814-6522 (301) 986-6200 Saul Centers, Inc. Reports First Quarter 2018 Earnings Saul Centers, Inc. (NYSE:
NEWS RELEASE For immediate release
 NEWS RELEASE For immediate release Laura Clark 904 598 7831 LauraClark@RegencyCenters.com Regency Centers Updates 2017 and Introduces 2018 Earnings Guidance JACKSONVILLE, Fla. (January 11, 2018) Regency
OPTIBASE LTD. ANNOUNCES THIRD QUARTER RESULTS
 Media Contacts: Amir Philips, CEO, Optibase Ltd. 011-972-73-7073-700 info@optibase-holdings.com Investor Relations Contact: Marybeth Csaby, for Optibase +1-917-664-3055 Marybeth.Csaby@gmail.com OPTIBASE
Five Oaks Investment Corp.
 Five Oaks Investment Corp. Investor Presentation May 2018 Disclaimer & Name Change This presentation contains forward-looking statements within the meaning of Section 27A of the Securities Act of 1933,
Financial Supplement Table of Contents Fourth Quarter 2017
 Table of Contents Fourth Quarter 2017 Overview PAGE Corporate Information 3 Ownership Structure 5 Key Quarterly Financial Data 6 Consolidated Statements of Operations Earnings Release 8 2018 Outlook 11
4th Quarter Quarterly Supplemental
 Quarterly Supplemental 4th Quarter 2017 The Hub Hillcrest Market San Diego, CA Aventura Shopping Center Aventura, FL 4S Commons Town San Diego, CA Investor Relations irinfo@regencycenters.com One Independent
FOR IMMEDIATE RELEASE: Equity One Reports Fourth Quarter and Year End 2014 Operating Results
 Equity One, Inc. For additional information: 410 Park Avenue, Suite 1220 Mark Langer, EVP and New York, NY 10022 Chief Financial Officer 212-796-1760 FOR IMMEDIATE RELEASE: Equity One Reports Fourth Quarter
SECURITIES AND EXCHANGE COMMISSION FORM 424B3. Prospectus filed pursuant to Rule 424(b)(3)
(3)") SECURITIES AND EXCHANGE COMMISSION FORM 424B3 Prospectus filed pursuant to Rule 424(b)(3) Filing Date: 2007-06-06 SEC Accession No. 0001104659-07-045689 (HTML Version on secdatabase.com) Inland American
SECURITIES AND EXCHANGE COMMISSION FORM 424B3 Prospectus filed pursuant to Rule 424(b)(3) Filing Date: 2007-06-06 SEC Accession No. 0001104659-07-045689 (HTML Version on secdatabase.com) Inland American
4th Quarter Quarterly Supplemental
 Quarterly Supplemental 4th Quarter 2018 Ballard Blocks Seattle, WA 4S Commons Town Center San Diego, CA Nocatee Town Center Ponte Vedra, FL Investor Relations irinfo@regencycenters.com One Independent