RPX Manhattan Neighborhood Prices
|
|
|
- Gillian Fox
- 6 years ago
- Views:
Transcription


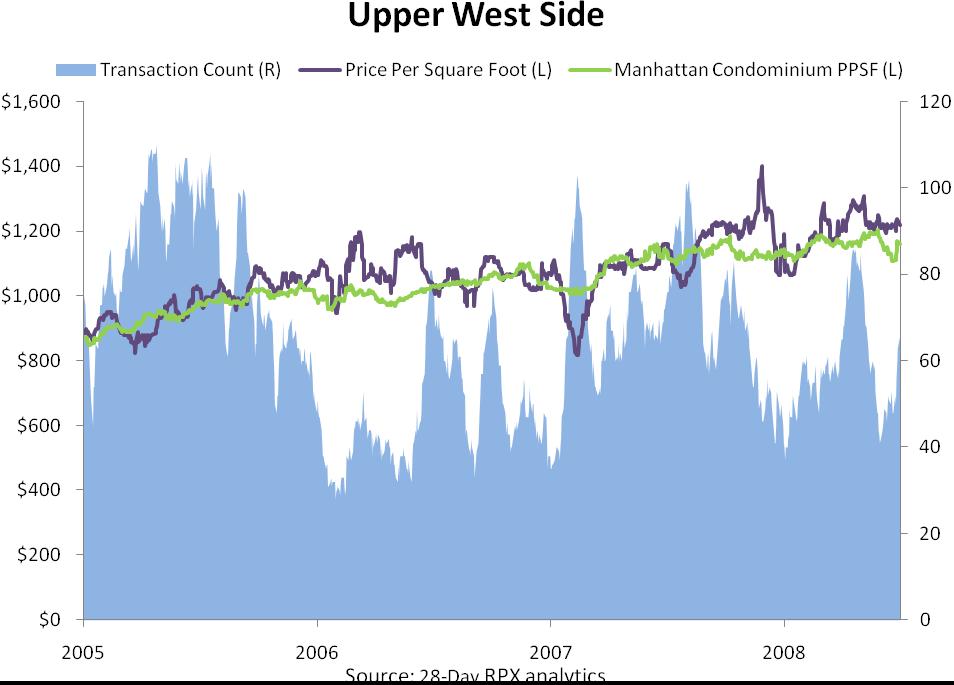
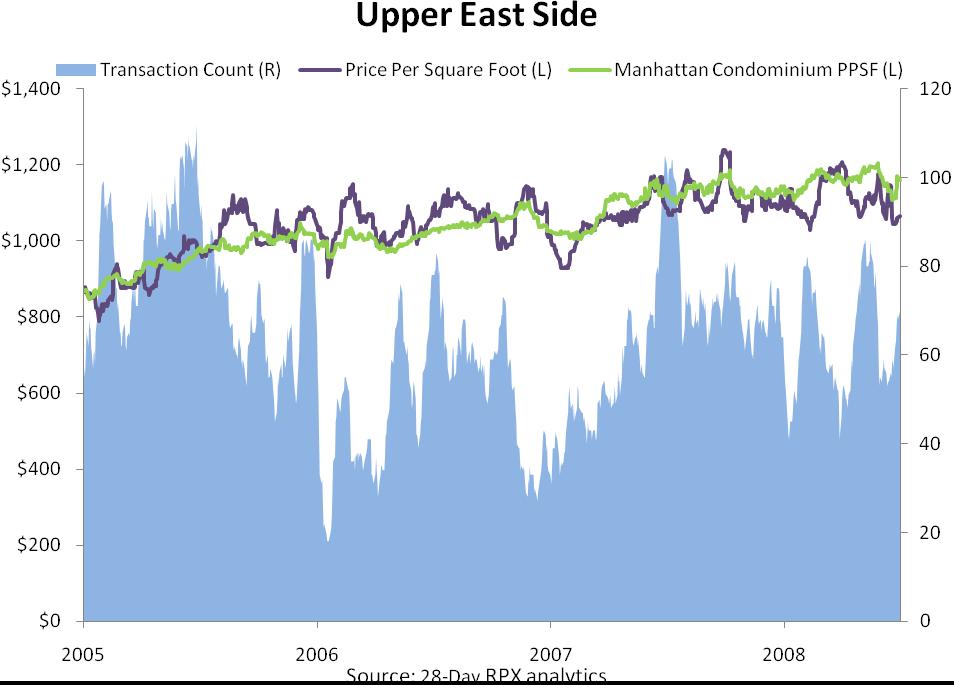
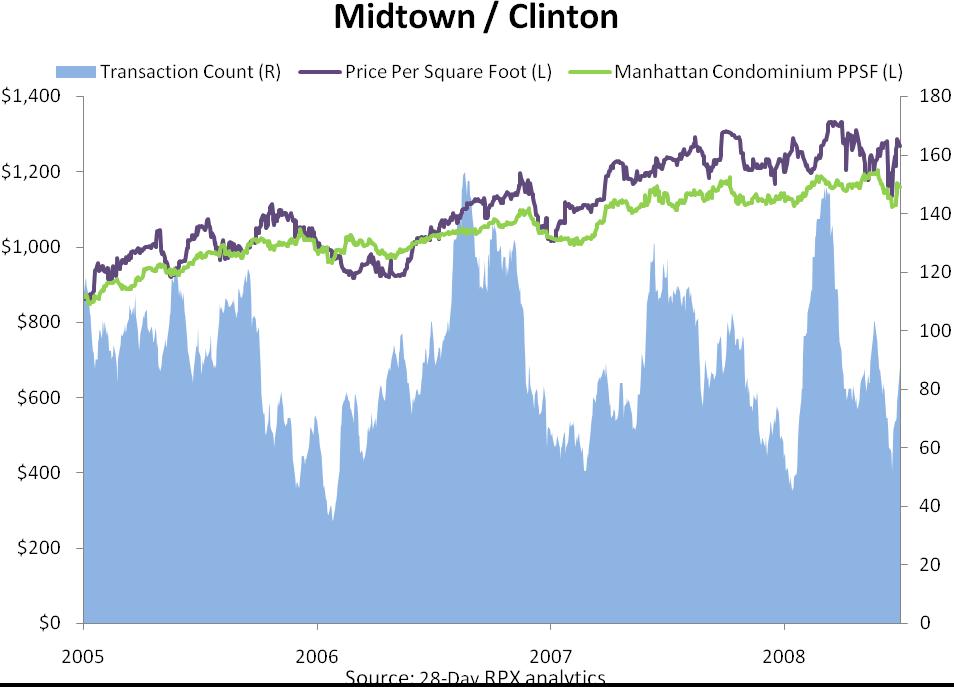
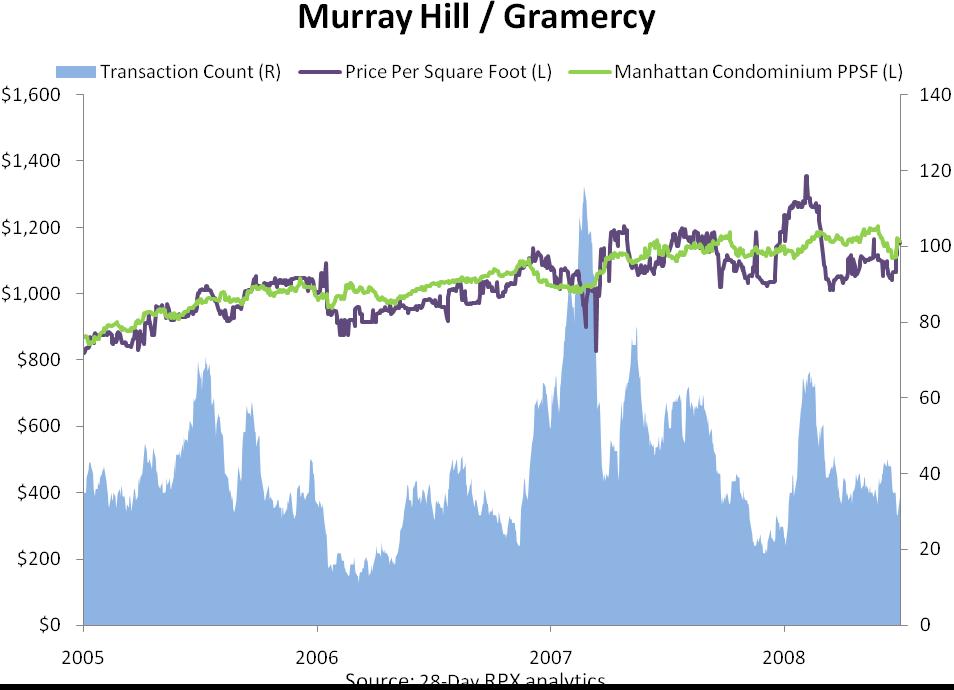
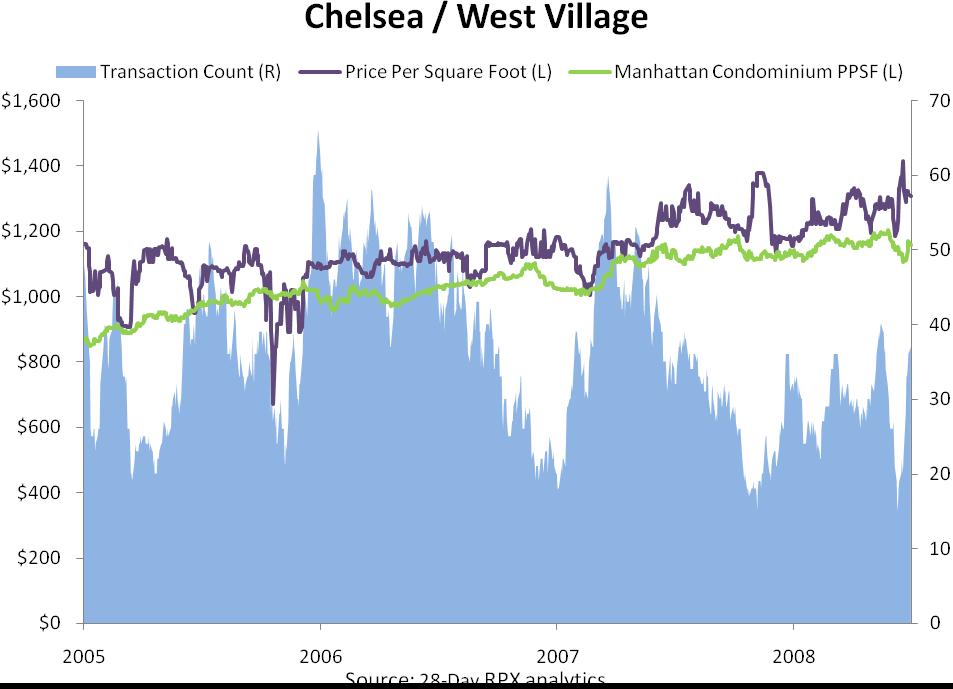
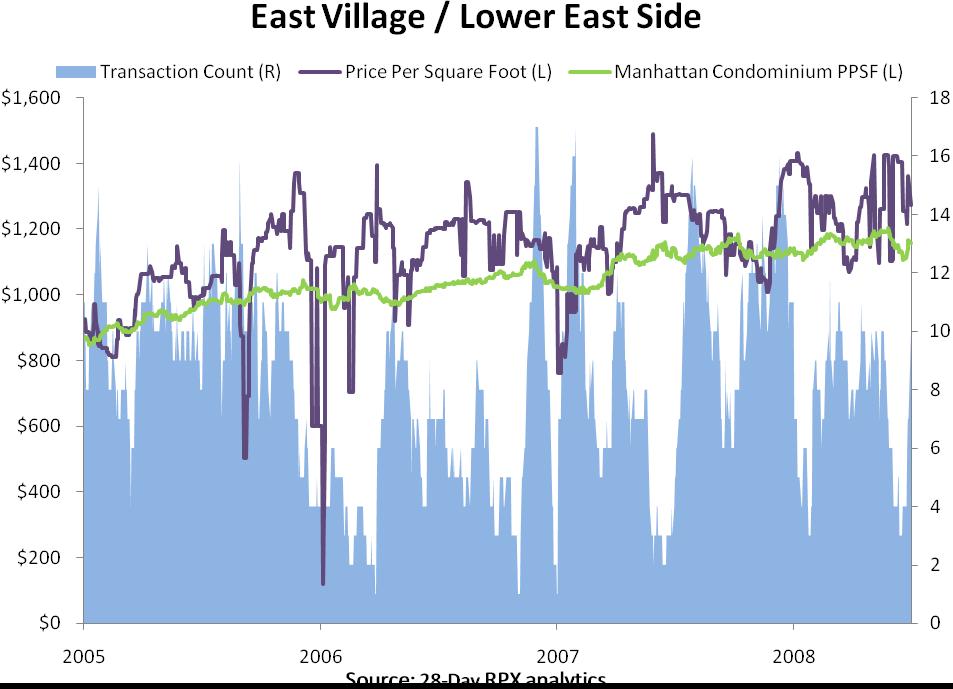
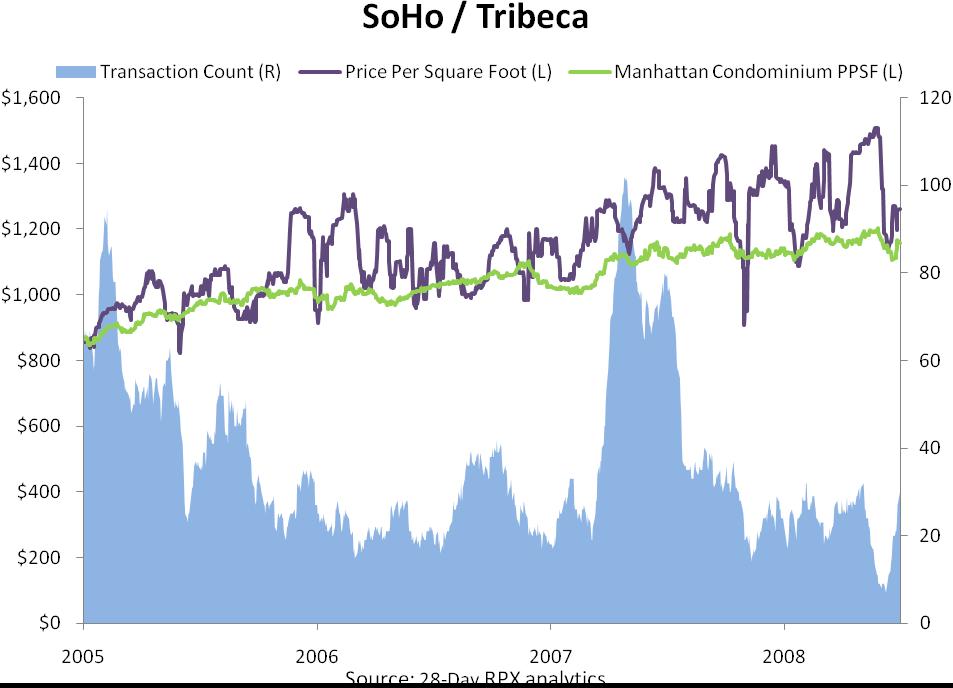
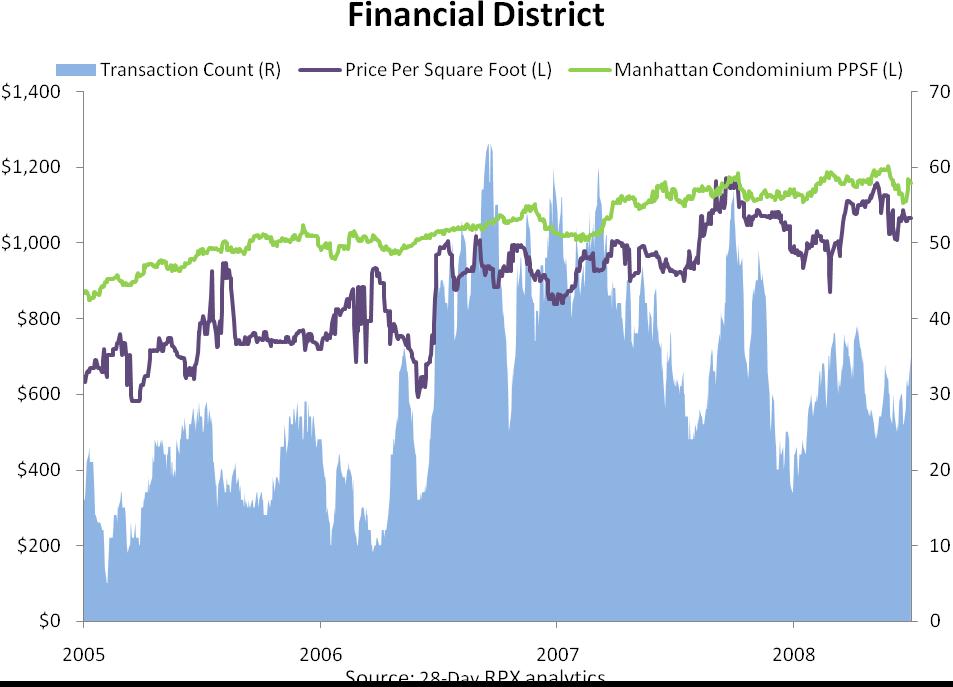
1 RPX Manhattan Neighborhood Prices RPX Manhattan Neighborhood Prices Radar Logic continually reviews new information products as part of its effort to enable real estate and financial professionals to buy, sell and analyze residential real estate as a tradable asset class. Our latest offerings are the RPX Manhattan Neighborhood Prices, which track home prices in the following eight Manhattan neighborhoods: the Upper West Side, the Upper East Side, Midtown/Clinton, Murray Hill/Gramercy, Chelsea/West Village, East Village/Lower East Side, SoHo/Tribeca, and the Financial District. These prices are calculated using data from condominium sales, which make up a sizable and increasing percentage of residential property transactions in Manhattan. Neighborhood boundaries are defined according to a neighborhood s constituent zip codes and align closely with widely recognized boundaries. RPX Manhattan Neighborhood Prices are calculated for each trading day using 28-day prices from the Manhattan Condominium data set. They will be published at the end of each month and will be supported by RPX analytics. Neighborhood Constituent Zip Codes Upper West Side 10023, 10024, Upper East Side 10021, 10028, 10065, 10075, Midtown / Clinton 10017, 10018, 10019, 10020, 10022, Murray Hill / Gramercy 10010, Chelsea / West Village 10001, 10011, East Village / Lower East Side 10002, 10003, SoHo / Tribeca 10007, 10012, Financial District 10004, 10005, 10006, 10038, The Manhattan Condominium Price has consistently ranked at the top of RPX markets in terms of median price per square foot (PPSF). Many of the Manhattan Neighborhoods have even higher PPSF levels. On July 1, 2008, for example, Manhattan condos had a 28-day PPSF of $1, while Chelsea/West Village had a PPSF of $1, and East Village/Lower East Side had a PPSF of $1, The charts on the following pages depict historical pricing and transaction counts for all eight RPX Manhattan Neighborhoods.
2
3
4
5
6 A Valuable New Source of Market Information Radar Logic is dedicated to advancing the use of property derivatives as a tool for financial and real estate professionals. Manhattan is a large and diversified real estate market, making neighborhood data important and useful. Developers, brokers and homebuyers will be able to use this information to better understand closingbased valuations for specific neighborhoods. Financial firms will be able to use this information to evaluate investment opportunities and manage risks in existing portfolios. A Basis for Innovative Investment Strategies RPX Manhattan Neighborhood Prices capture neighborhood-level price dynamics that are frequently masked by metro-level dynamics in indices with broader geographic scope. As a result, the Neighborhood Prices will enable financial and real estate professionals to use RPX-based financial instruments in investment strategies focused on individual neighborhoods and individual real estate assets. Investors and developers will have greater flexibility to act upon information about specific neighborhoods. Developers will be able to use RPX-based instruments to manage their exposure to the neighborhood housing market. As a result, they will be able to harvest the premiums they can command relative to market returns even if prices in the neighborhood decrease. Investors will be able to use RPX-based financial instruments to manage their real estate exposure in ways that are not possible in bricks-and-mortar property markets. Investors and developers will be able to take advantage of near-term price appreciation that otherwise might have passed them by while they were searching for properties or assembling parcels. To learn more about these and other uses of RPX-based financial products, contact a licensed RPX dealer. A list of licensed dealers is available at
, a market that enables real estate to be traded as a liquid asset, via property derivatives marketed by major financial")
7 About Radar Logic Radar Logic Incorporated, a real estate data and analytics company, calculates and publishes the Radar Logic Daily Prices. The prices track housing values for major U.S. metropolitan areas and are the basis of the Residential Property Index (RPX ), a market that enables real estate to be traded as a liquid asset, via property derivatives marketed by major financial institutions. RPX allows real estate and financial professionals to manage opportunity and risk, invest in real estate values without owning physical assets and effectively analyze markets using a consistent metric: price per square foot. The price per square foot metric significantly reduces the influence of property sizes on overall housing price trends, which can skew results. The Daily Prices for each MSA are not adjusted for seasonal variations. In some cases, Daily Prices may vary based on reporting characteristics within individual MSAs. The RPX Monthly Housing Market Report, published 63 days after the last transaction date of every month, provides insight and detailed analysis of Radar Logic s 25 MSAs and the Manhattan Condominium market. This study is based on the premise that there is no unitary national housing market; rather, each MSA, while having some economic influences in common, is influenced primarily by local conditions. RPX Analytics & Research Radar Logic offers specialized analytic services which allow real estate and financial professionals to view current and historical price per square foot and transaction count trends for all markets and sub-markets we track. MSAs can be segmented by location (zip code and county), property type (single family, multi-family and condo), property size, date range, and sale price. The database is derived from our neutral, public source records. Historical and daily price and transaction counts are available through our website at Our web-based tools provide a means for all entities associated with or affected by housing prices to maintain market data streams on a constant, neutral and daily updated basis. For more information about research or analytic products, please contact: Radar Logic Incorporated. 379 West Broadway, Suite 401 New York, New York (212) info@radarlogic.com
Release Date: May 21, 2009 March Key Characteristics
 Release Date: May 21, 2009 March 2009 Key Characteristics The RPX 25-MSA Composite has stabilized since January 2009, after being in virtual freefall for much of 2008. The Composite declined only 0.3 percent
An Introduction to RPX INTRODUCTION
 An Introduction to RPX INTRODUCTION Radar Logic is a real estate information company based in New York. We convert public residential closing data into information about the state and prospects for the
Manhattan New Dev. Market Report st Quarter mns.com
 Manhattan New Dev. Market Report 2013 1st Quarter TABLE OF CONTENTS Manhattan New Development Report 1Q13 TABLE OF CONTENTS 03 Introduction 04 Market Snapshot 09 Neighborhood Trends 09 Battery Park City
Homebuyers in the Manhattan
 Manhattan Condo Market Report October by the numbers.% Price Index (MonthoverMonth).% Price Forecast (MonthoverMonth) +.% Inventory (Monthover Month) +.% Number of Pending Sales (Monthover Month) days
Informed Decisions Are Based on Actionable Data.
 Informed Decisions Are Based on Actionable Data. NIC MAP products offer you the timely data you need to measure and benchmark property performance in the market; segment competition in a primary market;
Manhattan New Dev. Market Report th Quarter mns.com
 Manhattan New Dev. Market Report 2012 4th Quarter TABLE OF CONTENTS TABLE OF CONTENTS 03 Introduction 04 Market Snapshot 09 Neighborhood Trends 09 Battery Park City 10 Chelsea 11 East Village 12 Financial
Increasing Foreclosures Could Hurt Demand for Homes, Slowing Housing Recovery
 Release Date: April 22, 2010 February 2010 Quinn W. Eddins, Director of Research New Radar Logic data packages are available at /productsservices_analytics.html Increasing Foreclosures Could Hurt Demand
Manhattan New Dev. Market Report nd Quarter mns.com
 Manhattan New Dev. Market Report 2014 2nd Quarter TABLE OF CONTENTS Manhattan New Development Report 2Q14 TABLE OF CONTENTS 03 Introduction 04 Market Snapshot 09 Neighborhood Trends 09 Battery Park City
Hamilton Heights Manhattan. Morningside Heights Harlem
 Sutton Area TriBeCa Upper East Side Upper West Side Washington Heights West Village The Corcoran Report Battery Park City Beekman Carnegie Hill Central Park South Chelsea Flatiron Clinton East Harlem East
Manhattan Residential Rental Market Report
 Manhattan Residential Rental Market Report December & Fourth Quarter 217 Residential Rental Market Report December & Fourth Quarter 217 This report follows overall conditions in the Manhattan rental market
The Manhattan real estate market
 Manhattan Market Report Q 04 by the numbers +.6% StreetEasy Condo Price Index (QuarteroverQuarter) 0.% StreetEasy Condo Price Forecast (MonthoverMonth) 6.0% Total (QuarteroverQuarter) 6.0% Number of Pending
Morningside Heights Harlem. Peter Comitini Senior VP Associate Broker The Corcoran Group
 Sutton Area TriBeCa Upper East Side Upper West Side Washington Heights West Village The Corcoran Report Battery Park City Beekman Carnegie Hill Central Park South Chelsea Flatiron Clinton East Harlem East
MANHATTAN NEW DEVELOPMENT REPORT 2012 FIRST QUARTER 1 MNS 115 EAST 23 RD STREET, NEW YORK, NY MNS.
 TM MANHATTAN NEW DEVELOPMENT REPORT 2012 FIRST QUARTER 1 TABLE OF CONTENTS Introduction 3 Market Snapshot 4 Neighborhood Price Trends Harlem 9 Upper West Side 10 Upper East Side 11 Midtown West 12 Midtown
New Development Report
 New Development Report 2017 Third Quarter MANHATTAN $ 2,537 PER SQ. FT. ACTIVE $ 2,138 PER SQ. FT. CONTRACT SIGNED $ 2,096 PER SQ. FT. CLOSED BROOKLYN $ 1,468 PER SQ. FT. ACTIVE $ 1,423 PER SQ. FT. CONTRACT
MANHATTAN NEW DEVELOPMENT REPORT 2011 FOURTH QUARTER 1 MNS 115 EAST 23 RD STREET, NEW YORK, NY MNS.
 TM MANHATTAN NEW DEVELOPMENT REPORT 2011 FOURTH QUARTER 1 TABLE OF CONTENTS Introduction 3 Market Snapshot 4 Neighborhood Price Trends Harlem 9 Upper West Side 10 Upper East Side 11 Midtown West 12 Midtown
New Development Report
 New Development Report 2018 First Quarter MANHATTAN $ 2,513 $ 2,185 $ 2,152 3.7% YoY PER SQ. FT. ACTIVE PER SQ. FT. CONTRACT SIGNED PER SQ. FT. CLOSED 1% YoY 4.1% YoY BROOKLYN $ 1,475 PER SQ. FT. ACTIVE
Manhattan New Dev. Market Report th Quarter mns.com
 Manhattan New Dev. Market Report 2015 4th Quarter TABLE OF CONTENTS Manhattan New Development Report 4Q15 TABLE OF CONTENTS 03 Introduction 04 Market Snapshot 09 Neighborhood Trends 09 Battery Park City
MANHATTAN NEW DEVELOPMENT REPORT
 manhattan new development REPORT 2q2011 MEAN MANHATTAN RENTAL PRICES TM MANHATTAN NEW DEVELOPMENT REPORT 1 2011 SECOND QUARTER manhattan new development REPORT 2q2011 TABLE OF CONTENTS Introduction 3 Market
November 2018 Washington, DC Market Trends Report Median sales price highest November level in past 10 years
 FOR IMMEDIATE RELEASE Contact: Bryan Frantz 202.626.0097 Communications Specialist District of Columbia Association of REALTORS bfrantz@dcrealtors.org November 2018 Washington, DC Market Trends Report
New Development Year-End Report
 New Development Year-End Report MANHATTAN $ 2,215 AVERAGE PRICE PER SQ. FT. CONTRACT SIGNED BROOKLYN $ 1,129 AVERAGE PRICE PER SQ. FT. CONTRACT SIGNED $ 2,86 $ 997 AVERAGE PRICE PER SQ. FT. CLOSED AVERAGE
May 2018 Washington, DC Market Trends Report Sales at record high for May while supply remains scarce
 FOR IMMEDIATE RELEASE Contact: Bryan Frantz 202-626-0097 Communications Specialist District of Columbia Association of REALTORS bfrantz@dcrealtors.org May 2018 Washington, DC Market Trends Report Sales
Manhattan Residential Rental Market Report
 average $2,33 $2,755 $3,15 $4,312 median $2,155 $2,525 $3,1 $3,6 Washington Harlem $4,8 $3,225 Morningside $4,22 $3,835 $3,4 $3,35 Upper Side $3,939 $3,4 C e n t r a l P a r k $4,876 $4,498 $3,45 $4,125
April 2018 Washington, DC Market Trends Report Home sales up 9.4 percent; median sales price reaches highest April on record
 N FOR IMMEDIATE RELEASE Contact: Bobette Banks 301-590-8764 Director of Communications Greater Capital Area Association of REALTORS bbanks@gcaar.com April 2018 Washington, DC Market Trends Report Home
Manhattan Residential Rental Market Report
 Manhattan Residential Rental Market Report June & Second Quarter 218 Residential Rental Market Report June & Second Quarter 218 This report follows conditions in the Manhattan rental market during June
CITI HABITATS. Manhattan Residential Sales Market Report
 Manhattan Residential Sales Market Report Contents 4/7 12/17 3 8 9 10 Market Wide 4 Sales / Days on Market 5 / Months of Supply 6 7 Market Share Resale Co-ops Resale Condos New Developments 11 Luxury Neighborhoods
Residential December 2009
 Residential December 2009 Karl L. Guntermann Fred E. Taylor Professor of Real Estate Adam Nowak Research Associate Year End Review The dramatic decline in Phoenix house prices caused by an unprecedented
Manhattan Rental Market Report November 2014 mns.com
 Manhattan Rental Market Report November 2014 TABLE OF CONTENTS 03 Introduction 04 A Quick Look 07 Mean Manhattan Rental Prices 11 Manhattan Price Trends 12 Neighborhood Price Trends 12 Battery Park City
Release Date: July 23, 2009 May 2009
 Release Date: July 23, 2009 May 2009 Key Characteristics The RPX is designed to be a daily indication of the spot price for residential real estate and, as such, may provide an early view of trends in
Manhattan Rental Market Report November 2015 mns.com
 Manhattan Rental Market Report November 2015 TABLE OF CONTENTS 03 Introduction 04 A Quick Look 07 Mean Manhattan Rental Prices 11 Manhattan Price Trends 12 Neighborhood Price Trends 12 Battery Park City
Manhattan New Dev. Market Report th Quarter mns.com
 Manhattan New Dev. Market Report 2017 4th Quarter TABLE OF CONTENTS TABLE OF CONTENTS 03 Introduction 04 Market Snapshot 09 Neighborhood Trends 09 Battery Park City 10 Chelsea 11 East Village 12 Financial
Peter Comitini Senior VP Associate Broker The Corcoran Group
 Sutton Area TriBeCa Upper East Side Upper West Side Washington Heights West Village Battery Park City Beekman Carnegie Hill Central Park South Chelsea Flatiron Clinton East Harlem East Village Financial
MANHATTAN RENTAL MARKET REPORT
 MANHATTAN RENTAL MARKET REPORT AUGUST 2018 TABLE OF CONTENTS 03 INTRODUCTION 04 A QUICK LOOK 07 MEAN MANHATTAN RENTAL PRICES 11 MANHATTAN PRICE TRENDS 12 NEIGHBORHOOD PRICE TRENDS 12 BATTERY PARK CITY
Hamilton Heights Manhattan. Morningside Heights Harlem
 Sutton Area TriBeCa Upper East Side Upper West Side Washington Heights West Village The Corcoran Report Battery Park City Beekman Carnegie Hill Central Park South Chelsea Flatiron Clinton East Harlem East
BONDREPORT QTR BONDREPORT QTR BONDNEWYORK.COM
 BONDREPORT QTR 4 2017 WELCOME TO THE 19 TH EDITION OF THE BOND REPORT It has been quite the year on many fronts, and by all indications, 2017 has no intention of going quietly. The market has continued
New Development Year-End Report
 New Development Year-End Report MANHATTAN 2,775 PER SQ. FT. ACTIVE 2,268 BROOKLYN 1,34 PER SQ. FT. ACTIVE 1,335 PER SQ. FT. CONTRACT SIGNED PER SQ. FT. CONTRACT SIGNED 1,98 1,167 PER SQ. FT. CLOSED PER
THE MANHATTAN RENTAL MARKET REPORT
 TM THE MANHATTAN RENTAL MARKET REPORT AUGUST 2011 1 TABLE OF CONTENTS Introduction 3 A Quick Look 4 Mean Manhattan Rental Prices 8 Manhattan Price Trends 10 Neighborhood Price Trends Harlem 11 Upper West
FOR IMMEDIATE RELEASE Contact: Bobette Banks Director of Communications Greater Capital Area Association of REALTORS
 FOR IMMEDIATE RELEASE Contact: Bobette Banks 301-590-8764 Director of Communications Greater Capital Area Association of REALTORS bbanks@gcaar.com April 2016 Washington, DC Market Trends Report Sales and
FOR IMMEDIATE RELEASE Contact: Bobette Banks Director of Communications Greater Capital Area Association of REALTORS
 FOR IMMEDIATE RELEASE Contact: Bobette Banks 301-590-8764 Director of Communications Greater Capital Area Association of REALTORS bbanks@gcaar.com December 2018 Washington, DC Market Trends Report DC closes
New Development Year-End Report
 New Development Year-End Report 2017 MANHATTAN $ 2,610 $ 2,282 $ 2,133 0.9% YoY PER SQ. FT. ACTIVE 2.2% YoY PER SQ. FT. CONTRACT SIGNED 2.3% YoY PER SQ. FT. CLOSED BROOKLYN $ 1,440 PER SQ. FT. ACTIVE $
MONTGOMERY COUNTY APRIL 2018
 STATPAK MONTGOMERY COUNTY APRIL 2018 McEnearney.com MARKET IN A MINUTE A SUMMARY OF MARKET CONDITIONS FOR MARCH 2018 Contract activity in March 2018 was down 6.0% from March 2017, and there were decreases
Manhattan Rental Market Report March 2018 mns.com
 Manhattan Rental Market Report March 2018 TABLE OF CONTENTS 03 Introduction 04 A Quick Look 07 Mean Manhattan Rental Prices 11 Manhattan Price Trends 12 Neighborhood Price Trends 12 Battery Park City 13
BONDREPORT QTR BONDNEWYORK.COM
 BONDREPORT QTR 4 2018 BONDREPORT QTR 4 2018 WELCOME TO THE 23RD EDITION OF THE BOND REPORT Looking back on 2018, the year can perhaps best be described as a consistent movement towards corrections. After
May 2016 Washington, DC Market Trends Report Listings continue to move quickly as sales climb nearly 14 percent
 FOR IMMEDIATE RELEASE Contact: Bobette Banks 301-590-8764 Director of Communications Greater Capital Area Association of REALTORS bbanks@gcaar.com May 2016 Washington, DC Market Trends Report Listings
RPX HOUSING MARKET REVIEW
 Release Date: January 5, 2012 RPX HOUSING MARKET REVIEW SPECIAL EDITION Housing is the largest asset class in America. It touches everyone s life. It is at the center of our economy and our economic well
May 2013 April 2013 May 2012 Manhattan Condo Index 2,106 2, % 1, %
 Market Report NOTICE: StreetEasy is pleased to present our 2013 Q2 Quarterly Report on the residential market. This preview version of the report is based on over 1,000 broker sources and will provide
The Corcoran Report 3Q17 MANHATTAN
 The Corcoran Report 3Q17 MANHATTAN Contents Third Quarter 2017 4/7 12/23 3 Overview 8 9 10 Market Wide 11 Luxury 24 4 Sales / Days on Market 5 Inventory / Months of Supply 6 7 Market Share Resale Co-ops
Residential January 2010
 Residential January 2010 Karl L. Guntermann Fred E. Taylor Professor of Real Estate Adam Nowak Research Associate Another improvement to the ASU-RSI is introduced this month with new indices for foreclosure
Year-End Manhattan Market Report
 DECEMBER 2017 DECEMBER 2017 Year-End Manhattan Market Report Under Embargo Until Wednesday, December 13 at 12:01 a.m. CityRealty is the website for NYC real estate, providing high-quality listings and
Manhattan Rental Market Report October 2017 mns.com
 Manhattan Rental Market Report October 2017 TABLE OF CONTENTS 03 Introduction 04 A Quick Look 07 Mean Manhattan Rental Prices 11 Manhattan Price Trends 12 Neighborhood Price Trends 12 Battery Park City
December 2018 Montgomery County Market Trends Report Median sales rise slightly from 2017; Active listings increase 5.1 percent
 FOR IMMEDIATE RELEASE Contact: Bobette Banks 301-590-8764 Director of Communications Greater Capital Area Association of REALTORS bbanks@gcaar.com December 2018 Montgomery County Market Trends Report Median
Manhattan Rental Market Report August 2013 mns.com
 Manhattan Rental Market Report August 2013 TABLE OF CONTENTS 03 Introduction 04 A Quick Look 07 Mean Manhattan Rental Prices 11 Manhattan Price Trends 12 Neighborhood Price Trends 12 Battery Park City
January 2017 Washington, DC Market Trends Report Median Sales Price Up 4.6 percent Reaches Highest January Level on Record
 FOR IMMEDIATE RELEASE Contact: Bobette Banks 301-590-8764 Director of Communications Greater Capital Area Association of REALTORS bbanks@gcaar.com January 2017 Washington, DC Market Trends Report Median
July 2016 Washington, DC Market Trends Report July home prices remain at record highs in the District
 FOR IMMEDIATE RELEASE Contact: Bobette Banks 301-590-8764 Director of Communications Greater Capital Area Association of REALTORS bbanks@gcaar.com July 2016 Washington, DC Market Trends Report July home
THE MANHATTAN RENTAL MARKET REPORT
 TM THE MANHATTAN RENTAL MARKET REPORT YEAR END 2011 TABLE OF CONTENTS Introduction 3 Notable Trends 4 Mean Manhattan Rental Prices 5 Neighborhood Price Trends Harlem 7 Upper West 7 Upper East 7 Midtown
Manhattan Rental Market Report January 2018 mns.com
 Manhattan Rental Market Report January 2018 TABLE OF CONTENTS 03 Introduction 04 A Quick Look 07 Mean Manhattan Rental Prices 11 Manhattan Price Trends 12 Neighborhood Price Trends 12 Battery Park City
MANHATTAN RENTAL MARKET REPORT august 2012 AUGUST 2012
 MANHATTAN RENTAL MARKET REPORT august 2012 TM T H E M A N H AT TA N R E N TA L M A R K E T R E P O R T AUGUST 2012 MNS 1 1 5 E A S T 2 3 RD S T R E E T, N E W Y O R K, N Y 1 0 0 1 0 212.475.9000 INFO@MNS.COM
7224 Nall Ave Prairie Village, KS 66208
 Real Results - Income Package 10/20/2014 TABLE OF CONTENTS SUMMARY RISK Summary 3 RISC Index 4 Location 4 Population and Density 5 RISC Influences 5 House Value 6 Housing Profile 7 Crime 8 Public Schools
THE AGGREGATETM 4TH QUARTER 2015
 THE AGGREGATETM 4TH QUARTER INTRODUCTION 4TH QUARTER Welcome to The Aggregate, the quarterly residential market report published by TOWN Residential. As New York s leading fully-integrated residential
Residential October 2009
 Residential October 2009 Karl L. Guntermann Fred E. Taylor Professor of Real Estate Adam Nowak Research Associate Summary The latest data for July 2009 reveals that house prices declined by 28 percent
THE MANHATTAN RENTAL MARKET REPORT
 TM THE MANHATTAN RENTAL MARKET REPORT JULY 2012 1 TABLE OF CONTENTS Introduction 3 A Quick Look 4 Mean Manhattan Rental Prices 8 Manhattan Price Trends 10 Neighborhood Price Trends Harlem 11 Upper West
January 2019 Montgomery County Market Trends Report Average sales and new listings increase; closed sales decline
 FOR IMMEDIATE RELEASE Contact: Bobette Banks 301-590-8764 Director of Communications Greater Capital Area Association of REALTORS bbanks@gcaar.com January 2019 Montgomery County Market Trends Report Average
November 2018 Montgomery County Market Trends Report Median sales price reaches highest November level in 10 years
 FOR IMMEDIATE RELEASE Contact: Bobette Banks 301-590-8764 Director of Communications Greater Capital Area Association of REALTORS bbanks@gcaar.com November 2018 Montgomery County Market Trends Report Median
Monthly Market Data Report
 487 - S MARKET DATA REPORT Monthly Market Data Report Report Characteristics Report Name: Monthly Market Data Report Report Date Range: 5/2017 5/2018 : Location Avg/Med: Avg Only Include Metrics By: County
M A N H AT T A N N E W D E V E L O P M E N T R E P O R T S E C O N D Q U A R T E R
 TM M A N H AT TA N N E W D E V E L O P M E N T R E P O R T 2012 SECOND QUARTER 1 MNS 1 1 5 E A S T 2 3 RD S T R E E T, N E W Y O R K, N Y 1 0 0 1 0 212.475.9000 INFO@MNS.COM MNS.COM TABLE OF CONTENTS Introduction
Manhattan Rental Market Report Year End 2012 mns.com
 Manhattan Rental Market Report Year End 2012 TABLE OF CONTENTS 03 Introduction 04 Notable Trends 06 Mean Manhattan Rental Prices 08 Neighborhood Price Trends 08 Battery Park City 08 Chelsea 08 East Village
June 2018 Washington, DC Market Trends Report Median sales price reaches highest June level on record
 FOR IMMEDIATE RELEASE Contact: Bobette Banks 301-590-8764 Director of Communications Greater Capital Area Association of REALTORS bbanks@gcaar.com June 2018 Washington, DC Market Trends Report Median sales
March 2016 Washington, DC Market Trends Report March sales represent a 12 percent increase; top the five-year March average
 FOR IMMEDIATE RELEASE Contact: Bobette Banks 301-590-8764 Director of Communications Greater Capital Area Association of REALTORS bbanks@gcaar.com March 2016 Washington, DC Market Trends Report March sales
March 2018 Washington, DC Market Trends Report Median sales price reaches highest March level on record
 FOR IMMEDIATE RELEASE Contact: Bryan Frantz 301-590-8765 Communications Specialist District of Columbia Association of REALTORS bfrantz@dcrealtors.org March 2018 Washington, DC Market Trends Report Median
September 2017 Montgomery County Market Trends Report Median sales price highest since September 2007
 FOR IMMEDIATE RELEASE Contact: Bobette Banks 301-590-8764 Director of Communications Greater Capital Area Association of REALTORS bbanks@gcaar.com September 2017 Montgomery County Market Trends Report
January 2018 Washington, DC Market Trends Report Closed sales reach highest January level since 2005
 FOR IMMEDIATE RELEASE Contact: Bobette Banks 301-590-8764 Director of Communications Greater Capital Area Association of REALTORS bbanks@gcaar.com January 2018 Washington, DC Market Trends Report Closed
June 2017 Montgomery County Market Trends Report Median sales price up 1.1 percent highest for June since 2008
 FOR IMMEDIATE RELEASE Contact: Bobette Banks 301-590-8764 Director of Communications Greater Capital Area Association of REALTORS bbanks@gcaar.com June 2017 Montgomery County Market Trends Report Median
August 2015 Washington, DC Market Trends Report Limited supply, high demand continue pushing prices to record highs
 FOR IMMEDIATE RELEASE Contact: Bobette Banks 301-590-8764 Director of Communications Greater Capital Area Association of REALTORS bbanks@gcaar.com August 2015 Washington, DC Market Trends Report Limited
The Corcoran Report 4Q16 MANHATTAN
 The Corcoran Report 4Q16 MANHATTAN Contents Fourth Quarter 2016 4/7 12/23 3 Overview 8 9 10 Market Wide 11 Luxury 24 2 Sales / Days on Market 3 Inventory / Months of Supply 4 5 Market Share Resale Co-ops
Residential March 2010
 Residential March 2010 Karl L. Guntermann Fred E. Taylor Professor of Real Estate Adam Nowak Research Associate The latest data for December 2009 reveals that overall house prices declined by 13 percent
Manhattan Rental Market Report March 2016 mns.com
 Manhattan Rental Market Report March 2016 TABLE OF CONTENTS 03 Introduction 04 A Quick Look 07 Mean Manhattan Rental Prices 11 Manhattan Price Trends 12 Neighborhood Price Trends 12 Battery Park City 13
Manhattan Rental Market Report December 2017 mns.com
 Manhattan Rental Market Report December 2017 TABLE OF CONTENTS 03 Introduction 04 A Quick Look 07 Mean Manhattan Rental Prices 11 Manhattan Price Trends 12 Neighborhood Price Trends 12 Battery Park City
Monthly Market Data Report
 MARKET DATA REPORT Monthly Market Data Report Report Characteristics Report Name: Monthly Market Data Report Report Date Range: 7/2015 7/2016 : Location Avg/Med: Avg Only Include Metrics By: County Run
SEPTEMBER Monthly Market Report
 SEPTEMBER 2018 2 4 7 8 Monthly Market Report Summary The average sales price in Manhattan rose in the four weeks leading up to August 1, as did the number of recorded sales. The average sales price for
Manhattan condo prices rose to
 Manhattan Market Report Q4 4 by the numbers +.8% StreetEasy Condo Price Index (QuarteroverQuarter) +.4% StreetEasy Condo Price Forecast (MonthoverMonth).7% Total (QuarteroverQuarter) +5.7% Number of Pending
Market Segmentation: The Omaha Condominium Market
 Market Segmentation: The Omaha Condominium Market Roger P. Sindt Steven Shultz University of Nebraska at Omaha Introduction A highly visible and growing niche in the homeownership market is the condominium
Definitions. CPI is a lease in which base rent is adjusted based on changes in a consumer price index.
 Annualized Rental Income is rental revenue under our leases on Operating Properties on a straight-line basis, which includes the effect of rent escalations and any tenant concessions, such as free rent,
March 2018 Montgomery County Market Trends Report Median sales price reaches highest March level on record; days-on-market down from 2017
 FOR IMMEDIATE RELEASE Contact: Bobette Banks 301-590-8764 Director of Communications Greater Capital Area Association of REALTORS bbanks@gcaar.com March 2018 Montgomery County Market Trends Report Median
November 2017 Washington, DC Market Trends Report Median sales price ties last year for highest November level on record
 FOR IMMEDIATE RELEASE Contact: Bobette Banks 301-590-8764 Director of Communications Greater Capital Area Association of REALTORS bbanks@gcaar.com November 2017 Washington, DC Market Trends Report Median
Monthly Indicators + 5.9% - 6.6% + 8.1%
 ly Indicators A RESEARCH TOOL PROVIDED BY METRO MLS FOR ACTIVITY IN THE 4-COUNTY MILWAUKEE METROPOLITAN AREA 2019 Quick Facts Despite a strong U.S. economy, historically low unemployment and steady wage
Leasing activity remains strong through February; Downtown off to best start in years 10.0% 5.0%
 Office March 2017 New York Monthly Market Update Leasing activity remains strong through February; Downtown off to best start in years Manhattan Class A Asking Rents Manhattan Class A Vacancy Rents $100.00
MONTGOMERY COUNTY JANUARY 2019 MARKET IN A MINUTE A SUMMARY OF MARKET CONDITIONS FOR DECEMBER & 4TH QUARTER 2018
 STATPAK MONTGOMERY COUNTY JANUARY 2019 McEnearney.com MARKET IN A MINUTE A SUMMARY OF MARKET CONDITIONS FOR DECEMBER & 4TH QUARTER 2018 Contract activity in December 2018 was down 10.1% from December 2017
MONTGOMERY COUNTY JULY 2018
 STATPAK MONTGOMERY COUNTY JULY 2018 McEnearney.com MARKET IN A MINUTE A SUMMARY OF MARKET CONDITIONS FOR JUNE & FIRST HALF 2018 Contract activity in June 2018 was up 1.2% from June 2017, solely because
May 2017 Montgomery County Market Trends Report Median sales price increases 5.8 percent; active listings drop 11.8 percent
 FOR IMMEDIATE RELEASE Contact: Bobette Banks 301-590-8764 Director of Communications Greater Capital Area Association of REALTORS bbanks@gcaar.com May 2017 Montgomery County Market Trends Report Median
November 2017 Montgomery County Market Trends Report Median sales price up slightly as median days on market quickens
 FOR IMMEDIATE RELEASE Contact: Bobette Banks 301-590-8764 Director of Communications Greater Capital Area Association of REALTORS bbanks@gcaar.com November 2017 Montgomery County Market Trends Report Median
NPI-Market Value Percentiles
 Distributions over Time In July, Research Corner looked at data distributions from the first quarter 2014 NCREIF database. This month s Research Corner revisits the subject of distributions from a time
February 2018 Montgomery County Market Trends Report Closed sales dip while median sales price reaches highest February mark since 2007
 FOR IMMEDIATE RELEASE Contact: Bobette Banks 301-590-8764 Director of Communications Greater Capital Area Association of REALTORS bbanks@gcaar.com February 2018 Montgomery County Market Trends Report Closed
1 Q M A NH AT TA N M A R K E T R E P O R T
 1Q2018 MANHATTAN M A R K E T R E P O R T INTRODUCTION M A N H A T T A N S A L E S R E P O R T Q 1 2 0 1 8 : THE NECESSITY OF BALANCE The first quarter of 2018 was a balancing act supported by declines
What s Next for Commercial Real Estate Leveraging Technology and Local Analytics to Grow Your Commercial Real Estate Business
 What s Next for Commercial Real Estate Leveraging Technology and Local Analytics to Grow Your Commercial Real Estate Business - A PUBLICATION OF GROWTH MAPS- TABLE OF CONTENTS Intro 1 2 What Does Local
May 2016 Montgomery County Market Trends Report Double-digit gains in closed sales, exceeding the five-year May average
 FOR IMMEDIATE RELEASE Contact: Bobette Banks 301-590-8764 Director of Communications Greater Capital Area Association of REALTORS bbanks@gcaar.com May 2016 Montgomery County Market Trends Report Double-digit
Manhattan Rental Market Report April 2016 mns.com
 Manhattan Rental Market Report April 2016 TABLE OF CONTENTS 03 Introduction 04 A Quick Look 07 Mean Manhattan Rental Prices 11 Manhattan Price Trends 12 Neighborhood Price Trends 12 Battery Park City 13
June 2018 Montgomery County Market Trends Report Median sales price reaches highest June level on record
 FOR IMMEDIATE RELEASE Contact: Bobette Banks 301-590-8764 Director of Communications Greater Capital Area Association of REALTORS bbanks@gcaar.com June 2018 Montgomery County Market Trends Report Median
insights from new york's premier broker for townhouses and small buildings TOWNHOUSE end of year review MARKET SNAPSHOT JAN-DEC 2017
 leslie j. garfield jan-dec 2017 insights from new york's premier broker for townhouses and small buildings TOWNHOUSE end of year review MARKET SNAPSHOT JAN-DEC 2017 2017 Sales Avg. Sales Price Avg. Price/Sq.ft
MARKET AREA UPDATE Report as of: 1Q 2Q 3Q 4Q
 Year: 2013 Market Area (City, State): Baltimore Metropolitan Area MARKET AREA UPDATE Report as of: 1Q 2Q 3Q 4Q Provided by (Company / Companies): LONG & FOSTER REAL ESTATE, INC. What are the most significant
Q manhattan. the corcoran report. comitini. com
 Q3. manhattan the corcoran report peter comitini comitini.com peter@ comitini. com 212. 444.7844 3 r d QUARTER We are pleased to present the Third Quarter Corcoran Report, an easy-to-read snapshot of the
2016 Census Bulletin Changing Composition of the Housing Stock
 Metro Vancouver s Role Every five years, the Census of Canada provides benchmark data that is instrumental in analyzing and evaluating local government planning policies and services. Representing member