2017 CITY OF STEVENS POINT HOUSING STUDY
|
|
|
- Roderick Willis
- 5 years ago
- Views:
Transcription


1 2017 CITY OF STEVENS POINT HOUSING STUDY July 5, 2017 Prepared for the City of Stevens Point By MSA Professional Services, Inc.
2 1 TABLE OF CONTENTS CHAPTER 1 INTRODUCTION CHAPTER 2 STUDY PROCESS Project Oversight Interviews Community Survey... 6 CHAPTER 3 FINDINGS Housing Supply... 7 Housing Quantity... 7 Housing Quality Supply Trends Housing Demand Population University of Wisconsin Stevens Point Enrollment and Housing Households Age Income and Affordability Demand for Amenities Demand Versus Supply Vacancy Rates Real Estate Sales and Listings Location Stevens Point as an Employment Center Where do Stevens Point s Workers Live? Why do People Live Outside the City of Stevens Point? Regulatory Practices Definition of Family in Zoning Code Rental Unit Operating Licenses Conditional Use Permits for all Multi-Family Housing Other Issues Special Needs Housing and Support Services Neighborhood Delineation and Distressed Neighborhood Analysis Redevelopment/Rehab Program Funding and Viability... 60
3 2 Infrastructure Challenges Adaptive Re-Use Redevelopment Housing Opportunities Historic Housing Properties and Preservation Programs Green Building Cost/Benefit and Programs National Trends Affecting Stevens Point s Housing Market Gaps Between Supply and Demand CHAPTER 4 RECOMMENDATIONS What Housing is Needed in Stevens Point, by Type, Price Point and Amenities? Where Should New Housing be Located? What Programs Should be Provided for Housing Development/Redevelopment? What Regulatory Changes Would Improve Housing Conditions? How do we Improve the Condition of Existing Housing Units? What Strategies Should be Implemented to Address Shortcomings of the City (E.G. Livability, Marketability, and Quality of Life)? CHAPTER 5 PRIORITIZATION The Actions Assumed in Every Alternative Alternative #1 Create a More Vibrant Downtown and Waterfront Recommendations Impacts Alternative #2 Improve the Entry Corridors and Surrounding Neighborhoods Recommendations Impacts Alternative #3 Create New Neighborhoods Recommendations Impacts APPENDIX A - MAPS APPENDIX B - SURVEY RESULTS Cover Photo Credit: uwsp.edu
4 3 CHAPTER 1 - INTRODUCTION This study was commissioned by the City of Stevens Point in late 2016, through the City s Redevelopment Authority. The Redevelopment Authority has identified housing as a critical issue that needs to be addressed to improve Stevens Point and grow its economy based on feedback from various stakeholders. The purpose of this study is to help the City better understand its housing market and to craft targeted strategies to improve housing options. There are two parts to the Stevens Point housing supply. The first is all of the housing in Stevens Point and the second is all of the housing outside Stevens Point for people who go to school or work in the City. The housing in Stevens Point is the easiest to measure and analyze, and is the part that the City has the most control over. The housing outside the City is a bit harder to quantify and qualify, but it is nevertheless important to our understanding of the overall market. This report attempts to document conditions and trends in the overall market, including an understanding of why people are choosing to live where they live. One of the defining characteristics of the Stevens Point housing market is the University of Wisconsin Stevens Point. The student population makes up approximately one-third of the total population of the City (9,255 out of 27,600 in 2015). This impacts housing needs for the City as many students live in off-campus housing, which is typically rental housing. Another defining feature of Stevens Point s market is the age of its housing supply about 43% of all owner- and renter-occupied housing units in the City were built prior to Units built prior to 1950 tend to have poor energy performance, higher maintenance costs, and they sometimes lack things that homebuyers desire such as attached garages. As of now, construction from in Stevens Point accounts for only 2% of total housing stock. These aspects of Stevens Point s housing market and other data will be described and analyzed further in Chapter 3. This study evaluates the supply of housing in and around the city, demand for housing in the same area, the current relationship between supply and demand (price) and gaps between supply and demand. For those gaps identified, recommendations are offered to enable the City to help close those gaps. Recommendations will include three cohesive alternative approaches presented as methods to expand housing options within the City. To provide context to discussions about other communities frequently references in this study, see Figure 1.1.

5 4 Figure 1.1 Regional Reference Map
6 5 CHAPTER 2 - STUDY PROCESS This study uses a variety of methods and data to understand the housing market. Objective, measurable data were collected from the City, Portage County, the Multiple Listing Service (real estate listings and sales), the State of Wisconsin, and the U.S. Census Bureau. The City is compared to its regional peer communities, university peer communities, and wider context (county, state, nation) in a variety of ways, and also compared to itself in the form of time-series data that reveal trends. This study also incorporated a series of interviews with people familiar with the housing market, and a community survey of area residents and employees. 2.1 PROJECT OVERSIGHT The study was initiated by the Redevelopment Authority of the City of Stevens Point, with support from the City s Community Development Department. The Portage County Business Council (PCBC) convened its New ERA group (Employee Retention and Attraction) to serve as a sounding board for the study, first in December 2016 for a kickoff discussion of issues and opportunities facing the City and region, and then in April for a review and discussion of the initial findings. 2.2 INTERVIEWS We met and interviewed a variety of people with knowledge and insight about the local housing market, including realtors, lenders, builders, landlords, students and employers. These interviews, conducted in January and March 2017, included people representing the following organizations, as identified by City staff with input from the New ERA group: Portage County Business Council UW Stevens Point UW Stevens Point students Sentry Insurance Blenker Building Systems, Inc. Community First Bank Ellis Stone Construction Co. United Way of Portage County Skyward Candlewood Property Management Coldwell Banker Real Estate Group First Weber Realtors CAP Services The feedback collected in these interviews often gravitated to similar topics and viewpoints, reflecting a strong shared understanding of how the local housing market functions. This feedback is described in Chapter 3, under each topic (Supply, Demand, Demand vs. Supply, Location, Regulatory Practices, and Other Issues). In a few cases the interviewees were not in agreement on a topic these differing viewpoints are noted.
7 6 2.3 COMMUNITY SURVEY A community survey was conducted January-February The survey was offered online, with paper copies available at City Hall. In total the survey had approximately 1,200 responses. The survey was promoted via published notices in the paper, an article in the paper, and through . The full responses are provided in Appendix B. Relevant findings are featured throughout Chapter 3. When considering the opinions and experiences indicated in the survey, it is important to understand the bias of the survey sample. Respondents were older, wealthier, and more often homeowners than the overall population of the City of Stevens Point. Approximately 22% of survey respondents were age 35-44, but this cohort only comprises 8% of the population of Stevens Point. Those under age 18 represented 0.1% of survey respondents but make up 16% of the City. Approximately 62% of survey respondents identified as homeowners while 49% of housing units are owner-occupied according to ACS data. University of Wisconsin- Stevens Point students were also underrepresented. Students accounted for approximately 15% of survey respondents but comprise as much as one-third of the City population. When appropriate, the responses of renters are reported separate from and compared to the responses of homeowners. The responses from UW-Stevens Point students are also separated when appropriate.
8 7 CHAPTER 3 FINDINGS A NOTE ABOUT US CENSUS AND AMERICAN COMMUNITY SURVEY DATA These indicators utilize a mixture of local, county, state, and federal data sources. The U.S. Census has historically been a key source of data for many community indicators. Much of the information previously collected by the decennial U.S. Census is now collected only by the American Community Survey (ACS). The ACS is an ongoing survey that collects sample data every year and reports estimates of population and housing characteristics. For communities smaller than 20,000 people, the best available estimates are reported as rolling averages over 5- year periods they indicate average conditions over the reporting period rather than a snapshot of a single point of time. Because the ACS estimates are based on a sample of the population, they include some error. The margin of error is reported for each estimate, and is an indication of how reliable the estimate is. As a general rule, the ACS data is quite reliable at the state level, generally reliable at the county level, and less reliable at the municipal level. The margin of error makes the data much more difficult to interpret. To simplify tables in this plan, the reliability of each value is indicated simply by the formatting of the text. For each ACS estimate, the margin of error is divided by the estimate. If the error exceeds 10% of the estimate, the value in the table is bolded and italicized. In graphs, the ACS data exceeding this 10% error threshold will be denoted at the bottom of the graph. The second important note when using ACS estimates is that they cannot be compared to decennial census data because they are measured in different ways. While some of the tables in this report show both decennial census data and ACS data, caution should be used when trying to draw conclusions about trends by comparing the two sets of numbers. This chapter presents the findings from analysis of data from various sources. These findings are organized by topic supply, demand, leakage and gaps. Findings from the survey and interviews are reported with the relevant topic. While no single data point or opinion offers much insight, when combined these data create a useful portrait of the market. A NOTE ABOUT THE MAPS Many of the maps used in this report include detail that is hard to discern at small scale. Each map is repeated in Appendix A at a larger scale. 3.1 HOUSING SUPPLY This section describes the current housing stock in Stevens Point quantity, type, size, age, condition, location, restrictions on rental units and cost/value. Housing Quantity Stevens Point has a variety of residential properties including single-family, condos, duplex, multifamily, mobile homes, public housing, senior housing, etc. The distribution of residential properties is shown in Figure 3.1. According to ACS estimates, there are approximately 11,260 housing units in Stevens Point.
9 8 Figure 3.1 Residential Properties in Stevens Point Occupancy Figure 3.2 compares the percentage of owner-occupied units in the City as compared to surrounding communities and counties. Within this context, the City s housing stock is disproportionately weighted toward rental units, at a roughly 50/50 split between owner- and renter-occupied. This is due to the presence of the University. It may be more helpful to compare Stevens Point against other college towns. Figure 3.3 compares Stevens Point to other small to mid-size communities across Wisconsin that have four-year colleges. In this context, Stevens Point is similar to its peers, most of which are close to a 50/50 split. According to ACS data, there are approximately 5,164 owner-occupied units (49% of occupied housing stock) and approximately 5,365 renter-occupied units (51% of occupied housing stock) in the City. Figures 3.4 and 3.5 show rental units listed on the City s rental registry (discussed further in Section 3.5).
10 9 Figure 3.2 Percent Owner vs. Renter Occupancy (Regional Peer Communities) Owner Renter 80% 70% 60% 50% 40% 30% 20% 10% 0% City of Stevens Point City of Marshfield City of Wausau City of Village of Wisconsin Plover Rapids Portage County Wisconsin Source: ACS *error exceeds 10% for Village of Plover renter occupancy Figure 3.3 Percent Owner vs. Renter Occupancy in Wisconsin Communities with Four-Year Colleges Owner Renter 80% 70% 60% 50% 40% 30% 20% 10% 0% City of Stevens Point City of Eau Claire City of La Crosse City of Oshkosh City of Platteville City of Superior City of Whitewater Source: ACS
11 10 Figure 3.4 Registered Rental Properties by Number of Units

12 11 Figure 3.5 Registered Rental Properties by Number of Units (Inset) TYPE Table 3.1 indicates the distribution of housing units in the City, by type and occupancy, and compares the distribution to regional peer communities and the County. Of note is that the percentage of Stevens Point s renter-occupied units that are in buildings with 10 or more apartments (21%) is similar to Wausau (29%), Wisconsin Rapids (25%), Plover (22%) and the County (21%) (but is approximately half of the 43% found in Marshfield). It is also worth noting that the percentage of renter-occupied single family detached homes in Stevens Point (24%) is similar to Wisconsin Rapids (27%) and Portage County (24%) but is nearly double that in Marshfield (13%) and more than double that in the Village of Plover (9%). It is difficult to track condominiums and townhomes using the ACS because they are an ownership structure, not a building form, and are not tracked by ACS. However, they tend to be designed in a 1-unit attached format, such that the walls separating units extend from ground to roof. Table 3.1 indicates that approximately 2% of owner-occupied units are 1-unit attached which is similar to regional peer communities, although Plover is slightly higher at 6%.
13 12 Table 3.1 Housing Units by Type and Occupancy (Regional Peer Communities) City of Stevens Point City of Marshfield City of Wausau City of Wisconsin Rapids Village of Plover Portage County Wisconsin Renter Owner Renter Owner Renter Owner Renter Owner Renter Owner Renter Owner Renter Owner 1, detached 92% 24% 89% 13% 93% 20% 95% 27% 92% 9% 92% 24% 88% 21% 1, attached 2% 5% 3% 4% 2% 5% 2% 8% 6% 8% 2% 5% 4% 6% 2 units 1% 14% 2% 15% 2% 24% 1% 11% 0% 6% 1% 14% 2% 16% 3 or 4 units 0% 15% 0% 4% 1% 8% 0% 10% 0% 19% 0% 15% 1% 10% 5 to 9 units 0% 18% 0% 20% 0% 14% 0% 16% 0% 36% 0% 18% 1% 14% 10 or more apartments 0% 21% 0% 43% 1% 29% 0% 25% 0% 22% 0% 21% 1% 30% Mobile home or other type of housing 4% 3% 5% 1% 2% 0% 2% 3% 2% 2% 4% 3% 3% 2% Source: ACS UNIT SIZE When looking for housing, a basic criterion is size, especially the number of bedrooms. We have a couple sources of data to indicate the size of units in Stevens Point s housing stock, including ACS estimates and the community survey. Figure 3.6 indicates the number of bedrooms available in Stevens Point s owner-occupied housing units. Over half of owner-occupied units in Stevens Point (55%) are 3 bedrooms which is similar to all regional peer communities, with the exception of Plover where 65% of owneroccupied units have 3 bedrooms. As illustrated in Figure 3.7, close to half of renter-occupied units in Stevens Point (44%) have 2 bedrooms, which is similar to all other regional peer communities except Plover (52%). This is similar to results from the Community Survey shown in Figure 3.8. Stevens Point is an outlier in the region regarding its share of large units with four or more bedrooms. Such units make up 11% of all rental units here, while the peer communities range from 2% to 7%.
14 13 Figure 3.6 Number of Bedrooms for Owner-Occupied Units (Regional Peer Communities) 5 or more bedrooms 4 bedrooms 3 bedrooms 2 bedrooms 1 bedroom No bedroom Source: ACS 0.0% 10.0% 20.0% 30.0% 40.0% 50.0% 60.0% 70.0% City of Stevens Point City of Marshfield City of Wausau City of Wisconsin Rapids Village of Plover Portage County Wisconsin *error exceeds 10% for all of Stevens Point with the exception of 3 bedrooms; all of Marshfield with the exception of 3 and 4 bedrooms; all of Wausau with the exception of 3 bedrooms; all of Wisconsin Rapids with the exception of 3 bedrooms; all of Plover; all of Portage County with the exception of 2,3 and 4 bedrooms; and no bedroom units in the State. Figure 3.7 Number of Bedrooms for Renter-Occupied Units (Regional Peer Communities) 5 or more bedrooms 4 bedrooms 3 bedrooms 2 bedrooms 1 bedroom No bedroom 0.0% 10.0% 20.0% 30.0% 40.0% 50.0% 60.0% City of Stevens Point City of Marshfield City of Wausau City of Wisconsin Rapids Village of Plover Portage County Wisconsin Source: ACS *error exceeds 10% for all of Stevens Point; all of Marshfield; all of Wausau; all of Wisconsin Rapids; all of Plover; and all of Portage County with the exception of renter-occupied 2 bedrooms.
15 14 Figure 3.8 Number of Bedrooms for Owner- and Renter-Occupied Units, Community Survey 60.0% 50.0% 40.0% 30.0% 20.0% 10.0% 0.0% Efficiency One bedroom Two bedroom Three Bedroom Four bedroom or larger Other (please specify) Owners Renters Source: 2017 Stevens Point Housing Survey HOUSING QUALITY The quality of housing in a community is difficult to measure objectively. This section considers several data sources to understand the quality and condition of Stevens Point s housing stock. UNIT AGE The age of a home or apartment building is not, by itself, an adequate measure of quality or condition but can be used as an indicator. Older homes, especially those built before 1950 tend to have poor energy performance, higher maintenance costs, and they sometimes lack things that homebuyers desire such as attached garages. Figure 3.9 is taken from the City s parcel data and shows year of construction for single-family homes. Approximately 45% of the 5,638 homes in the City were built before 1950 and 6% were built prior to Eleven percent (11%) of the City s housing stock was built 2000 or later. Home construction appears cyclical in Stevens Point. Single-family home construction reached its peak in the 1960s during which13% of the City s current stock was built. There was a large drop in single-family home construction during the 1980s (during which only 3% of the City s current housing stock was built) and an increase during the 1990s. The City currently appears to be experiencing another large drop in construction. As of now, single-family construction from in Stevens Point accounts for 2% of its total housing stock. Figure 3.10 shows that multi-family home construction reached its peak in the 1900s during which 22% of the City s current multi-family buildings were built. There was a drop in multi-family construction during the 1930s-1960s (during which only 5% of the City s current multi-family housing stock was built) and an increase during the 1960s-1970s. The City is currently

16 15 experiencing another large drop of multi-family construction. Construction from only accounts for 2% of Stevens Point s multi-family buildings. Figure 3.9 Single Family Units by Date of Construction Source: City of Stevens Point Parcel Data Figure 3.10 Multi-Family Buildings by Date of Construction Number of Multi-Family Buildings Source: City of Stevens Point Parcel Data Figure 3.11 indicates the decade of construction for both single-family and multi-family units as estimated by the ACS. A quarter of all residential units (25%) in Stevens Point were built in 1939 or earlier, which is similar to Wausau (26%), but higher than Marshfield (20%), Wisconsin Rapids (18%), Plover (3%), Portage County (18%) and the State (19%). According to these data, there were housing construction booms between 1970 and 1979 (14% of the City s current housing stock was constructed) as well as 2000 to 2009 (13% of the City s current housing stock was constructed). Since 2009, construction appears to have stagnated, a finding that is consistent across all of the peer communities except Plover. Approximately 70% of Plover s housing stock was constructed 1980 or later as compared to 34% of Stevens Point s housing stock during the same period. It is also of note that just over 25% of Plover s housing stock was built 2000 or later, which is higher than all other regional peer communities.
17 16 Figure 3.11 Year Structure Built for Single-Family and Multi-Family Units (Regional Peer Communities) Built 1939 or earlier Built 1940 to 1949 Built 1950 to 1959 Built 1960 to 1969 Built 1970 to 1979 Built 1980 to 1989 Built 1990 to 1999 Built 2000 to 2009 Built 2010 or later 0.00% 5.00% 10.00% 15.00% 20.00% 25.00% 30.00% City of Stevens Point City of Marshfield City of Wausau City of Wisconsin Rapids Village of Plover Portage County Wisconsin Source: ACS *error exceeds 10% for all of Stevens Point with the exception of built 1939 or earlier; all of Marshfield; all of Wausau with the exception of built 1939 or earlier; all of Wisconsin Rapids; all of Plover; and all of Portage County with the exception of built 1970 through 2009; and Wisconsin built 2010 or later.
 are located near the center of the City while newer homes are located at the edges.")
18 17 Figure 3.12 shows a map of single-family dwellings by age of home. The oldest homes in the City (built prior to 1951) are located near the center of the City while newer homes are located at the edges. The same can be said for multi-family dwellings as shown in Figure Figure 3.12 Single-Family Dwellings by Age of Home Note: Parcels considered condominiums were broken into approximate building footprints to show units.

19 18 Figure 3.13 Multi-Family Dwellings by Age of Home
20 19 UNIT VALUE Another method of evaluating housing conditions is to consider the value per square foot of homes. Figure 3.14 illustrates the value per square foot of single-family homes. In general, home values near the edges of the City are more varied while homes near the center of the City appear to have similar values as shown by the concentration of green shading on the map. Homes with values above $90 per square foot tend to be found near the edges of the City. The average value per square foot of single-family dwellings in Stevens Point is $67. Figure 3.14 Single-Family Dwellings by Value per Square Foot of the Home Note: Parcels considered condominiums were broken into approximate building footprints to show units.

21 20 Figure 3.15 illustrates the value per square foot of multi-family homes. In general, value per square foot of multi-family dwellings is lower than that of single-family homes. The average value per square foot of multi-family dwellings is approximately $53 in Stevens Point. There are no multifamily dwellings within the City that have values over $130 per square foot. Figure 3.15 Multi-Family Dwellings by Value per Square Foot of the Home CODE VIOLATIONS The City of Stevens Point has an Ordinance Control Officer who responds to complaints of code violations, works with property owners to find solutions to correct any violations, and issues orders to correct confirmed violations as appropriate. Figure 3.16 shows the number of interior and exterior code violations for all residential parcels The most common code violations during this time period were Improper Parking of Vehicles, Grass or Weeds, Multiple Exterior Property Violations, Refuse or Refuse Carts on Curb, and Lack of Snow/Ice Removal. Many of the properties with the greatest number of complaints are located around the University. It should be noted that the majority of the code violations are for exterior conditions, reflecting the relative ease of direct observation and anonymous complaints regarding exterior maintenance. Only 1% of code violations from 2012 to 2016 were related to interior structural conditions. These

22 21 exterior violations are a poor indicator of the interior quality of housing, however they are a reasonable indicator of neighborhood quality. Figure 3.16 Residential Lot Code Violations PUBLIC OPINION ABOUT HOUSING QUALITY The housing survey asked residents to rate the quality of their own housing. Eighty-seven percent (87%) of owner respondents (excluding students) stated their housing is in Excellent or Good condition while 57% of renters (excluding students) said the same. Thirteen percent (13%) of owners stated their housing is in Fair condition and 34% of renters said the same. Only 1% of owners and 7% of renters said their housing condition is Poor. For student respondents, 9% stated their housing condition as Excellent, 37% stated their housing condition is Good, 47% stated their housing condition is Fair and 8% stated their housing condition is Poor. See Figure 3.17.
23 22 Figure 3.17 Self Reported Housing Condition: Owners, Renters and UW Students 12.9% 0.6% Owners (excluding students) 32.4% EXCELLENT - all systems and finishes in good repair GOOD - all systems in good repair, but finishes are showing some signs of age and/or wear 54.1% FAIR - systems all functional but with recurring or impending repair needs, but the unit is safe; some finishes are visibly worn or dated POOR - systems have current or frequent repair needs, some finishes are significantly worn and unsightly, there are building code violations and/or safety concerns 6.9% Renters (excluding students) 16.4% EXCELLENT - all systems and finishes in good repair GOOD - all systems in good repair, but finishes are showing some signs of age and/or wear 34.0% FAIR - systems all functional but with recurring or impending repair needs, but the unit is safe; some finishes are visibly worn or dated 42.7% POOR - systems have current or frequent repair needs, some finishes are significantly worn and unsightly, there are building code violations and/or safety concerns 8.1% 8.8% UW Students EXCELLENT - all systems and finishes in good repair 36.5% GOOD - all systems in good repair, but finishes are showing some signs of age and/or wear 46.6% FAIR - systems all functional but with recurring or impending repair needs, but the unit is safe; some finishes are visibly worn or dated POOR - systems have current or frequent repair needs, some finishes are significantly worn and unsightly, there are building code violations and/or safety concerns
24 23 HOUSING SATISFACTION Respondents were also asked to rate their satisfaction with various aspects of their current housing including location, quality, size and amenities (e.g. parking). Generally respondents are Very Satisfied or Satisfied with location (82%), size (75%), amenities (71%) and quality (73%). Table 3.2 below shows responses from owners, renters and UW Students regarding satisfaction with location, quality, size and amenities. Generally owners are Very Satisfied or Satisfied with location, quality, size and amenities. Renters and UW Students are least satisfied with Quality, Size and Amenities of their housing. Twenty-four percent (24%) of renters and 28% of students are Dissatisfied or Very Dissatisfied with their housing amenities. Twenty percent (20%) of renters and 21% of UW Students are Dissatisfied or Very Dissatisfied with their housing quality. Twentyone percent (21%) of renters and 14% of students are Dissatisfied or Very Dissatisfied with their housing size. Table 3.2 Self Reported Housing Satisfaction: Owners, Renters and UW Students Owners (excl. students) Location Renters (excl. students) UW Students Very satisfied 57% 36% 28% Satisfied 32% 36% 43% Neutral 7% 18% 20% Dissatisfied 4% 8% 8% Very dissatisfied 1% 2% 0% Quality Very satisfied 43% 17% 13% Satisfied 43% 40% 39% Neutral 10% 23% 27% Dissatisfied 4% 16% 18% Very dissatisfied 1% 4% 3% Size Very satisfied 48% 23% 25% Satisfied 35% 36% 43% Neutral 10% 20% 18% Dissatisfied 6% 14% 11% Very dissatisfied 1% 7% 3% Amenities (e.g. parking) Very satisfied 48% 21% 19% Satisfied 34% 34% 33% Neutral 12% 21% 21% Dissatisfied 5% 17% 20% Very dissatisfied 1% 7% 8%
25 24 Several select comments from renters as to why they are dissatisfied are listed below. These are themes that were mentioned by multiple respondents: I would like to park within a block of the apartment, not six blocks away. The landlord doesn t respond to issues. Takes weeks to get things fixed. Too small but can t afford anything that is in Stevens Point and allows cats. The quality of the apartments are sub-par considering what we pay in rent, and rent keeps rising each year without updates to the property. The property has just gotten too small for my husband and I. We are hoping to purchase a home in the next six months. Every apartment I have lived in has been drafty and cold in the winter. Resulting in excessive heating costs. There were also comments about housing quality in the stakeholder interviews. Like the preceding comments from the survey, the following sentiments are individual and anecdotal. One of the realtors noted that some buyers have expressed frustration with the quality of available houses relative to the price, meaning that houses in an acceptable price range are in need to too much repair and remodeling work. One of the interviewees noted the quality of rental units seems to be in decline because the market is strong but there is limited development of new rental units and therefore little pressure or motivation for owners of existing units to invest in those units. Consistent with the survey results, student interviewees offered critical opinions about the quality of rental properties. They described safety concerns and cited a series of fires during the preceding 18 months, most of which they understand to have been caused or enabled by unsafe conditions and inadequate maintenance. Students were particularly focused on the poor quality of the homes with many rooms and occupants, which they attributed to neglect by both landlords and occupants. HOMEOWNER INVESTMENT The community survey asked homeowners if they have invested $2,500 or more in home improvements in the last 5 years. Approximately 53% had invested at least $2,500 in the past 5 years, and approximately 9% have invested $20,000 or more. The relatively high number of respondents who have invested recently in their homes signals both that people care to improve their homes and also that homes require such investment. Common responses from respondents about what type of improvements were made included flooring, new roof and paint. Respondents were also asked if they were planning to invest $2,500 or more in home improvements over the next 5 years. Approximately 62% of respondents said they would be doing so, common improvements included flooring, windows and basement.
26 25 SUPPLY TRENDS NEW CONSTRUCTION Figure 3.18 below is building permit history from the City, it shows single-family, duplex and multifamily unit construction between 1992 and Both single-family and duplex unit construction have declined since about Construction of single-family homes peaked at 62 units in 2001 and hit a low of 9 units in Most recently, in 2015 there was an increase in construction bringing the total to 20 units. Construction of duplex units hit a high in 1993 at 28 units and a low of 0 in In 2016 the construction of duplex units in Stevens Point was only at 4 units. Construction of multi-family units had several spikes; in 1995 (100), 2002 (162), 2008 (127), and 2009 (127), however there have been just 25 units constructed in the seven full years since Figure 3.18 New Single-Family, Duplex and Multi-Family Unit Construction in Stevens Point Single Family Homes Duplexes - # of Units MF - # of Units Source: City of Stevens Point The following three figures show new single-family, duplex and multi-family construction for Stevens Point as compared to the Village of Plover. Over the past ten years Stevens Point and Plover have both seen construction of similar numbers of single-family and duplex homes. Where the two communities differ drastically is in multi-family construction. Over the same period Stevens Point has seen construction of 329 multi-family units (including 25 in the past seven years) while Plover has seen 632 new units.
27 26 Figure 3.19 New Single-Family Construction in Stevens Point and Plover Stevens Point Plover Source: City of Stevens Point, Village of Plover Figure 3.20 New Duplex Construction in Stevens Point and Plover (by # of units) Stevens Point Plover Source: City of Stevens Point, Village of Plover Figure 3.21 New Multi-Family Construction in Stevens Point and Plover (by # of units) Stevens Point Plover Source: City of Stevens Point, Village of Plover
28 27 VALUE AND COST An important aspect of any market study is the cost of supply. Table 3.3 indicates the median value for owner-occupied units as estimated by the ACS. While cost and value are not strictly synonymous, in the housing market they are typically aligned. This table shows that compared to other regional peer communities, housing in the City is priced relatively low. The median value of housing in Stevens Point is lower than all regional peer communities with the exception of Wisconsin Rapids. The City s current parcel data show that median value for singlefamily and condo homes is $95,200, which is somewhat lower than the ACS estimate of $113,600 (though, for comparison purposes, it is appropriate to rely on the ACS data as a reliable representation of housing value in these communities Table 3.3 Median Value of Owner-Occupied Units (Regional Peer Communities) Median Value Wisconsin $165,900 Village of Plover $165,100 Portage County $147,600 City of Marshfield $128,400 City of Wausau $113,800 City of Stevens Point $113,600 City of Wisconsin Rapids $85,900 Source: ACS 3.2 HOUSING DEMAND Housing demand is about the people seeking housing. This section describes the people and households in the area, including quantities, ages and incomes. POPULATION The current population of the City of Stevens Point is 26,778 according to ACS estimates, which is up slightly from 26,717 in the 2010 Census. The City of Stevens Point s population has been increasing over the past 30 years at rates between 0% and 9% per decade. The Wisconsin Department of Administration (WI DOA) has projected that Stevens Point s population will continue to increase through 2040, albeit at a continually slowing rate. Between the 2010 Census and WI DOA s 2040 projection, the City is projected to add 3,433 people during this time period, for an increase of 13%. The projected rate of increase is nearly identical to that of the State (14%), and is higher than the projections for Marshfield (-6%), Wausau (5%), Wisconsin Rapids (-5%) and Portage County (10%) but lower than the growth projected in the Village of Plover (22%) (see Table 3.4).
29 28 Table 3.4 Historical and Projected Population (Regional Peer Communities) City of Stevens Point City of Marshfield City of Wausau City of Wisconsin Rapids Village of Plover Portage County Wisconsin ,970 N/A N/A N/A 5,310 57,420 4,705, ,002 N/A N/A N/A 8,176 61,405 4,891, ,551 18,800 38,404 18,348 10,520 67,182 5,363, ,717 19,118 39,106 18,367 12,123 70,019 5,686, (Projection) 27,600 19,020 39,440 18,330 12,710 71,905 5,783, (Projection) 28,420 18,975 40,460 18,300 13,270 73,680 6,005, (Projection) 29,110 18,930 41,100 18,280 13,770 75,130 6,203, (Projection) 29,640 18,785 41,490 18,160 14,200 76,175 6,375, (Projection) 29,980 18,585 41,450 17,990 14,530 76,750 6,476, (Projection) 30,150 18,030 41,070 17,470 14,770 76,865 6,491,635 Total Change 2010 to ,433 (1,088) 1,964 (897) 2,647 6, ,649 % Change 2010 to % -6% 5% -5% 22% 10% 14% Source: US Census, WI DOA Projections UNIVERSITY OF WISCONSIN STEVENS POINT ENROLLMENT AND HOUSING Stevens Point is home to the University of Wisconsin Stevens Point, one of eleven four-year, comprehensive universities in the University of Wisconsin system. The University is an integral part of the City and also an important factor in Census and ACS data, because students are counted wherever they spend the greatest portion of their time in a given year, which is at school. Figure 3.22 shows enrollment totals over the past ten years. It illustrates the surge in enrollment in 2010, after broad awareness of the Great Recession, and it also shows a decline in recent years. The drop in enrollment is mostly attributable to an initiative to help more students graduate in four years. Based on the student population for the school year (9,255 students), UWSP students could comprise roughly one-third of the total population of the City. Of the 9,255 students, close to 40% live on campus. The University can house about 3,525 students, and requires first-year and second-year students to live on campus. While this requirement was often waived for second-year students due to a lack of rooms when enrollment spiked, it is again in force, to ensure that on-campus housing is adequately utilized. The other 5,730 students live off-campus, though the University has no good way of knowing where because they often have on file only a home address. The percentage of those 5,730
30 29 off-campus students who live within the City is unknown, though a sizable majority is presumed. Exploring age data from the US Census (see the Age section later in this chapter), we see that 33.3% (8,917) of the City population is between the age of 15 and 24. The statewide share for that age range is 13.7%. If we assume that the number of residents in that age range above the typical share are UWSP students, then there are about 5,250 UWSP students living in the City. This is about 4,000 fewer students than are enrolled, and it suggests that only about 1,725 of the 5,730 students (30%) who live off campus live in the City. By comparison, of the 169 students who took the Community Housing Survey for this study, nearly 90% who live off campus said they live in the City. This number strikes us as more accurate, leading to an estimate of roughly 5,000 UWSP students in need of private, off-campus housing within the City. Figure 3.22 University of Wisconsin Stevens Point Student Population 9,677 9,643 9,048 9,115 9,163 9,209 9,500 9,477 9,322 9,255 8,627 9,800 9,600 9,400 9,200 9,000 8,800 8,600 8,400 8,200 8,000 Source: University of Wisconsin - Stevens Point HOUSEHOLDS Although total population has been increasing in the City, owner- and renter-occupied household size has been declining. The average of persons per household is projected to fall from 2.21 in 2010 to 2.14 in 2040 (-3%). This decline is consistent with nationwide trends that can be attributed to smaller family sizes, increased life expectancy and increases in single parent households. The result of this change in household size, if it continues as projected, is that it will accelerate demand for additional housing as the population grows, the number of households will grow at a higher rate. As indicated in Table 3.5, projections show the need for 1,771 additional units in the City between 2010 and 2040, an increase of 17%. This is higher than increases projected for Marshfield (2%), Wausau (10%), Wisconsin Rapids (3%) and Portage County (14%) during the same time period. Plover (26%) however is projected to surpass Stevens Point s and the State s (18%) household growth rates during the same time period. Table 3.5 Historical and Projected Households (Regional Peer Communities)
31 30 City of Stevens City of Wisconsin City of Marshfield City of Wausau Point Rapids Village of Plover # Persons Per # Persons Per # Persons Per # Persons Per # Persons Per , , , , , , , , , , , , , , , , , , , , , , , , , , , , , , , , , , , , , , , , % Change 2010 to % -3% 2% -3% 10% -3% 3% -3% 26% -3% Portage County Wisconsin Persons Persons # Per # Per , ,084, , ,279, , ,329, , ,431, , ,524, , ,607, , ,662, , ,681, % Change 2010 to % -3% 18% -3% AGE According to recent ACS estimates, the City of Stevens Point s population is much younger than comparable communities, the County and State (see Figure 3.23). Its population between the ages of 20 and 34 years old (36.1%) is much higher than its regional peer communities (see Figure 3.24). Also, the percentage of population age 65 and older in Stevens Point is lower than in those communities. These numbers reflect the influence of University of Wisconsin-Stevens Point. Exploring the age statistics in more detail, we see that 33.3% (8,917) of the City population is between the age of 15 and 24. The statewide share for that age range is 13.7%. If we assume that the number of residents in that age range above the typical amount are UWSP students, there are about 5,250 UWSP students living in the City. This is about 4,000 fewer students than are enrolled, and it suggests that only about 1,725 of the 5,730 students (30%) who live off campus live in the City. Figure 3.23 Median Age (Regional Peer Communities)
32 Age City of Stevens Point City of Marshfield City of Wausau City of Wisconsin Rapids Village of Plover Portage County Wisconsin Source: ACS Figure 3.24 Population by Age (Regional Peer Communities) 85 & Over years years years years years years Under 10 0% 5% 10% 15% 20% 25% 30% 35% 40% City of Stevens Point City of Wausau Village of Plover Wisconsin City of Marshfield City of Wisconsin Rapids Portage County Source: ACS *error exceeds 10% for Stevens Point, Marshfield, Wausau, Wisconsin Rapids and Plover, with the exception of median age and 75 years and older for Portage County.
33 32 INCOME AND AFFORDABILITY As compared to the State and County, Stevens Point residents have relatively low median household and per capita incomes (see Figure 3.25). When compared to regional peer communities, Stevens Point has the lowest median household income, with the exception of Wisconsin Rapids, and the lowest per capita income overall. These data primarily reflect the large student population in the City. Figure 3.25 Income (Regional Peer Communities) $70,000 $60,000 $50,000 $40,000 $40,081 $30,000 $21,320 $20,000 $10,000 $- Median Household Income Per Capita Income City of Stevens Point City of Marshfield City of Wausau City of Wisconsin Rapids Village of Plover Portage County Wisconsin Source: ACS *error exceeds 10% for Wisconsin Rapids median household income. The percentage of income that people are paying on mortgages and rents is another important factor in affordability. The critical affordability threshold is 30% of income housing is generally considered affordable when it consumes 30% or less of household income. The ACS reports the percentage of people exceeding this threshold within various income brackets. Figure 3.26 compared Stevens Point with its peers on median monthly owner costs as a percentage of monthly income. Stevens Point homeowners, on average spend approximately 18.8% of their income on mortgage. This is higher than Marshfield (17.8%), Plover (17.8%) and Portage County (18.5%), but lower than Wausau (19.7%), Wisconsin Rapids (19.6%), and the State as a whole (20.4%). Figure 3.27 shows households by income that are paying 30% or more of their incomes as mortgage. Compared to peer communities, the County and State, Steven s Point has the lowest percentage of renter-occupied units paying 30% or more of their income towards mortgage (19.5%). Stevens Point also has the lowest percentage of households paying 30% or more or their income as mortgage who earn less than $35,000 in income (9.7%). The income bracket with the highest percentage of households paying 30% or more of their income as mortgage in Stevens Point is those earning $35,000 to $49,999 (7.5%).
34 33 Figure 3.26 Median Monthly Owners Costs as a Percentage of Monthly Income (Regional Peer Communities) 21.0% 20.5% 20.0% 19.5% 19.0% 18.5% 18.0% 17.5% 17.0% 16.5% City of Stevens Point City of Marshfield City of Wausau City of Wisconsin Rapids Village of Plover Portage County Wisconsin Source: ACS Figure 3.27 Households with Median Monthly Owners Costs 30% of Yearly Income (Regional Peer Communities) Stevens Point Marshfield Wausau Wisconsin Rapids Village of Plover Portage County Wisconsin 0.00% 5.00% 10.00% 15.00% 20.00% 25.00% 30.00% 35.00% Less than $20,000 $20,000 to $34,999 $35,000 to $49,999 $50,000 to $74,999 $75,000 or More Source: ACS *error exceeds 10% for all locations with the exception of Wisconsin When looking at rents in regional peer communities, Stevens Point s median rent falls somewhere in the middle. Stevens Point s gross rent is higher than Marshfield, Wausau, Wisconsin Rapids and
35 34 the State (see Figure 3.28). The number of renters paying 30% or more of their incomes as rent in Stevens Point (57%) is higher than in the regional peer communities, the County and the State. Figure 3.29 shows the amount of rent households are paying as a percentage of annual income. Of all its regional peers, Stevens Point has the highest percentage of renters paying 30% or more of their incomes as rent (57%), Marshfield has the lowest at 46.7%. The City of Stevens Point also has the highest number of people paying 35% or more of their income as rent (44.8%). This again is likely due to the large student population in the City. According to University of Wisconsin- Stevens Point, approximately 3,403 students live in the residence halls at full capacity. This means that of the current student enrollment (9,255), about 5,850 are living in off-campus housing either in Stevens Point or another community. Figure 3.28 Gross Rents (Regional Peer Communities) $800 $700 $600 $659 $585 $653 $620 $719 $664 $648 $500 $400 $300 $200 $100 $- City of Stevens Point City of Marshfield City of Wausau City of Wisconsin Rapids Village of Plover Portage County Wisconsin Source: ACS *error exceeds 10% threshold for Village of Plover Figure 3.29 Gross Rent as a Percentage of Household Income City of Stevens Point City of Marshfield City of Wausau City of Wisconsin Rapids Village of Plover Portage County Wisconsin 0% 10% 20% 30% 40% 50% 60% 70% 80% 90% 100% Less than 15.0 percent 15.0 to 19.9 percent 20.0 to 24.9 percent 25.0 to 29.9 percent 30.0 to 34.9 percent 35.0 percent or more Not Computed Source: ACS *error exceeds 10% threshold for all with the exception of the State of Wisconsin
36 35 The housing survey is another source to look at affordability. Overall, approximately 65% of respondents estimate they are paying less than 30% of their gross household income on housing costs. Eighteen percent estimate they are paying 40% or more. When broken into renters and owners, 24% of owners and 51% of renters believe they are paying 30% or more of their income on housing (see Figure 3.30). Figure 3.30 Self Reported Estimate of Gross Household Income Spent on Housing Costs, Renters vs Owners 45% 40% 35% 30% 25% 20% 15% 10% 5% 0% Less than 10% 10-14% 15-19% 20-24% 25-29% 30-34% 35-39% 40% or more Own Rent PUBLIC AND SUBSIDIZED HOUSING In 2012 the City of Stevens Point hired American Marketing Services, Inc. to conduct a Public Housing Study and Needs Analysis. The findings concluded that there is a potential need for additional affordable housing for families, seniors and the special needs populations in the City. Assuming no new affordable rental housing has been built in the City since the 2012 study, the affordable rental housing need is projected to increase to 1,674 additional units by 2017, 1,713 by 2022 and 1,752 by The Study suggests that the addition of these units would make available a sufficient number of units for non-senior households with incomes below $35,000 (approximately 50% of the area median income) in Stevens Point. Assuming the same lack of construction of affordable senior rental housing since 2017, the projected number of affordable senior units needed is units by 2017 and units by The Study suggests that the addition of these units would make available a sufficient number of units for senior (65+) households with incomes below $35,000. Specific recommendations include: Family Housing (Highest Priority): promote development of more Low Income Housing Tax Credit (LIHTC) housing, with a significant portion of the units designated for households below 30% or 40% Area Median Income (AMI), with project-based vouchers, if that option is available. Disabled/Special Needs Housing: partner with private developers and not-for-profit groups to generate development of additional supportive housing to serve clearly identifiable special needs populations in the City. Development could be funded
37 36 through HUD s Section 811 program, using tax credits, or through other programs. Edgewater could be converted to housing for those with disabilities. Senior Housing (Lowest Priority): could include a tax-credit development with some number of project-based vouchers, as discussed for families, a Section 202 development, targeted to a more frail low-income elderly population, could be an option. Edgewater Manor: currently 1-bedroom independent-living senior apartments. There are several options, including: updating units and improving the marketing and leasing program; major redevelopment including creating some larger units; converting the building to public housing for very-low income seniors. ALICE HOUSEHOLDS United Way provides another measure of affordability for people who aren t always captured as low-income, but are not financially secure. United Way calls this group ALICE Asset Limited, Income Constrained, Employed. These households are working but struggle to afford housing, child care, food, transportation and health care. United Way has calculated an ALICE threshold for each municipality in Wisconsin to identify households above the federal poverty level, but below the basic cost of living. The threshold takes into account the current cost of basic necessities and geographic variation. According to the report, the % below the ALICE threshold in Stevens Point (30%) falls somewhere in between all of the comparable and surrounding communities. The percentage below ALICE is highest for Marshfield at 47% and lowest for the Village of Park Ridge at 19%. The ALICE report also lists Gini Coefficient, which is a measure of inequality, (where 0%=perfect equality and 100%=perfect inequality, when one person has all the income). Steven Point s Gini Coefficient (0.4475) is on the higher end of comparables and surrounding villages/towns. The highest coefficient is in Wausau at and the lowest is Town of Stockton at (see Table 3.6).
38 37 Table 3.6 ALICE Statistics (Regional Peer Communities) Poverty % ALICE % Above ALICE Threshold % Gini Coefficient Unemployment Rate Health Insurance Coverage % Municipality Pop. HH Wisconsin Rapids 18,162 8,558 13% 39% 48% % 92% Wausau 39,209 16,562 17% 36% 47% % 90% Marshfield 17,990 8,137 11% 34% 55% % 95% Village of Whiting 1, % 34% 54% % 94% Town of Linwood 1, % 33% 58% % 94% Stevens Point 26,778 10,529 24% 30% 46% % 91% Town of Carson 1, % 26% 67% % 95% Town of Hull 5,390 2,170 2% 26% 72% % 95% Town of Plover 1, % 24% 68% % 92% Town of Stockton 2,934 1,101 7% 23% 70% % 94% Village of Plover 12,195 4,898 15% 20% 65% % 92% Village of Park Ridge % 19% 79% % 98% Source: ACS, United Way Alice Report ( HOMELESSNESS There are a variety of reasons that a person may be homeless, many of which are not directly tied to housing availability, such as poverty, unemployment, poor physical or mental health, drug or alcohol abuse, domestic violence and abuse. However, lack of affordable housing can contribute to homelessness, so it is important to consider the homeless population in the area. While Stevens Point does not directly track the number of homeless in the City, there are other measures that can be used to help identify the homeless population in the area. One of these resources is the Stevens Point Area School District s homeless enrollment count. Figure 3.31 shows the Stevens Point Area School District boundary, which does cover a wider area than the City. Figure 3.32 shows the number of homeless students enrolled in the School District. This number climbed from 26 during the school year to 95 during the school year.
39 38 Figure 3.31 Stevens Point Area School District Source: MapTechnica 2017 Figure 3.32 Homeless Enrollment in Stevens Point Area School District Source: DPI Elementary & Secondary Education Act (ESEA) Consolidated Applications
40 39 Another measure worth noting is the number of homeless sheltered in County. United Way s LIFE (Local Indicators for Excellence) report shows a count of the number of individuals sheltered in Portage County s homeless shelters: Family Crisis Center and Salvation Army s Hope Center. Portage County s most recent LIFE report from 2012 and shows that the number of individuals sheltered between 2007 and 2011 has remained relatively stable with the exception of 2010 when the Salvation Army s Hope Center was under construction (see Figure 3.33). Figure 3.33 Number of Individuals Sheltered at Portage County s Homeless Shelters * 2010** 2011 Family Crisis Center Salvation Army's Hope Center Source: United Way 2012 LIFE in Portage County: Local Indicators for Excellence *Salvation Army s Hope Center nightly capacity reduced to a max of 35 individuals per night. ** Salvation Army s Hope Center building was under construction. Although homelessness is not purely a housing policy issue, it is important to continue providing resources that support the City s most vulnerable residents, especially in their housing needs. DEMAND FOR AMENITIES We asked our interviewees to identify those features of housing that are often or always required with housing units in this market. The most frequent answers were covered parking, a washer and dryer in the unit (or, for student housing, on the same floor), and the availability of adequate private storage. A couple of the interviewees advocated for contemporary architectural design as a feature that, while not essential, would help to attract tenants and buyers in this market. 3.3 DEMAND VERSUS SUPPLY This section considers the balance between supply and demand in the housing market as revealed by vacancy rates, real estate sales and listings, and interviewee observations. VACANCY RATES Vacancy rates are an important measure of the balance between housing demand and supply in a community. Table 3.7 shows both rental and homeowner vacancy rates for regional peer communities.
41 40 Table 3.7 Vacancy Rates (Regional Peer Communities) City of Stevens Point Village of Plover Stevens Point & Plover City of Marshfield City of Wausau City of Wisconsin Rapids Portage County Wisconsin Occupied Units 10,529 4,898 18,968 8,439 16,562 8,558 27,954 2,293,250 Vacant Units , , , ,352 Homeowner Vacancy 1.3% 2.3% 1.7% 0.6% 2.8% 3.1% 1.4% 1.9% Rental Vacancy 6.5% 1.4% 5.2% 4.8% 5.3% 3.9% 5.4% 5.2% Source: ACS Table 3.8 Vacancy Rates and Change in Campus Enrollment in Wisconsin Communities with Four-Year Colleges City of Stevens Point City of La Crosse City of Oshkosh City of Platteville City of Superior City of Whitewater Occupied Units 10,529 20,749 25,987 3,553 11,669 4,833 Vacant Units 731 1,482 2, Homeowner Vacancy 1.3% 3.3% 2.7% 0.0% 2.6% 1.8% Rental Vacancy 6.5% 2.7% 6.9% 6.1% 6.2% 4.2% Change in Campus Enrollment ( ) % Change in Campus Enrollment ( ) -8.1% 5.0% 6.3% 10.9% -10.3% 5.0% Source: ACS, For owner-occupied housing, vacancy rates are a weak measure of demand for housing. A typical healthy vacancy rate for homeowners is around 2%. This low number takes into account the fact that owners tend to continue living in homes that are on the market, and vacancy between owners is typically brief. Extended home vacancy that shows up in the vacancy statistic is typically due to circumstances such as job relocation or foreclosure. A vacancy rate of 1.3% is healthy for the City of Stevens Point. A typical healthy vacancy rate for renters is around 5%. This number is typically higher than the homeowner vacancy rate because rental units are more likely to sit vacant between renters. A rental vacancy rate around 5% is an appropriate balance between supply and demand, with enough available units to offer renters choices and the ability to move in somewhere right away. If the rental vacancy rate falls, it is harder for renters to find units, and easier for landlords to raise rents. The rental vacancy rate in Stevens Point is slightly higher than regional peer communities at 6.5%, indicating that some rentals may not be renting well.
42 41 Steven s Point s rental vacancy rate is higher when compared to regional peer communities, however when compared to other communities in Wisconsin with four-year colleges, Stevens Point s rental vacancy rate is similar to Oshkosh (6.9%), Platteville (6.1%) and Superior (6.2%). See Table 3.8. Stevens Point s rental vacancy rate is higher than both Whitewater (4.2%) and La Crosse (2.7%). Compared to the communities in Wisconsin with four-year colleges that have similar rental vacancy rates, enrollment has decreased in Stevens Point by 8.1% between 2010 and 2014 and by 10.3% in the City of Superior. Both the City of Oshkosh (6.3%) and City of Platteville (10.9%) saw increases in enrollment during the same time period. This indicates that a drop in enrollment is in and of itself not creating high rental vacancy rates. REAL ESTATE SALES AND LISTINGS To evaluate the real estate market in Stevens Point we looked at data from the Multiple Listing Service (MLS) that was provided by the Central Wisconsin Board of REALTORS. These data describe listings in Stevens Point as well as Portage County as a whole. It should be noted that data for 2016 was pulled on December 1, 2016 so several weeks of data are missing. The data shows that single family home sales in Stevens Point drastically decreased during the Great Recession and have since increased each year, with the exception of 2016 (see Figure 3.34). From Stevens Point saw its largest increase in single family home sales (an increase from 183 sales to 215). Condo sales also declined after the Great Recession, but increased from (an increase from three sales to nine) (see Figure 3.35). Since then sales have fluctuated. From 2008 to 2010 there were no zero lot line properties sold in Stevens Point. During the City had an increase from one zero lot line property sold to nine. Since then, the number of zero lot line sales has stayed more or less around 10 per year (see Figure 3.36). Figure 3.34 Stevens Point Single Family Home Sales, Year to Year Change and Quantity Sold, % 300 Year to Year Change 10% 0% -10% -20% Qty Sold -30% 0 Percentage Change Qty Sold Source: Multiple Listing Service (MLS), Central Wisconsin Board of REALTORS
43 42 Figure 3.35 Stevens Point Condo Sales, Year to Year Change and Quantity Sold, Year to Year Change 250% 200% 150% 100% 50% 0% -50% -100% Qty Sold Percentage Change Qty Sold Source: Multiple Listing Service (MLS), Central Wisconsin Board of REALTORS Figure 3.36 Stevens Point Zero Lot Line Sales, Year to Year Change and Quantity Sold, Year to Year Change 600% 500% 400% 300% 200% 100% 0% -100% Qty Sold Percentage Change Qty Sold Source: Multiple Listing Service (MLS), Central Wisconsin Board of REALTORS The median sale prices for all single family, condo, and zero lot line homes decreased each year relative to 2008 prices, through In 2013, all three types of homes in both Stevens Point and Portage County began to see median prices increase again and have been increasing each year since then was the first year that median sale prices in the City exceeded 2008 prices across all housing types. Actual median sale prices are shown in Figure
44 43 Figure 3.37 Single Family Home Price, $140,000 $120,000 $100,000 $80,000 $60,000 $40,000 $20,000 $ Stevens Point Portage County Source: Multiple Listing Service (MLS), Central Wisconsin Board of REALTORS Figure 3.38 Condo Home Price, $140,000 $120,000 $100,000 $80,000 $60,000 $40,000 $20,000 $ Stevens Point Portage County Source: Multiple Listing Service (MLS), Central Wisconsin Board of REALTORS Figure 3.39 Zero Lot Line Home Price, $140,000 $120,000 $100,000 $80,000 $60,000 $40,000 $20,000 $ Stevens Point Portage County
45 44 Source: Multiple Listing Service (MLS), Central Wisconsin Board of REALTORS Figure 3.40 below shows median home prices (all residence types) for Stevens Point, Portage County, the Central Region (Adams, Clark, Juneau, Marathon, Marquette, Portage, Waushara, Wood), and the State. Median Prices in Stevens Point have generally followed the direction of movement of the trends, however median home prices in Stevens Point are approximately 28% lower than in the State of Wisconsin as a whole. Figure 3.40 Median Home Price Comparison, $180,000 $160,000 $140,000 $120,000 $100,000 $80,000 $60,000 $40,000 $20,000 $ Stevens Point Portage County Central Region WI Source: Multiple Listing Service (MLS), Central Wisconsin Board of REALTORS and Wisconsin REALTORS Association Stakeholders have noted that the supply of single family homes on the market is limited. Figure 3.41 shows the quantity of homes that were for sale in a year (but not necessarily sold). In 2016 both Stevens Point and Portage County had a lower supply of single-family homes on the market than either did in 2008 (pre-great Recession). This appears to support stakeholders remarks. Figure 3.41 Single Family Homes for Sale, City of Stevens Point and Portage County, Stevens Point Portage County Source: Multiple Listing Service (MLS), Central Wisconsin Board of REALTORS and Wisconsin REALTORS Association
46 45 Figure 3.42 below shows that the difference between the total number of active residential listings each year and total number of residential properties sold has decreased during from 258 to 138 (47% decline). These data are a more salient indicator of a tightening housing market, and they are consistent with the increases in prices in 2015 and 2016 as supply falls and sales increase, buyers will, by necessity, provide higher prices to get desired homes. Figure 3.42 Quantity of Active Residential Listings vs. Quantity of Residential Properties Sold, City of Stevens Point, Qty Sold Qty Active Source: Multiple Listing Service (MLS), Central Wisconsin Board of REALTORS and Wisconsin REALTORS Association When taking a closer look at the total single-family sales for Stevens Point in Table 3.9, quantity sold has increased from 2008 levels, as have most other metrics with the exception of the number of houses actively for sale. The year with the greatest quantity sold was 2015, 2016 had the greatest volume sold, greatest average sale and median sale, while 2009 had the greatest quantity active. Table 3.9 Single Family Home Sales, City of Stevens Point, Qty Sold % Change Volume Sold % Change Average Sale % Change Median Sale % Change Qty Active % Change $27,794,450 $130,490 $114, % $28,211,521 2% $122,659-6% $109,000-5% 452 2% % $21,621,157-23% $122,847 0% $106,000-3% 424-6% % $22,131,544 2% $120,937-2% $103,000-3% 428 1% % $24,582,699 11% $114,338-5% $97,500-5% 432 1% % $28,771,652 17% $127,874 12% $105,000 8% 453 5% % $31,101,723 8% $127,466 0% $110,000 5% 429-5% % $37,318,745 20% $133,281 5% $114,975 5% 431 0% % $38,101,594 2% $141,117 6% $119,900 4% 395-8% Source: Multiple Listing Service (MLS), Central Wisconsin Board of REALTORS
47 46 Table 3.10 below shows a snapshot in time (12/1/2016) of active single family home listings. It is notable that average days on market is lower in Stevens Point than in Portage County. Table 3.10 Active Single Family, Condo and Zero Lot Line Residential Listings, City of Stevens Point and Portage County, December 1, 2016 Area Qty Active Avg Price Med Price Avg Days on Market Stevens Point 81 $ 158, $ 119, days Portage County 215 $ 202, $ 164, days Source: Multiple Listing Service (MLS), Central Wisconsin Board of REALTORS It is also worth noting that the median price of zero lot line properties in Stevens Point has been higher than that of single-family homes and condos. Zero lot line properties are typically duplexes on two separate parcels (usually duplexes are located on one parcel) or they can be townhomes which are rows of identical or mirror image homes that share side walls. The median prices for condos and zero lot line properties in Portage County are also higher than for singlefamily homes. In Stevens Point, 10 zero lot line homes were sold in 2016 and in Portage County, 21 zero lot line homes were sold. LOCAL EXPERT PERSPECTIVES ON THE OWNER-OCCUPIED MARKET The people we interviewed, including lenders, realtors, developers, builders, and others offered well-informed opinions about the current state of the owner-occupied market. Consistent with the preceding real estate listing and sales data, they described a tight, seller s market in which desirable homes often sell immediately, sometime before they can be formally shown by realtors. More specifically, they described a strong market for homes above the median price but below the luxury tier, which starts at about $300,000 in this area. Descriptions of the sweet spot for quick sales included, variously, $150,000-$250,000, $175,000-$200,000, and anything under $300,000. Many of the interviewees noted the difficulty selling homes in this market valued above $300,000. In this market it is routinely possible to have a new home built at that cost, with control over the amenities and finishes, and so used homes are less desirable by comparison. It is common for buyers coming from more urban markets in other states to start looking at houses in this price range because they like how much they can get for their money, but then get sticker shock over the property taxes because they came from a place with a different tax structure. In those cases it is the taxes that causes them to revise their budget downward, not the purchase price of the home. LOCAL EXPERT PERSPECTIVES ON THE RENTAL MARKET Our interviewees familiar with the rental market described a healthy market in which supply and demand are balanced, with limited vacancies and limited waitlists. The student panel complained about the lack of flexibility in when leases start and end, and complained about the condition of some rental housing, but reported no difficulty finding acceptable housing if looking for housing at the beginning of the school year when most leases are scheduled to begin.
48 LOCATION This section considers a fundamental question of this study why do people to choose to live where they live, geographically, and how can the City influence those decisions to attract more people to be residents of the City of Stevens Point? It is worth noting that the most important decision to be made by potential residents, from the City s perspective, is the decision to live anywhere in central Wisconsin. As noted by several interviewees for this study, Stevens Point is competing for residents not just with Plover and Hull and other neighbors, but also with the rest of the country. People who choose to live in the region, and the City of Stevens Point, typically appreciate the high quality schools, outdoor recreation opportunities, low crime rates and friendliness. At the same time, residents are choosing to accept things that some view negatively, including property taxes, winter weather, cultural uniformity, limited entertainment events, and limited selection and availability of retail and services. While most of those positive and negative traits are outside the City s control, multiple interviewees noted the opportunity to offer a more vibrant and cosmopolitan downtown area by facilitating the development of more downtown housing, retail and entertainment uses. This is one improvement that the City could work on as a strategy to attract and retain workers, especially young professionals. The balance of this section describes the various trends and perspectives regarding where people choose to live once they have decided to be in the region. From the City s perspective, housing for people who work in the City but live outside it should be considered leakage, meaning that those are potential residents who have leaked out to other jurisdictions. STEVENS POINT AS EMPLOYMENT CENTER Employment is a significant factor in deciding where to live, and Stevens Point is one of several major employment centers in central Wisconsin. Table 3.11 shows the companies in the Stevens Point area that employ the greatest number of people.
49 48 Table 3.11 Top Employers in Stevens Point Company Name Industry Employees Location Sentry Insurance Group Insurance 2,000 Stevens Point UW - Stevens Point Schools-Universities & Colleges Academic 1,200 Stevens Point Mc Cain Foods USA Inc Frozen Food Processors (mfg.) 700 Plover Lands' End Vending Machines 700 Stevens Point AIG/Travel Guard Travel Insurance 600 Stevens Point Skyward, Inc. Software 515 Stevens Point Associated Bank Banks 475 Stevens Point H O Wolding Inc Trucking-Motor Freight 450 Amherst Donaldson Co Filtration Equipment-Manufacturers 400 Stevens Point Copps Food Ctr Grocers-Retail 360 Stevens Point Verso Corp Paper-Manufacturers 350 Stevens Point Worzalla Publishing Co Printers (mfg.) 350 Stevens Point Source: City of Stevens Point According to ACS data, approximately 13,994 of the City population age 16 years and over (61%) was employed during this time. However, according to ACS data about transportation trends, the total number of people working in the City is 23,213, of which 9,450 live in the City too (see Table 3.12). This means that City is home to roughly 4,500 people who commute to a workplace outside the City, and there are about 14,000 people who live elsewhere and commute into the City. In other words, the workday population of the City increases by about 9,500 people. The importing of workers from homes in other jurisdictions appears to be increasing, too. The City is aware of 2016/2017 increases in employment at the following companies in Stevens Point (though numbers are uncertain): Service Cold Storage: recently hired additional employees Stevens Point Brewery: recently hired additional employees Marshfield Clinic: recently added a Cancer Center Ministry Saint Michael s Hospital: recently hired additional employees Aspirus Urgent Care: adding an Emergency Room (expanding current facility size from 40,000 to 80,000 SF) Cobblestone Hotel: 61-room hotel being built downtown WHERE DO STEVENS POINT S WORKERS LIVE? There are two sources of data to answer the question of where Stevens Point s workers live. Census Transportation Planning Products (CTPP) maintains data on where workers commute to and from. The most recent data available from CTPP is based on ACS data. According to this data, approximately 41% of employees live within the City and another 15% live in the Village of Plover. The remainder live in surrounding towns, villages and cities (see Table 3.12).
50 49 Table 3.12 Top Ten Places of Residence for All Workers Community Number of Workers Percentage City of Stevens Point 9, % Village of Plover 3, % Town of Hull 1, % Town of Stockton % City of Wisconsin Rapids % Town of Sharon % Village of Whiting % Town of Plover % Town of Linwood % Town of Dewey % Other Places of Residence 5, % TOTAL 23, % Source: ACS Special Tabulation: Census Transportation Planning Products. Another source that can be used to identify where workers live is the community housing survey, which asked respondents to indicate their specific place of residence. Table 3.13 lists the top ten places people who took the survey live. Just over two-thirds of survey respondents reported that they are from Stevens Point. Another nearly 10% live in the Village of Plover, 6% live in the Town of Hull, 2% live in the Village of Whiting and 2% live in the Town of Stockton. Table 3.13 Community Survey Respondents Place of Residence Community Percentage City of Stevens Point 67.6% Village of Plover 9.4% Town of Hull 5.6% Village of Whiting 1.9% Town of Stockton 1.7% Village of Park Ridge 1.4% Town of Sharon 1.3% Town of Carson 0.8% City of Wisconsin Rapids 0.7% Town of Linwood 0.7% Other Places of Residence 8.9% TOTAL 100% Source: 2017 Stevens Point Housing Survey
51 50 WHY DO PEOPLE LIVE OUTSIDE THE CITY OF STEVENS POINT? SURVEY RESPONSES Survey respondents were asked to rank certain issues in order of importance when it comes to selecting housing. The most important issues to respondents were Cost/Value and Safety while Proximity to UWSP was the least important (see Figure 3.43). Survey respondents who do not live in Stevens Point were asked why they do not live in the City. The most common responses were I couldn t find the housing I wanted in Stevens Point and Other. Common Other responses included want to live in Plover-it is more prosperous and has more development potential, want to live in a more rural location, houses for the same price we are paying are in much worse shape in the City of Stevens Point, and too crowded rental space available is more suited for students than working professionals (see Figure 3.44). Figure 3.43 Community Survey Responses: Please rank the following issues in order of importance to you in selecting housing. Cost/Value Safety Neighborhood Proximity to work Proximity to parks and/or outdoor recreation facilities Proximity to restaurants, shopping and entertainment Schools Proximity to extended family Proximity to UWSP Least Important.....Most Important
52 51 Figure 3.44 Community Survey Responses: If you do not live in the City of Stevens Point, please indicate why. 70.0% 60.0% 50.0% 40.0% 30.0% 20.0% 10.0% 0.0% Not applicable - I live in the City of Stevens Point I couldn't find the housing I wanted in Stevens Point Property taxes are too high Housing prices are too high To live closer to family To live closer to my spouse's job Other (please specify) Approximately 65% of respondents strongly agree or agree that there are appropriate and adequate housing options available within Stevens Point. Approximately 43% disagree or strongly disagree. Common responses for why respondents disagree or strongly disagree include not enough affordable options, housing is in poor condition, need more variety of housing and there are too many rentals for college students. The survey also asked respondents if better housing options in Stevens Point would affect their decision to move to Stevens Point. For those respondents not already living in the City, 44% said it would not affect their decision to move to the City. Twenty-two percent (22%) said they would move here if they could find the housing they want. Twenty-two percent (22%) said they would be more likely to move to Stevens Point with better housing options and 12% said better housing would only be a minor factor in their decision to move to Stevens Point (see Figure 3.45). Figure 3.45 Community Survey Responses: Would better housing options affect your decision to move to the City of Stevens Point? 12.1% No, it would not affect my decision to move here 21.8% 44.2% Yes, I would move here if I could find the housing I want 21.8% Yes, I would be more likely to move to Stevens Point if there were better housing options Yes, though it would be a minor factor in my decision to move to Stevens Point
53 52 PROPERTY TAXES Based on 2015 data from the Wisconsin Department of Revenue, Stevens Point s effective tax rate is lower than regional peer communities, but is still higher than the selected nearby towns and villages (see Table 3.14). It is generally expected that towns will have lower tax rates than cities and villages because they maintain far less infrastructure and services. Among cities and villages, those jurisdictions that experienced most of their population growth within the past 40 years have a built-in advantage over older communities: their infrastructure is younger and they have not yet needed to replace many pipes and roads installed during that period. Out of all of the selected communities, Wisconsin Rapids has the highest effective tax rate at and the Town of Linwood has the lowest at Stevens Point s effective tax rate is approximately 21% lower than Wisconsin Rapid s and approximately 29% higher than Linwood s. An important comparison is with the Village of Plover, because it is, to many residents, effectively indistinguishable from Stevens Point. Homebuyers and owners will see an annual property tax savings of about $250 per $100,000 of home value when choosing Plover instead of Stevens Point. Table Effective Tax Rate Comparison Community County 2015 Effective Tax Rate Taxes on $113,600 home Difference vs. Stevens Point 2015 Population Town of Linwood Portage $1,746 -$708 1,122 Town of Plover Portage $1,772 -$682 1,724 Town of Stockton Portage $1,794 -$660 2,987 Town of Carson Portage $1,828 -$626 1,313 Town of Hull Marathon $1,872 -$ Village of Park Ridge Portage $1,895 -$ Village of Whiting Portage $2,027 -$427 1,685 Town of Plover Marathon $2,110 -$ Village of Plover Portage $2,175 -$278 12,515 City of Stevens Point Portage $2, ,037 City of Marshfield Wood $2,590 $136 18,244 City of Wausau Marathon $2,917 $463 39,063 City of Wisconsin Rapids Wood $2,980 $526 18,577 Source: Wisconsin Department of Revenue (including 2015 population estimates) *The median home value in Stevens Point based on ACS estimates

54 53 SUPPLY OF AVAILABLE LOTS Figure 3.46 below shows that there are nearly 360 undeveloped, residentially-zoned lots in Stevens Point. It should be noted that many of these lots are not on the market. Some contain wetlands and/or floodplain that constrain development, but most are simply owned as longterm investments, or even as a means to expand an adjacent lot, and the owners are not motivated to sell. The City is somewhat limited by the location of floodplain and wetlands as shown in Figure Wetlands primarily limit development in the northern part of the City while floodplains primarily limit development on the west side of the City. Even with these limitations, there still appear to be undeveloped residential lots scattered throughout the City. Figure 3.46 City of Stevens Point Available Residential Lots
 that shows all of the Villages and Towns within each driving distance.")
55 54 Figure 3.47 Floodplain and Wetlands in Stevens Point COMMUTING According to ACS data, approximately 62% of the City s population has a daily commute that is less than 15 minutes (see Figure 3.48). Figure 3.49 shows a drive time map of the City of Stevens Point (red= 15 minutes and green=20 minutes) that shows all of the Villages and Towns within each driving distance. Many communities surrounding Stevens Point are included in the 15- and 20-minute drivesheds.

56 55 Figure 3.48 City of Stevens Point Commute Times 40.0% 35.0% 30.0% 25.0% 20.0% 15.0% 10.0% 5.0% 0.0% Less than 10 minutes 10 to 14 minutes 15 to 24 minutes 25 to 34 minutes 35 to 44 minutes 45 to 59 minutes 60 or more minutes Source: ACS *error exceeds 10% threshold for all estimates Figure 3.49 City of Stevens Point Drive Time Map Source: ESRI Business Analyst Online
57 56 LOCAL EXPERT PERSPECTIVES ON HOME LOCATION We asked all of the interviewees to identify the factors affecting choices about where to live in the Stevens Point area. Most identified one or more of the following items: Buyers and renters are attracted to new or newer construction. Plover, by virtue of geography and more permissive development practices, has a majority of the new units in the local market. Buyers and renters are drawn to these units. The quality of the local schools is a factor that attracts people to the area, but it does NOT seem to be an important factor in decisions about choice of community within this area. The distinction between Plover and Stevens Point is NOT important to most residents. When deciding where to live, people are focused on the type of unit and neighborhood environment that they want and most who want to live in the city don t really care whether they are in Stevens Point or Plover. Some residents just prefer to be in a rural area with a larger lot. 3.5 REGULATORY PRACTICES The City has two basic tools to manipulate the housing market in the interest of residents: financial incentives and regulatory requirements. This section documents several of the City s regulatory practices. DEFINITION OF FAMILY IN ZONING CODE Many communities, including most university towns in Wisconsin, regulate the number of related people that can live together in the same unit, in order to prevent a concentration of adult residents in units intended for families and associated issues such as excess parking and activity. Stevens Point defines family as an individual, or two or more persons related by blood, marriage, adoption, foster child arrangement, or similar legal relationship and functioning as a single housekeeping entity, or such individual or person plus one individual not having such similar legal relationship but functioning as a part of the single housekeeping entity (Chapter 23). This definition prohibits more than two unrelated individuals from living in a home together in all residential districts in Stevens Point, unless a home is listed on Stevens Point s rental registry (see below). Other communities in Wisconsin have similar standards that regulate housing occupancy. Wausau (home to UW-Marathon County) limits a family to no more than three unrelated people. Whitewater (home to UW-Whitewater) has the same limit. La Crosse (home to UW-La Crosse) limits a family to no more than four unrelated people. Platteville (home to UW-Platteville) takes another approach and sets minimum standards for residential rental properties in a Rental Code. This code states that no more than four unrelated persons may live together and units located in a Limited Occupancy Residential Overlay district may be limited to no more than two unrelated persons.
58 57 RENTAL UNIT OPERATING LICENSES The City of Stevens Point issues licenses for operation of rental units with 3 or more units, or units that have 4 or more unrelated individuals within a single unit. These licenses are sometimes referred to as student licenses and allow owners/operators to legally rent to more than 2 unrelated adults. They are available only for those units that were being rented to more than two unrelated occupants at the time that that regulation was approved (they are grandfathered ). Licenses are issued and renewed on an annual basis. As part of the license, the owner/operator of each rental unit has to agree to inspection by the City s Building Inspector and to fix any violations that Stevens Point s ordinance deems the operator as responsible for (Sec ). As of December 2016 there were 3,112 rental units listed in Stevens Point s Rental Registry Program. This number is lower than reported in the ACS data because the City only requires landlords to register if they operate a multi-family property that has three or more units or four or more unrelated persons in a unit. Thus, the list does not include the approximately 43% of rental units that have two or fewer units and two or fewer unrelated persons per unit. Rental programs such as Stevens Point s are designed to ensure the health and safety of tenants. Based on interview feedback, most stakeholders (landlords, tenants, neighborhood residents) are appreciative of the City s efforts to regulate student housing. Some landlords/property management companies have experienced frustrations with inconsistent or overzealous inspections, but City staff and elected leadership have been good about communicating with property managers and resolving frustrations. Some student survey respondents noted that the units in the registry program that allow more than 2 unrelated renters are generally of lower quality than other units in the City, and so people who want to share housing with two or more roommates are limited to those units. Of the 3,112 units in the Rental Registry Program, 1,136 (36%) are known to be occupied by more than two people (presumably unrelated), and they accommodate 4,400 renters, or about 2,130 more than if those units all complied with the 2 unrelateds rule. Conversely, there are about 4,200 rental units in the City that are not allowed more than two unrelated residents. It is difficult to know how many units might accommodate more residents if this rule were relaxed or eliminated. With that caveat, it is noteworthy that if 20% of those units were to be occupied by three people instead of two, those existing units would accommodate an additional 840 people. Several interviewees identified this rule as an impediment to a healthy housing market, because they believe it restricts living arrangements that are not problematic, such as an unmarried couple and a friend choosing to live together. CONDITIONAL USE PERMITS FOR ALL MULTI-FAMILY HOUSING Multifamily housing, defined in the City Zoning Code as having three or more units, can be approved only in the R-4 Multiple Family I Residence District and R-5 Multiple Family II Residence District, and only as a conditional use (23.02(1)(f-g)). The requirement for a conditional use permit (CUP) triggers a public hearing for any such development and opens development
59 58 proposals to the possibility of unique and potentially onerous conditions. This unusual requirement grants neighbors and market competition (other landlords) the opportunity to comment on and object to every new multifamily project. Many of the interviewees for this study identified this ordinance as an unnecessary impediment to new investment in the City s housing market. 3.6 OTHER ISSUES SPECIAL NEEDS HOUSING AND SUPPORT SERVICES There are two residential properties in Stevens Point targeted to disabled populations. The property operated by CAP Services is located at 2748 Frontenac Avenue and provides housing for eight adults with development disabilities. CAP Services is a private, non-profit corporation that offers over 30 programs in five counties in Wisconsin in the areas of job skills & economic security; business coaching & lending; community & real estate development; housing & transportation; child & family development; health, wellness & safety; and advocacy and community engagement. The John Slaby Villa property, managed by Impact Seven, is located at 449 Frederick Street North and serves individuals with physical disabilities through three 1- bedroom units, four 2-bedroom units and one 3-bedroom unit. The property uses HUD Section 811 subsidies. Both properties typically have long wait lists indicating that the City could use more of this type of housing. NEIGHBORHOOD DELINEATION AND DISTRESSED NEIGHBORHOOD ANALYSIS NEIGHBORHOOD DELINEATION Neighborhoods and neighborhood-based organizations are an important part of everyday life in a healthy city. Within a neighborhood, residents share common experiences around housing, schools, parks and access to healthcare and retail services. They also share in the negative impacts of crime or dilapidated properties, which affect property values and perceptions about the neighborhood. Neighborhoods are an important anchor for the social fabric of a larger community, and the City has indicated a desire to identify neighborhoods and foster the creation of neighborhood associations throughout the City. We strongly endorse this initiative. Figure 3.50 shows potential neighborhoods within the community based on geographical and economic features, and input from City staff.
 provide investors with a federal tax credit for investments made in businesses or economic")
60 59 Figure 3.50 City of Stevens Point Neighborhood Delineation NEW MARKET TAX CREDITS New Market Tax Credits (NMTC) provide investors with a federal tax credit for investments made in businesses or economic development projects located in distressed communities in the nation. NMTC can be used for real estate projects, provided that not more than 80% of the income from the projects comes from rental housing. Stevens Point has three Qualified census tracts under the NMTC program. These census tracts are considered Severely Distressed and qualify for the program because they have poverty rates greater than 30% (33% in 9610, 36% in 9604 and 40% in 9603 according to ACS data) and census tract 9604 also has an unemployment rate at least 1.5 times the national average of 7.9% (12.2% according ACS data) (see Figure 3.51). The City should consider promoting NMTC for use within these three census tracts for real estate projects and other commercial projects that could benefit a neighborhood or the entire community.
 has funds available to assist income-eligible homeowners")
61 60 Figure 3.51 NMTC Eligibility Map Source: cohnreznick.com REDEVELOPMENT/REHAB PROGRAM FUNDING AND VIABILITY COMMUNITY DEVELOPMENT BLOCK GRANT Stevens Point Community Development Block Grant (CDBG) has funds available to assist income-eligible homeowners make repairs to their homes. The funds are available as a 0% simple interest 30-year deferred loan, which is due upon sale of home or if it is no longer a person s primary residents. Funds are also available to landlords renting to income-eligible tenants as a 0-3% interest monthly payment 10 year loan. The landlord must commit to rent to income-eligible tenants for at least 5 years and rent and utilities must be kept within local rental limits.
62 61 TAX INCREMENTAL FINANCING The City of Stevens Point currently has five active tax increment financing (TIF) districts. As of 2016 the districts combined value increment was $95,357,200. TIF is a finance tool that the City uses to provide funds to construct public infrastructure, promote primarily commercial and industrial development opportunities and expand the future tax base of the City. Existing TIF districts can be held open an extra year beyond their expected closure to provide funds that improve the City s housing stock. Wis. Stats (6)(g) states that: 1. After the date on which a tax incremental district created by a city pays off the aggregate of all of its project costs, and notwithstanding the time at which such a district would otherwise be required to terminate under sub. (7), a city may extend the life of the district for one year if the city does all of the following: a. The city adopts a resolution extending the life of the district for a specified number of months. The resolution shall specify how the city intends to improve its housing stock, as required in subd. 3. b. The city forwards a copy of the resolution to the department of revenue, notifying the department that it must continue to authorize the allocation of tax increments to the district under par. (a). 2. If the department of revenue receives a notice described under subd. 1.b., it shall continue authorizing the allocation of tax increments to the district under par. (a) during the district s life, as extended b the city, as if the district s costs had not been paid off and without regard to whether any of the time periods specified in par. (a) 2. To 8. would otherwise require terminating the allocation of such increments. 3. If a city receives tax increments as described in subd. 2., the city shall use at least 75 percent of the increments received to benefit affordable housing in the city. The remaining portion of the increments shall be used by the city to improve the city s housing stock. The City s districts are all planned to close between 2028 and While the City will not be able to use this extra year tool to capitalize a housing fund for another ten years, it should plan for this option in the future. The money can be used to support housing anywhere in the City, not just within the original TID. INFRASTRUCTURE CHALLENGES There are few infrastructure-related impediments to the growth of the City, including residential growth. The City s wastewater treatment and water supply facilities have the capacity to support growth, and there are good transportation corridors through the City. For infill development that would add new units within existing neighborhoods, the infrastructure systems are ready to support that growth. The one notable impediment to growth is related to the outward growth of the City into undeveloped lands. Such development requires the extension of water and wastewater pipes in many places there are gaps of hundreds or thousands of feet between developable land and the nearest sewer and water mains. To service those lands, pipes need to be extended past existing, low-density development or other features that do not need the service. Though
63 62 development is commonly expected to cover the cost of the infrastructure that serves it, whatever those costs may be, developers may and sometimes already have concluded that they can t or won t risk carrying the added cost of major pipe extensions, especially if they have easier opportunities in other communities. If desiring to attract more new-home, single-family development, the City may need to help cover the cost to bring sewer and water to the edge of development land. On a related note, the City should consider the long-term costs of outward growth. All infrastructure requires maintenance and, eventually, replacement. While most new infrastructure is built by developers and then accepted by the City, future maintenance is a public liability shared by all City taxpayers and utility ratepayers. The City should pause to consider whether the density of taxable land improvements is high enough to cover the future costs for the roads and pipes that serve those improvements. While there are no widely accepted benchmarks or methods to calculate what constitutes a sustainable balance between infrastructure costs and development density, we suggest as a simple metric the ratio of all taxable, improved property value to the acreage of all developed lands. New development areas should at least meet that City-wide ratio, or exceed it if the City wants to improve its long-term cost structure (and property tax rate). ADAPTIVE RE-USE REDEVELOPMENT HOUSING OPPORTUNITIES Stevens Point does not have many vacant or underutilized structures that would be adaptable for housing use. The City s greatest challenge with vacant buildings is medium- and big-box retail buildings. While those buildings themselves usually aren t suitable for residential use, the sites could be redeveloped as mixed-use nodes that retain most of the original big box structure but then use some of the parking lots for new housing, either standalone or in a mixed-use format over retail. The obvious question where does the parking go? can be solved through a combination of structured parking (underground or above), on-street parking, near the site, shared parking among uses with different peak parking demand times, and/or the strategic limitation of commercial uses to those that generate less traffic. The City has several sites like this now and could continue to face challenges with vacant big boxes due to the volatility of retail and the transition to on-line purchasing. These sites are along major transportation corridors. Planning for the improvement of these sites should occur with the involvement of nearby residents and should be coordinated with wider neighborhood planning efforts. HISTORIC HOUSING PROPERTIES AND PRESERVATION PROGRAMS The City of Stevens Point has two Historic Districts that include housing: the Clark Street Historic District (see Figure 3.52) and the Downtown Historic District/Design Review District (see Figure 3.53). These districts exist to ensure new construction and remodeling projects are consistent with the historic character of the existing buildings (Chapter 22 of the City s Municipal Code). Those requirements are a long-term benefit to the character and quality of the community but they can also become a short-term impediment to investment.


64 63 Figure 3.52 Clark Street Historic District Figure 3.53 Downtown Design Review District GREEN BUILDING COST/BENEFIT AND PROGRAMS Stevens Point has a reputation as a place that values sustainability and green development. This is due, in our opinion, to the City s Eco-Municipality efforts initiated about 10 years ago, and
65 64 also to the reputation of UW-Stevens Point, known for its College of Natural Resources and a strong student-supported sustainability ethic. However, green development techniques that are resource and energy efficient did not often come up in the survey results or interviews for this study as a high priority for local housing. We observe that this is likely due to several factors, including the relatively low cost of energy at this time and a common perception and expectation that most new development will be energy and efficient. NATIONAL TRENDS AFFECTING STEVENS POINT S HOUSING MARKET HOUSEHOLD SIZE AND HOUSE SIZE Household size the number of people living together has been in decline for more than 50 years due to multiple related trends. In 1960 the average US household size was 3.35 people, and by 2010 it was Causes include declining birthrates, declining marriage rates and increasing age of first marriage, as well as increased longevity. Although household size has been shrinking, the median square footage of new single-family homes constructed in the United Stated increased from 1,525 SF in 1973 to 2,467 SF in According to ACS data, 55% of owner-occupied units in Stevens Point contain three bedrooms. The median square feet of new multi-family housing constructed for rent in the United States has also increased from 1,012 SF in 1999 to 1,057 SF in According to ACS data, nearly 50% of rental units in Stevens Point contain two bedrooms. So while households are getting smaller, new housing is getting larger. HOME OWNERSHIP PREFERENCES The US Census shows that homeownership rates have fluctuated (particularly from the late 1990s to the late 2000s) over the past 26 years, but the current rate is very similar to where it was 30 years ago (64.8% in 1977Q1 and 63.7% in 2016Q4) (see Figure 3.54). Though we have not yet seen the homeownership rate stabilize, there is reason to believe that homeownership is still a very common aspiration, even among Millennials (born early 1980s to early 2000s). When comparing millennials housing location preferences (i.e. downtown, older suburbs, newer suburbs), their choices are not very different from where their parents chose to live. Though many millennials are renting longer than previous generations and delaying homeownership due to economic issues (e.g. student loan debt prevents saving up for a down payment) 3. The types of neighborhoods millennials and other generations desire to live in are changing. The dominant trend in community planning and development after World Water II was the segregation and concentration of uses and housing types stores here, single family homes there, apartments somewhere else. This trend has been shown to weaken neighborhoods and communities by isolating people. It is not generally recognized that healthy neighborhoods are those that people can stay in over time as their needs and interests change. Healthy neighborhoods include a mix of housing types, sizes and price points, and they often include or are near stores and restaurants. Healthy neighborhoods are also walkable, enabling anyone Ibid. 3
66 65 unable to drive kids, seniors the ability to get around safely. Walkable neighborhoods with a mix of housing types and nearby retail are desirably for millennials and baby boomers two of the largest cohorts in the US. This is an important trend, especially in communities with older neighborhoods and housing stock. Figure 3.54 US Census Non Seasonally Adjusted Homeownership Rate for United States Source: datatype=hor&geolevel=us¬adjusted=1&submit=get+data&releasescheduleid= LENDING REGULATIONS Lender underwriting requirements are still strict in the wake of the housing crisis that caused the Great Recession. Provisions of the Dodd-Frank Act have raised anxiety about access to home loans at times, including a rule that became effective in 2014 compelling banks to verify that borrowers debt-to-income ratio doesn t exceed 43 percent of their gross income. However, despite these regulations, local lenders, realtors and borrowers are not reporting much difficulty getting loans. This is not a critical housing impediment in Stevens Point. 3.7 GAPS BETWEEN SUPPLY AND DEMAND For the purposes of this study, gaps are gaps between supply and demand within the regional housing market, such that people who work, go to school or want to live in the area are unable to find what they consider to be appropriate housing. This section identifies and describes the
67 66 gaps in the regional housing market. It builds upon the data of the prior sections and features more interview and survey results that document breakdowns and shortcomings of the market. It is worth noting here that this study did not find strong evidence of one core issue of concern at the outset of this study: housing issues do not appear to be a significant problem for employee attraction and retention. The critical external issues that affect recruitment and retention are mostly related to the size and location of Stevens Point. Stevens Point is a relatively small city in a cold climate with a nice but modest downtown. Some applicants, especially younger people, prefer a bigger, more urban place to live. The one important link to housing investment is the oppportunity to spur downtown commercial vibrance and diversity with more downtown housing units. INADEQUATE SUPPLY OF DESIRABLE, MODERATELY-PRICED SINGLE FAMILY HOMES When survey respondents were asked what types of housing the City needs, the top two responses were single family homes for first-time homebuyers (35%) and moderately-priced homes (34%). This was consistent with what was discussed during stakeholder interviews and what was found during the analysis of MLS data. The median sale price of single-family homes in 2016 in Stevens Point was $119, estimates suggest that the median monthly housing costs for homeowners was $1,115. In order for this to be considered affordable (meaning a household pays no more than 30% of its gross income towards housing costs), a household would need to make $44, ACS estimates show that household median income in Stevens Point was $40,081. An affordable monthly housing costs for households making $40,081 is $1,002. This demonstrates that although housing cost may be lower as compared to some of the regional peer communities, the housing in Stevens Point can still be considered higher than desired when looking at household incomes within the City. While that affordability analysis suggests a need for more housing below $120,000, interview and survey feedback more consistently point to a need to housing in the $150,000-$200,000 range. This likely reveals a problem with the quality of many of the units on the market around that median price Stevens Point has a relatively high number of homes that were built before 1950 (45%) making them more likely to have poor energy performance and higher maintenance costs, and they sometimes lack things that homebuyers desire such as attached garages. According to community survey respondents, approximately 54% of homeowners have invested $2,500 or more in home improvements in the last five years and 62% of respondents said they would or would be likely to invest $2,500 or more in home improvements over the next year. Survey respondents were asked what these improvements were and top responses included flooring, new roof, paint, windows and basements. Even with that detail provided, it is difficult to know whether those investments are generally just basic maintenance to prevent deterioration, or improvements that could increase the value of a home. That being said, the high costs associated with owning an older home can be undesirable to some homeowners.
68 67 INADEQUATE SUPPLY OF DESIRABLE, MODERATELY-PRICED, RENTAL UNITS FOR THE NON-STUDENT POPULATION Another common response from the Community Survey is that more rental housing is needed, in particular for non-student households. When asked what types of housing the City of Stevens Point needs, the third most popular response in the survey was rental housing (23%). Figure 3.10 shows that many of the multi-family buildings in Stevens Point were built prior to 1950 (65%). These older apartment units present the same challenges that older single-family homes do. The median contract rent in Stevens Point is $577 per month according to ACS data. In order for this to be considered affordable (a household pays no more than 30% of its gross income towards housing costs), a household would need to make $23,080. The median household income is well above this in the City ($40,081), however the per capita income is only $21,320. Thus an individual person renting an apartment is more likely to be cost burdened. An affordable monthly rent for a person making $21,320 is $533. Feedback from the community survey on the topic of rental housing indicated that over 70% of current renters would be looking for a two or three bedroom unit should they choose to move. Respondents also expressed the feeling that too many rentals are for college students and that there are not enough apartments directed towards other types of households, for both size and location. This sentiment was reinforced in the interviews, in which we heard about the need for rental units for young professionals that are small (to manage cost, and because these residents don t yet have families), but of a higher quality than most current existing small rental units. Interviewees noted a need for all unit sizes except 2-bedroom units, which are in ample supply. Efficiency/studios, one-bedroom and 3-4 bedroom units are all needed. Also noted was the lack of supply of higher-end units for higher-income residents. People who live in the area for a limited time period, or who are working on selling a home somewhere else and unable to carry two mortgages, are candidates for these units. INADEQUATE QUALITY OF STUDENT HOUSING/APARTMENTS Students make up roughly one-third of the population in the City, which impacts housing needs for the City as many students live in off-campus housing, typically rental housing. Survey feedback from students revealed that a majority of those respondents (83%) believe their housing is in Good or Fair condition, but twenty-two percent (22%) of student respondents are dissatisfied with the quality of housing and 28% are dissatisfied with the amenities of their housing. Generally, comments from the survey focused on the desire for better quality, more affordable housing for students. Students tended to agree that the amount of rent charged is too high for the quality they are receiving. Interviews with students also reinforced that the quality of student housing in Stevens Point may be an issue. Interviews revealed that students are concerned about the safety of rental units, citing six fires in the last 18 months, including 5 believed to be due to unsafe conditions. A majority of student respondents who took the survey (70%) believe the City should focus on rehabilitation of older housing units instead of construction of new units.
69 68 INADEQUATE SUPPLY OF DOWNTOWN AND RIVERFRONT HOUSING The interviews revealed a consistent call for new units in two specific places: downtown and along the riverfront. The downtown is doing well right now, and the upper-story apartments are favorably viewed and in high demand. But people compare Stevens Point to other cities, such as Wausau, and note that there are relatively few such desirable apartments. A supply of new units within easy walking distance of the downtown core, especially with a contemporary, loftstyle design, would offer something not currently available in this market. Further, an influx of residents in the downtown area would support the continued growth and diversification of downtown retail and restaurants, which would benefit the entire community. The other frequent opportunity cited (or gap depending on your perspective) is waterfront housing. Despite more than a mile of urban waterfront along the Wisconsin River, there are very few residential units located near to or oriented toward the river. As communities across the country have been rediscovering their waterfronts as value-adding amenities. Multifamily or mixed-use developments with views of the river should be encouraged, and would likely occur as redevelopment of waterfront parking lots and/or low-density, single family homes.
70 69 CHAPTER 4 - RECOMMENDATIONS About These Recommendations It is not the responsibility of City government to provide housing for City residents. Market forces do a reasonably good job of meeting housing demand with housing supply, at least at a regional level. The purpose of this study is to identify gaps between supply and demand, especially within the City of Stevens Point, and to offer strategies for the City to influence the function of the private housing market so that more people will choose to live here, in Stevens Point. The recommendations that follow are focused on spurring housing investment and promoting balanced, attractive neighborhoods within the City of Stevens Point. But these initiatives also serve the interests of the regional economy and community, and the various employers and institutions located here. The perceived and actual vitality of Portage County is tied to the vitality of its largest city, and the vitality of that city depends upon a healthy housing market. All of these recommendations are valid opportunities to improve the local market, but the City will be challenged to pursue them all at the same time. To help the City prioritize its limited resources, the end of this chapter features a set of three Alternative Approach Packages that describe different big-picture outcomes and explain how these recommendations would be prioritized to achieve one of those outcomes. Finally, keep in mind that these are a consultant s recommendations, and not a plan adopted by the City. It is up to City Council, housing developers and other local stakeholders to apply the data and ideas in this study. The Most Important Finding A fundamental conclusion of this study is that population growth will continue in Portage County. This is based on growth projections by the State and reinforced by the continued growth and optimistic outlook of a diverse local employment market. These projections suggest the need for about 2,800 housing units in the County over the next 25 years. The share of that growth that will occur in the City of Stevens Point is dependent on the City s efforts to attract residents. These are modest numbers (averaging about 110 units per year, county-wide), but even this modest rate of growth will allow Stevens Point to make changes to its housing market through growth. It is far easier to leverage private sector investment for community benefit when that investment is occurring somewhere in the market. 4.1 WHAT HOUSING IS NEEDED IN STEVENS POINT, BY TYPE, PRICE POINT AND AMENITIES? Single-Family, Detached Stevens Point needs more new single-family homes. Market conditions are strong right now for continued growth of this housing type, both nationally and locally. Widely-observed trends among Millenials toward rental housing in urban settings are real, but likely represent simply a delay in the typical progression of major life events due to a difficult economy for young workers
71 70 over the past 10 years. Millenials want single-family houses too, and the City can capture more of that part of the market by planning for the growth of new neighborhoods at its eastern edge. A diversity of unit sizes and price points is most desirable, within a range from $150,000 to $300,000 in current dollars. The lower end of this price range is not easily achieved in new construction, and will require the commitment and creativity of developers, and/or public subsidy of some sort. A selection of smaller units on small lots is encouraged within a mix of unit sizes and price points. Homes priced above $300,000 are generally outside the budget capacity of most County residents, are harder to sell when that time comes, and should neither be a priority of City initiatives nor make up a large portion of new neighborhood development in the City. Stevens Point also needs to improve the quality of its existing single family homes. Strategies to achieve this are offered in a later section, but this point deserves repeating. One of the reasons that average incomes are low in Stevens Point is the aging, deteriorating housing stock. Anecdotal and statistical data confirm that there are lots of potential residents able and willing to pay more for housing than the average cost in Stevens Point, and they are selecting housing in other jurisdictions because that s where they find units they deem acceptable. Even at a modest cost, many houses in the City are viewed as too run-down and needing too much investment to justify that cost. Regarding amenities, community survey results indicate that home buyers are looking for convenient laundry facilities, fully enclosed parking, adequate storage, and energy efficient appliances. These are all challenges for many older homes, and should be priorities for programs intended to help modernize those homes. Student Rentals Students comprise a sizeable (though declining) portion of the City population (roughly onethird) and there are likely more than 1,000 private rental units in the City occupied by students. When surveyed and interviewed, students reported a poor opinion of the condition of those units, especially in relation to cost. However, they also reported that they were personally able to find acceptable housing. Whereas just 45% of all survey respondents agreed with the statement that there are appropriate and adequate housing options available in the City, 57% of students agreed with that statement. In terms of amenities, students (who are almost all renters) want most of the same things that other renters want, including laundry machines in the unit, energy-efficient appliances, storage space, and the ability to keep pets. Students have lesser expectations for covered or enclosed parking. It is noteworthy that more than 70% of student survey respondents consider laundry machines in their unit a necessity. As student-oriented housing is constructed or refurbished, these amenity preferences should be considered. It is also noteworthy that the survey results indicate a willingness to spend more on housing whereas only 35% are currently paying more than $500 per month, about 53% are willing to pay more than $500 per month. We see in these responses some opportunity to offer higher-quality units, either through new construction or renovation. The critical housing issues regarding student housing are these: basic health and safety, and impacts of private student rental housing on property values and quality of life for non-student
72 71 neighbors. The City should continue its efforts, through staffing and outreach and regulation, to address these issues. Regarding health and safety, the City has been considering a program that would result in routine, voluntary inspections of all rental units, including single family and duplex units. It is our opinion that the City should wait and watch while other communities attempt this level of inspections, including Oshkosh and Wausau. In the meantime, and perhaps as a long-term solution, the City should work with the University and the Student Government Association to improve student knowledge of unsafe conditions and their options to have those conditions repaired. Regarding negative effects on neighboring residents, we encourage the continued City investment in proactive exterior inspections for code compliance issues and the continued enforcement of the rental licensure program, including the stipulations making the owner/operator responsible for various violations, including noise. Non-Student Rentals tevens Point needs to build new multifamily rental units, including more studio and one-bedroom units, and also including units with higher-quality finishes and amenities. A surprising percentage of the City s rental properties two-thirds were built before These buildings generally have the same challenges as older single-family homes: higher maintenance costs, low energy efficiency, and lack of desirable amenities. These conditions are pushing renters to look elsewhere for housing, especially Plover. The most desirable amenities for renters based on survey responses, identified as necessary for more than half of respondents, are laundry machines in the unit, pets allowed, energy efficient appliances and storage space. Also noteworthy is the desire for enclosed parking more than 75% consider it important, including 41% who said it is a necessity. For both new units and the renovation of existing units, laundry facilities, efficient appliances, storage and enclosed parking (for at least one vehicle per unit) should be prioritized. The amenity of being allowed to keep pets is a complicated issue. About 62% of renter respondents identified this as a necessity. Property owners and managers struggle with this because of the higher risk of property damage and the regulatory restrictions around service animals. We simply encourage property owners to continue exploring solutions through which they can reasonably allow pets and cover their costs, as there is strong demand from renters to have this option. The price points for new and refurbished rental units in the City should vary. While higher-quality units are in demand, the supply of such units in Stevens Point is limited a portion of new units in the City could be targeted to those willing to pay more than $1,000 per month. While affordability is not a high priority concern, it will be important to approve new projects that utilize tax-credits in exchange for income-qualified units. We anticipate that some developers will seek this funding. Townhomes/ Zero lot line The City should encourage townhome and zero lot line formats, especially where such units can fulfill an urban design objective. Townhomes can offer density and urban character without

73 72 significant building height. While less than 4% of all units have this format right now, about 30% of survey respondents said they would consider that format for their next home. The challenge for constructing these units is the financing, because the developer typically needs to either selffinance or pre-sell the units before construction. Senior Housing/Assisted Living While senior housing was not frequently discussed during this process, or identified as a gap, the long-term market trend is toward growth of this housing type. The City should be receptive to new senior and assisted living housing projects. Several interviewees noted that the downtown would be an attractive location for older residents who are downsizing but still active and mobile, due to the walkable environment and opportunities for social interaction. 4.2 WHERE SHOULD NEW HOUSING BE LOCATED? The location of new housing is dependent on a combination of market interest, landowner interest to sell or (re)develop, and City planning and zoning regulation. The City can also influence the process through active involvement in the development or redevelopment of land, including funding incentives and even land acquisition to directly facilitate the completion of a desired project. We see three general locations for new housing within the City of Stevens Point, and we have built our Alternatives Packages around those location options in order to facilitate discussion about the various housing recommendations in this study. As illustrated in Figure 4.1 below, the City can attempt to direct development toward the downtown and nearby waterfront, along the three primary transportation corridors connecting downtown to I-39, and to the eastern edge of the City, east of I-39. Figure 4.1 Recommended areas for new housing

74 73 Downtown and Waterfront Stevens Point has relatively few housing units downtown or within easy walking distance of downtown. An influx of residents to the downtown would continue the diversification of restaurants and retail that the City is experiencing, making downtown Stevens Point a more vibrant place. There are various sites in the downtown area that could accommodate more housing, beginning with the Lullaby property at Center Point and 3 rd St and the riverfront site on the west side of the Wisconsin River, on the south side of Clark Street. The neighborhood on the west Side of the river ( River West? See our neighborhood naming suggestions later in this chapter) is notably underutilized, considering its proximity to the river and the downtown. The downtown area also has a significant amount of surface parking. It is suggested that the City work to consolidate some of that parking into one or more parking structures in order to accommodate new housing development on existing parking lots. Such structures should also serve some of the parking needs of the new housing. (Parking structure will require significant public subsidy, but should also come with the expectation of increased user costs, including both residents of downtown housing and people coming downtown to eat, shop, etc.) The Wisconsin River waterfront is currently a missed opportunity as an asset that could add value to housing units, simply by building more units with views of the river. These units would not need to directly abut the river the existing network of public open spaces and trails along the water s edge should remain, undisturbed, as that is also a valuable and unique local asset. By redeveloping sites near the river that are currently underutilized as parking lots, or storage, or low-value single-family housing, the City could add waterfront housing in a way that is compatible with the City s natural resource conservation and outdoor recreation identity. All new downtown or waterfront housing should be in some type of multifamily format, though the specific design and density could vary depending on the site. A range from two-story, zero lot line townhomes to five-story apartment buildings is suggested. Figure 4.2 indicates a variety of potential sites for redevelopment with housing. Most are currently parking lots, or entirely vacant, but a few would displace single family housing and require a public discussion about how multifamily housing could be integrated appropriately with the surrounding neighborhood. Figure 4.2 Sites Recommended for Downtown and Waterfront Housing
75 74 Along the community entrance corridors (Division, Stanley, Main) Stevens Point s three primary entry corridors are Division Street, Stanley Street, and Main Street. Though Division Street is most frequently noted as an opportunity for investment and improved appearances, all three corridors offer sites that could accommodate redevelopment with some sort of multifamily housing. It is often preferred to locate multifamily housing within convenient walking distance of retail districts and transit routes, and such development can serve as a good transitional use between single family housing and commercial uses and/or high volume traffic corridors. New development also offers the opportunity to improve the appearance of deteriorating sites, thereby improving the appearance of the corridor. Multifamily development and redevelopment would occur not just anywhere along these corridors, but more likely at specific nodes, or concentrations of urban activity. These nodes will be more dense and compact than the surrounding neighborhoods, as a result of the added residential uses, but not as compact as the downtown area, with building heights capping out at four stories and more surface parking (as compared to the suggested transition to structured parking in the downtown area). East of I-39 As noted earlier, the City should look to capture and guide the development of single-family homes. Excepting the occasional single lot or small-scale infill project, the City s opportunity for growth of single-family housing units is to the east, north and south of Hwy 10. While the main point of growth in this location would be to accommodate single family units, and while the easiest approach to development is to identify lands as suitable for housing and let the private market respond, we encourage the City to plan proactively for the development of coherent, pockets of higher-density housing, and encourage a variety of unit sizes and price points among the single family homes that develop. One important issue requiring attention to enable coherent eastward growth is a boundary agreement between the City and the Town of Hull. The City should protect its ability to grow to the east and also work to clean up the convoluted City/Town boundaries somewhat. It could offer to the Town and Town residents greater certainty about which lands may or may not be annexed, and a stronger voice in that process. 4.3 WHAT PROGRAMS SHOULD BE PROVIDED FOR HOUSING DEVELOPMENT/REDEVELOPMENT? TIF-Funded Structured Parking for New Multifamily The suggested locations for new multifamily housing are mostly either downtown or along the major street corridors. Both areas would likely require redevelopment of existing developed sites, and many of those sites have space constraints, especially downtown. Furthermore, we are encouraging multistory development, up to four or five stories. This combination of factors points to an important need, and also an expensive one: structured parking. The advantages of structured parking, meaning either underground or above ground structures, are several. They enable better site design and appearance because they consolidate what would otherwise by
76 75 an expansive parking lot around a building. And they enable covered parking for most users, something that residents have indicated as a priority. By supporting the cost of structured parking in order to achieve community design goals for more walkable and attractive neighborhoods, the City can mitigate a major impediment to redevelopment. Implementing partners: City Council Estimated overall cost: high Possible funding sources: TIF TIF Incentives for New Neighborhoods As an incentive to encourage the development of new neighborhoods, including single-family homes, the City could establish a new Tax Increment Finance district with a variety of eligible project costs. Eligible costs might include street and utility infrastructure, or gap funding for items that are difficult to pay for or finance such as underground parking or mixed use buildings at activity nodes. We offer a note of caution regarding incentives to promote outward expansion of the City. One of the reasons that the City of Stevens Point has a higher tax rate than other cities in the area, including Plover, is the age of its street and utility infrastructure. As an older community, Stevens Point is now routinely replacing existing infrastructure that has reached the end of its useful life. Other communities that have seen their significant growth occur within the last 40 years have not yet been faced with this problem, though they will eventually. The problem is this: the costs of replacing infrastructure are a huge burden, made worse when the ratio of taxable building square footage to mile of infrastructure is low. City s that find ways to remain compact, with more taxable improvements per mile of street and pipe, will be more successful over time due to the improved capacity to maintain public infrastructure. Implementing partners: City Council Estimated overall cost: varies Possible funding sources: TIF (self-funded) 4.4 WHAT REGULATORY CHANGES WOULD IMPROVE HOUSING CONDITIONS? Allow three unrelated occupants to live together Right now the City allows only two unrelated occupants in most housing units. Regulating the number of unrelated people that can live together in the same housing unit prevents the concentration of non-related adults in units intended for families. Interviewees noted that this regulation can unnecessarily limit housing options in situations that should not be a problem to this City, for example an unmarried couple who purchase a house and cover their costs by renting a room to a friend. This ordinance is more restrictive than most Wisconsin communities, and it is difficult to enforce, but it has some value in the area around the university. We are concerned that a change to this ordinance could work against efforts to manage and reverse the conversion of single family homes to rental units. We recommend an approach similar to the City of Platteville, wherein the family definition of two unrelated occupants is retained only in a
77 76 specific geographic area around the University, perhaps up to ½ mile from the campus, while the standard applying to the rest of the city can be relaxed to three unrelated occupants. This would expand housing options and bring Stevens Point into closer alignment with other cities in the region and state. Implementing partners: City Council Estimated overall cost: low Possible funding sources: N/A Eliminate the multifamily CUP requirement In Stevens Point, multifamily housing is considered a conditional use in the R-4 Multiple Family I Residence and R-5 Multiple Family II Residence Districts. A conditional use automatically triggers a public hearing and can open development proposals to onerous criticism and conditions. This can make it unusually difficult for new multi-family units to win approval. Interviewees commented that this ordinance is unnecessary and impedes the development of new multifamily housing in the City, and we concur. The City should make multifamily housing a by right permitted use in both the R-4 Multiple Family I Residence and R-5 Multiple-Family II Residence Districts. Implementing partners: City Council Estimated overall cost: low Possible funding sources: N/A Comprehensive Plan amendment The existing Comprehensive Plan designates a relatively small amount of area to residential uses east of I-39. This restricts outward growth of the City which is already bounded by the Wisconsin River to the west and the Village of Plover to the south. In much of the north and northeast portion of the City development is restricted due to the airport and other limitations such as wetland and flood zones. There is opportunity for residential development in several areas north and south of Hwy 10. Coordination with the Towns of Plover and Stockton is recommended. The City should amend its Future Land Use map to show additional land reserved for neighborhood development to the east of I-39. Implementing partners: Plan Commission, City Council, City staff, Towns of Plover and Stockton Estimated overall cost: low Possible funding sources: N/A Allow Overnight Parking One of the notable issues with the older housing in the City, and especially near the University, is excessive parking with cars parked in yards, well beyond the bounds of existing drive areas. This is a multi-faceted problem related to the number of people in the units, the inadequate size of existing driveways, and weak regulation and enforcement. It is also related to the City s prohibition on overnight parking, which forces people to find off-street parking wherever they can. As an immediate and low-cost change that could improve this situation, we recommend
78 77 that the City should allow overnight parking. To allow for snow removal, you can require alternate side parking throughout the winter months. Implementing partners: City Council, Police Department Estimated overall cost: low Possible funding sources: N/A 4.5 HOW DO WE IMPROVE THE CONDITION OF EXISTING HOUSING UNITS? There are many indicators of the poor condition of existing housing in the City, including low values (which correlate with age), resident opinions, and our own windshield survey. A majority of survey respondents (73%) believe that the City should focus its efforts on rehabilitation of older housing units as opposed to the construction of new housing. We concur that rehabilitating or replacing low-value housing units should be one of the City s top housing priorities, both because it will improve the supply of availably units within the City and because it will improve perceptions about the quality of the City s neighborhoods. Waive Permit Fees for Work on Low-Value Homes As an incentive to help homeowners pursue remodeling projects, consider waiving all permit fees for properties valued at less than $100,000. In order to make this change cost-neutral, consider increasing all fees to compensate for the waived fees. Implementing partners: City Council Estimated overall cost: low, or none Possible funding sources: increased permit fees City-Sponsored Preliminary Design Assistance Many homeowners have difficulty visualizing how their home could be remodeled to accommodate contemporary wants and needs, and they lack the funds or inclination to find an architect or skilled designer to explore the options. We recommend creating a Design Assistance Program with several local architects and designers whereby the City would pay those professionals a modest fee to visit with homeowners, discuss their wants and some potential solutions, and provide a basic sketch, ballpark cost estimate and suggested next steps for the owner s further consideration. Implementing partners: Local design professionals Estimated overall cost: low, perhaps $20,000 per year Possible funding sources: N/A Housing Modernization Loan Program City residents currently have access to a revolving loan fund managed by CAP Services and funded by Community Development Block Grant funding that offers 0% or low interest loans to income qualified households (80% of the county median income) for rehab projects such as siding, roofing, windows, plumbing, water system replacement, etc. We suggest creation of a new program with local funds that is not tied to federal program requirements and does not have income requirements. The intent is to more aggressively promote investment in homes.
79 78 Eligible applicants could include contractors and investors who explicitly buy a home for the purpose of renovating it and selling it at a profit (flipping), with the understanding that loan repayment is due at time of sale. Case Study: Cuyahoga County Heritage Home Program Cuyahoga County, Ohio, in partnership with several local cities and the Cleveland Restoration Society, offers low interest loans providing funds to modernize and make energy efficiency improvements to older homes through its Heritage Home Program. The only conditions for participation in the program are that the home is in a participating community, is at least 50 years old, is residentially zoned and contains three occupancy units or less. The loan amounts for owner-occupied residences range from $3,000- $150,000, have a term of 5-15 years, and fixed interest rates between 1.4% and 2.4% (depending on which bank the loan is from). The loan amounts for non-owner occupied residences range from $3,000 - $150,000 with a fixed interest rate of 2%. Funds cannot involve new or repair of vinyl siding or vinyl windows, luxury items such as hot tubs or swimming pools, new decks and patios, incompatible additions and landscaping. Stevens Point could consider implementing a similar program that is not income restricted. Website: Contact: Maraaret Lann at or mlann@clevelandrestoration.org We suggest the following program elements in Stevens Point: 1. Loans are available to all homeowners of single-family or duplex units built before 1950 (no income restriction, no owner occupancy requirement) 2. Assessed value of the home needs to be less than $120, Funds may be used for a wide range of repair, modernization or energy efficiency projects, provided the total project amount (for loan calculation purposes) includes no personal property, landscaping or furnishings. 4. Maximum loan of 30% of total project costs. Minimum amount of $5,000, maximum amount of $20,000.* 5. 0% interest, repayment over 10 years, or at time of sale. Not forgivable.* 6. Initial Program budget of $100,000, supplemented at a lesser amount in future years until loan repayments make it sustainable.* *Items 4-6 assume the creation of a City-funded revolving loan program. Alternatively, the City could collaborate with local banks per the Cuyahoga County example. Implementing partners: City Council, Redevelopment Authority, CAP Services (for administration) and/or local banks Estimated overall cost: $100,000 (unless implemented through local banks), plus administration Possible funding sources: TIF, general fund
80 79 Rental Conversion Program The conversion of owner-occupied homes to renter-occupied homes is a common occurrence in college towns across Wisconsin. Not all instances of this conversion are undesirable, but these conversions can create concerns among nearby owner-occupants, including noise and excessive parking. Therefore it can be desirable for these renter-occupied homes to be converted back to owner-occupied units. The City of Madison, WI and the City of Elgin, IL both have programs that offer funds to convert rental-occupied properties to owner-occupied properties and neither are restricted by income. Case Study: City of Madison Rental Conversion Program The City of Madison, Wisconsin s Small Cap TIF Loan Programs in the Greenbush and Mansion Hill-James Madison Park Neighborhoods offer funds for conversion of renteroccupied housing to owner-occupied housing for the cost of renovations plus up to 10% of the purchase price of a home, not to exceed $80,000 for a single unit property, $90,000 for a two-unit property, and $100,000 for a three unit property. There is a requirement that 10% of the funds go towards exterior renovations and funds cannot be used for demolition. Loans are available to homeowners who will owner-occupy or contractors and developers who will sell the property to an owner-occupant. These loans are 0% interest, with no debt service payments, and are forgiven after completion of the renovation work. A Land Use Restriction Agreement (LURA) must also be signed to ensure the property is owner-occupied for ten years. Website: Contact: or homeloans@cityofmadison.com Case Study: City of Elgin Residential Conversion Grant Program The City of Elgin s Residential Conversion Grant Program makes grants available for the conversion of non-conforming multi-family housing back to original conforming residential uses. Properties must be in a residential-zoned district and currently registered/licensed as a rental property by the City of Elgin. Property owners can receive a grant of $25,000 for a two-unit building and $30,000 per unit removed for buildings with three or more units. An additional $3,000 per dwelling units removed is available for properties located within low-income census tracts. Unlike the City of Madison, these funds are distributed upon completion of the conversion. However start-up funds up to $10,000 can be requested prior to conversion for materials and/or securing a contractor. Eligible participants are individuals, corporations and not-for-profit organizations. Website: Contact: or elgindca@cityofelgin.org Stevens Point should consider a similar program to what is offed by the Cities of Madison and Elgin, limited to homes within a certain distance of the UWSP campus, perhaps ½ mile. Suggested program elements include: 1. Property must be existing renter-occupied unit that borrower is converting to owneroccupied unit, located within ½ mile of the UWSP campus.

81 80 2. No income restriction. 3. Maximum loan of 30% of total project costs, not to exceed $50, % interest, repayment over 10 years, or at time of sale. 30% of the original loan amount forgivable, convertible to a grant, if the property remains owner-occupied after 7 years. 5. Demolition is allowed, if a new home is constructed and is owner-occupied. 6. Funds may be used for a wide range of repair, remodeling, modernization or energy efficiency projects, provided the total project amount (for grant calculation purposes) includes no personal property, landscaping or furnishings. Popular owner amenities will be eligible projects and are required whenever a new home is constructed, including 2- car attached garages and moving laundry facilities to a main living floor. 7. Initial program budget of $200,000, supplemented at a lesser amount in future years. Implementing partners: City Council, Redevelopment Authority, CAP Services (for administration) Estimated overall cost: $200,000, plus administration Possible funding sources: TIF, general funds Remove and Replace Some of the Worst Homes Stevens Point has some homes that are in very poor condition and have limited value, historic or otherwise. For these homes, it would be more cost effective to demolish the home and rebuild instead of investing in rehabilitation. Case Study: City of La Crosse Housing Replacement Program The City of La Crosse has created an award-winning program called the Housing Replacement Program. The program is aimed at restoring the residential character of its older neighborhoods where homes have been neglected and no longer meet the needs Example of housing that could be eligible for a Housing Replacement Program of changing demographics. Some of this neglect was due to the fact that owneroccupied units had been converted to student renter-occupied housing, similar to what Stevens Point has experienced. The program is designed to remove and replace the poorest-quality housing, thereby increasing home values immediately and also encouraging reinvestment by others. La Crosse s program was funded through CDBG and HOME funds. The program maintains funding by selling the new homes and returning funds to the City. Much of the work to rebuild the homes is accomplished with donated labor and materials from different sources, including various City departments. The City also partners with the local technical college to use the home sites as learning projects for students involved in wood technology courses.
82 81 Along with the Housing Replacement program, the City of La Crosse has a Homebuyer Assistance Program which is open to people purchasing the new homes. Also, buyers are often eligible for low interest mortgages through the Wisconsin Housing and Economic Development authority (WHEDA). Website: Contact: Caroline Gregerson at or gregersonc@cityoflacrosse.org We recommend that Stevens Point create a Housing Replacement Program focused on its oldest neighborhoods. Because the City does not have access to HOME funds, and CDBG Revolving Loan Funds are targeted to housing rehab rather than demolition and replacement, a local housing replacement program will require local funds. The advantage of this approach is that the City will be able to use its discretion about whether and when to target low-income buyers for the new homes. Suggested Program Elements include: 1. Program focus will be single family and duplex properties south of Maria Dr., north of Patch St., and west of Michigan Ave with a total assessed value of less than $40, The Redevelopment Authority (RDA) will acquire properties via purchase from willing sellers, or through other processes if the owner has stopped paying taxes and/or the property has been condemned as unsafe for habitation. 3. Properties may be sold to private developers or contractors or Habitat for Humanity for redevelopment, either before or after they have been razed. 4. As feasible, properties redeveloped by the RDA will utilize City staff and resources, volunteer organizations, and Mid-State Technical College students in need of building services skill training. 5. The target buyer could be low-income or any-income, though the assistance of volunteers and non-profit assistance should come with the expectation that the home will be sold to low-income residents (e.g. 80% of County median income). 6. Properties will be targeted to owner-occupants, with purchasers agreeing not to rent the home or sell it as a rental for a certain period of time, perhaps 10 years. The purchase price can be discounted a bit in exchange for that commitment, which could be established as a deed restriction. Implementing partners: Redevelopment Authority, City Council, City staff, developers/builders, Habitat for Humanity, volunteers, etc. Estimated overall cost: $200,000 in the first year, less thereafter Possible funding sources: TIF, general fund Student Renter Outreach A fundamental concern with the quality of housing is the risk of unsafe, even life-threatening conditions, such as decayed or improvised electrical wiring. In lieu of or in addition to direct City inspections of rental units, the City should participate in a robust outreach program to students to prepare them, generally, for off-campus independent living, and especially to help them recognize, report, and resolve unsafe conditions in their units. The City s Neighborhood Improvement Coordinator should work with various partners to provide both online and print
83 82 resources on the topic of off-campus living. These materials should include examples of common health/safety risks, explanation of how unsafe conditions should be resolved, and contact information for who they should notify if their landlord fails to address health and safety complaints (i.e. Health Department, City Neighborhood Improvement Coordinator). Implementing partners: City staff, UW-Stevens Point, Student Government Association, Central Wisconsin Apartment Association, Tenant Resource Center Estimated overall cost: low Possible funding sources: General funds, rely on partner organizations to cover most costs. 4.6 WHAT STRATEGIES SHOULD BE IMPLEMENTED TO ADDRESS SHORTCOMINGS OF THE CITY (E.G. LIVABILITY, MARKETABILITY, AND QUALITY OF LIFE)? Based on interview and survey feedback, residents of Stevens Point and the surrounding area generally have a high opinion of the quality of life here. Many point to the abundance of natural resources and outdoor recreation opportunities, especially the trail system. There was one item that came up consistently as a shortcoming that may influence decisions to move here, or to move away after living here for a while: the quality of the downtown business district. We also observed, in the course of this study, the lack of neighborhood designations or organizations. Strategies to address these shortcoming are recommended. Continue Efforts to Make Downtown More Vibrant A common idea expressed by interviewees was that Stevens Point could be more attractive as a place to live if the downtown were more vibrant than it currently is, with more housing, retail and entertainment opportunities. A vibrant downtown can help attract and retain workers, especially young professionals who are drawn to more urban environments, even if they aren t living downtown themselves. Downtown housing has already been recommended, and will likely serve as the most effective catalyst for other retail, restaurant and entertainment amenities. However, the City should also find ways to make other downtown development easier, including remediation of site contamination or blighted buildings, and development of more public parking to prevent the need for onsite parking with new development. Implementing partners: Redevelopment Authority, City Council Estimated overall cost: high Possible funding sources: TIF, general funds Identify Neighborhoods and Create Neighborhood Associations A healthy community has healthy neighborhoods in which people feel safe, are socially connected to their neighbors, and residents are actively involved in promoting the success of the neighborhood in various ways. Stevens Point does not currently designate neighborhoods, and has just one active neighborhood association (Old Main). We encourage the designation of neighborhoods and the development of grassroots neighborhood associations in order to foster more social connections and neighborhood improvement initiatives. This study suggests what those neighborhoods might be, geographically. The suggested boundaries are based on
. Table 4.")
84 83 various factors, including commonalities such as the age/era of housing development and existing features that separate housing areas, such as major roads, natural areas, and large areas of non-residential use. Figure 4.3 below delineates and numbers those neighborhoods (see the appendix for a larger version, and for maps of each neighborhood). Table 4.1 suggests names for each neighborhood, based mostly on street names. Eventually the name of a neighborhood should be selected in cooperation with neighborhood residents as part of the effort to create a neighborhood association. In many cases that name may reflect an original plat name or other historic feature of the area. The other information about these neighborhoods, indicated in both the table and the map, is property values, expressed as the value per square foot of homes. This is a helpful reference for the relative quality of housing across each neighborhood. Figure 4.3 Proposed Neighborhoods
85 84 Table 4.1 Proposed Neighborhoods Map ID Number Neighborhood Name Average Value per Square Foot of the Home 1 Jefferson-Dixon $58 2 Stanley $60 3 Old Main $61 4 Northpoint $58 5 Eagle Summit $88 6 Skyline $84 7 Commercial North $71 8 Commercial South $81 9 Hoover $71 10 Patch $62 11 River East $62* 12 River West $61 Downtown Downtown $51* *Neighborhoods where residential parcels with an unknown value per square foot exceeds 10%
86 85 CHAPTER 5 - PRIORITIZATION This chapter takes the various recommendations of Chapter 4 and organizes them into a set of three alternative scenarios describing how the City may choose to close market gaps, improve housing choice and attract residents. The scenarios are described below, and then presented in a table format to suggest how various actions and outcomes would be prioritized in each scenario. Implicit in this presentation is the idea that the scenarios are not mutually exclusive they could all occur. The objective of this presentation is prioritization for the use of limited resources available to influence the housing market. A fundamental point of this study bears repeating: all signs point to continued population growth in Portage County, but the destination of those new residents and households depends upon a combination of market forces and local development policies and programs. All of the scenarios that follow presume that the City of Stevens Point is willing to spend money to influence the market in some way, and they presume that those investments should generally result in investment, tax base and residents within the City of Stevens Point. Though three alternative scenarios are offered, there is one opportunity that rises above the others. 5.1 HOUSING REHABILITATION: DO THIS FIRST It is our opinion that one important issue trumps all others as the first priority for City influence on the housing market: rehabilitation and replacement of low-value homes. The poor condition and low value of many homes in the older, central part of the City is a pervasive problem that the marketplace and existing housing rehab programs are not fixing. We encourage the City to focus on this issue first, and then to proceed to other initiatives requiring City investment of staff and funding resources as they become available. Chapter 4 describes three programs intended to address this issue that would all draw from the same sources of funding, including general funds and, eventually, TIF funding. We offer a few thoughts on each here in order to aid the decision about which to pursue first. Housing Modernization Loan Program Main Advantage: Flexible could be used in many ways by permanent homeowners and/or investors. Main disadvantage: Less focused the flexibility of the program, as proposed, could dilute its impact on the quality of neighborhoods. Rental Conversion Program Main Advantage: Dual purpose - addresses the need for housing stock improvement and could help reverse the trend of single family conversion to rental. Main disadvantage: Limited to a smaller set of homes and requires some sellers willing to give up on their rental and also buyers willing to take on a challenging project.
87 86 Home Replacement Program Main Advantage: Biggest Neighborhood Impact by focusing on the worst homes, and replacing them with new homes, this program is likely to result in the most dramatic catalyst to encourage other investments by surrounding landowners. Main disadvantage: High Level of City Effort This program would require the RDA and others associated with the City to do quite a bit of work, including property acquisition and possibly contracting and coordination of home construction. 5.2 ALTERNATIVE #1 CREATE A MORE VIBRANT DOWNTOWN AND WATERFRONT New multifamily housing in the downtown area and with views of the waterfront could fill several gaps in the market while also spurring a greater diversity of retail, service, restaurant and entertainment offerings downtown. RECOMMENDATIONS 1. Location Downtown and waterfront views on both sides of the river 2. Housing Types and Prices High-end rentals and condominiums (as feasible) Smaller units such as efficiency and one-bedroom units for both young professionals and older adults 3. Regulatory Changes Remove the CUP requirement 4. Public Investment Priorities Parking Land aggregation 5. Timing Smaller projects first, to avoid dealing with significant parking issues, then larger projects when the resources can be assembled to help tackle major parking investments IMPACTS 1. Fiscal Could require significant funding to make difficult projects happen, but then also result in significant investment with greater potential to generate tax revenue than development in other parts of the City. Expect a long term financial gain due to the efficient use of existing public infrastructure and the increase in the value of other property that will likely occur around this development.
88 87 2. Quality of Life Could enliven the downtown area by attracting more retail and restaurants and entertainment, resulting in a more vibrant downtown with more to do, filling what many people feel is a missing element in Stevens Point. 5.3 ALTERNATIVE #2 IMPROVE THE ENTRY CORRIDORS AND SURROUNDING NEIGHBORHOODS By focusing on infill, redevelopment, and improvement of the City s three main entry corridors, the city can encourage multifamily housing, but at a lesser cost as compared to downtown. RECOMMENDATIONS 1. Location The entry corridors (Division, Stanley, Main) 2. Housing Types and Prices Smaller units such as efficiency and one-bedroom units for both young professionals and older adults Larger units such as three- and four-bed units 3. Regulatory Changes Remove the CUP requirement 4. Public Investment Priorities Parking Good urban design Neighborhood plans to show how redevelopment relates to the surrounding area 6. Timing TBD. As projects are proposed IMPACTS 1. Fiscal The City may or may not need to provide incentives to make these projects happen, depending on site and market conditions. Expect a long term financial gain due to the efficient use of existing public infrastructure and the increase in the value of other property that will likely occur around this development. 2. Quality of Life Could enliven neighborhoods by driving the improvement of commercial nodes that serve the surrounding neighborhood. The high traffic counts on these corridors equate to many eyes on these sites and opinions about the City based on that exposure. Investment and improvements could have an impact on perceptions about the City.
89 ALTERNATIVE #3 CREATE NEW NEIGHBORHOODS A focus on outward growth may be the quickest and most effective way to compete with Plover and other communities for new investment and residents, especially for single-family housing. RECOMMENDATIONS 1. Location Undeveloped lands east of I Housing Types and Prices Mostly single family, between $150,000 and $300,000, with some duplex and multifamily to ensure balanced neighborhoods 3. Regulatory Changes None required 4. Public Investment Priorities Infrastructure extensions Parking or mixed use incentives Boundary agreement efforts with the Town of Hull 7. Timing Could begin to happen right away IMPACTS 1. Fiscal The short-term fiscal impact could vary, depending on the site. The City may find it necessary to subsidize utility extensions to enable development. The long-term fiscal impact of this development could be problematic to the City if land values are too low compared to the cost of infrastructure to serve the lands. 2. Quality of Life Though it wouldn t add much to the quality of life in other parts of the City, new neighborhood development can influence perceptions about the City as a desirable place to live.
90 89 Table 4.1 Three Recommended Scenarios Scenario #1: Create a More Vibrant Downtown and Waterfront Scenario #2: Improve the Entry Corridors and Surrounding Neighborhoods Scenario #3: Create New Neighborhoods Priority Location of New Housing Units Downtown, Waterfront Transportation Corridors (Division, Stanley, Main) East of I-39 Regulatory Changes Allow 3 Unrelated Occupants Eliminate the Multifamily CUP Requirement Comprehensive Plan Amendment Priorities for Public Investment Improve existing homes Increase the supply of single family homes Make housing in S.P. more affordable for more people Attract other investment to Downtown Enhanced environmental performance (Green Design) Transit Compatibility Housing Types Most Likely to Increase/Improve Single-Family Student Multifamily Non-student Multifamily Townhomes/Duplexes/Zero lot line Condominium Ownership Senior Housing/Assisted Living = Low Priority, = Medium Priority, = High Priority
91 APPENDIX A: MAPS I


92 TAYLOR COUN TY CLAR K COU N T Y JACKSON COU N TY Dorchester Abbotsford Colby Unity Spencer Marshfield Pittsville Athens MAR AT HON COU NTY Stratford Edgar Fenwood Hewitt Auburndale Arpin WO OD COUNTY Vesper JUNE AU COU N T Y Milladore Nekoosa Marathon City Wisconsin Rapids Port Edwards LIN COLN COU N T Y Junction City Town of Carson Rudolph Biron Maine Schofield Rothschild Mosinee Wausau Town of Linwood ADAMS COUNTY Brokaw Weston Kronenwetter Town of Hull Stevens Point Whiting Plover Town of Plover Park Ridge Town of Stockton Almond Birnamwood Hatley Rosholt Elderon Nelsonville Amherst Jctn. POR TAG E COU NTY Amherst WAU S HARA COU NTY LAN GLADE COU N T Y Regional Map ME NO M IN EE City of Stevens Point Housing COU Study N T Y Stevens Point City/Village, Marathon County SHAWANO CO U NTY City/Village, Portage County City/Village, Wood County Town DRAFT 4/18/2017 WAU PACA CO UN TY Sources: Esri, HERE, DeLorme, USGS, Intermap, INCREMENT P, NRCan, Esri Japan, METI, Esri China (Hong Kong), Esri Korea, Esri (Thailand), MapmyIndia, NGCC, OpenStreetMap contributors, and the GIS User Community 0 Miles
93 Fe l tz Ave Sm i th St St W hiti ng Av e North Reserve St Minnesota Ave Wilshire Blvd Green Ave N Green Ave Torun Rd Ho ov er Rd Bri l ow s k i R d C as im ir Rd W!#" 39 C as im ir Rd E J o N or th Se co nd D r r da n R d ¾% 66 Brilowski Rd N Residential Properties City of Stevens Point Housing Study Legend D u B a N S e c on d Dr y A v e City of Stevens Point Residential Property Single-Family Second St N North Point Dr Condo Duplex Multi-Family M i ch i ga n Mobile Homes ß HH ß C W e st C la r k St Bukolt Ave C lar k St W F ir s t Second St Por t age St T hi rd St C e nterpoin t D r Ell i s St Fourth Ave Str o ng s Ave P rent i ce St Ma ri a Dr Di vi s i on St Park St Res e r ve St C lar k St Fremont St Di xon St Ill i no i s Av e Mai n St Av e N Mi ch ig an Av e St anley St Prais St Je ffer s on St Fr ont enac Av e Par k R i dg e Dr Hillcrest Dr G ree nb ri ar Av e C ou ntr y C l ub D r Map l e Bl uff Rd!#" 39 Go ll a Rd./ 10 Adult Family Home Affordable Housing Assisted Living Public Housing Senior Housing Undeveloped Residential Lot DRAFT 3/28/2017 Stockton Rd ¾% 66 Water St C hurch St P atc h St In dus tr ia l Par k R d West River Dr Ri ce St Heffr on St River View Ave N eb el St West River D r W Sherman Ave Post Rd Mc di l l Av e Ho ov er Av e ß R 0 ß HH Miles
94 Fe l tz Ave Sm i th St W hiti ng Av e North Reserve St Wilshire Blvd Green Ave N Green Ave Torun Rd Ho ov er Rd Bri l ow s k i R d C as im ir Rd W!#" 39 C as im ir Rd E J o N or th Se co nd D r r da n R d ¾% 66 Brilowski Rd N Registered Rental Properties by number of units City of Stevens Point Housing Study Legend D u B a N S e c on d Dr y A v e City of Stevens Point Parcel Rental Property ¾% 66 ß HH ß C W e st C la r k St 35 Bukolt Ave C lar k St W First St 63 Second St N Second St Por t age St Third St C e nterpoin t D r Ell i s St Fourth Ave Str o ng s Ave P rent i ce St Ma ri a Dr Di vi s i on St Park St Water St Res e r ve St C lar k St Fremont St Di xon St M i ch i ga n 128 Ill i no i s Av e Mai n St Av e N St anley St Mi ch ig an Av e 40 Prais St Je ffer s on St North Point Dr Fr ont enac Av e P at ch St 46 Par k R i dg e Dr Hillcrest Dr G ree nb ri ar Av e 72 In dus tr ia l C ou ntr y C l ub D r Par k R d Map l e Bl uff Rd!#" 39 Go ll a Rd / 10 Number of Units *Number of units are called out for rentals with 30+ units. DRAFT 3/30/2017 Stockton Rd West River Dr C hurch St Ri ce St 48 Heffr on St River View Ave 54 N eb el St Minnesota Ave West River D r W Sherman Ave Post Rd Mc di l l Av e Ho ov er Av e ß R 0 ß HH Miles
95 St Second St N Minnesota Ave Sm i th St North Point Dr Di vi s i on St Mi chi g an A ve N Registered Rental Properties by number of units Inset Ma ri a Dr City of Stevens Point Housing Study Bukolt Ave Res e r ve St Minnesota Ave St anley St Second St Fourth Ave Di vi s i on St P rai s St Por t age St F ir s t Mai n St C ent er po int D r P rent i ce St Mai n St Ill i no i s Av e Mai n St C lar k St W C lar k St W a t e r St Third St Ell i s St C lar k St West Clark St West River Dr St ron gs Av e C hurch St Legend City of Stevens Point Parcel Rental Property Number of Units Fremont St Fr ont enac Av e 1 (Single Family Converted to Rental) Mi ch ig an Av e ß HH Je f fer s on St Di xon St Water St Park St C hurch St Pa tch St West River Dr DRAFT 3/30/2017 P:\10600s\10610s\10616\ \GIS\ _Rentals_NumberofUnits_Inset.mxd W hiti ng Av e R i c e St 0 Miles
96 Fe l tz Ave Sm i th St St W hiti ng Av e North Reserve St Minnesota Ave Wilshire Blvd Green Ave N Green Ave Torun Rd Ho ov er Rd Bri l ow s k i R d C as im ir Rd W!#" 39 C as im ir Rd E J o N or th Se co nd D r r da n R d ¾% 66 Brilowski Rd N Single-Family Dwellings by age of home City of Stevens Point Housing Study D u B a Legend N S e c on d Dr y A v e City of Stevens Point Single-Family/Condo by Age Second St N North Point Dr M i ch i ga n Av e N Ma ri a Dr Bukolt Ave Second St Fourth Ave Res e r ve St St anley St Go ll a Rd Age of Home Unknown ß HH ß C W e st C la r k St C lar k St W F ir s t Por t age St T hi rd St C e nterpoin t D r Ell i s St Str o ng s Ave P rent i ce St Di vi s i on St Park St C lar k St Fremont St Di xon St Ill i no i s Av e Mai n St Mi ch ig an Av e Prais St Je ffer s on St Fr ont enac Av e Par k R i dg e Dr Hillcrest Dr G ree nb ri ar Av e C ou ntr y C l ub D r Map l e Bl uff Rd!#" 39./ 10 DRAFT 3/28/2017 Stockton Rd ¾% 66 Water St C hurch St P atc h St In dus tr ia l Par k R d West River Dr Ri ce St Heffr on St River View Ave N eb el St West River D r W Sherman Ave Post Rd Mc di l l Av e Ho ov er Av e ß R 0 ß HH Miles
97 W hiti ng Av e Fe l tz Ave Sm i th St St North Reserve St Wilshire Blvd Green Ave N Green Ave Torun Rd Ho ov er Rd Bri l ow s k i R d C as im ir Rd W!#" 39 C as im ir Rd E J o N or th Se co nd D r r da n R d ¾% 66 Brilowski Rd N Multi-Family Dwellings* by age of home City of Stevens Point Housing Study Legend D u B a N S e c on d Dr y A v e City of Stevens Point Multi-Family Property by Age Second St N North Point Dr M i ch i ga n Ma ri a Dr Av e N Bukolt Ave Second St Fourth Ave Res e r ve St St anley St Go ll a Rd Age of Home Unknown ß HH ß C W e st C la r k St C lar k St W F ir s t Por t age St T hi rd St C e nterpoin t D r Ell i s St Str o ng s Ave P rent i ce St Di vi s i on St Park St C lar k St Fremont St Di xon St Ill i no i s Av e Mai n St Mi ch ig an Av e Prais St Je ffer s on St Fr ont enac Av e Par k R i dg e Dr Hillcrest Dr G ree nb ri ar Av e C ou ntr y C l ub D r Map l e Bl uff Rd!#" 39./ 10 *Multi-Family in this map includes duplexes, multifamily, mobile homes, adult family homes, afforable housing, assisted living, public housing, and senior housing. Stockton Rd ¾% 66 Water St P atc h St In dus tr ia l Par k R d West River Dr C hurch St Ri ce St River View Ave N eb el St Minnesota Ave Heffr on St DRAFT 3/28/2017 West River D r W Sherman Ave Post Rd Mc di l l Av e Ho ov er Av e ß R 0 ß HH Miles
98 Fe l tz Ave Sm i th St St North Reserve St Wilshire Blvd Green Ave Torun Rd Ho ov er Rd C as im ir Rd W!#" 39 C as im ir Rd E J o N or th Se co nd D r r da n R d ¾% 66 Brilowski Rd N Single-Family Dwellings by value per square foot of the home City of Stevens Point Housing Study Legend D r N S eco n d D u B a y A v e City of Stevens Point Single-Family/Condo Parcel Se co nd St N Value per Square Foot $30.00 or less M i ch i ga n North Point Dr $ $40.00 $ $50.00 G reen Av e N $ $60.00 ß HH ß C W es t C lark t S Bukolt Ave C lar k St W F ir s t Second St T hi rd C ent er po in t St C lar k St Ell i s St D r Strongs Ave Di vi s i on St Ma ri a Dr Fourth Ave Res e r ve St Je ffer s on St Fremont St Ill i no i s Av e Av e N P rai s St Mi ch ig an Av e Mai n St Di xon St St anley St Fr ont enac Av e Par k R i dg e Dr Hillcrest Dr G ree nb ri ar Av e C ou ntr y C l ub D r Map l e Bl uff Rd!#" 39 Go ll a Rd./ 10 $ $70.00 $ $80.00 $ $90.00 $ $ $ $ $ $ $ $ $ and greater Value of Home Unknown Stockton Rd ¾% 66 Park St C hurch St P atc h St In dus tr ia l Par k R d Bri l ow s k i Rd Ri ce St Wes t Ri v e r D r W h i ti ng Ave Water St Heffr on St DRAFT 3/28/2017 Ri v er V i ew A ve N eb el St West River D r W Sherman Ave innesota Ave M Post Rd Mc di l l Av e Ho ov er Av e ß R 0 ß HH Miles
99 Fe l tz Ave Sm i th St St North Reserve St Mi ch ig an Av e Wilshire Blvd Green Ave Torun Rd Ho ov er Rd Bri l ow s k i R d C as im ir Rd W!#" 39 C as im ir Rd E J o N or th Se co nd D r r da n R d ¾% 66 Brilowski Rd N Residential Lots Code Violations City of Stevens Point Housing Study Legend S e co nd St N Se co nd Dr N D u B a y A v e City of Stevens Point Parcel Residential Lots Number of Code Violations M i ch i ga n Av e N North Point Dr St anley St ß HH ß C W e st C la r k St Bukolt Ave C lar k St W F ir s t Second St Third St C ent er po in t Wate r St D r C lar k St St ro ng s Ave Di vi s i on St Park St Fourth Ave Res e r ve St Ma ri a Dr Fremont St Ill i no i s Av e Mai n St Fr ont enac Av e P rai s St Je ffer s on St Di xon St G r een Av e N Par k R i dg e Dr Hillcrest Dr G ree nb ri ar Av e C ou ntr y C l ub D r Map l e Bl uff Rd!#" 39 Go ll a Rd./ DRAFT 3/28/2017 Stockton Rd ¾% 66 P atc h St In dus tr ia l Par k R d West River Dr Ri ce St C hurch St Heffr on St R i v er V i ew Av e West River D r W W hiti ng Av e Sherman Ave innesota Ave M Post Rd Mc di l l Av e Ho ov er Av e ß R 0 ß HH Miles

100 Stevens Point Area School District
101 Fe l tz Ave Sm i th St St North Reserve St Minnesota Ave Wilshire Blvd Green Ave N Green Ave Torun Rd Ho ov er Rd Bri l ow s k i R d C as im ir Rd W!#" 39 C as im ir Rd E J o N or th Se co nd D r r da n R d ¾% 66 Brilowski Rd N Available Residential Lots City of Stevens Point Housing Study Legend D u B a N S e c on d Dr y A v e City of Stevens Point Parcel Undeveloped Residential Lots Second St N North Point Dr Zoning R1 Suburban M i ch i ga n R2 Single-Family Ma ri a Dr W e st C la r k St Bukolt Ave C lar k St W F ir s t Second St Por t age St T hi rd St Fourth Ave C e nterpoin t D r Ell i s St Str o ng s Ave P rent i ce St Di v i s i on St Park St Res e r ve St C lar k St Di xon St Fremont St Ill i no i s Av e Mai n St St anley St Prais St Je ffer s on St Par k R i dg e Dr Hillcrest Dr G ree nb ri ar Av e Map l e Bl uff Rd Go ll a Rd Water St P atc h St In d us tr i al P ar k Rd W h it i ng Ave C hurch St Av e N R3 Two-Family ß HH ß C Mi ch ig an Av e Fr ont enac Av e C ou ntr y C l ub D r!#" 39./ 10 R4 Multi-Family 1 R5 Multi-Family 2 RLD Low Density PDD Planned Development Mixed Zoning DRAFT 3/28/2017 Stockton Rd ¾% 66 West River Dr Ri ce St Heffr on St Ri v er V i ew A ve N eb el St West River D r W Sherman Ave Post Rd Mc di l l Av e Ho ov er Av e ß R 0 ß HH Miles
102 Fe l tz Ave Sm i th St St W hiti ng Av e North Reserve St Minnesota Ave Wilshire Blvd Green Ave N Green Ave Torun Rd Ho ov er Rd Bri l ow s k i R d C as im ir Rd W!#" 39 C as im ir Rd E J o N or th Se co nd D r r da n R d ¾% 66 Brilowski Rd N Wetlands and Floodplain City of Stevens Point Housing Study Legend D u B a N S e c on d Dr y A v e City of Stevens Point Parcel Wetlands Flood Zone Designations Second St N North Point Dr A: 1% Annual Chance of Flooding, no BFE M i ch i ga n Av e N AE: 1% Annual Chance of Flooding, with BFE Ma ri a Dr AE: Regulatory Floodway Bukolt Ave Second St Fourth Ave Res e r ve St St anley St Go ll a Rd ß HH ß C W e st C la r k St C lar k St W F ir s t Por t age St T hi rd St C e nterpoin t D r Ell i s St Str o ng s Ave P rent i ce St Di vi s i on St Park St C lar k St Fremont St Di xon St Ill i no i s Av e Mai n St Mi ch ig an Av e Prais St Je ffer s on St Fr ont enac Av e Par k R i dg e Dr Hillcrest Dr G ree nb ri ar Av e C ou ntr y C l ub D r Map l e Bl uff Rd!#" 39./ 10 DRAFT 3/29/2017 Stockton Rd ¾% 66 Water St C hurch St P atc h St In dus tr ia l Par k R d West River Dr Ri ce St Heffr on St River View Ave N eb el St West River D r W Sherman Ave Post Rd Mc di l l Av e Ho ov er Av e ß R 0 ß HH Miles

103 Drive Time Map

104 F el tz A v e Sm it h S t S t W h i ti n g Av e No r th Re se r v e St W i l sh i re B l v d Gre e n A v e N Gr ee n A v e To ru n Rd Hoover Rd Casimir Rd W 9602!#" 39 Casimir Rd E North Second Dr J o r d a n Rd ( 6 ¾% 66 Brilowski Rd N Neighborhood Delineation with Census Tract Overlay 9601 City of Stevens Point Housing Study N S ec o n d D r D u B a y A v e ( 5 Legend 9605 City of Stevens Point 9603 Se c on d St N 9604 M i ch i ga n No r th Po i n t D r Census Tract Neighborhood ¾% ß HH ß C W e ( 12 s t Cl ark S t ( 4 Buko l t Ave F i rs t Se c on d St Downtown Po rt ag e St F ou r th A v e C e n terp oi n t D r 9610 El li s St S t ro n g s A ve P ren ti c e St D i v is i on St Par k St Wa ter St Re se r v e St C la rk St Ma ri a D r F rem on t St Ill i n o i s Ave A ve N Mi c h i g an Ave D ix o n S t Stan le y S t P rai s St Ma i n S t Je ff e rs on St F ron ten ac A v e ( 2 ( 3!#" ( 8 ( 1 P atc h S t Pa rk Ri d g e D r Greenbriar Ave I n d u s t r i a l C ou n tr y C l u b D r P a rk R d Ma p le B l u f f Rd Go l l a Rd Bri l o wsk i Rd ( 7./ 10 DRAFT 6/28/2017 Stoc kto n R d W es t R i v er D r 9611 River View Ave ( 11 C h u rc h St Ri c e St Ne b el S t (10 Mi n n e so ta Ave 9608 ( 9 H ef f ro n S t We s t R ive r Miles D r W Sh er m a n Ave Pos t Rd Mc d i l l Ave Hoover Ave ß R Source: Esri, DigitalGlobe, GeoEye, Earthstar Geographics, CNES/Airbus DS, USDA, USGS, AeroGRID, IGN, and the GIS User Community ß HH

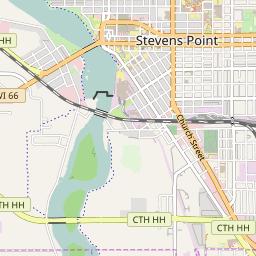

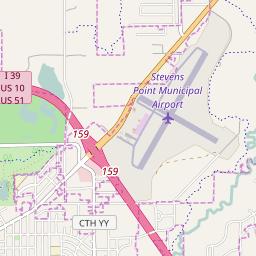


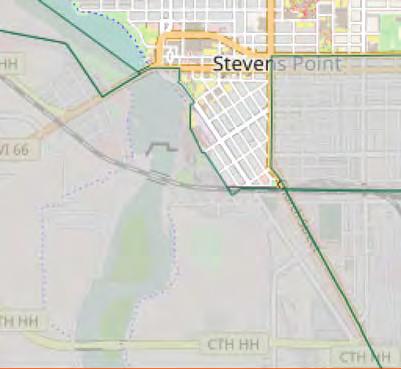
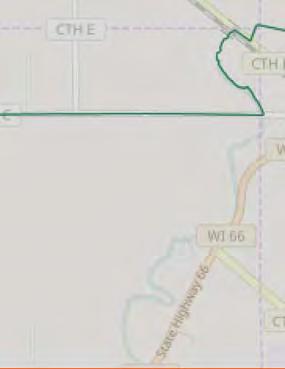
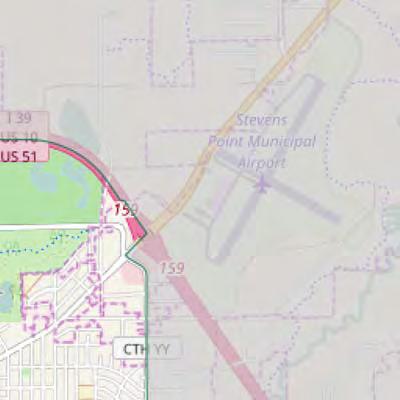


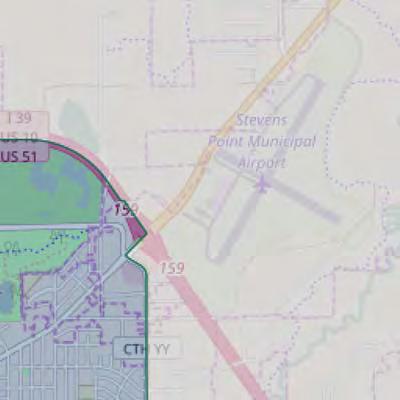


105 NMTC Eligibility Map
106 FREMONT ST DIVISION ST Clark Street Historic District Stevens Point, WI MAIN ST RESERVE ST 1700 CLARK ST 1701 CLARK ST 1708 CLARK ST 1709 CLARK ST 1716 CLARK ST 1717 CLARK ST 1724 CLARK ST 1725 CLARK ST 1320 PHILLIPS ST CLARK CLARK ST ST 1800 CLARK ST WYATT AVE Clark St. District Interstate 39 Highways Stevens Point 1801 CLARK ST 1809 CLARK ST PHILLIPS ST 1901 CLARK ST 1900 CLARK ST 1909 CLARK ST 1908 CLARK ST 1916 CLARK ST EAST CLARK AVE ST 1924 CLARK ST EAST AVE 2000 CLARK ST 2008 CLARK 2016 ST CLARK ST 1401 EAST AVE 2020 CLARK ST ELLIS ST 2024 CLARK ST 1325 RESERVE ST 2108 CLARK ST 2101 CLARK ST 2116 CLARK ST 2117 CLARK ST 2124 CLARK ST CLARK ST 2125 CLARK ST 2132 CLARK ST 2133 CLARK ST BOYINGTON AVE BOYINGTON AVE LINCOLN AVE ± Feet City of Stevens Point Community Development Department Clark St. District Boundaries District Properties This map was compiled by the City of Stevens Point's Community Development Department for reference purposes only. The accuracy of this map is not guaranteed and the City makes no express or implied warranties of any type regarding this map. Furthermore, the City is not liable for any direct or indirect damages suffered related to the use of this map. Parcels Lines Date: 5/9/2013

107 GRANT ST CROSBY AVE FREDERICK ST PRENTICE ST ROGERS ST WASHINGTON AVE Downtown Design Review District Stevens Point, WI WEST ST PORTAGE ST FIRST ST SECOND ST THIRD ST MEADOW ST FRANKLIN ST UNION ST SMITH ST FIRST ST CENTERPOINT DR BRIGGS ST COLLEGE CT HH WILSON AVE WEST RIVER DR PEARL ST WHITNEY ST KARNER ST Downtown Design Review District Interstate 39 Highways Stevens Point CLARK ST MAIN ST THIRD ST MAIN ST WATER ST STRONGS AVE STRONGS ELK ST ELLIS ST CHURCH ST BRAWLEY ST PINE ST PLOVER ST ± ,000 Feet City of Stevens Point Community Development Department Downtown Design District Boundaries District Properties Parcels Lines This map was compiled by the City of Stevens Point's Community Development Department for reference purposes only. The accuracy of this map is not guaranteed and the City makes no express or implied warranties of any type regarding this map. Furthermore, the City is not liable for any direct or indirect damages suffered related to the use of this map. Date: 6/13/2013

108 F el tz A v e Sm it h S t No r th Re se r v e St W i l sh i re B l v d Gr ee n A v e To ru n Rd Hoover Rd Casimir Rd W Casimir Rd E J o r d a n Rd North Second Dr ( 6 ¾% 66 Value per Square Foot of thehome by Neighborhood!#" 39 Br il o ws ki Rd N City of Stevens Point Housing Study S e c o nd S ec o n d S t N r N D D u B a y A v e ( 5 Legend City of Stevens Point Neighborhood Residential Parcel Value per Square Foot ( 4 M ich ig an Av e N No r th Po i n t D r Stan le y S t G r een Av e N $ $30.00 $ $40.00 $ $50.00 ¾% 66 ß HHß C West Clark t S ( 12 Buko l t Ave C la rk St W Se c on d St Downtown r D r We s t R i v e Th i rd St F ou r th A v e C en te rp oi n t D r C la rk St El li s St St ro n g s Av e ( 11 D i v is i on St Ma ri a D r Par k St ( 2 ( 3 ( 1 ( 8 C hu rch S t Re se r v e St Je ff e rs on St F rem on t St Ri c e St Wa ter St Ill i n o i s Ave Mi c h i g an Ave ( 10 D ix o n S t F ron ten ac Ave P rai s St Ma i n S t P at c h St Pa rk Ri d g e D r H i l lc re s t D r Greenbriar Ave ( 9 I n du s t ri a l C ou n t ry C l u b D r P ar k R d H ef f ro n S t Ma p le B l u f f Rd!#" 39 G ol l a R d Bri l ow sk i Rd ( 7./ 10 $ $60.00 $ $70.00 $ $80.00 $ $90.00 $ $ $ $ $ $ $ $ $ and greater Value of Home Unknown Stoc kto n R d Ol d H ig h w ay 1 8 R d River View Ave Ne b el S t 0 Miles We s t R iv e r D r W W h i ti n g Av e Sh er m a n Ave so ta Av e Minn e Pos t Rd Mc d i l l Ave H o ov e r Av e ß R Source: Esri, DigitalGlobe, GeoEye, Earthstar Geographics, CNES/Airbus DS, USDA, USGS, AeroGRID, IGN, and the GIS User Community ß HH

109 Divis ion St M i c hi gan Ave Wils hire B lvd Gre en A ve Fou r th A ve Re se r ve St Stan ley St Ce nter p oint D r Frem on t St Illino is Ave Fron ten ac A ve Prais St Main St Par k Ridg e Dr Water St El li s St Stron gs Ave Clar k St ( 1 Gr ee nbr i ar Ave Je ff er s on St Hi l lc re s t D r Dix on St Par k St Patch St Chu rch St Miles Wh i ti ng Av e Ric e St

110 N Gr een A ve Mic higan Ave Wils hire B lvd No r th Point Dr St an l ey St ¾% 66 M ic hi gan A v e N G r ee n Ave Ma ria Dr Mi n ne s ota Ave!#" 39 Re se r ve St Fou r th A ve Frem on t St Illino is Ave Prais St Fron ten ac A ve ( 2 Main St Par k Ridg e Dr 0 Clar k St 0.2 Miles Je ff e rs on St Hi l lc re s t D r Gr ee nbr i ar Ave

111 Se con d St N Sm it h St Divis ion St Mi ch i ga n A ve N Mic higan Ave Ma ria Dr Bu kolt A ve ( 3 Fou r th A ve Re se r ve St Mi n ne s ota Ave Stan ley St Fir s t St Sec o n d Cen te rp oint D r St Frem on t St Illino is Ave Fron ten ac Ave Prais St Main St Clar k St W T h i rd St Clar k St El li s St Ch u rch St Stron gs Ave Wes t River Dr Water St Je ff e rs on St Miles

112 Di vi s i on St N Mic higan Ave S e con d St N!#" 39 No r th Point Dr ( 4 M i chi gan A ve Ma ria Dr Bu kolt A ve Re se r ve St ßHH Miles Fi r s t St St Water Se c o n d St Cen te rp oint D r Main St St C hu rc h Fou r th A ve Frem on t St Stan ley St Illino is Ave Prais St

113 D i v No r t h Res e r ve St No r t h Res er ve Rd N or t h S e co nd D r D r N S e c o n d Du B ay Ave ( 5 S ec o nd St N Mic higan Ave N!#" 39 is io n St Miles No r th Point Dr!#" 39

114 Torun Rd ( 6 ¾% Miles

115 Br i lo w sk i Rd Br i lowski Rd N Go ll a Rd ( 7!#" 39 Map le B l u ff Rd Main St Miles./ 10

116 Hoove r Rd B ri l owski Rd Go ll a Rd Map le B l u ff Rd Main St./ 10 Cou n t r y C l ub D r!#" 39 ( 8 In d u s t ri al Par k Rd Miles

117 F el tz A v e Hoove r Rd Cou n tr y C lu b D r Patc h St In d u s t ri al Par k Rd!#" 39 Hef fr on St Mc di l l Ave ßHH ( 9 Hoov er Ave Post Rd Miles

118 Mic higan Ave Mi n ne s ota Ave Stron gs Ave Divis ion St Dix on St Fron ten ac Ave Par k St Pa tch St Ric e St W h iti n g Ave Chu rch St Water St Hef fr on St River Vie w Ave Neb el St ( 10 Pos t Rd Fel tz A ve Miles ßHH

119 Mic higan Ave Stron gs Ave Divis ion St Dix on St Fron ten ac Ave Par k St Patc h St iv e r Dr ( 11 Ric e St Chu rch St W es t R W h i tin g Ave Water St Hef fr on St River Vie w Ave Neb el St M in n e so ta Ave Wes t River Dr W Pos t Rd Miles

120 Sm it h St s t St Fir S e c o n d St Cen te rp oint D r ßHH Main St Clar k St W Th i rd St Clar k St El li s St Stron gs Ave Wate r St Chu rch St ß C Wes t C lark St ¾% 66 ( River Vie w Ave Miles Wes t River Dr

121 Divis ion St Mic higan Ave Ma ria Dr Bu kolt A ve Re se r ve St Fou r th A ve Stan ley St Downtown Fi r s t St S e co n d St Cen te rp oint D r Frem on t St Illino is Ave Prais St Main St Clar k St W T hi rd St Clar k St El li s St Stron gs Ave ßHH Chu rch St Wa te r St ß C St Wes t Cl a rk Je ff e rs on St W es t River Dix on St D r Par k St Miles Patc h St
122 APPENDIX B: SURVEY SUMMARY REPORT Background As part of the 2017 Stevens Point Housing Study, a survey was conducted for people who live or work in the City, to gather their input on housing choices, needs and preferences. The survey was conducted January-February In total, 1,192 individuals started the survey and 860 individuals responded to questions through the end of the survey. Approximately 96% of respondents were from Portage County, and nearly 68% from Stevens Point. The other 32% were primarily from the Village of Plover, Town of Hull, Village of Whiting, Town of Stockton, Village of Park Ridge and Town of Sharon. The survey represents a diverse group demographically, though certain groups were underand over-represented. Generally older and younger members of both communities were under-represented and those categorized as middle-age were over-represented. For instance, those under 18 represented 0.1% of survey respondents but make up 15.5% of the population of Stevens Point. Those age represented 21.7% of survey respondents but only make up 8.0% of the population of Stevens Point. The figure depicting respondents answers to their corresponding age group compared to American Community Survey (ACS) data is shown under question 11. Responses were filtered by renter, owner and UW student to identify any differences between the different viewpoints. Any differences considered important are reported in the following pages. *A comprehensive list of open-ended comments follows at the end of this appendix. Questions with additional comments/open-ended responses will be marked with an asterisk (e.g. Q2*). B - 1
123 Q1* In what COUNTY do you currently live? 1.4% 1.3% 1.0% 0.3% 0.3% Common Other Responses Milwaukee Co. Florida 95.7% Portage County Other (please specify) Wood County Marathon County Waupaca County Waushara County Q2*-Q8* In which CITY, VILLAGE or TOWN do you live in Portage, Marathon, Wood, Waupaca, Shawano, Waushara and Adams Counties? Top Responses Included: Community City of Stevens Point Village of Plover Town of Hull Village of Whiting Town of Stockton Village of Park Ridge Town of Sharon Town of Carson City of Wisconsin Rapids Town of Linwood County Portage Portage Portage Portage Portage Portage Portage Portage Wood Portage Percentage 67.6% 9.4% 5.6% 1.9% 1.7% 1.4% 1.3% 0.8% 0.7% 0.7% B - 2
124 Q9* Please identify your current housing type. Other Respondents 2.9% 1.9% 1.2% 1.2% 0.8% 0.1% 3.5% 4.9% Single family home (one home on one lot) Duplex/twinhome (two units) Unit in a building with 3-4 units Unit in a building with 5-9 units 9.5% Unit in a building with units Unit in a building with 20 or more units 73.9% Single unit attached to other single units (e.g. a townhome condominium) Other (please specify) 8.3% 7.1% UW Students 5.9% 1.8% 0.6% 26.6% Single family home (one home on one lot) Unit in a building with 5-9 units Duplex/twinhome (two units) Unit in a building with 3-4 units Dormitory 11.2% 14.2% Unit in a building with units Unit in a building with 20 or more units 11.8% 12.4% Single unit attached to other single units (e.g. a townhome condominium) Other (please specify) Common Other Response Rooming House Apartment B - 3
125 Q10 Including yourself, please indicate the number of people in your household, by age. 85 or older 65 to to to to to 24 Under % 20.0% 40.0% 60.0% 80.0% 100.0% Q11 Please indicate your age. 85 or older 65 to to to to to 24 Under % 5.0% 10.0% 15.0% 20.0% 25.0% 30.0% 35.0% Survey ACS Q12 Are you a current student at the University of Wisconsin-Stevens Point? 14.9% 85.1% Yes No B - 4
126 Q13 How many bedrooms does your current home have? 60% 50% 40% 30% 20% 10% 0% Efficiency - no separate bedroom One Two Three Four or more Own Rent Q14 Do you currently live in subsidized housing (i.e. you live in low income or public housing or receive Section 8 vouchers/some kind of rental assistance)? 1.4% Yes No 98.6% Q15* Are any of these within reasonable walking distance of your home? A park Restaurant Convenience shopping Grocery store Workplace 0% 20% 40% 60% 80% 100% Yes No B - 5
127 Q16* What do you consider to be a reasonable walking distance to these locations? Grocery store Workplace Convenience shopping Restaurant A park 0.0% 20.0% 40.0% 60.0% 80.0% 100.0% Zero - I wouldn't walk 800 feet or less (2 blocks) 1/4 mile (3 blocks) 1/2 mile (6 blocks) 1 mile (12 blocks) More than 1 mile Q17* Do you own or rent your current housing? 1.8% 36.1% 62.1% Own Rent Live in a dorm Q18* Approximately how much do you currently pay for your housing each month, including mortgage, taxes, insurance, utilities (water, heat, electricity, etc.) and any condo fees? (HOMEOWNERS ONLY) 6.7% 3.1% 3.1% 9.4% 12.4% 16.8% 27.6% 20.9% Less than $300 $300 to $499 $500 to $749 $750 to $999 $1,000 to $1,499 $1,500 to $1,999 $2,000 to $2,499 $2,500 or more B - 6
128 Q19* What is the approximate assessed value of your home? (HOMEOWNERS ONLY) 7.1% 1.3% 1.0% 17.3% 16.2% 24.4% 32.6% Less than $50,000 $50,000 to $99,999 $100,000 to $149,999 $150,000 to $200,000 $200,000 to $300,000 $300,000 to $500,0000 More than $500,000 Q20* Approximately how much do you currently pay for your housing each month, including rent, insurance and utilities (water, heat, electricity, etc.? (RENTERS ONLY) 11.4% 1.2% 0.7% 7.4% 23.6% 25.8% 29.8% Less than $200 $200 to $299 $300 to $499 $500 to $749 $750 to $999 $1,000 to $1,499 $1,500 or more B - 7
129 Q21* Please estimate your gross annual household income (this helps us estimate housing affordability). 4.2% 16.8% Owners & Renters (excluding students) Less than $15, % 4.2% 3.6% 6.9% $15,000 to $24, % $25,000 to $34,999 $35,000 to $49, % $50,000 to $74,999 $75,000 to $99, % 21.6% $100,000 to $149,999 $150,000 to $199,999 Greater than $200,000 Do not wish to provide this information 0.6% 7.0% 0.6% 1.3% 2.5% 2.5% 7.0% 6.4% 14.6% UW Students 57.3% Less than $15,000 $15,000 to $24,999 $25,000 to $34,999 $35,000 to $49,999 $50,000 to $74,999 $75,000 to $99,999 $100,000 to $149,999 $150,000 to $199,999 Greater than $200,000 Do not wish to provide this information B - 8
130 Q22* Please estimate the percentage of your gross household income spent on housing costs, including mortgage/rent, taxes, insurance, utilities (water, heat, electricity, etc.) and any condo fees? Owners (excluding students) 6.1% 10.0% 9.0% 9.3% 17.0% 10.1% 18.7% 19.8% Less than 10% 10-14% 15-19% 20-24% 25-29% 30-34% 35-39% 40% or more Renters (excluding students) 24.2% 4.5% 9.1% 8.7% 15.2% 10.2% 14.0% 14.0% Less than 10% 10-14% 15-19% 20-24% 25-29% 30-34% 35-39% 40% or more UW Students 7.4% 6.0% 40.3% 11.4% 10.1% 10.1% 7.4% 7.4% Less than 10% 10-14% 15-19% 20-24% 25-29% 30-34% 35-39% 40% or more B - 9
131 Q23* Please indicate your employment status. 6.8% 6.2% 7.6% 1.8% 0.8% 11.5% 65.2% Common Other Responses Employed full-time Full-time student and employed Self employed Employed full-time Employed part-time Unemployed Homemaker Retired Full-time student Other (please specify) Q24* In which industry are you primarily employed (greatest number of hours) or seeking work? 2.4% 1.8% 3.2% 0.5% 3.4% 3.5% 4.1% 5.0% 6.1% 30.9% Educational services, and health care and social assistance Other (please specify) Finance and insurance, and real estate and rental and leasing Professional, scientific, and management, and administrative and waste management services Arts, entertainment, and recreation, and accommodation and food services Retail trade 6.4% Other services, except public administration 8.9% 11.8% 12.0% Public administration Construction Manufacturing Common Other Responses Health Care Nonprofit Sales Information Agriculture, forestry, fishing and hunting, and mining Transportation and warehousing, and utilities Wholesale trade B - 10
132 Q25* What is the condition of your home or apartment? Consider both the building systems (plumbing, heating, electrical) and the interior and exterior finishes (roofing, siding, paint, flooring, counter tops, etc.). 12.9% 0.6% Owners (excluding students) 32.4% EXCELLENT - all systems and finishes in good repair GOOD - all systems in good repair, but finishes are showing some signs of age and/or wear 54.1% FAIR - systems all functional but with recurring or impending repair needs, but the unit is safe; some finishes are visibly worn or dated POOR - systems have current or frequent repair needs, some finishes are significantly worn and unsightly, there are building code violations and/or safety concerns 6.9% Renters (excluding students) 16.4% EXCELLENT - all systems and finishes in good repair 34.0% GOOD - all systems in good repair, but finishes are showing some signs of age and/or wear FAIR - systems all functional but with recurring or impending repair needs, but the unit is safe; some finishes are visibly worn or dated 42.7% POOR - systems have current or frequent repair needs, some finishes are significantly worn and unsightly, there are building code violations and/or safety concerns 8.1% UW Students 8.8% EXCELLENT - all systems and finishes in good repair 36.5% GOOD - all systems in good repair, but finishes are showing some signs of age and/or wear 46.6% FAIR - systems all functional but with recurring or impending repair needs, but the unit is safe; some finishes are visibly worn or dated POOR - systems have current or frequent repair needs, some finishes are significantly worn and unsightly, there are building code violations and/or safety concerns B - 11
133 Q26* In the past 5 years, have you invested more than $2,500 in improvements to an existing home, not including storm damage repair? If so, approximately how much have you invested? Please summarize the improvements made if you spent more than $2, % 1.1% 0.1% 0.6% 5.2% 2.5% NA - I haven't owned a home in the past 5 years No - $0 to $2, % 36.2% $2,500 to $4,999 $5,000 to $9,999 $10,000 to $19,999 Common Improvements $20,000 to $29,999 Flooring $30,000 to $39,999 New Roof 13.6% $40,000 to $49,999 Paint 12.8% 16.6% $50,000 to $74,999 $75,000 to $99,999 $100,000 or more Q27* In the next 5 years, do you intend to invest more than $2,500 in home improvements? If you intend to invest more than $2,500 in home improvements in the next 5 years, please summarize the likely improvements. 10.6% 4.8% 22.3% NA - I don't expect to own a home in the next 5 years Yes 22.9% Likely Unlikely Common Improvements Flooring Windows Basement 39.4% No B - 12
134 Q28* How satisfied are you with your current housing? If you are not satisfied, please indicate what you would change about your housing. Owners & Renters (excluding students) Location Size Amenities (e.g. parking) Quality 0% 20% 40% 60% 80% 100% Very satisfied Satisfied Neutral Dissatisfied Very dissatisfied Location Size Amenities (e.g. parking) Quality UW Students Common Responses Parking allowed on streets at night Better quality units More space Would like a driveway 0% 20% 40% 60% 80% 100% Very satisfied Satisfied Neutral Dissatisfied Very dissatisfied Q29* Please select all of the reasons why you would want to move from your current home. Other (please specify) Reduced living costs Better weather/climate To be closer to work or school No longer able to maintain home Access to community and social activities Improved accessibility, such as fewer steps and wider doorways Access to transportation services Common Other Responses More parking More space More land Downsizing Job Access to hospitals/health services 0% 5% 10% 15% 20% 25% 30% 35% 40% 45% B - 13
 Condominium ownership of one housing unit within a larger complex,")
? You may select more than one type.")
135 Q30* If moving to or within the Stevens Point area, which method of paying for your home would you consider? Conventional ownership of a home and land Rental (any type of housing unit) Condominium ownership of one housing unit within a larger complex, with a fee paid for the maintenance of common elements 0% 10% 20% 30% 40% 50% 60% 70% 80% 90% 100% Yes Maybe No Q31* If moving to or within the Stevens Point area, what type of housing would you look for (see sample pictures below)? You may select more than one type. 90% 80% 70% 60% 50% 40% 30% 20% 10% 0% A B C D E F G H I B - 14
2014 Marshfield Housing Study
 Prepared for the City of Marshfield By April 18, 2014 TABLE OF CONTENTS EXECUTIVE SUMMARY... i CHAPTER 1 - Introduction... 1 CHAPTER 2 - Study Process... 3 CHAPTER 3 - Findings... 5 3.1 Housing Supply...
Myth Busting: The Truth About Multifamily Renters
 Myth Busting: The Truth About Multifamily Renters Multifamily Economics and Market Research With more and more Millennials entering the workforce and forming households, as well as foreclosed homeowners
Briefing Book. State of the Housing Market Update San Francisco Mayor s Office of Housing and Community Development
 Briefing Book State of the Housing Market Update 2014 San Francisco Mayor s Office of Housing and Community Development August 2014 Table of Contents Project Background 2 Household Income Background and
Detroit Inclusionary Housing Plan & Market Study Preliminary Inclusionary Housing Feasibility Study Executive Summary August, 2016
 Detroit Inclusionary Housing Plan & Market Study Preliminary Inclusionary Housing Feasibility Study Executive Summary August, 2016 Inclusionary Housing Plan & Market Study Objectives 1 Evaluate the citywide
City of Lonsdale Section Table of Contents
 City of Lonsdale City of Lonsdale Section Table of Contents Page Introduction Demographic Data Overview Population Estimates and Trends Population Projections Population by Age Household Estimates and
New affordable housing production hits record low in 2014
 1 Falling Further Behind: Housing Production in the Twin Cities Region December 2015 Key findings Only a small percentage of added housing units were affordable to households with low and moderate incomes.
CHAPTER 7 HOUSING. Housing May
 CHAPTER 7 HOUSING Housing has been identified as an important or very important topic to be discussed within the master plan by 74% of the survey respondents in Shelburne and 65% of the respondents in
The supply of single-family homes for sale remains
 Oh Give Me a (Single-Family Rental) Home Harold D. Hunt and Clare Losey December, 18 Publication 2218 The supply of single-family homes for sale remains tight in many markets across the United States.
REGIONAL. Rental Housing in San Joaquin County
 Lodi 12 EBERHARDT SCHOOL OF BUSINESS Business Forecasting Center in partnership with San Joaquin Council of Governments 99 26 5 205 Tracy 4 Lathrop Stockton 120 Manteca Ripon Escalon REGIONAL analyst april
Housing Indicators in Tennessee
 Housing Indicators in l l l By Joe Speer, Megan Morgeson, Bettie Teasley and Ceagus Clark Introduction Looking at general housing-related indicators across the state of, substantial variation emerges but
November An updated analysis of the overall housing needs of the City of Aberdeen. Prepared by: Community Partners Research, Inc.
 City of Aberdeen HOUSING STUDY UPDATE November 2010 An updated analysis of the overall housing needs of the City of Aberdeen Prepared by: Community Partners Research, Inc. nd 10865 32 Street North Lake
Housing Characteristics
 CHAPTER 7 HOUSING The housing component of the comprehensive plan is intended to provide an analysis of housing conditions and need. This component contains a discussion of McCall s 1990 housing inventory
ECONOMIC CURRENTS. Vol. 5 Issue 2 SOUTH FLORIDA ECONOMIC QUARTERLY. Key Findings, 2 nd Quarter, 2015
 ECONOMIC CURRENTS THE Introduction SOUTH FLORIDA ECONOMIC QUARTERLY Economic Currents provides an overview of the South Florida regional economy. The report presents current employment, economic and real
Young-Adult Housing Demand Continues to Slide, But Young Homeowners Experience Vastly Improved Affordability
 Young-Adult Housing Demand Continues to Slide, But Young Homeowners Experience Vastly Improved Affordability September 3, 14 The bad news is that household formation and homeownership among young adults
Carver County AFFORDABLE HOUSING UPDATE
 Carver County AFFORDABLE HOUSING UPDATE July 2017 City of Cologne Community Partners Research, Inc. Lake Elmo, MN Executive Summary - Cologne Key Findings - 2017 Affordable Housing Study Update Cologne
CHAPTER 2: HOUSING. 2.1 Introduction. 2.2 Existing Housing Characteristics
 CHAPTER 2: HOUSING 2.1 Introduction Housing Characteristics are related to the social and economic conditions of a community s residents and are an important element of a comprehensive plan. Information
High-priced homes have a unique place in the
 Livin' Large Texas' Robust Luxury Home Market Joshua G. Roberson December 3, 218 Publication 2217 High-priced homes have a unique place in the overall housing market. Their buyer pool, home characteristics,
Housing Affordability in Lexington, Kentucky
 University of Kentucky UKnowledge CBER Research Report Center for Business and Economic Research 6-29-2009 Housing Affordability in Lexington, Kentucky Christopher Jepsen University of Kentucky, chris.jepsen@uky.edu
Charlotte Report. Prepared for: Greater Regional Charlotte Association of REALTORS. Prepared by: NATIONAL ASSOCIATION OF REALTORS.
 Charlotte Report Prepared for: Greater Regional Charlotte Association of REALTORS Prepared by: Research Division January 2016 Charlotte Report Table of Contents Introduction... 2 Highlights... 3 Methodology..8
Multifamily Market Commentary February 2017
 Multifamily Market Commentary February 2017 Affordable Multifamily Outlook Incremental Improvement Expected in 2017 We expect momentum in the overall multifamily sector to slow in 2017 due to elevated
2011 Profile of Home Buyers and Sellers Texas Report
 2011 Profile of Home and Sellers Report Prepared for: Association of REALTORS Prepared by: NATIONAL ASSOCIATION OF REALTORS Research Division December 2011 2011 Profile of Home and Sellers Report Table
2015 Housing Report. kelowna.ca. April Water Street Kelowna, BC V1Y 1J4 TEL FAX
 2015 Housing Report April 2016 1435 Water Street Kelowna, BC V1Y 1J4 TEL 250 469-8610 FAX 250 862-3349 ask@kelowna.ca kelowna.ca TABLE OF CONTENTS Introduction... 1 Housing Starts... 1 Ownership Housing
Housing Study & Needs Assessment
 Housing Study & Needs Assessment Phase II Public Engagement Presentation #2 Winston-Salem, North Carolina January 25, 2018 MEETING OVERVIEW Welcome & Introductions Purpose & Goals Community Discussions
2017 Profile of Home Buyers and Sellers
 New Jersey Report Prepared for: New Jersey REALTORS Prepared by: Research Division December 2017 New Jersey Report Table of Contents Introduction... 2 Highlights... 4 Methodology... 8 Report Prepared by:
2011 Profile of Home Buyers and Sellers New York Report
 2011 Profile of Home and Sellers Report Prepared for: Association of REALTORS Prepared by: NATIONAL ASSOCIATION OF REALTORS Research Division December 2011 2011 Profile of Home and Sellers Report Table
RESIDENTIAL MARKET ANALYSIS
 RESIDENTIAL MARKET ANALYSIS CLANCY TERRY RMLS Student Fellow Master of Real Estate Development Candidate Oregon and national housing markets both demonstrated shifting trends in the first quarter of 2015
State of Renters and Their Homes
 State of Renters and Their Homes As rents rose and renters incomes remained stagnant from to, many New Yorkers continued to face heavy rent burdens. In, roughly 30 percent of the city s renter households
3 November rd QUARTER FNB SEGMENT HOUSE PRICE REVIEW. Affordability of housing
 3 November 2011 3 rd QUARTER FNB SEGMENT HOUSE PRICE REVIEW JOHN LOOS: HOUSEHOLD AND PROPERTY SECTOR STRATEGIST 011-6490125 John.loos@fnb.co.za EWALD KELLERMAN: PROPERTY MARKET ANALYST 011-6320021 ekellerman@fnb.co.za
State of the Johannesburg Inner City Rental Market
 State of the Johannesburg Inner City Rental Market Presentation to TUHF- 5th July 2017 5 July 2017 State of the Johannesburg Inner City Rental Market National Association of Social Housing Organisations
ECONOMIC CURRENTS. Vol. 4, Issue 3. THE Introduction SOUTH FLORIDA ECONOMIC QUARTERLY
 ECONOMIC CURRENTS THE Introduction SOUTH FLORIDA ECONOMIC QUARTERLY Vol. 4, Issue 3 Economic Currents provides an overview of the South Florida regional economy. The report presents current employment,
2018 Profile of Home Buyers and Sellers
 Massachusetts Report Prepared for: Massachusetts Association of REALTORS Prepared by: Research Division December 2018 Massachusetts Report Table of Contents Introduction... 2 Highlights... 4 Methodology...
CHAPTER 3. HOUSING AND ECONOMIC DEVELOPMENT
 CHAPTER 3. HOUSING AND ECONOMIC DEVELOPMENT This chapter analyzes the housing and economic development trends within the community. Analysis of state equalized value trends is useful in estimating investment
Planning and Development Department Building and Development Permit Summary Report
 Planning and Development Department 21 Building and Development Permit Summary Report February 22, 21 2 21 Building and Development Permit Summary Table of Contents Introduction... 3 Building Permits...
New Hampshire Report. Prepared for: New Hampshire Association of REALTORS. Prepared by: NATIONAL ASSOCIATION OF REALTORS.
 New Hampshire Report Prepared for: New Hampshire Association of REALTORS Prepared by: Research Division January 2016 New Hampshire Report Table of Contents Introduction... 2 Highlights... 3 Methodology..8
Housing as an Investment Greater Toronto Area
 Housing as an Investment Greater Toronto Area Completed by: Will Dunning Inc. For: Trinity Diversified North America Limited February 2009 Housing as an Investment Greater Toronto Area Overview We are
HOUSING OVERVIEW. Housing & Economic Development Strategic Plan for Takoma Park Presented by Mullin & Lonergan Associates February 26,2018
 HOUSING OVERVIEW Housing & Economic Development Strategic Plan for Takoma Park Presented by Mullin & Lonergan Associates February 26,2018 Overarching Themes & Underlying Bases Takoma Park strives to be
Characteristics of Recent Home Buyers
 Characteristics of Recent Home Buyers Special Studies, February 1, 2019 By Carmel Ford Economics and Housing Policy National Association of Home Builders Introduction To analyze home buyers NAHB uses the
Ontario Rental Market Study:
 Ontario Rental Market Study: Renovation Investment and the Role of Vacancy Decontrol October 2017 Prepared for the Federation of Rental-housing Providers of Ontario by URBANATION Inc. Page 1 of 11 TABLE
Carver County AFFORDABLE HOUSING UPDATE
 Carver County AFFORDABLE HOUSING UPDATE July 2017 City of Carver Community Partners Research, Inc. Lake Elmo, MN Executive Summary - Carver Key Findings - 2017 Affordable Housing Study Update Carver has
Connecticut First Nine Months Housing Report 2014
 Connecticut First Nine Months Housing Report 2014 First Nine Months of 2014 Highlight Positive Outlook for Multi-family Home Construction Millennial buyers are finally increasing their rate of household
Summary of Findings. Community Conversation held November 5, 2018
 Summary of Findings Housing and the Future of Lebanon: What types of homes do we need in Lebanon to have a thriving community for all who live or work here? Community Conversation held November 5, 2018
2012 Profile of Home Buyers and Sellers New Jersey Report
 Prepared for: New Jersey Association of REALTORS Prepared by: Research Division December 2012 Table of Contents Introduction... 2 Highlights... 4 Conclusion... 7 Report Prepared by: Jessica Lautz 202-383-1155
WASHINGTON STATE APARTMENT MARKET REPORT SPRING 2018
 WASHINGTON STATE APARTMENT MARKET REPORT SPRING 2018 Vacancy Summary The statewide apartment vacancy rate increased from 3.7% to 4.7% in Fall 2018. While there is variability among the individual county
Green Multifamily and Single Family Homes 2017
 SmartMarket Brief Green Multifamily and Single Family Homes 2017 PREMIER PARTNER RESEARCH PARTNER Introduction ABOUT THIS SMARTMARKET BRIEF CONTENTS COVER IMAGE GREEN MULTIFAMILY AND SINGLE FAMILY HOMES
Radian RATE Programme STAR Survey Results April 2017 to December 2017 All Residents Report February 2018
 Radian RATE Programme STAR Survey Results April 2017 to December 2017 All Residents Report February 2018 Executive summary This report summarises the results of the continuous STAR survey of Radian s residents,
MONTGOMERY COUNTY RENTAL HOUSING STUDY. NEIGHBORHOOD ASSESSMENT June 2016
 MONTGOMERY COUNTY RENTAL HOUSING STUDY NEIGHBORHOOD ASSESSMENT June 2016 AGENDA Model Neighborhood Presentation Neighborhood Discussion Timeline Discussion Next Steps 2 WORK COMPLETED Socioeconomic Analysis
Missing Middle Housing Types Showcasing examples in Springfield, Oregon
 Missing Middle Housing Types Showcasing examples in Springfield, Oregon MissingMiddleHousing.com is powered by Opticos Design Illustration 2015 Opticos Design, Inc. Missing Middle Housing Study Prepared
Carver County AFFORDABLE HOUSING UPDATE
 Carver County AFFORDABLE HOUSING UPDATE July 2017 City of Chaska Community Partners Research, Inc. Lake Elmo, MN Executive Summary - Chaska Key Findings - 2017 Affordable Housing Study Update Chaska is
ARLA Members Survey of the Private Rented Sector
 Prepared for The Association of Residential Letting Agents ARLA Members Survey of the Private Rented Sector Second Quarter 2014 Prepared by: O M Carey Jones 5 Henshaw Lane Yeadon Leeds LS19 7RW June, 2014
City of. Hood River. Housing and. Income Metrics. Report. Prepared by: Decisions Decisions
 City of Prepared by: Decisions Decisions Hood River Housing and Income Metrics Project Manager: Allison Handler, Associate 503-249-0000 allison@decision2.com Report December 14, 2009 1001 SE Water Avenue,
The Coldwell Banker Carlson Real Estate Market Report
 The Coldwell Banker Carlson Real Estate Market Report 2017 Year-End Stowe Area Report Our 2017 Year-End Market Report uses market-wide data, based on transactions that closed in 2017 in the Multiple Listing
Connecticut Report. Prepared for: Connecticut Association of REALTORS. Prepared by: NATIONAL ASSOCIATION OF REALTORS. Research Division.
 2015 Profile of Home Buyers and Sellers Report Prepared for: Association of REALTORS Prepared by: NATIONAL ASSOCIATION OF REALTORS Research Division January 2016 2015 Profile of Home Buyers and Sellers
Market Segmentation: The Omaha Condominium Market
 Market Segmentation: The Omaha Condominium Market Roger P. Sindt Steven Shultz University of Nebraska at Omaha Introduction A highly visible and growing niche in the homeownership market is the condominium
Radian RATE Programme STAR Survey Results April 2017 to March 2018 All Residents Report April 2018
 Radian RATE Programme STAR Survey Results April 2017 to March 2018 All Residents Report April 2018 Executive summary This report summarises the results of the continuous STAR survey of Radian s residents,
WIndicators. Housing Issues Affecting Wisconsin. Volume 1, Number 4. Steven Deller, Todd Johnson, Matt Kures, and Tessa Conroy
 WIndicators Housing Issues Affecting Wisconsin Volume 1, Number 4 Steven Deller, Todd Johnson, Matt Kures, and Tessa Conroy Housing is becoming an issue in Wisconsin. Housing prices are growing while new
Real Estate Technology
 The State of Real Estate Technology Commercial and multifamily real estate industries still rely on antiquated technology for critical business processes February 2018 Executive Summary In recent years,
Residential December 2009
 Residential December 2009 Karl L. Guntermann Fred E. Taylor Professor of Real Estate Adam Nowak Research Associate Year End Review The dramatic decline in Phoenix house prices caused by an unprecedented
RENTAL MARKET REPORT. Manitoba Highlights* Highlight Box. Housing market intelligence you can count on
 H o u s i n g M a r k e t I n f o r m a t i o n RENTAL MARKET REPORT Manitoba Highlights* C a n a d a M o r t g a g e a n d H o u s i n g C o r p o r a t i o n Date Released: Spring 2011 Figure 1 Winnipeg
POPULATION FORECASTS
 POPULATION FORECASTS Between 2015 and 2045, the total population is projected to increase by 373,125 residents to reach 2.2 million. Some areas will see major increases, while other areas will see very
2013 Profile of Home Buyers and Sellers Metro Indianapolis Report
 Prepared for: Metro Indianapolis Board of REALTORS Prepared by: Research Division December 2013 Table of Contents Introduction... 2 Highlights... 3 Conclusion... 6 Methodology..7 Report Prepared by: Jessica
The State of Renters & Their Homes
 FORECLOSURES FINDING #14 The number of pre-foreclosure notices issued to one- to four-unit properties and condominiums in 2015 fell from the previous year. Pre-foreclosure notices for one- to four-unit
MISSISSIPPI GULF COAST APARTMENT SURVEY
 MISSISSIPPI GULF COAST APARTMENT SURVEY PREPARED FOR GULF REGIONAL PLANNING COMMISSION 1635 POPPS FERRY ROAD, SUITE G TELEPHONE (228) 864-1167 BILOXI, MISSISSIPPI 39532 PREPARED BY W. S. LOPER AND ASSOCIATES
RENTAL PRODUCTION AND SUPPLY
 RENTAL PRODUCTION AND SUPPLY Despite a sharp uptick in the number of renter households, construction of multifamily units for rent declined in 27 for the fifth straight year. Even so, growth in the rental
Volume Title: Well Worth Saving: How the New Deal Safeguarded Home Ownership
 This PDF is a selection from a published volume from the National Bureau of Economic Research Volume Title: Well Worth Saving: How the New Deal Safeguarded Home Ownership Volume Author/Editor: Price V.
The Uneven Housing Recovery
 AP PHOTO/BETH J. HARPAZ The Uneven Housing Recovery Michela Zonta and Sarah Edelman November 2015 W W W.AMERICANPROGRESS.ORG Introduction and summary The Great Recession, which began with the collapse
Glenmont Sector Plan Staff Draft AFFORDABLE HOUSING ANALYSIS
 Glenmont Sector Plan Staff Draft AFFORDABLE HOUSING ANALYSIS UPDATED December 4, 2012 Center for Research and Information Systems Montgomery County Planning Department M-NCPPC Executive Summary The Glenmont
Nothing Draws a Crowd Like a Crowd: The Outlook for Home Sales
 APRIL 2018 Nothing Draws a Crowd Like a Crowd: The Outlook for Home Sales The U.S. economy posted strong growth with fourth quarter 2017 Real Gross Domestic Product (real GDP) growth revised upwards to
Glenmont Sector Plan Staff Draft AFFORDABLE HOUSING ANALYSIS
 Glenmont Sector Plan Staff Draft AFFORDABLE HOUSING ANALYSIS November 1, 2012 Center for Research and Information Systems Montgomery County Planning Department M NCPPC Executive Summary The Glenmont Sector
DATA FOR FEBRUARY Published March 20, Sales are up +19.6% month-over-month. The year-over-year comparison is down -7.3%.
 Permission is granted only to ARMLS Subscribers for reproduction with attribution on to ARMLS COPYRIGHT 2019. For questions regarding this publication contact Brand@ARMLS.com. DATA FOR FEBRUARY 2019 -
ECONOMIC CURRENTS. Vol. 3, Issue 3 SOUTH FLORIDA ECONOMIC QUARTERLY. Introduction
 ECONOMIC CURRENTS THE Introduction SOUTH FLORIDA ECONOMIC QUARTERLY Economic Currents provides an overview of the South Florida regional economy. The report presents current employment, economic and real
Rapid recovery from the Great Recession, buoyed
 Game of Homes The Supply-Demand Struggle Laila Assanie, Sarah Greer, and Luis B. Torres October 4, 2016 Publication 2143 Rapid recovery from the Great Recession, buoyed by the shale oil boom, has fueled
Appraiser Trends Study
 Appraiser Trends Study March 2017 National Association of REALTORS Research Department The National Association of REALTORS, The Voice for Real Estate, is America s largest trade association, representing
State of the Nation s Housing 2008: A Preview
 State of the Nation s Housing 28: A Preview Eric S. Belsky Remodeling Futures Conference April 15, 28 www.jchs.harvard.edu The Housing Market Has Suffered Steep Declines Percent Change Median Existing
City of Exeter Housing Element
 D. Housing Stock Characteristics Government Code Section 65583(a) requires an analysis and documentation of household characteristics, including level of payment compared to ability to pay, housing characteristics,
2012 Profile of Home Buyers and Sellers Texas Report
 2012 Profile of Home and Sellers Report Prepared for: Association of REALTORS Prepared by: NATIONAL ASSOCIATION OF REALTORS Research Division December 2012 2012 Profile of Home and Sellers Report Table
Introduction. Charlotte Fagan, Skyler Larrimore, and Niko Martell
 Charlotte Fagan, Skyler Larrimore, and Niko Martell Introduction Powderhorn Park Neighborhood, located in central-southern Minneapolis, is one of the most economically and racially diverse neighborhoods
RBC-Pembina Home Location Study. Understanding where Greater Toronto Area residents prefer to live
 RBC-Pembina Home Location Study Understanding where Greater Toronto Area residents prefer to live RBC-Pembina Home Location Study: Understanding where Greater Toronto Area residents prefer to live July
CULPEPER AFFORDABLE HOUSING NEEDS ASSESSMENT SUBMITTED TO VIRGINIA DEPARTMENT OF HOUSING AND COMMUNITY DEVELOPMENT JUNE 2013
 CULPEPER AFFORDABLE HOUSING NEEDS ASSESSMENT SUBMITTED TO VIRGINIA DEPARTMENT OF HOUSING AND COMMUNITY DEVELOPMENT JUNE 2013 Prepared by the Culpeper Affordable Housing Committee and Rappahannock-Rapidan
REAL ESTATE MARKET OVERVIEW 1 st Half of 2015
 REAL ESTATE MARKET OVERVIEW 1 st Half of 2015 With Comparisons to the 2 nd Half of 2014 September 4, 2015 Prepared for: First Bank of Wyoming Prepared by: Ken Markert, AICP MMI Planning 2319 Davidson Ave.
HOUSING ELEMENT Inventory Analysis
 HOUSING ELEMENT Inventory Analysis 2.100 INVENTORY Age of Housing Stock Table 2.25 shows when Plantation's housing stock was constructed. The latest available data with this kind of breakdown is 2010.
NAR Survey Shows Consumers Very Satisfied With Agent Performance
 For more information, contact: Walt Molony 702/981-8592 wmolony@realtors.org NAR Survey Shows Consumers Very Satisfied With Agent Performance LAS VEGAS, November 13, 2007 A new consumer survey shows that
Post-Katrina housing affordability challenges continue in 2008, worsening among Orleans Parish very low income renters
 Post-Katrina housing affordability challenges continue in 2008, worsening among Orleans Parish very low income renters Based on 2004, 2007 and 2008 American Community Survey data from the U.S. Census Bureau
Estimating National Levels of Home Improvement and Repair Spending by Rental Property Owners
 Joint Center for Housing Studies Harvard University Estimating National Levels of Home Improvement and Repair Spending by Rental Property Owners Abbe Will October 2010 N10-2 2010 by Abbe Will. All rights
Carver County AFFORDABLE HOUSING UPDATE
 Carver County AFFORDABLE HOUSING UPDATE July 2017 City of Watertown Community Partners Research, Inc. Lake Elmo, MN Executive Summary - Watertown Key Findings - 2017 Affordable Housing Study Update Watertown
Addressing the Impact of Housing for Virginia s Economy
 Addressing the Impact of Housing for Virginia s Economy A REPORT FOR VIRGINIA S HOUSING POLICY ADVISORY COUNCIL NOVEMBER 2017 Appendix Report 2: Housing the Commonwealth's Future Workforce 2014-2024 Jeannette
HOUSINGSPOTLIGHT. The Shrinking Supply of Affordable Housing
 HOUSINGSPOTLIGHT National Low Income Housing Coalition Volume 2, Issue 1 February 2012 The Shrinking Supply of Affordable Housing One way to measure the affordable housing problem in the U.S. is to compare
The Impact of Market Rate Vacancy Increases Eleven-Year Report
 The Impact of Market Rate Vacancy Increases Eleven-Year Report January 1, 1999 - December 31, 2009 Santa Monica Rent Control Board April 2010 TABLE OF CONTENTS Summary 1 Vacancy Decontrol s Effects on
Key Findings on the Affordability of Rental Housing from New York City s Housing and Vacancy Survey 2008
 Furman Center for real estate & urban policy New York University school of law n wagner school of public service 110 West 3rd Street, Suite 209, New York, NY 10012 n Tel: (212) 998-6713 n www.furmancenter.org
Highs & Lows of Floodplain Regulations
 Highs & Lows of Floodplain Regulations Luis B. Torres, Clare Losey, and Wesley Miller September 6, 218 H ouston, the nation s fourth-largest city and home to a burgeoning oil and gas sector, has weathered
How Severe is the Housing Shortage in Hong Kong?
 (Reprinted from HKCER Letters, Vol. 42, January, 1997) How Severe is the Housing Shortage in Hong Kong? Y.C. Richard Wong Introduction Rising property prices in Hong Kong have been of great public concern
Metropolitan Development and Housing Agency. Reviewed and Approved
 Action Plan Grantee: Grant: Metropolitan Development and Housing Agency B-09-CN-TN-0024 LOCCS Authorized Amount: Grant Award Amount: $ 30,469,999.99 $ 30,469,999.99 Status: Reviewed and Approved Estimated
Affordably- Priced Housing
 Affordably- Priced Housing Can the next generation afford to live in Chester County? Chester County Planning Commission This slide deck is an annotated version of one presented at the Chesco2020 Affordably-Priced
Carver County AFFORDABLE HOUSING UPDATE
 Carver County AFFORDABLE HOUSING UPDATE July 2017 City of Waconia Community Partners Research, Inc. Lake Elmo, MN Executive Summary - Waconia Key Findings - 2017 Affordable Housing Study Update Waconia
2012 Profile of Home Buyers and Sellers Florida Report
 2012 Profile of Home and Sellers Report Prepared for: REALTORS Prepared by: NATIONAL ASSOCIATION OF REALTORS Research Division December 2012 2012 Profile of Home and Sellers Report Table of Contents Introduction...
Housing Needs in Burlington s Downtown & Waterfront Areas
 Housing Needs in s Downtown & Waterfront Areas Researched and written by Vermont Housing Finance Agency for the City of Planning & Zoning Department 10/31/2011 Contents Introduction... 2 Executive Summary...
Chapter 1: Community & Planning Context
 Chapter 1: Community & Planning Context Yesterday, Today & Tomorrow Comprehensive Plan 2040 2 INTRODUCTION The City of Lauderdale is a small town with a long history. Nestled between Saint Paul and Minneapolis,
MEMORANDUM. Trip generation rates based on a variety of residential and commercial land use categories 1 Urban form and location factors the Ds 2
 MEMORANDUM Date: September 22, 2015 To: From: Subject: Paul Stickney Chris Breiland and Sarah Keenan Analysis of Sammamish Town Center Trip Generation Rates and the Ability to Meet Additional Economic
Rental Housing: Poised for a Return to Growth
 Rental Housing: Poised for a Return to Growth Christopher Herbert Remodeling Futures Conference November 9, 21 www.jchs.harvard.edu Summary of Ongoing Joint Center Research on The Rental Housing Market
City Center Market-Rate Housing Study
 City Center Market-Rate Housing Study OVERVIEW The City of Bellingham, with the assistance of students from Western Washington University, conducted a study of market-rate rental housing during April and
SJC Comprehensive Plan Update Housing Needs Assessment Briefing. County Council: October 16, 2017 Planning Commission: October 20, 2017
 SJC Comprehensive Plan Update 2036 Housing Needs Assessment Briefing County Council: October 16, 2017 Planning Commission: October 20, 2017 Overview GMA Housing Element Background Demographics Employment