COMMERCIAL REAL ESTATE RUSSIA # MARKETBEAT. Cushman & Wakefield Research Q1 2016
|
|
|
- Marylou Harvey
- 6 years ago
- Views:
Transcription

1 COMMERCIAL REAL ESTATE RUSSIA # MARKETBEAT Cushman & Wakefield Research Q1 2016
2 CONTENTS SECTION 1 OUTLOOK SECTION 2 COMMERCIAL REAL ESTATE SECTION 3 APPENDIX SECTION 4 OUR TEAM Major economic trends of current period, market review and forecast Macroeconomic and analytic review of various commercial real estate market sectors Major indicators of Moscow commercial real estate market, standard commercial lease terms Information about Cushman & Wakefield in Russia, Research department contact details 03 Outlook 04 Regulation 05 Macroreview 12 Capital Markets 17 Office 28 Retail 40 Warehouse & Industrial 47 Market Indicators 49 Lease Terms #MARKETBEAT Q CUSHMAN & WAKEFIELD RESEARCH DEPARTMENT 2 #MARKETBEAT Q1 2016
3 CONSUMER MARKET MAY FORM SECOND WAVE OF DECLINE OUTLOOK Russian economy is stagnating. Even slight RUB appreciation does not relief inflation pressure. Business activity is low and consumer market is under pressure. Decreasing household income and conservative adaptation strategies adopted by population suggest that sales will continue to diminish. By the end of Q business generally adapted to new norm by cutting expenses, optimizing volumes and headcounts. In Q2 we expect low business activity to remain. Real estate indicators (vacancies, rents, take up) will be stable, but still in the red zone. Many factors suggest that we are close to the bottom of the cycle, however major threat now comes from consumer market. If it sustains for Q2 there will be more evidence of the recovery. Russian population adopted survival adaptation strategy: people are slashing expenditures to compensate decreasing incomes without any significant efforts to maintain lifestyle. Today 72% of households have absolutely no savings, and together with inflating consumer prices this may lead to further contraction of consumer market. CUSHMAN & WAKEFIELD RESEARCH DEPARTMENT 3 #MARKETBEAT Q1 2016
4 DEDOLLARIZATION OFF THE AGENDA REGULATION Last year the Ministry of Trade scared business community with its plan to ban commercial rents nominated in any foreign currency. Recently they pulled back with the initiative and switched towards recommendation practice. Together with the fact that Vympelcom case did not stand appeal in the higher court, this suggests that government will not push forward with involuntary dedollarisation. The Moscow government slashed property tax rate from planned 1.5% to 1.3% of cadastral value. This shows their concern about the property market performance. However, no other stimulus package is being discussed. On one hand the Moscow authorities are trying to create attractive environment for citizens by offering public spaces, pedestrian zones, etc. But on the other hand they are very unwelcome to any sort of non organized activities including street musicians and micro retail. This will create opportunity for empty offices to be used for public events and social projects. CUSHMAN & WAKEFIELD RESEARCH DEPARTMENT 4 #MARKETBEAT Q1 2016

5 MACRO FORECAST BUDGET DEFICIT (% of GDP) % -3.9% -1.8% -0.4% RUB/USD EXCHANGE RATE MACROREVIEW PERSONAL CONSUMPTION % -0.7% 2.2% 3.8% Consumer market remains weak. Most likely domestic demand will contract till GDP GROWTH % 0.8% 1.8% 2.1% CPI % 5.6% 5.2% 4.6% REAL WAGES % 1.7% 2.1% 2.0% Source: Oxford Economics (02/2016), the Ministry Of Economics (03/2016)* CUSHMAN & WAKEFIELD RESEARCH DEPARTMENT 5 #MARKETBEAT Q1 2016
6 SUMMARY CONSUMER MARKET CORPORATE CURRENCY MACRO SUMMARY 2016: THE SECOND YEAR OF RECESSION. AUTHORITIES ARE STILL OPTIMISTIC -2.4% GDP growth outlook for 2016 According to Oxford Economics -0.3% GDP growth outlook for 2016 According to the Ministry of Economics Economists continue to downgrade outlook for the Russian economy, and this is one of the signs that we are still in the decline phase. Also there is a growing gap between official and independent forecasts that reflects p0orer transparency of the Russian economy. GDP GROWTH 5,2% -7,8% 4,5% 4,3% 3,4% 1,3% 0,6% -3,7% -0,3% -2,4% GDP Growth Рост ВВП, % 1,5% 0,8% 2,3% 2,5% 1,8% 2,1% Base case forecast Базовый прогноз, (03/2016) Oxford Economics (02/2016) 4% F2015 F2016 F2017 F2018 F2019 While the Ministry of Economics expect that GDP will contract by -0.3% with rapid recovery in 2017, Oxford Economics insists on the -2.4% in 2016 with recovery only in Even looking back at 2015 CPI estimates vary from 12.9% to 15.5% INFLATION 18% 16% 14% 12% 10% 8% 6% CPI ИПЦ, % Oxford Economics (02/2016) Base case forecast Базовый прогноз, (03/2016) F2015 F2016 F2017 F2018 F2019 #MARKETBEAT Q Source: Rosstat, the Ministry of Economics, Oxford Economics CUSHMAN & WAKEFIELD RESEARCH DEPARTMENT 6

7 SUMMARY CONSUMER MARKET CORPORATE CURRENCY CONSUMER MARKET CONSUMER MARKET COLLAPSE IS A MAJOR RISK FACTOR FOR REAL ESTATE Over the last 3 years the share of households possessing savings decreased from 72% to 27%. This means that savings will no longer support household budgets and people will have to slash spending. -9.4% Household consumption Contracted in ,4% Government consumption Contracted in 2015 CONSUMER DEMAND Disposable income Раcполагаемые доходы 13,7% Retail trade Оборот розничной торговли 6,5% 7,1% 6,3% 3,9% 3,5% 3,7% 2,5% 1,5% -3,3% -5,1% -10,0% F2016 F2017 F2018 F2019 There is a risk of further decline in consumer demand in Q Savings are almost exhausted and even appreciation of RUB will play against consumers because it will devaluate their foreign currency reserves. Conservative adaptation model is a major threat for consumer market stability. People will be expecting the government to support them instead of looking for alternative sources of income. Additional social programs will ask for increasing taxation. Household consumption will be under pressure until Three years of recession in consumer market will lead to structural shots in consumption patterns and supply chains. #MARKETBEAT Q CUSHMAN & WAKEFIELD RESEARCH DEPARTMENT 7


8 MACROREVIEW CAPITAL MARKETS OFFICES RETAIL WAREHOUSES SUMMARY CONSUMER MARKET CORPORATE CURRENCY CREDIT MARKET CONSUMER CREDIT SLOWS DOWN. MORTGAGE GROWS In December decrease of debt was registered. His means that even the New Year period did not provoke spending. In February debt decreased even further. 37% Share of mortgage In total debt While overall debt is shrinking, there is a substantial increase in mortgage loans. Over the last 3 years a share of mortgage had risen from 25% to 37% of total household debt. State support is a major facilitator for mortgage loans. CONSUMER CREDITS IN RUSSIA Decrease in residential prices makes apartments more affordable for population. Households consider this period as a window of opportunity to upgrade living space and they appreciate state support for mortgage rate. The side effect of these long term obligations will be a drainage of money available for retail spending RUB AVERAGE HOUSEHOLD DEBT Household debt m-o-m change Total debt Share of overdue debt 2,0% 1,5% 1,0% 0,5% 0,0% -0,5% % ,0% Personal savings, bn RUR Накопления, млрд. руб. -1,5% Total Debt, bn RUB Задолженность, млрд. #MARKETBEAT Q руб. CUSHMAN & WAKEFIELD RESEARCH DEPARTMENT 8 Source: The Central Bank of the Russian Federation % 8% 7% 6% 5% 4%
9 Jan-14 Mar-14 May-14 Jul-14 Sep-14 Nov-14 Jan-15 Mar-15 May-15 Jul-15 Sep-15 Nov-15 Jan-16 Mar-16 Jan-14 Mar-14 May-14 Jul-14 Sep-14 Nov-14 Jan-15 Mar-15 May-15 Jul-15 Sep-15 Nov-15 Jan-16 Mar-16 MACROREVIEW CAPITAL MARKETS OFFICES RETAIL WAREHOUSES SUMMARY CONSUMER MARKET CORPORATE CURRENCY CREDITS CONSTRUCTION IS UNDER PRESSURE 20% Construction debt isstagnating since mid Minor decrease of the RUB debt is compensated by modest increase of the foreign currency debt. However total corporate debt in nominal Rubles grows steadily. Surprisingly over 22% of RUB construction debt is overdue, while only 4% of foreign currency debt is not serviced. Probably a few of large scale RUB borrowers experience problems with their debts. Of construction debt IS OVERDUE 7% Of all corporate debt IS OVERDUE CORPORATE AND CONSTRUCTION DEBT ,0% 6,8% 6,6% 6,4% 6,2% 6,0% 5,8% 5,6% 5,4% 5,2% 5,0% OVERDUE DEBT 25% 20% 15% 10% 5% 0% % of overdue debt Общая доля просроченных кредитов, % Total Corporate debt (bn RUR) Все кредиты, млрд.руб Overdue debt in construction Просроченные кредиты на строительство Share of debt for construction Доля кредитов на строительство, % #MARKETBEAT Q CUSHMAN & WAKEFIELD RESEARCH DEPARTMENT 9
10 SUMMARY CONSUMER MARKET CORPORATE CURRENCY CURRENCY INFLATION IS A MAJOR FACTOR FOR COMMERCIAL REAL ESTATE MARKET Ruble and Dollar inflation in Russia 350% 37% Loss of the USD purchasing power in Russia since 1004 In 2004 prices USD in 2016 costs 22 Rubles. 300% 250% 200% 150% 100% 50% 0% Aggregated CPI ИПЦ нарастающим итогом RUB/USD USD inflation in Russia Инфляция доллара в РФ CUSHMAN & WAKEFIELD RESEARCH DEPARTMENT 10 #MARKETBEAT Q1 2016
11 SUMMARY CONSUMER MARKET CORPORATE CURRENCY CURRENCY IN SPITE OF THE MAJOR CHANGE IN NOMINAL RENTS, CORRECTION IN REAL TERMS IS RELATIVELY INSIGNIFICANT Nominal and real office rents reached historical minimum by March 2016 Growth of nominal USD nominated rents driven by RUR appreciation and inflation make commercial real estate very attractive for foreign investment. However if the market will be switched to Rubles this investment opportunity will be lost. Nominal and real office rents indices 300% 250% 200% 150% 100% 50% 0% Jan-04 Jan-05 Jan-06 Jan-07 Jan-08 Jan-09 Jan-10 Jan-11 Jan-12 Jan-13 Jan-14 Jan-15 Jan-16 Constant price office rents indeх Индекс офисных ставок в постоянных ценах USD Office rents index relative to Индекс долларовых офисных ставок к январю 2004 г. CUSHMAN & WAKEFIELD RESEARCH DEPARTMENT 11 #MARKETBEAT Q1 2016

12 ACTUAL INVESTMENT VOLUMES US$ bn US$ bn CAPITAL MARKETS In Q1 2016, the total volume invested in the Russian commercial real estate was US$ 2.5 bn. We expect US$ 3.5 bn of investments by the end of EXPECTED TOTAL INVESTMENTS PRIME CAPITALIZATION RATES OFFICES SHOPPING CENTERS US$ bn Q Q % 10.50% Q Q % 11.00% WAREHOUSES Q Q % 12.75% Source: Cushman & Wakefield #MARKETBEAT Q CUSHMAN & WAKEFIELD RESEARCH DEPARTMENT 12
13 CAPITALIZATION RATES INVESTMENT VOLUMES INVESTMENT STRUCTURE BIGGEST DEALS CAPITALIZATION RATES CAPITALIZATION RATES REMAIN UNCHANGED 10.5% CAPITALIZATION RATE FOR OFFICE OBJECTS In Q1 2016, we kept capitalization rates at the same level. All the indicated capitalization rates are applicable to the objects with dollar cash-flow. In Q1 2016, tenants kept popping more and more objects into ruble zone. Comparing to Q the total amount of ruble deals increased. CAPITALIZATION RATES In March 2016, the Central Bank of the Russian Federation made a decision to keep the key rate at 11.00% per annum. The previous change took place in June 2015 the key rate was decreased 0.50 pp from to The regulatory authority promises to revise the key rate to the downside as soon as inflation slows down firmly. CBR KEY RATE, CBR REFINANCING RATE 16% 18% 14% 16% 11.0% CBR KEY RATE 12% 10% 8% 6% 4% 14% 12% 10% 8% 6% 4% 2% 0% Q1 2% 0% 11,00% 10,00% 13,00% 8,75% 7,75% 8,00% 8,25% 8,25% 17,00% 11,00% 11,00% Q OFFICES SHOPPING CENTERS WAREHOUSES CBR REFINANCING RATE CBR KEY RATE #MARKETBEAT Q CUSHMAN & WAKEFIELD RESEARCH DEPARTMENT 13
14 CAPITALIZATION RATES INVESTMENT VOLUMES INVESTMENT STRUCTURE BIGGEST DEALS INVESTMENT VOLUMES THE MARKET STALLS No bad news is the best news. INVESTED VOLUMES, US$ MN 3.5 US$ bn 2016 FORECAST OFFICE RETAIL INDUSTRIAL OTHER FORECAST In Q1 2016, the total volume invested in the Russian commercial real estate was US$ 2.5 bn. The bigger volumes were registered only twice during the last ten years in Q and Q Such a big volume of investments may be explained with prolongation of transaction completions. The investors believe office objects are overestimated by vendors. The latter do not rebate. The threat of increasing vacancy rate in shopping centers and economy mode as a de facto behavior model of Russian consumers make the segment unattractive for potential investors. The industrial segment kept to be the most predictable one. The market players believe the market meets minimum in the nearest months which may be qualified as a prerequisite of revival. We revised our 2016 forecast expecting US$ 3.5 bn by the end of the year. #MARKETBEAT Q CUSHMAN & WAKEFIELD RESEARCH DEPARTMENT 14
15 CAPITALIZATION RATES INVESTMENT VOLUMES INVESTMENT STRUCTURE BIGGEST DEALS INVESTMENT STRUCTURE NO SIGNIFICANT SHIFTS 60% of money spent in Q are invested in offices for owner occupation US$ mn INVESTED IN OFFICE SEGMENT 23 CASH FLOWS INVESTOR RUSSIA SEGMENT OFFICES VENDOR RUSSIA In Q1 2016, the foreign companies refrained from active investment activities. Welcome but modest (just US$ 50 mn) entering the market by Mubadala of UAE is to be mentioned. The lion share of all the investment volume US$ 2.43 bn are the purchases by domestic companies. And the major part of them US$ 1.74 bn is the investment in office segment. Domestic companies spent US$ 1.47 bn for buying office properties for their own needs. There were no landmark deals with retail properties by neither domestic nor foreign companies. US$ mn INVESTED IN RETAIL SEGMENT UAE USA FINLAND HOTELS INDUSTRIAL RETAIL AUSTRIA #MARKETBEAT Q CUSHMAN & WAKEFIELD RESEARCH DEPARTMENT 15
16 CAPITALIZATION RATES INVESTMENT VOLUMES INVESTMENT STRUCTURE BIGGEST DEALS THE BIGGEST DEALS THE FIVE TOP DEALS OF Q US$ 2.3 BN 1140 US$ mn THE BIGGEST DEAL SEGMENT QUARTER PROPERTY INVESTOR AMOUNT, US$ MN OFFICES Q1 EVOLUTION TRANSNEFT 1140 OFFICES Q1 EURASIA VTB 300 OFFICES Q1 AVRORA BUSINESS PARK O1 PROPERTIES 250 WAREHOUSES RETAIL Q1 METRIKA (ST. PETERSBURG) KESKO 10 Q1 PNK - CHEKHOV 3 PNK - SEVERNOYE SHEREMETYEVO RDIF MUBADALA 100 WAREHOUSES Q1 BIN GROUP NIKOLSKOYE LOGOPARK (DMITROV) 50 НОТЕLS Q1 KURORT PLUS KRASNAYA POLYANA (SOCHI) 500 НОТЕLS Q1 APART GROUP NOVY ARBAT #MARKETBEAT Q CUSHMAN & WAKEFIELD RESEARCH DEPARTMENT 16

17 OFFICES SHARE OF VACANT OFFICE SPACES 16 mn sq m TOTAL STOCK 3.1 mn sq m VACANT OFFICES 19.3 VACANCY RATE % Following tough 2015, Q continues the descent. We expect market indicators to keep consistently low in CONSTRUCTION 63,000 NET ABSORBTION -21,500 SQ M SQ M RENTAL RATES CLASS A CLASS B CLASS A&B $433 $193 $249 TAKE-UP 360,000 Source: Cushman & Wakefield SQ M #MARKETBEAT Q CUSHMAN & WAKEFIELD RESEARCH DEPARTMENT 17
18 000 sq m Q Q Q Q Q Q Q Q Q Q Q Q Q Q Q Q Q1 MACROREVIEW CAPITAL MARKETS OFFICES RETAIL WAREHOUSES SUMMARY ABSORPTION DEMAND NEW SUPPLY AVAILABILITY EXPOSITION RENTAL RATES Absorption 2016 STARTED WITH NEGATIVE ABSORPTION ABSORPTION ABSORPTION IN Q sq m 000 sq m IN Q ABSORPTION AND NEW CONSTRUCTION QUARTERLY ABSORPTION BY CLASSES Q New Supply Absorption Class A Class B Source: Cushman & Wakefield #MARKETBEAT Q CUSHMAN & WAKEFIELD RESEARCH DEPARTMENT 18
19 SUMMARY ABSORPTION DEMAND NEW SUPPLY AVAILABILITY EXPOSITION RENTAL RATES DEMAND TAKE UP REMAINS AT THE SAME LEVEL FOR THREE QUARTERS % TAKE New deals UP IN Q COMPARED TO Q MAJOR DEALS IN Q COMPANY AREA BUILDING CLASS / SUBMARKET VTB 93,878 sq m Eurasia A / Central Moscow Government 31,860 sq m ОКО А / Central Philip Morris 4,784 sq m Kuntsevo Plaza A / OTA Rusatom Overseas 3,010 sq m Simonov Plaza B+ / OTA Tele2 2,208 sq m Vodny A / OTA INTREK 2,068 sq m WTC III A / Central In Q the total volume of office take-up amounted to 360,000 sq m which is stable for three quarters in a row already. Considerable growth of the indicator in Q compared to Q is due to low base effect. However the absorption was negative coming to - 21,500 sq m. Negative absorption is generally caused by low business activity in the beginning of the year and does not imply negative trend, especially with quite high activity on the background. Low new construction volume in Moscow maintains the balance of supply and demand and keeps the stability of the market. Source: Cushman & Wakefield #MARKETBEAT I КВАРТАЛ 2016 ОТДЕЛ ИССЛЕДОВАНИЙ CUSHMAN & WAKEFIELD 19

20 Thousands sq m MACROREVIEW CAPITAL MARKETS OFFICES RETAIL WAREHOUSES SUMMARY ABSORPTION DEMAND NEW SUPPLY AVAILABILITY EXPOSITION RENTAL RATES NEW SUPPLY SIGNIFICANT DECREASE IN CONSTRUCTION ACTIVITY New construction volume will remain low for upcoming two or three years. NEW CONSTRUCTION BY CLASSES Q f In Q no new class A office buildings were delivered to the market. 63,000 sq m of the delivered space are class B office buildings located outside of the city centre. As it was expected, at the beginning of 2016 delivery dates of the majority of projects under construction were postponed. Delivery of many projects was moved to Some were converted from offices to residential projects. There is still a lot of office space (around one million sq m) under construction. However construction activity is very low so we don t expect these projects to be delivered to the market in a short time period. By the end of 2016 new construction volume is expected to reach 300,000 sq m. The vast majority of projects to be completed in 2016 and 2017 were initially planned for commissioning in Class A Class B (B+&B-) Source: Cushman & Wakefield #MARKETBEAT Q CUSHMAN & WAKEFIELD RESEARCH DEPARTMENT 20
21 Thousands sq m MACROREVIEW CAPITAL MARKETS OFFICES RETAIL WAREHOUSES SUMMARY ABSORPTION DEMAND NEW SUPPLY AVAILABILITY EXPOSITION RENTAL RATES AVAILABILITY EVERY FIFTH SQUARE METER OF THE EXISTING OFFICES IS VACANT 19.3 % VACANCY RATE IN Q mn sq m EXISTING AVAILABILITY Vacancy rate has been increasing every month since the beginning of economic downturn. By the end of 2015 average level for classes A and B almost reached 20% and then the growth has stopped. It was the first time in history of the Moscow office market when the vacancy rate reached that high. VACANCY RATES 35% 30% 25% 20% 15% 10% 5% 0% 28,93% 16,33% Q Class A Class B (B+&B-) Considering low volume of new construction, we expect the indicator to be at the similar level during 2016 and no significant increase in However, vacancy rate is not likely to decrease significantly in the upcoming 2-3 years. VACANT PREMISES Q1 Class A Class B (B+&B-) 2016 Source: Cushman & Wakefield #MARKETBEAT Q CUSHMAN & WAKEFIELD RESEARCH DEPARTMENT 21
22 SUMMARY ABSORPTION DEMAND NEW SUPPLY AVAILABILITY EXPOSITION RENTAL RATES EXPOSITION SOME PREMISES HAVE BEEN VACANT FOR 3 YEARS AND MORE ,5% % 18% % ,09% 12,48% 13,14% 14% ,29% 317 7,00% ,68% 4,17% 2,81% 1,95% Vacancies 12% 10% 8% 6% 4% 2% 0% Exposition period, days Vacancy rate, % Source: Cushman & Wakefield #MARKETBEAT Q CUSHMAN & WAKEFIELD RESEARCH DEPARTMENT 22
23 SUMMARY ABSORPTION DEMAND NEW SUPPLY AVAILABILITY EXPOSITION RENTAL RATES RENTAL RATES DEDOLLARIZATION USD Triple net OpEx+VAT US CPI indexation All inclusive Russian CPI ~ 12.5% Lease RUB USD at fixed rate Discount Exchange risk management Corridor RUB rate reverted to USD after fixed period Splits risk between landlord and tenant Splits risk over time Source: Cushman & Wakefield #MARKETBEAT Q CUSHMAN & WAKEFIELD RESEARCH DEPARTMENT 23
24 SUMMARY ABSORPTION DEMAND NEW SUPPLY AVAILABILITY EXPOSITION RENTAL RATES RENTAL RATES RENTAL RATES* IN US DOLLARS EQUIVALENT ARE SETTING NEW NEGATIVE RECORDS 94 % SHARE OF RUSSIAN ROUBLE DEALS IN Q In Q rental rates in dollar equivalent again showed the historically lowest figures. Both rouble and dollar rates are dropping down. We expect that stable USD currency exchange rate in 2016 will keep rental rates at the same level during the whole year. Lease agreements with rents nominated in rubles or with special conditions of payment for dollar-nominated rental rates will be a market tendency in the upcoming years. RENTAL RATES IN US DOLLARS VALUE $1 200 $1 000 $800 $600 $400 $200 $- $193 $433 RENTAL RATES IN RUSSIAN ROUBLES VALUE rub rub rub rub rub rub rub rub. - rub rub rub. *hereinafter all rental rates are net of OPEX and VAT Class A Class B (B+&B-) Class A Class B (B+&B-) Source: Cushman & Wakefield #MARKETBEAT Q CUSHMAN & WAKEFIELD RESEARCH DEPARTMENT 24
25 Thousands sq m MACROREVIEW CAPITAL MARKETS OFFICES RETAIL WAREHOUSES SUMMARY ABSORPTION DEMAND NEW SUPPLY AVAILABILITY EXPOSITION RENTAL RATES ROUBLES VS DOLLARS DOLLAR IS STEPPING BACK ROUBLE US Dollars per sq m per annum DOLLAR EQUIVALENT ALL A CLASS DEALS Roubles per sq m per annum EQUIVALENT ALL DEALS IN B CLASS ROUBLE DEALS VS DOLLAR DEALS DEMAND AND RATES Q Q Q Q Q Q Q Q Q Class Deal Currency Deals Volume, sq m Rate А USD $564 RUB roubles BB USD $563 RUB roubles RUB Deals USD Deals Source: Cushman & Wakefield #MARKETBEAT Q CUSHMAN & WAKEFIELD RESEARCH DEPARTMENT 25

 $1 400 Rental rate, USD/sq m / Арендная ставка, долл. за кв.м.")
26 $2 000 $1 800 $ DEALS СДЕЛОК Class B / Класс B Class A / Класс А Moscow office lease deals by rent and transaction date bubble size reflects deal size Сделки аренды на московском рынке по дате заключения и арендной ставке. размер точки соответствует площади сделки ( Weighted average A class rent / Среднее взвешенное значение за год, Класс А Weighted average B class rent / Среднее взвешенное значение за год, класс B = sq m) $1 400 Rental rate, USD/sq m / Арендная ставка, долл. за кв.м. $1 200 $1 000 $800 $600 $400 $200 $ #MARKETBEAT Q Source: Cushman & Wakefield Deal date / Дата сделки CUSHMAN & WAKEFIELD RESEARCH DEPARTMENT 26
27 $1 300 CLASS A CLASS B+ MKAD Log. (CLASS A) Log. (CLASS B+) Log. (CLASS B- and C) Quality premium $500 $700 $900 MOSCOW CITY $1 100 CLASS B- and C $300 $100 Rental rate USD/sq.m (3 year average) MOSCOW OFFICE MARKET LOCATION AND QUALITY PREMIUMS CBD 0 #MARKETBEAT Q Distance from city center, km Source: Cushman & Wakefield CUSHMAN & WAKEFIELD RESEARCH DEPARTMENT 27

28 RETAIL At the beginning of 2016 market slowed down falling, market players are noticing relative stabilization. Shrinking consumer market remains the main risk factor. Considering continuing inflation, income level drop and high household debt load, we expect consumer activity to decline. As a result, there is a potential of tenants activity decrease and shopping centers vacancy rate growth. Source: Cushman & Wakefield Research 12 % VACANCY RATE (all shopping centers, Moscow) RUB PRIME RENTAL RATE INDICATOR 116 QUALITY PROJECTS TOTAL QUALITY STOCK, MOSCOW (Quality shopping malls, mixed-use buildings, outlets, and retail parks) 4.6 MN SQ M TOTAL QUALITY STOCK, MOSCOW (Quality shopping malls, mixed-use buildings, outlets, and retail parks) #MARKETBEAT Q CUSHMAN & WAKEFIELD RESEARCH DEPARTMENT 28
29 SUMMARY RETAILERS SHOPPING CENTRES COMMERCIAL TERMS SUMMARY VAGUE BALANCE WITH UNCLEAR PERSPECTIVES Unpredictable depth of consumer market decrease and limited financial resources are base factors influencing the market. Consumers reduce costs. Owners have provided maximum of personalized conditions. The market came to a vague balance by the end of 2015 rapid decrease of the main market indicators slowed down showing all market players being in consensus with noticeably changed circumstances. However, there are still no basic trends preparing basics for confident optimism - shrinking consumer market and hard-to-reach financing as well as stagnation in economics in general. Rotation of the tenants in sustainable shopping centers continues, but not massive and total occupancy rate keeps relatively stable. Newly opened properties are moving to higher occupation. Exposition period of vacant premises is now longer, but properties opened in attract new operators. Some of them have noticeably decreased vacancy rates, others keep stable. We see activity on the market - retailers still consider opportunities for development, but lease terms are carefully negotiated. Developers consider personally tailored terms for each tenant. Last year turned the market from a market of developer to a market of tenant, now consumer is the main focus of attention. Applying a conservative scenario, the decrease of money amount that is redistributed between different formats and categories of operators can lead to vacancy rate growth as the number of chain retailers stores will decrease and new shopping centres will be opened with high vacancy rate. Large players and food retailers will remain active in this situation. #MARKETBEAT Q CUSHMAN & WAKEFIELD RESEARCH DEPARTMENT 29
30 SUMMARY RETAILERS SHOPPING CENTRES COMMERCIAL TERMS CONSUMER MARKET CONSUMER ACTIVITY DECREASE IS MOSTLY NOTICEABLE IN LARGE CITIES -3.6% Q Average monthly footfall change in Moscow shopping centres* -2.5 Q Average monthly footfall change in St. Petersburg shopping centres* Source: Watcom, Cushman & Wakefield calculation According to Watcom data in Q footfall in shopping centres keeps decreasing (the trend has been noticed since 2015). The most sustainable format is a neighborhood shopping centre. In St. Petersburg football decrease is less noticeable due to low base effect. FOOTFALL CHANGE BY SHOPPING CENTRE SIZE (Q TO Q1 2015) 4% 2% 0% -2% -4% -6% -8% -10% > St. Petersburg Moscow Source: Watcom, Cushman & Wakefield calculation Moscow market has shown bigger changes in consumer behaviour Muscovites have always been aggressive in consumption, so consumer habits correction is more evident. CONSUMER MARKET, 2015 COMPARED TO 2014 #MARKETBEAT Q CUSHMAN & WAKEFIELD RESEARCH DEPARTMENT 30-14% -12% -10% Source: Rosstat -8% -6% -5% Retail trade turnover Catering turnover Moscow St. Petersburg Russia
31 SUMMARY RETAILERS SHOPPING CENTRES COMMERCIAL TERMS RETAILERS NEW OPENINGS WITH NEW TERMS Many tenants are considering new openings, however they are trying to minimize costs and expansion risks. NEW RETAILERS EXPANSION Retailers activity is much lower than it was before If developer is interested in brand attraction, some preferences can be given to tenant (fit-out compensation, discount period). Mostly, food retail chains, fast-food / café / confectionary operators, DIY and alcoholic stores announce their expansion plans. Developers continue the trend to create own brands (Aviapark starts operating a 6,000 sq m department store). Some operators have financial difficulties (for example, Sbarro, Moon Accessorize, Deti, Centrobuv ). Luxury brands report on sales growth and new shops openings. Among possible reasons of this trend there are: increase of Chinese tourists flow and currency exchange rate growth that made it cheaper to buy luxury brands in Russia. Another obvious tendency is expansion of entertainment areas in shopping centres they are aimed to increase footfall and create identity of the project, decrease vacancy. Perception and approach to development of these areas is changing. Instead of traditional ice-rings, bowling, gaming machines new formats are becoming more popular contact zoos, edutainment centres, rope parks, trampoline centres, quests, thematic theatres, exhibitions and hobby goods shops. New children entertainment centre Fiesta Park is entering the Moscow market, Leonardo retail chain is expanding, the store with radio control models Pilotage was opened in a new format (with training tracks and areas for competitions and master classes) in Aviapark shopping centre. #MARKETBEAT Q CUSHMAN & WAKEFIELD RESEARCH DEPARTMENT 31

32 SUMMARY RETAILERS SHOPPING CENTRES COMMERCIAL TERMS SHOPPING CENTRES. MOSCOW VACANCY RATE LEVEL TENDS TO GROW 12% Vacancy rate* by shopping center type: Prime: 2-3% Sustainable: 7-8% Opened in : 25-30% Average market vacancy rate 2016 forecast: 14-15%. The possibility of further growth is high as new projects with high vacancy rate will be opening and there will be further rotation of tenants in existing shopping centres. Announced to be opened in 2016: 35-40% Size of a bubble is a size of each shopping center. *Calculation is based on the actual vacant space in shopping centres, and not according to signed lease contracts. #MARKETBEAT Q CUSHMAN & WAKEFIELD RESEARCH DEPARTMENT 32

 show high occupancy rate consistently, though the rotation of tenants is registered.")
33 SUMMARY RETAILERS SHOPPING CENTRES COMMERCIAL TERMS SHOPPING CENTRES. MOSCOW ALMOST 25% OF TOTAL MOSCOW RETAIL SPACE WAS CONSTRUCTED OVER THE PAST TWO YEARS 70% Share of sustainable shopping centres Vacancy rate in sustainable shopping centres (opened more than 2 years ago, with loyal target audience and balanced tenant mix) hasn t changed significantly during past year. Prime shopping centres (successful projects in prime locations) show high occupancy rate consistently, though the rotation of tenants is registered. Aviapark, March 2015 Projects constructed over the past two years that had high vacancy rate at the opening, are slowly decreasing the vacancy level. Retailers activity dropped noticeably and exposition period increased. Preferences that tenants receive for opening and for the initial lease period is an important driver to decrease the vacancy rate. Aviapark, March % of total retail space was constructed in #MARKETBEAT Q CUSHMAN & WAKEFIELD RESEARCH DEPARTMENT 33

34 SUMMARY RETAILERS SHOPPING CENTRES COMMERCIAL TERMS SHOPPING CENTRES. MOSCOW AND REGIONS 4 SHOPPING CENTRES WERE OPENED IN Q IN RUSSIA Average size of shopping centre decreases as well as construction volumes. 460 QUALITY SHOPPING CENTRES IN RUSSIA 18.6 mn sq m EXISTING QUALITY RETAIL SPACE IN SHOPPING CENTRES NEW CONSTRUCTION IN RUSSIA, 000 SQ M 4 shopping centres with total GLA of 204,500 sq m were opened in Q Shopping centres keep opening with low occupancy of retail gallery. Developers tend to open the projects in phases. For example, in MegaGRINN mixed-use complex in Kursk several floors were partially opened, launch of the rest of the complex (including entertainment, sports areas, hotel) is expected later in Construction of smaller size shopping centres instead of large-scale projects has become a trend. Average size of existing shopping centre is 36,000 sq m, of a shopping centre to be delivered in ,000 sq m. Half of retail space planned for delivery to the market in 2016 is being constructed in the cities with population of less than one million people. Due to the high level of retail space density in the cities with population of more than one million people, 25% of the space planned for delivery to the market in such cities in 2016 are new phases of existing retail projects. #MARKETBEAT Q CUSHMAN & WAKEFIELD RESEARCH DEPARTMENT 34
 Good OK (Samara)")


.")
35 SUMMARY RETAILERS SHOPPING CENTRES COMMERCIAL TERMS SHOPPING CENTRES. REGIONS OF RUSSIA REGIONAL MARKETS ARE MORE SENSITIVE TO THE CHANGES IN DEMAND FROM POTENTIAL TENANTS MegaGRINN (Kursk) Good OK (Samara) Absorption potential of regional markets is lower than in larger markets of Moscow and Saint Petersburg, so even delivery of one large-scale shopping center with high vacancy rate to the market affects indicators of the whole market significantly. For example, after the opening of Galereya Novosibirsk shopping centre in Novosibirsk, average market vacancy rate grew up to 15%, but as there were no more new large-scale projects opened, average market vacancy rate returned to the level of 8-10% during the year. In the big cities where no large-scale projects were opened in 2015, we observe tenants rotation in existing shopping centers, but vacancy rate remains at the level of 10% (for example, in Saint Petersburg, Kazan, Ekaterinburg). In the key and most successful projects vacancy rate remains low (2-3%). OkhtaMall (St. Petersburg) Star City Mall (Tumen) #MARKETBEAT Q CUSHMAN & WAKEFIELD RESEARCH DEPARTMENT 35


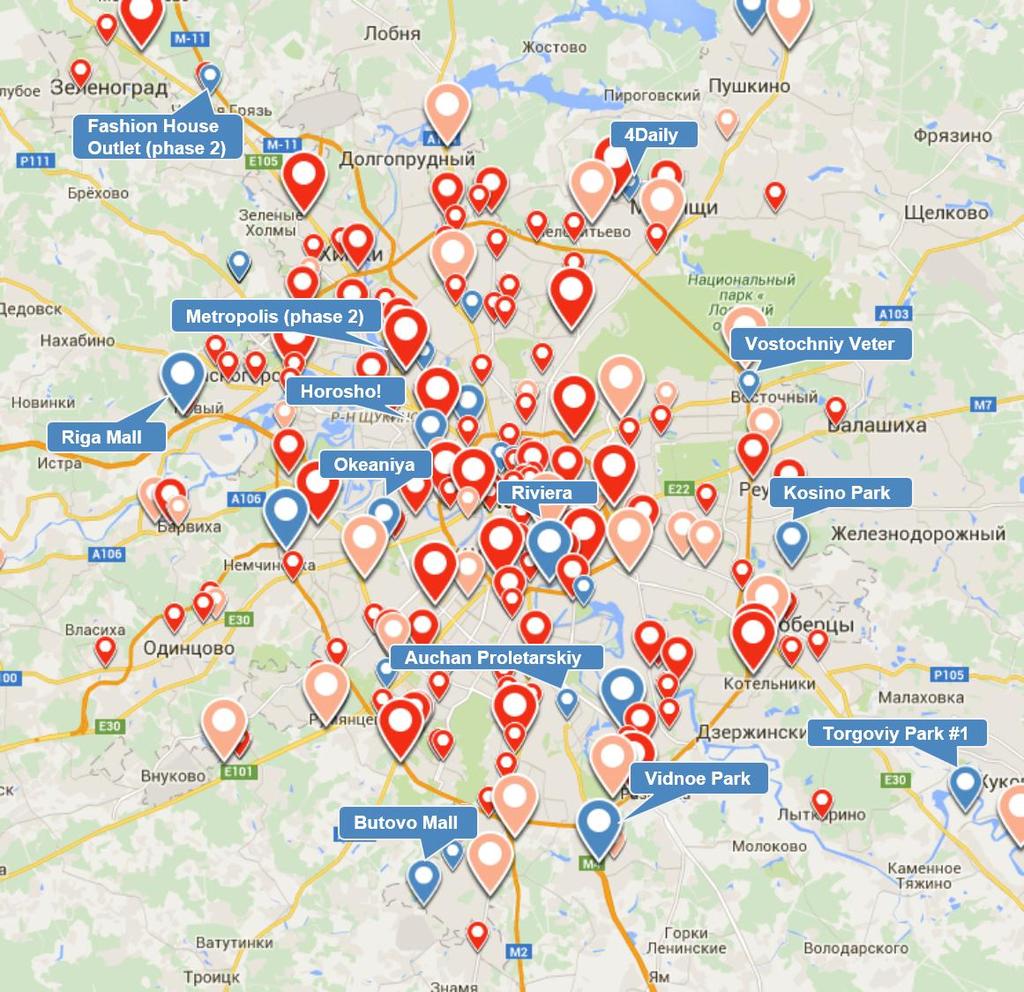
36 SUMMARY RETAILERS SHOPPING CENTRES COMMERCIAL TERMS SHOPPING CENTRES. MOSCOW AND MOSCOW REGION NO NEW SHOPPING CENTRES WERE OPENED IN Q MOSCOW: 116 QUALITY SHOPPING CENTRES 4.6 mn sq m QUALITY RETAIL SPACE IN SHOPPING CENTRES NEW CONSTRUCTION IN MOSCOW AND MOSCOW REGION, 000 SQ M No new shopping centres were opened in Moscow in Q Riviera shopping centre, which was planned for delivery to the market in March, was opened in April Delivery dates of the majority of projects were postponed for 2-3 months. However we expect large projects such as Okeaniya, Horosho!, Butovo Mall, second phase of Metropolis shopping centre to be delivered to the market till the end of the year. Shopping centres will keep opening with high vacancy rate despite the fact that the number of lease contacts signed is more than the actual number of shops opened. Tenants will occupy the shopping centers step by step after the opening. New shopping centres are being announced, however in general these are small projects or support retail objects inside mixed-use complexes or transport transit hubs. #MARKETBEAT Q CUSHMAN & WAKEFIELD RESEARCH DEPARTMENT 36
37 SUMMARY RETAILERS SHOPPING CENTRES COMMERCIAL TERMS SHOPPING CENTRES. MOSCOW AND REGIONS SHOPPING CENTRES DELIVERED TO THE MARKET IN Q AND PIPELINE FOR 2016 LOCATION PROPERTY NAME RETAIL GLA, SQ M DELIVERY LOCATION PROPERTY NAME RETAIL GLA, SQ M DELIVERY Moscow Riviera 100,000 Q2 Moscow Kosino Park 39,000 Q2 Moscow Okeaniya 60,000 Q3 Moscow Butovo Mall 57,000 Q3 Moscow Horosho! 50,000 Q3 Moscow Metropolis (Phase 2) 40,000 Q3 Moscow Auchan Proletarskiy 14,877 Q4 Moscow Fashion House Outlet (Phase 2) 4,500 Q4 Total GLA Moscow, ,763 Zhukovsky Torgovy Park N1 45,488 Q2 Balashikha Vostochniy veter 10,000 Q2 Krasnogorsk Riga Mall 80,000 Q3 Mytischi 4Daily 25,000 Q3 Vidnoe Vidnoe Park 70,000 Q4 Total GLA Moscow Region, ,488 Total GLA Moscow and Moscow Region, ,251 The table includes all major quality projects in Moscow and Moscow Region planned for delivery in Kursk MegaGRINN 129,000 Q1 Pskov Aquapolis 34,000 Q1 Ekaterinburg Akademicheskiy 30,000 Q1 Balakovo Green House (phase 2) 11,500 Q1 Total GLA Russia (without Moscow and Moscow region), ,500 Vladivostok Sedanka-City 45,000 Q2 Samara Good'Ok 115,000 Q3 Saint Petersburg Okhta Mall 78,000 Q3 Lipetsk Riviera 61,000 Q3 Voronezh Chizhov Gallery (phase III) 60,000 Q3 Arkhangelsk Maxi 49,243 Q3 Nizhniy Tagil Retail Park Depo 40,000 Q3 Kursk Evropa Phase 2 107,000 Q4 Tumen Star City Mall 53,000 Q4 Orenburg Armada Capital 51,000 Q4 Novosibirsk Evropeyskiy 45,000 Q4 Ekaterinburg Greenvich (phase V) 41,836 Q4 Total GLA Russia (without Moscow and Moscow region), announced development plans for ,637,477 The table includes all quality projects completed in Q and the largest (GLA 40,000+ sq. m ) projects announced for delivery later in #MARKETBEAT Q CUSHMAN & WAKEFIELD RESEARCH DEPARTMENT 37


38 #MARKETBEAT Q Riviera Okeaniya Horosho!
39 SUMMARY RETAILERS SHOPPING CENTRES COMMERCIAL TERMS COMMERCIAL TERMS RELATIVE STABILIZATION OF RENTAL RATE INDICATOR IN RUBLES In 2015 short-term agreements fixing rates in rubles were signed in addition to existing contracts. In new projects nominating rents in foreign currency is a rare, almost unique case rub / sq m / year Prime shopping mall indicator*, Moscow, Q For the first time in the history of the retail market research, prime rental rate indicator is nominated in rubles. In fact, even if principal lease contracts are nominated in foreign currency rental payments are temporarily fixed in rubles. From the middle of the last year rent indicator in rubles hasn t shown any significant changes this is applicable for both Moscow and regional markets. In sustainable shopping centers, preferences in existing leases that were agreed last year are being extended (usually a discount on fixed rent or exchange rate fixation). In shopping centres that are currently under construction rent is calculated on the basis of a percentage of projected tenant turnover, however maximum(% of turnover with maximum fixed payment) or minimum limit (% of turnover, but no less than a fixed amount) is fixed in agreements. In new agreements with preferential payment structure lease period tend to be reduced from 5 to 3 years (for retail gallery operators). Percentage of turnover that is fixed in the agreements remains the same: 3-7% for anchor tenants of retail gallery, 12-15% for retail gallery operators, 10-15% for food-court operators and restaurants, 1-3% for large anchor tenants (hypermarkets). * Prime shopping mall indicator - base asking rental rate for a 100 sq m gallery unit on the ground floor of prime shopping centres. #MARKETBEAT Q CUSHMAN & WAKEFIELD RESEARCH DEPARTMENT 39

40 2016 Q1 NEW CONSTRUCTION (CLASS A AND B) RUSSIA sq m MOSCOW sq m REGIONS sq m TAKE UP (CLASS A AND B) WAREHOUSE & INDUSTRIAL In Q average rental rates have been decreased. Vacancy rate level remains stable. Demand is supported by retail chains. Large share of deals are relocations in order to improve commercial terms. Tenants are very active in lease terms renegotiation. RUSSIA sq m MOSCOW sq m FORECAST 2016 NEW CONSTRUCTION (CLASS A AND B) RUSSIA 1.30 mn sq m MOSCOW 0.83 TAKE UP (CLASS A AND B) RUSSIA 1.30 mn sq m mn sq m MOSCOW 0.85 mn sq m REGIONS sq m REGIONS 0.47 mn sq m REGIONS 0.45 mn sq m Source: Cushman & Wakefield CUSHMAN & WAKEFIELD RESEARCH DEPARTMENT 40 #MARKETBEAT Q1 2016
41 TRENDS NEW CONSTRUCTION DEMAND REGIONS TRENDS. MOSCOW REGION IN Q AVERAGE RENTAL RATE DECREASED. VACANCY RATE REMAINS STABLE The warehouse real estate segment is influenced by the situation in the consumer sector of the Russian economy sq m TAKE-UP Q High vacancy rate is a key factor influencing the warehouse market. During the past 6 months vacancy rate in Moscow remains stable at the level of 10%. Vacancy rate is not decreasing because of high construction volumes and extra warehouse space that came back to the market after space optimization by tenants. VACANCY RATE, CLASS A In order to increase occupation quickly, some landlords decreased rental rates. In Q rental rate in Moscow region dropped by 3-5% and now comprises 3,800 4,000 rub per square meter per year. Lease term is getting shorter. NET RENTAL RATE IN RUBLES (RUB/ SQ M/ YEAR) RUB / sq m / year CURRENT RENTAL RATE, EXCLUDING OPERATIONAL EXPENCES, UTILITY COSTS AND VAT 14% 12% 10% 8% 6% 4% 2% 13.5% 10.0% 10.5% 7.0% 3.9% 1.5% 2.0% 1.0%1.0% 0% F Source: Cushman & Wakefield Research F CUSHMAN & WAKEFIELD RESEARCH DEPARTMENT 41 #MARKETBEAT Q1 2016
42 '000 sq m MACROREVIEW CAPITAL MARKETS OFFICES RETAIL WAREHOUSES TRENDS NEW CONSTRUCTION DEMAND REGIONS NEW CONSTRUCTION. MOSCOW REGION NEW CONSTRUCTION VOLUME REMAINS AT THE LEVEL OF 2015 After the peak of development activity in 2014, the volume of construction decreased twice in Downward trend in activity retains in sq m NEW CONSTRUCTION, Q sq m NEW CONSTRUCTION, 2016F NEW CONSTRUCTION, CLASSES A AND B F Actual Construction Forecast In Q ,000 sq m of quality warwhouse space was delivered to the market. Developers announce 824,000 sq m of warehouse premises be delivered to the market by the end of 2016 which is the same as in Only 20% of the new space are new projects, the rest of them are new phases of existing warehouses. Vacancy rate hasn t changed in Q and is now at the level of 10%. By the end of the year we forecast vacancy rate to remain the same and to be at the level of %. Source: Cushman & Wakefield Research CUSHMAN & WAKEFIELD RESEARCH DEPARTMENT 42 #MARKETBEAT Q1 2016
43 TRENDS NEW CONSTRUCTION DEMAND REGIONS DEMAND. MOSCOW REGION TAKE UP REMAINS HIGH Demand is mostly supported by retail chains specializing in food and household goods sq m TAKE UP, Q sq m TAKE UP, 2016F TAKE UP, CLASSES A AND B, 000 sq m F Moscow Forecast Volume of lease and purchase transactions in Q exceeds the average of by 60% and comprises 218,000 sq m. Demand is supported by retail chains specializing in food and household goods. Though price of warehouse premises is now low, consumers prefer rather lease than purchase, in Q only 6% of space was purchased. Tenants benefit from low rental rates nominated in rubles and sufficient availability of vacant space they are more active in renegotiation of existing lease contracts, relocation to projects with higher quality, consolidation of warehouse space. Source: Cushman & Wakefield Research CUSHMAN & WAKEFIELD RESEARCH DEPARTMENT 43 #MARKETBEAT Q1 2016
44 TRENDS NEW CONSTRUCTION DEMAND REGIONS REGIONS NEW CONSTRUCTION DECREASES, TAKE UP REMAINS STABLE sq m TAKE-UP, Q New construction decreases in the regions. We forecast around 470,000 sq m of quality warehouse space to be constructed by the end of the year, which is 40% lower than last year. Local developers continue to construct small warehouse projects (less than 30,000 sq m). Large federal developers offer build-to-suit options on their land plots. NEW CONSTRUCTION, CLASSES A AND B, 000 sq m In Q take up exceeds the average indicator of by 10% and comprises 61,000 sq m. We forecast the volume of lease and purchase transactions to be the same as in 2015 and to comprise around 450,000 sq m. TAKE UP, CLASSES A AND B, 000 sq m sq m TAKE-UP, 2016F F Actual Construction Forecast F Regions Forecast Source: Cushman & Wakefield Research CUSHMAN & WAKEFIELD RESEARCH DEPARTMENT 44 #MARKETBEAT Q1 2016
45 TRENDS NEW CONSTRUCTION DEMAND REGIONS NEW CONSTRUCTION, MOSCOW AND REGIONS THE BIGGEST WAREHOUSE PROJECTS TO BE COMPLETED IN mn sq m NEW CONSTRUCTION, 2016F PROJECT HIGHWAY REGION Mihaylovskaya sloboda Novoryazanskaya Moscow DISTANCE FROM CITY, KM TOTAL AREA, 000 SQ M DELIVERY Q1, Q2 Logopark Sever II Leningradskoye Moscow Q2, Q3 PNK Valischevo Kashirskoye Moscow Q3, Q4 Industrial Park South Kashirskoye Moscow Gate Q4 Klin logistic park Leningradskoye Moscow Q4 A Plus Shushary Moscovskoye St. Petersburg Q2 Fright Village Vorsino Kievskoye Kaluga Q2 Aviapolis Yankovskiy Vladivostok-port Vladivostok Vostochniy Q2 A Plus Park Perm Zapadniy obhod Perm Q3 Octavian Toksovskoye St. Petersburg Q3, Q4 CUSHMAN & WAKEFIELD RESEARCH DEPARTMENT 45 #MARKETBEAT Q1 2016
46 Market indicators Standard lease terms Interactive services APPENDIX Cushman & Wakefield Research Department provides clients with the most detailed information on the market indicators, including average rental and vacancy rates split by metro stations, administrative districts and submarkets in Moscow, as well as data on planned projects and projects under construction in Russia. If you need more detailed information please contact the Research Department. #MARKETBEAT Q CUSHMAN & WAKEFIELD RESEARCH DEPARTMENT 46 #
47 APPENDIX INDICATORS STANDARD COMMERCIAL LEASE TERMS INTERACTIVE SERVICES COMMERCIAL REAL ESTATE MARKET INDICATORS (1) OFFICES AND SHOPPING CENTRES The forecast is based on the conservative macroeconomic scenario. MOSCOW REAL ESTATE MARKET INDICATORS FORECAST/ПРОГНОЗ Q1 Average annual exchange rate RUB/USD 27,1 25,6 24,9 31,8 30,4 29,4 31,1 31,9 38,6 61,3 74,9 67,4 61,7 57,1 MOSCOW OFFICES Stock class A, EOP '000 sq m Stock class B (B+ and B-), EOP '000 sq m New construction, A, '000 sq m New construction, B (B+ and B-), '000 sq m Vacancy rate class A 3,9% 4,8% 12,8% 23,6% 22,5% 16,8% 14,6% 17,6% 23,8% 31,1% 28,9% 32,9% 32,6% 31,8% Vacancy rate class B (B+ and B-) 2,7% 4,1% 6,1% 11,1% 10,4% 8,9% 9,1% 9,8% 10,8% 14,4% 16,3% 16,6% 16,9% 16,8% Take up class A, '000 sq m Take up class B (B+ and B-), '000 sq m Rental rates class A, USD/sq m pa $714 $934 $1 092 $729 $645 $733 $790 $867 $772 $549 $433 $450 $470 $500 Rental rates class B (B+ and B-), RUB/sq m pa Prime capitalization rate 8,25% 7,25% 12,00% 13,00% 9,00% 8,50% 8,75% 8,50% 11,00% 10,50% 10,50% 10,50% 10,50% 9,50% MOSCOW QUALITY SHOPPING CENTERS Total stock, EOP, '000 sq m New construction, '000 sq m Prime vacancy rate, EOP 0,7% 1,0% 3,0% 5,0% 2,1% 0,4% 0,5% 1,2% 1,5% 2,0% 2,5% 3,0% 2,5% 2,0% Prime rental rate indicator, RUB/sq m pa* (until 2016 nominated in USD, paid in RUB by offical exchange rate) Prime capitalization rate 9,50% 9,00% 12,00% 13,00% 10,00% 9,25% 9,50% 9,00% 11,00% 11,00% 11,00% 11,00% 11,00% 10,50% #MARKETBEAT Q CUSHMAN & WAKEFIELD RESEARCH DEPARTMENT 47
48 APPENDIX INDICATORS STANDARD COMMERCIAL LEASE TERMS INTERACTIVE SERVICES COMMERCIAL REAL ESTATE MARKET INDICATORS (2) WAREHOUSE AND INDUSTRIAL, INVESTMENTS The forecast is based on the conservative macroeconomic scenario. MOSCOW REAL ESTATE MARKET INDICATORS FORECAST/ПРОГНОЗ Q1 WAREHOUSES, MOSCOW REGION Stock, class A, EOP '000 sq m Stock, class B, EOP '000 sq m New construction, class A, '000 sq m New construction, class B, '000 sq m Vacancy rate class A 2,0% 2,0% 2,0% 10,5% 8,0% 1,0% 1,0% 1,5% 7,0% 10,0% 10,0% 10,5% 9,0% 8,0% Vacancy rate class B 2,0% 2,0% 2,0% 5,9% 6,1% 1,5% 1,5% 2,0% 5,0% 8,0% 8,0% 9,0% 8,0% 6,0% Net Absorption Class A, '000 sq m Net Absorption Class B, '000 sq m Rental rates class A, RUB/sq m pa Rental rates class B, RUB/sq m pa Prime capitalization rate 10,50% 9,25% 13,00% 14,00% 10,50% 10,50% 11,50% 11,00% 13,00% 12,75% 12,75% 12,75% 12,75% 12,25% INVESTMENTS TOTAL, MN US$ Office, US$ mn Retail, US$ mn Warehouse, US$ mn Other, US$ mn * Base rental rate for sq m unit on the ground floor of retail gallery of prime shopping mall for fashion retailer #MARKETBEAT Q CUSHMAN & WAKEFIELD RESEARCH DEPARTMENT 48
49 APPENDIX INDICATORS STANDARD COMMERCIAL LEASE TERMS INTERACTIVE SERVICES STANDARD COMMERCIAL LEASE TERMS LEASE TERMS DURATION OF LEASE Office: 5 years Industrial: either short-term (1-3 years) or long-term (5+ years) Retail: 3-5 years, anchor tenants years. BREAK OPTIONS Offices: Possible after 3 years with deposit withdrawal as penalty. After crises has become very popular. Notice period is 6-9 months. When there is an option to review the rent after the third year, contract can be terminated from both sides. Retail: a standard lease agreement is not supposed to include break option. RENTAL PAYMENTS RENT PAYMENT AND FREQUENCY Offices and retail: RUB or US$ per square meter per year, payable due monthly or quarterly in advance. Industrial: Rubles. RENT DEPOSIT Offices: 1-3 months rent equivalent (bank guarantee optional, very seldom however). Retail: 1-2 months rent equivalent (bank guarantee optional). Industrial: 1-3 months rent equivalent (bank guarantee optional, very seldom however as landlords as landlords prefer the deposit) RENT REVIEWS After crises have become more popular, negotiable. INDEXATION Offices: 7-10% for RUB agreements; 3-5% or at the level of USA / EU CPI. Retail: if rents in US$ US CPI or 5%; if rents are in RUB Russia CPI or 8-9%. Industrial: 8-10% ENTRANCE FEE It is possible to pay extra-fee to enter the project applicable only for prime projects. Turnover rents (only in Retail): Compound rental rates (fixed rent and a percentage of turnover) are almost always used in shopping centers. Normally, the percentage of turnover varies between 10 %- 15% (fashion), 2-5% for anchors. DISPOSAL OF LEASES ASSIGNMENT AND SUB-LETTING Offices & Industrial: Usually possible, but subject to negotiation. Retail: Not common. SERVICE CHARGES, REPAIRS & INSURANCE REPAIRS Tenant: Internal repairs and maintenance. Landlord: Structural repairs, common areas. INSURANCE Tenant: Contents insurance. Landlord: Building insurance which is normally charged back to tenant via the service charge. SERVICE CHARGES Service charge is payable by the tenant at either an open book basis or as a fixed cost. UTILITY EXPENSES Often included to service charges, but depends on landlord and different types of projects. TAXATION REAL ESTATE TAX Tenant: None. Landlord: For office and industrial the amount of tax depends on the region. In Moscow: 1.2% of cadastral value in 2015, 1.3% in 2016, 1.4% in 2017 and 1.5% in VAT: 18% MEASUREMENT PRACTICE Space is measured generally on the BOMA system. Some Landlords have apply BTI (Bureau of Technical Inventory) measurements. #MARKETBEAT Q CUSHMAN & WAKEFIELD RESEARCH DEPARTMENT 49


50 APPENDIX INDICATORS STANDARD COMMERCIAL LEASE TERMS INTERACTIVE SERVICES CUSHMAN & WAKEFIELD IN RUSSIA CUSHMAN & WAKEFIELD MOBILE APPS CUSHMAN AND WAKEFIELD The only commercial real estate app in Russia C&W INTERACTIVE MAPS Commercial real estate and infrastructure interactive maps Moscow offices Shopping centers in Russia Warehouses Hotels Infrastructure development #MARKETBEAT Q CUSHMAN & WAKEFIELD RESEARCH DEPARTMENT 50
51 OUR TEAM RESEARCH DEPARTMENT CUSHMAN & WAKEFIELD IN RUSSIA RESEARCH DEPARTMENT CUSHMAN & WAKEFIELD, RUSSIA DENIS SOKOLOV Partner, Head of Research TATYANA DIVINA Associate Director, Deputy Head of Research For more information and contacts please visit CWRUSSIA.RU ALEXANDER KUNTSEVICH Senior Analyst YULIA BOGOMOL Associate Director EVGENIYA SAFONOVA Junior analyst ANDREY VLADIMIRSKY Analyst The information provided in this report is intended for informational purposes only and should not be relied on by any party without further independent verification. Classifications of individual buildings are reviewed on a continuing basis and are subject to change. The standards used in this process are consistent with those used by Moscow Research Forum and in the United States by the Society of Industrial and Office Realtors (SIOR) and BOMA International. Reproduction of this report in whole or part is permitted only with written consent of Cushman & Wakefield. Data from this report may be cited with proper acknowledgment given. #MARKETBEAT Q CUSHMAN & WAKEFIELD RESEARCH DEPARTMENT 51

52 OUR TEAM RESEARCH DEPARTMENT CUSHMAN & WAKEFIELD IN RUSSIA СUSHMAN & WAKEFIELD, RUSSIA Cushman & Wakefield is a global leader in commercial real estate services, helping clients transform the way people work, shop, and live. The firm s 43,000 employees in more than 60 countries provide deep local and global insights that create significant value for occupiers and investors around the world. Cushman & Wakefield is among the largest commercial real estate services firms with revenues of $5 billion across core services of agency leasing, asset services, capital markets, facility services (branded C&W Services), global occupier services, investment management (branded DTZ Investors), project & development services, tenant representation and valuation & advisory. #MARKETBEAT Q CUSHMAN & WAKEFIELD RESEARCH DEPARTMENT 52 #
COMMERCIAL REAL ESTATE RUSSIA # MARKETBEAT MOSCOW RAIL RING A MAJOR DEVELOPMENT FOR THE REAL ESTATE MARKET. Cushman & Wakefield Research Q3 2016
 MOSCOW RAIL RING A MAJOR DEVELOPMENT FOR THE REAL ESTATE MARKET COMMERCIAL REAL ESTATE RUSSIA # MARKETBEAT Cushman & Wakefield Research Q3 2016 03 14 42 47 CONTENTS SECTION 1 OUTLOOK SECTION 2 COMMERCIAL
COMMERCIAL REAL ESTATE RUSSIA # MARKETBEAT. Cushman & Wakefield Research Q4 2016
 COMMERCIAL REAL ESTATE RUSSIA # MARKETBEAT Cushman & Wakefield Research Q4 2016 CONTENTS 03 14 47 52 SECTION 1 OUTLOOK SECTION 2 COMMERCIAL REAL ESTATE SECTION 3 APPENDIX SECTION 4 OUR TEAM Major economic
CITY MARKET 29% 11% 12% 27% 63% 28% $15,000 $21,630 $15, sq m < $2 million KEY INDICATORS SUPPLY AND DEMAND DYNAMICS
 Property in numbers MOSCOW 214 CITY MARKET SUPPLY AND DEMAND DYNAMICS Supply Apartments share, % The average price on the new-builds market, $/sq m The number of transactions per month * Total supply (flats
COMMERCIAL REAL ESTATE RUSSIA # MARKETBEAT. Cushman & Wakefield Research Q3 2015
 COMMERCIAL REAL ESTATE RUSSIA # MARKETBEAT Cushman & Wakefield Research Q3 2015 02 03 44 50 CONTENTS SECTION 1 OUTLOOK SECTION 2 ANALYTICS SECTION 3 APPENDIX SECTION 4 OUR TEAM Major economic trends of
COMMERCIAL REAL ESTATE RUSSIA #MARKETBEAT. Cushman & Wakefield Research Q2 2017
 COMMERCIAL REAL ESTATE RUSSIA #MARKETBEAT Cushman & Wakefield Research Q2 2017 CONTENTS 03 13 48 53 SECTION 1 OUTLOOK SECTION 2 COMMERCIAL REAL ESTATE SECTION 3 APPENDIX SECTION 4 OUR TEAM Major economic
COMMERCIAL REAL ESTATE RUSSIA # MARKETBEAT. Cushman & Wakefield Research Q4 2015
 COMMERCIAL REAL ESTATE RUSSIA # MARKETBEAT Cushman & Wakefield Research Q4 2015 03 19 57 62 CONTENTS SECTION 1 OUTLOOK SECTION 2 COMMERCIAL REAL ESTATE SECTION 3 APPENDIX SECTION 4 OUR TEAM Major economic
WAREHOUSE MARKET REPORT
 H1 2017 WAREHOUSE MARKET REPORT HIGHLIGHTS The total warehouse stock delivered in H1 2017 fell by one half to 135,500 sq m year on year. The Q2 vacancy rate came up to 11.7% about 1.5 million sq m in absolute
Moscow s retail and entertainment real estate market, Q3 of 2009
 Moscow s retail and entertainment real estate market, Q3 of 2009 1 Moscow s retail and entertainment real estate market, Q3 of 2009 Retail Real Estate Market Table 1. Major indicators of Moscow s retail
Key Market Indicators. Supply. Demand
 milliom sq m thousand sq m number of objects Key Market Indicators Total stock 17.2 million sq m Completion 74,6 sq m Vacancy rate 11.2% Take-up 423, sq m Rental rates in Class A* $44/sq m/year, in Class
O KEY GROUP TRADING UPDATE Q3 AND 9M November, 2018
 O KEY GROUP TRADING UPDATE Q3 AND 9M 2018 13 November, 2018 Disclaimer 2 By attending the meeting where this presentation is made, or by reading the presentation slides, you agree to be bound by the following
report Moscow Q Vacancy rate has reached the level of 22.5% in Class A and 17.6% in Class B office buildings in sum indicating 2.9 million sq m.
 Research Q1 Office market report Moscow Highlights In Q1 new delivery volume has decreased to historically low level of 63 thousand sq m. Vacancy rate has reached the level of 22.5% in Class A and 17.6%
Economy. Denmark Market Report Q Weak economic growth. Annual real GDP growth
 Denmark Market Report Q 1 Economy Weak economic growth In 13, the economic growth in Denmark ended with a modest growth of. % after a weak fourth quarter with a decrease in the activity. So Denmark is
Moscow Industrial Big Box MarketView H1 2013
 Moscow Industrial Big Box MarketView H1 213 CBRE Global Research and Consulting NEW SUPPLY 137,22 SQ M PRIME RENTAL RATES $14 / SQ M / YEAR VACANCY 1,6% HOT TOPICS More than 7, sq m of class A warehouses
Office market report Moscow
 Research Q1 215 Office market report Moscow Highlights Delivery volume of quality office space in Q1 215 was 91 thousand sq m that is 6% drop compared to the previous indicator. Share of lease renegotiations
RESEARCH AND CONSULTING DEPARTMENT. August 2011 REAL ESTATE MARKET MONITORING
 RESEARCH AND CONSULTING DEPARTMENT August 2011 REAL ESTATE MARKET MONITORING August 2011 Content 1. Residential real estate market...... 3 2. Office market....... 5 3. Retail market.... 7 4. Hotels market.......
Moscow Warehouse Market
 Moscow Warehouse Market Q3 2015 Market saw a record surge in demand for warehouse space over Q3 2015 The volumes of take-up over the first nine months exceeded 1m sq m (+76% YoY) As a result, the vacancy
Moscow office market overview
 office market overview 211 The recovery of the office market continued in 211. completion volume was 198,8 sq m. Several large deals were signed. Prime rents reached USD 1, per sq m per year, a 11% growth
The Real Estate and Land Market of Russia: Factors of the Sustainable Development
 The Real Estate and Land Market of Russia: Factors of the Sustainable Development Vasily Nilipovskiy (State University of Land Use Planning, Moscow, Russia) ? &! and! &? There is no definite answer in
Real Estate Market Study
 Real Estate Market Study 2012 Dear Clients and Friends, We would like to thank you for your trust over the past 2 years for working with our team. 2012 was a crucial year for our company s development.
Retail Market. Research H Moscow
 Research H1 216 Retail Market report Moscow Highlights The total leasable area of shopping facilities opened in Q2 216 amounted to 22.4 thousand sq m (GBA 482 thousand sq m). This is the maximum Q2 value
RETAIL MARKET REPORT RESEARCH H Moscow HIGHLIGHTS
 RESEARCH H1 218 RETAIL MARKET REPORT Moscow HIGHLIGHTS Based on results of the first half of 218 in Moscow three shopping centres were commissioned with total leasable area of 97,5 sq m. The dynamics of
ECONOMIC CURRENTS. Vol. 3, Issue 1. THE SOUTH FLORIDA ECONOMIC QUARTERLY Introduction
 ECONOMIC CURRENTS THE SOUTH FLORIDA ECONOMIC QUARTERLY Introduction Economic Currents provides an overview of the South Florida regional economy. The report contains current employment, economic and real
MARKET OUTLOOK MOSCOW & SAINT PETERSBURG
 MARKET OUTLOOK MOSCOW & SAINT PETERSBURG Asset management department March 207 The results of Q 207 MARKET STATE : The key rate has decreased to 0% from 9,75% (from 27 march 207). For the period Jan-Feb
Office Market Report Moscow. May Supply. Increase in supply. at the end of May Increase in supply
 Office Market Report Moscow. May 2015 Supply In May, 2015, the overall market for quality office space in Moscow reached 17.9m sqm and amounted to 3.8m sqm (21%) of Class A offices and 14.0m sqm (79%)
3 November rd QUARTER FNB SEGMENT HOUSE PRICE REVIEW. Affordability of housing
 3 November 2011 3 rd QUARTER FNB SEGMENT HOUSE PRICE REVIEW JOHN LOOS: HOUSEHOLD AND PROPERTY SECTOR STRATEGIST 011-6490125 John.loos@fnb.co.za EWALD KELLERMAN: PROPERTY MARKET ANALYST 011-6320021 ekellerman@fnb.co.za
KTI St. Petersburg Property Barometer: Real estate market professionals concluded the year 2011
 KTI St. Petersburg Property Barometer: Real estate market professionals concluded the year 2011 KTI Finland continues to study the professionals opinions on the development of the St. Petersburg property
UDIA WA PROPERTY MARKET STATISTICS
 UDIA WA PROPERTY MARKET STATISTICS OCTOBER 217 1 IN THIS ISSUE KEY TRENDS INDUSTRY UPDATE 3 4 ECONOMY RESIDENTIAL LAND DEVELOPMENT RESIDENTIAL PROPERTY SETTLEMENTS RESIDENTIAL PROPERTY MARKET RESIDENTIAL
ECONOMIC CURRENTS. Vol. 3, Issue 3 SOUTH FLORIDA ECONOMIC QUARTERLY. Introduction
 ECONOMIC CURRENTS THE Introduction SOUTH FLORIDA ECONOMIC QUARTERLY Economic Currents provides an overview of the South Florida regional economy. The report presents current employment, economic and real
1 February FNB House Price Index - Real and Nominal Growth
 1 February 2017 MARKET ANALYTICS AND SCENARIO FORECASTING UNIT JOHN LOOS: HOUSEHOLD AND PROPERTY SECTOR STRATEGIST 087-328 0151 john.loos@fnb.co.za THEO SWANEPOEL: PROPERTY MARKET ANALYST 087-328 0157
INLAND EMPIRE REGIONAL INTELLIGENCE REPORT
 INLAND EMPIRE REGIONAL INTELLIGENCE REPORT June 2016 EMPLOYMENT After a slow start to 2016, the Inland Empire s labor market returned to form, in recent job figures. Seasonally adjusted nonfarm employment
Property. Mashreq. Economic Overview. Wealth Gauge
 Wealth Gauge Volume 23 November 2015 Economic Overview In spite of the dip in Global Oil prices the GDP for 2015 grew at 3.5. The UAE economic growth is expected to slow down and grow at 2.9 in 2016 driven
BRISBANE HOUSING MARKET STUDY
 BRISBANE HOUSING MARKET 2018 STUDY Executive Summary Brisbane s residential market, especially the detached houses segment has risen steadily over the last year due to the rise in population, falling unemployment
UDIA WA PROPERTY MARKET STATISTICS
 UDIA WA PROPERTY MARKET STATISTICS APRIL 218 1 IN THIS ISSUE KEY TRENDS INDUSTRY UPDATE ECONOMY RESIDENTIAL LAND DEVELOPMENT RESIDENTIAL PROPERTY SETTLEMENTS RESIDENTIAL PROPERTY MARKET RESIDENTIAL CONSTRUCTION
Residential Commentary Sydney Apartment Market
 Residential Commentary Sydney Apartment Market April 2017 Executive Summary Sydney Apartment Market: Key Indicators 14,200 units are currently under construction in Inner Sydney with completion expected
Economic Forecast of the Construction Sector
 Economic Forecast of the Construction Sector March 2018 Economic Forecast of the Construction Sector Page 2/8 Introduction This economic forecast of the construction sector focuses on 2018 and 2019. The
Brokers Forum Report
 Brokers Forum Report March 24, 2015 Forecast for April 2015 September 2015 The Center for Real Estate Theory and Practice 1 ASU Commercial Brokers Forum Survey Forecast for April 2015 September 2015 "Without
CONTENTS. Executive Summary 1. Southern Nevada Economic Situation 2 Household Sector 5 Tourism & Hospitality Industry
 CONTENTS Executive Summary 1 Southern Nevada Economic Situation 2 Household Sector 5 Tourism & Hospitality Industry Residential Trends 7 Existing Home Sales 11 Property Management Market 12 Foreclosure
San Francisco Bay Area to Napa County Housing and Economic Outlook
 San Francisco Bay Area to 019 Napa County Housing and Economic Outlook Bay Area Economic Forecast Summary Presented by Pacific Union International, Inc. and John Burns Real Estate Consulting, LLC On Nov.
August 2012 Design by Anderson Norton Design
 August 2012 Design by Anderson Norton Design 020 7336 6992 Property Data Report 2012 Introduction 1 Commercial property by comparison UK commercial property s value in 2011 reached 717 billion, helped
For the Reno MSA employment has historically been based largely on construction and the leisure and hospitality industry. The construction industry
 For the Reno MSA employment has historically been based largely on construction and the leisure and hospitality industry. The construction industry has lost almost 15,000 construction jobs since 2006,
Office market review MOSCOW OFFICE Q Supply. Key market figures. Completions, thousand m² of GLA. Largest buildings completed in Q3 2015
 MOSCOW OFFICE 25 Office market review Supply The total supply of high-quality business centers in Moscow has reached 6.4 million m² in 25. Since the beginning of 25, the volume of the existing premises
PROPERTY BAROMETER Residential Property Affordability Review The recently improving Housing Affordability trend stalled in the 1 st quarter of 2017
 21 June 2017 MARKET ANALYTICS AND SCENARIO FORECASTING UNIT JOHN LOOS: HOUSEHOLD AND PROPERTY SECTOR STRATEGIST FNB HOME LOANS 087-328 0151 john.loos@fnb.co.za LIZE ERASMUS: STATISTICIAN 087-335 6664 lize.erasmus@@fnb.co.za
16 April 2018 KEY POINTS
 16 April 2018 MARKET ANALYTICS AND SCENARIO FORECASTING UNIT JOHN LOOS: HOUSEHOLD AND PROPERTY SECTOR STRATEGIST FNB HOME LOANS 087-328 0151 john.loos@fnb.co.za THULANI LUVUNO: STATISTICIAN 087-730 2254
The State of the U.S. & Washington CRE Market: 2008 Review/2009 Outlook
 The State of the U.S. & Washington CRE Market: 2008 Review/2009 Outlook Copyright 2008 CoStar Group, Inc. All Rights Reserved. Although CoStar makes efforts to ensure the accuracy and reliability of the
Las Vegas Valley Executive Summary
 ARROYO MARKET SQUARE Las Vegas Valley Executive Summary Retail Market 4th Quarter 2013 THE DISTRICT AT GREEN VALLEY RANCH January 23, 2014 Re: Commercial Real Estate Survey: 4th Quarter, 2013 Dear Reader,
Summary. Houston. Dallas. The Take Away
 Page Summary The Take Away The first quarter of 2017 was marked by continued optimism through multiple Texas metros as job growth remained positive and any negatives associated with declining oil prices
2016 Russia Commercial real estate
 216 Russia Commercial real estate Market Overview H1 216 H1 216 Research & Forecast Report Investment market Key results of H1 216 By the end of H1 216, key macroeconomic indicators were showing a certain
OFFICE MARKET ANALYSIS:
 OFFICE MARKET ANALYSIS: DAVID WEST RMLS Fellow Certificate of Real Estate Development Student Masters of Urban and Regional Planning Candidate While the Portland office market continues the slow recovery
REAL ESTATE SENTIMENT INDEX 2 nd Quarter 2018
 About Real Estate Sentiment Index (RESI) The Real Estate Sentiment Index (RESI) is jointly developed by the Real Estate Developers Association of Singapore (REDAS) and the Department of Real Estate (DRE),
November 2009 REAL ESTATE MARKET MONITORING
 November 2009 REAL ESTATE MARKET MONITORING November 2009 Content 1. Residential real estate market...... 3 2. Office market....... 5 3. Retail market.... 7 4. Hotels market....... 9 5. Countryside real
2018 Greater Toronto Area Economic Outlook
 2018 Greater Toronto Area Economic Outlook 1 HIGHLIGHTS Although the Canadian economy performed exceptionally well in the first half of, posting GDP growth of approximately 4.0%, it has slowed since then
Estimating National Levels of Home Improvement and Repair Spending by Rental Property Owners
 Joint Center for Housing Studies Harvard University Estimating National Levels of Home Improvement and Repair Spending by Rental Property Owners Abbe Will October 2010 N10-2 2010 by Abbe Will. All rights
DUBAI HOUSING MARKET STUDY 2017
 DUBAI HOUSING MARKET STUDY 217 Executive Summary Dubai residential market has been a story of increased supply and unsold stock resulting in declining prices over the last three years. Soft price corrections
Time for Retail to Take Stock
 Q1 2013 RETAIL LAS VEGAS NEVADA RESEARCH & FORECAST REPORT Time for Retail to Take Stock It is heartening to say, after five years of a bad economy, that the first quarter of 2013 s 119,649 square feet
Linkages Between Chinese and Indian Economies and American Real Estate Markets
 Linkages Between Chinese and Indian Economies and American Real Estate Markets Like everything else, the real estate market is affected by global forces. ANTHONY DOWNS IN THE 2004 presidential campaign,
San Francisco Bay Area to Marin, San Francisco, and San Mateo Counties Housing and Economic Outlook
 San Francisco Bay Area to 019 Marin, San Francisco, and San Mateo Counties Housing and Economic Outlook Bay Area Economic Forecast Summary Presented by Pacific Union International, Inc. and John Burns
Sistema s Real Estate Assets Creation of Value
 Sistema s Real Estate Assets Creation of Value Moscow, March 2017 SISTEMA: LEVERAGING OPPORTUNITIES FOR VALUE CREATION IN REAL ESTATE STRATEGY Investment and industry expertise Selection of projects with
Economy. Office Q3 2018
 Economy In the third quarter of 2018, the electoral race caused strong oscillations in the dollar market and in the stock exchange. Specialists believe that once the political result is decided, these
Market Commentary Perth CBD Office
 Market Commentary Perth CBD Office November 2016 Executive Summary The vacancy rate at 3Q16 is 24.7%, reflecting a quarterly increase of 0.1 percentage points. Two office projects are under construction
RESEARCH BRIEF TURKISH HOUSING MARKET: PRICE BUBBLE SEPTEMBER 2014 SUMMARY. A Cushman & Wakefield Research Publication OVERVIEW
 RESEARCH BRIEF TURKISH HOUSING MARKET: PRICE BUBBLE SEPTEMBER 2014 SUMMARY OVERVIEW Debates on the existence of a price bubble in the Turkish housing market have continued after numerous news releases
Luxury Residences Report First Half 2017
 Luxury Residences Report First Half 2017 YEAR XIV n. 1 October 2017 1 Luxury Residences Report: First Half 2017 Introduction Introduction and methodology 2 Luxury Residences Report: First Half 2017 Introduction
Economic and Market Outlook: SAN ANTONIO OFFICE Q1 2016
 Economic and Market Outlook: HOUSTON SAN ANTONIO AUSTIN Table 1. Key market indicators for Q1 2016, and their percent (%) change on a quarter-over-quarter (QoQ) and year-over-year (YoY) basis (Class A
Housing and Property Market in Lithuania
 Housing and Property Market in Lithuania Kestutis SABALIAUSKAS, Lithuania Key words: real property, housing market, housing loans, credit market, Lithuania. SUMMARY The real property market in Lithuania
Has The Office Market Reached A Peak? Vacancy. Rental Rate. Net Absorption. Construction. *Projected $3.65 $3.50 $3.35 $3.20 $3.05 $2.90 $2.
 Research & Forecast Report OAKLAND METROPOLITAN AREA OFFICE Q1 Has The Office Market Reached A Peak? > > Vacancy remained low at 5. > > Net Absorption was positive 8,399 in the first quarter > > Gross
RESEARCH AND CONSULTING DEPARTMENT. November 2011 REAL ESTATE MARKET MONITORING
 RESEARCH AND CONSULTING DEPARTMENT November 2011 REAL ESTATE MARKET MONITORING November 2011 Content 1. Residential real estate market...... 3 2. Office market....... 5 3. Retail market.... 7 4. Hotels
INVESTOR PRESENTATION. September 2011
 INVESTOR PRESENTATION September 2011 Disclaimer This document does not constitute or form part of and should not be construed as, an offer to sell or issue or the solicitation of an offer to buy or acquire
Market Insights & Strategy Global Markets
 Market Insights & Strategy Global Markets UAE Real Estate Review 2016 Q2 Please find below a quick snapshot of the key topics covered in this note: Pricing trends - Sales In June 2016, monthly average
ECONOMIC CURRENTS. Vol. 5 Issue 2 SOUTH FLORIDA ECONOMIC QUARTERLY. Key Findings, 2 nd Quarter, 2015
 ECONOMIC CURRENTS THE Introduction SOUTH FLORIDA ECONOMIC QUARTERLY Economic Currents provides an overview of the South Florida regional economy. The report presents current employment, economic and real
1 June FNB House Price Index - Real and Nominal Growth MAY FNB HOUSE PRICE INDEX FINDINGS
 1 June 2016 MARKET ANALYTICS AND SCENARIO FORECASTING UNIT JOHN LOOS: HOUSEHOLD AND PROPERTY SECTOR STRATEGIST 087-328 0151 john.loos@fnb.co.za THEO SWANEPOEL: PROPERTY MARKET ANALYST 087-328 0157 tswanepoel@fnb.co.za
Briefing Office and retail
 Savills China Research Dalian Briefing Office and retail August 218 Image: Labor Park, Qingniwa Area, Zhongshan District SUMMARY A lack of new supply saw rents and occupancy rates in both the Grade A office
CZECH REPUBLIC RESEARCH & FORECAST REPORT Q Accelerating success.
 CZECH REPUBLIC RESEARCH & FORECAST REPORT Accelerating success. RESEARCH & FORECAST REPORT CZECH REPUBLIC PRAGUE OFFICE PROPERTY MARKET SUPPLY METRIC KEY OFFICE FIGURES MEASURE Total Stock 2,773,296 m
The Seattle MD Apartment Market Report
 The Seattle MD Apartment Market Report Volume 16 Issue 2, December 2016 The Nation s Crane Capital Seattle continues to experience an apartment boom which requires constant construction of new units. At
Nothing Draws a Crowd Like a Crowd: The Outlook for Home Sales
 APRIL 2018 Nothing Draws a Crowd Like a Crowd: The Outlook for Home Sales The U.S. economy posted strong growth with fourth quarter 2017 Real Gross Domestic Product (real GDP) growth revised upwards to
MARKET IN A MINUTE A SUMMARY OF MARKET CONDITIONS FOR MARCH & 1st QUARTER 2016
 STATPAK ` WASHINGTON, DC APRIL 2016 MARKET IN A MINUTE A SUMMARY OF MARKET CONDITIONS FOR MARCH & 1st QUARTER 2016 Contract activity in March 2016 was up 12.6% from March of 2015, and there were increases
A Window Into the World of Condo Investors
 April 06, 2018 A Window Into the World of Condo by Shaun Hildebrand and Benjamin Tal (CIBC*) If you want to understand the GTA housing market, you have to get into the heads of condo investors. While the
ECONOMIC CURRENTS. Vol. 4, Issue 3. THE Introduction SOUTH FLORIDA ECONOMIC QUARTERLY
 ECONOMIC CURRENTS THE Introduction SOUTH FLORIDA ECONOMIC QUARTERLY Vol. 4, Issue 3 Economic Currents provides an overview of the South Florida regional economy. The report presents current employment,
Construction Investment Cools In Lead Up To General Election
 Phnom Penh, Q2 218 Construction Investment Cools In Lead Up To General Election Average High-end Condominium Price $3,211/SQM Prime Condominium Rent $14.3/SQM Prime Office Rent $25.5/SQM Prime Retail Mall
STATPAK MARKET IN A MINUTE A SUMMARY OF MARKET CONDITIONS FOR AUGUST McEnearney.com CONTRACTS URGENCY INDEX INVENTORY INTEREST RATES
 STATPAK WASHINGTON, DC SEPTEMBER 2017 McEnearney.com MARKET IN A MINUTE A SUMMARY OF MARKET CONDITIONS FOR AUGUST 2017 Contract activity in August 2017 was up 4.9% from August 2016, and there were increases
Oman Real Estate Conference th May 2015
 Oman Real Estate Conference 2015 11 th May 2015 1 Contents 1. Global Real Estate Overview 2. MENA Real Estate Overview 3. Oman s Market Overview 4. Market 5. Market 6. Hospitality Market 7. Market Global
Q Dubai Real Estate Market Overview
 Q2 2015 Dubai Real Estate Market Overview Dubai Market Summary Dubai s real estate market saw little change in the second quarter, with the slowdown in performance across all asset classes continuing,
Riga office centre overview
 Riga office centre overview Latvia 2009 Economy 2009 economic situation in Latvia is best summarized in a recent Economist online article Like many small countries, Latvia has struggled to attract outsiders
Housing Bulletin Monthly Report
 February 21 1 Housing Bulletin Monthly Report Housing Starts 25, 2, 15, 1, 5, Alberta Housing Starts up 5 per cent from 29 From February 29 to 21, preliminary housing starts increased 82.7 per cent across
Cycle Monitor Real Estate Market Cycles Third Quarter 2017 Analysis
 Cycle Monitor Real Estate Market Cycles Third Quarter 2017 Analysis Real Estate Physical Market Cycle Analysis of Five Property Types in 54 Metropolitan Statistical Areas (MSAs). Income-producing real
MONTGOMERY COUNTY APRIL 2018
 STATPAK MONTGOMERY COUNTY APRIL 2018 McEnearney.com MARKET IN A MINUTE A SUMMARY OF MARKET CONDITIONS FOR MARCH 2018 Contract activity in March 2018 was down 6.0% from March 2017, and there were decreases
Housing Markets: Balancing Risks and Rewards
 Housing Markets: Balancing Risks and Rewards October 14, 2015 Hites Ahir and Prakash Loungani International Monetary Fund Presentation to the International Housing Association VIEWS EXPRESSED ARE THOSE
CONTENTS. Executive Summary. Southern Nevada Economic Situation 1 Household Sector 4 Tourism & Hospitality Industry
 CONTENTS Executive Summary Southern Nevada Economic Situation 1 Household Sector 4 Tourism & Hospitality Industry Residential Trends 6 Existing Home Sales 10 Property Management Market 11 Foreclosure Situation
FY General Revenue Forecast Presentation
 FY 2015-2019 General Revenue Forecast Presentation Steven A. Solomon Director of Finance February 18, 2014 Overview Current Economic Outlook National State Local FY 2014 2nd Quarter Revenue Update Five
2013 Arizona Housing Market Mid-Year Report
 2013 Arizona Housing Market Mid-Year Report This mid-year market report outlines the latest trends in Arizona real estate. The housing market hit bottom in mid to late 2011, and has been in recovery mode
UDIA WA PROPERTY MARKET STATISTICS
 UDIA WA PROPERTY MARKET STATISTICS AUGUST 217 1 What s new in strata? Learn how community title schemes and leasehold strata are changing the strata game. Visit landgate.wa.gov.au/strata-reform Subscribe
State of the Nation s Housing 2008: A Preview
 State of the Nation s Housing 28: A Preview Eric S. Belsky Remodeling Futures Conference April 15, 28 www.jchs.harvard.edu The Housing Market Has Suffered Steep Declines Percent Change Median Existing
Housing Price Forecasts. Illinois and Chicago PMSA, March 2018
 Housing Price Forecasts Illinois and Chicago PMSA, March 2018 Presented To Illinois Realtors From R E A L Regional Economics Applications Laboratory, Institute of Government and Public Affairs University
An Assessment of Recent Increases of House Prices in Austria through the Lens of Fundamentals
 An Assessment of Recent Increases of House Prices in Austria 1 Introduction Martin Schneider Oesterreichische Nationalbank The housing sector is one of the most important sectors of an economy. Since residential
Luxury Residences Report 2nd Half 2016
 Luxury Residences Report 2nd Half 2016 YEAR XIII No. 2 March 2017 1 Luxury Residences Report 2 nd Half 2016 Introduction Introduction and methodology 2 Luxury Residences Report 2 nd Half 2016 Introduction
DEVELOPMENT OF THE DWELLING CONSTRUCTION AND REAL ESTATE MARKET DURING THE LAST DECADE
 DEVELOPMENT OF THE DWELLING CONSTRUCTION AND REAL ESTATE MARKET DURING THE LAST DECADE Olga Smirnova, Merike Sinisaar Statistics Estonia Construction and real estate are the fields of activity many people
Housing Price Forecasts. Illinois and Chicago PMSA, April 2018
 Housing Price Forecasts Illinois and Chicago PMSA, April 2018 Presented To Illinois Realtors From R E A L Regional Economics Applications Laboratory, Institute of Government and Public Affairs University
Volume II Edition I Why This is a Once in a Lifetime Opportunity for Investors
 www.arizonaforcanadians.com Volume II Edition I Why This is a Once in a Lifetime Opportunity for Investors In This Edition How to make great investment returns in a soft market U.S. Financing for Canadians
NATIONAL ASSOCIATION of REALTORS RESEARCH DIVISION. Prepared for Florida REALTORS
 NATIONAL ASSOCIATION of REALTORS RESEARCH DIVISION Prepared for Florida REALTORS NATIONAL ASSOCIATION OF REALTORS RESEARCH DIVISION Page 1 Page 3 Page 4 Page 6 Page 7 Page 8 Page 9 Page 10 Page 11 Page
ASIA PACIFIC OFFICE OVERVIEW April - June 2017
 ASIA PACIFIC OFFICE OVERVIEW April - June A CUSHMAN & WAKEFIELD QUARTERLY RESEARCH PUBLICATION INSIGHTS INTO ACTION ASIA PACIFIC OFFICE OVERVIEW OCCUPIER CONDITIONS INDIA Delhi-NCR GREATER CHINA Chongqing
Economy. Industrial Q3 2018
 Economy In the third quarter of 2018, the electoral race caused strong oscillations in the dollar market and in the stock exchange. Specialists believe that once the political result is decided, these
Market Commentary Brisbane CBD Office
 Market Commentary Brisbane CBD Office May 2016 Executive Summary There was a relatively soft start to the year for the CBD office leasing market with net absorption of 2,614 sqm recorded in 1Q16. Just