Citi Global Property CEO Conference March 2016
|
|
|
- Stuart Kelley
- 6 years ago
- Views:
Transcription

1 Citi Global Property CEO Conference March
2 Table of Contents Company Overview 3 6 Multifamily Fundamentals 7 11 Camden s Portfolio Real Estate Transactions Capital Structure & Liquidity Summary Appendix Guidance Non-GAAP Financial Measures Definitions & Reconciliations Forward-Looking Statements 2
3 Company Overview 3
 Net Asset Value (NAV) per Share (2) - $88 Total Market Capitalization - $10 billion Nearly 60,000 apartment homes located in 15 major markets across the U.S. (1) Based on closing share price of $79.")
4 About Camden Publicly traded since 1993 S&P 400 Company Current dividend yield - 3.8% (1) Net Asset Value (NAV) per Share (2) - $88 Total Market Capitalization - $10 billion Nearly 60,000 apartment homes located in 15 major markets across the U.S. (1) Based on closing share price of $79.19 on 3/11/16 (2) Average NAV per covering analysts 4
5 Camden s Strategy Operate in high growth markets Maximize portfolio cash flow growth Recycle capital through acquisitions and dispositions Create value through development and redevelopment Maintain strong balance sheet with low leverage 5
6 Earnings & Dividend Growth Funds from Operations ( FFO ) per Share $5.00 $4.00 $3.00 $2.00 $ * Dividends per Share $5.00 $4.00 $3.00 $2.00 $ * * 2016 Guidance provided 1/28/16 6
7 Multifamily Fundamentals 7
8 Outlook for Multifamily Industry Same property net operating income ( NOI ) projected above long-term trend for next several years Strong demand from: o o o o Growing Echo Boom population with high propensity to rent Large share of jobs going to the age cohort Pent-up demand from young adults living at home or with roommates Homeownership rate declining steadily and negative sentiment toward home ownership New supply still being met by strong demand Echo Boom Population Aged (millions) Favorable Demographics Trends* Over 60% of this age group choose to rent Year-Year Change in Employment (000) Young Adults Steadily Finding Employment* Annual Change in U.S. Population Aged (millions) Pent-Up Demand From Young Adults Living At Home* Annual Change in Population Potential Pent-Up Moveouts from Home 2014: 1.3M more young adults than Estimated usual living Home with parents Move-Backs *Source: Witten Advisors data through February
9 Negative Sentiment Toward Home Ownership Many people choosing to rent rather than buy Moveout rates from apartment residents purchasing homes remain low (23% at peak vs. 14% in 2015 for Camden s portfolio) Strong credit scores and significant down payments required by mortgage lenders Young adults carrying significant amount of student debt Homeownership Rate Share of U.S. Households Who Own Home 70% 68% 66% 64% 62% 1Q90 1Q91 1Q92 1Q93 1Q94 1Q95 1Q96 1Q97 1Q98 1Q99 1Q00 1Q01 1Q02 1Q03 1Q04 1Q05 1Q06 1Q07 1Q08 1Q09 1Q10 1Q11 1Q12 1Q13 1Q14 1Q15 4Q15* 63.7% *Source: Witten Advisors seasonally adjusted homeownership rate 9
10 Manageable Levels of Supply Multifamily starts expected to peak in 2016 then begin to decline Rising construction costs and interest rates make future development starts more challenging Single family rentals don t compete with well-located, amenity-rich apartment homes 5+ Rental Starts, trailing 12 months 400, , , , , , ,000 50,000 0 Actual Starts Projected Deficit of 450,000 starts from Q92 1Q93 1Q94 1Q95 1Q96 1Q97 1Q98 1Q99 1Q00 1Q01 1Q02 1Q03 1Q04 1Q05 1Q06 1Q07 1Q08 1Q09 1Q10 1Q11 1Q12 1Q13 1Q14 1Q15 1Q16 1Q17 1Q18 1Q19 Source: Witten Advisors 10
11 Demand projected to exceed supply in most markets 2-year average ratio of estimated job growth to multifamily completions ( ) Long-term Equilibrium Ratio of 5:1 Ratio of Jobs to Completions 0.0 Phoenix Las Vegas San Diego Atlanta Orlando Orange County Tampa Los Angeles Southeast Florida Washington, DC CPT Average Raleigh Charlotte Austin Denver Dallas Houston Source: Witten Advisors and Axiometrics 11
12 Camden s Portfolio 12
13 Portfolio Statistics 4Q15 Operating Communities 172 Apartment Homes 59,792 Total Monthly Revenues per Occupied Unit $1,501 Average Age of Portfolio (years) 12 Development Communities 8 Development Apartment Homes 2,857 Value per Home * $202,600 * Source: Green Street Advisors 13
14 Geographic Diversity & Market Balance Total Monthly Apartment Revenue per Same Store Occupancy Homes % of NOI (1) Occupied Home 4Q15 1Q16 (2) Washington, DC 6, % $1, % 94.8% Houston 8, % 1, % 94.3% Southern California 4, % 1, % 95.4% Southeast Florida 2, % 2, % 96.9% Atlanta 4, % 1, % 95.4% Dallas 5, % 1, % 96.3% Las Vegas 4, % 1, % 97.4% Tampa 3, % 1, % 96.0% Orlando 3, % 1, % 95.9% Denver 2, % 1, % 94.1% Charlotte 2, % 1, % 96.0% Phoenix 2, % 1, % 95.7% Raleigh 3, % 1, % 95.4% Austin 3, % 1, % 96.3% Corpus Christi, TX 1, % 1, % 92.4% Overall 59, % $1, % 95.6% (1) Including pro-rata share of NOI from joint venture communities (2) 1Q16 occupancy data through 3/6/16 14
15 Focus on High-Growth Markets Employment Growth (in thousands) Rank Metro area Gain 1 New York-Jersey City-White Plains NY-NJ Los Angeles-Long Beach-Glendale CA Dallas-Plano-Irving TX Atlanta-Sandy Springs-Roswell GA Phoenix-Mesa-Scottsdale AZ Houston-The Woodlands-Sugar Land TX Chicago-Naperville-Arlington Heights IL Washington-Arlington-Alexandria DC-VA-MD-WV Orlando-Kissimmee-Sanford FL Seattle-Bellevue-Everett WA Anaheim-Santa Ana-Irvine CA Riverside-San Bernardino-Ontario CA Tampa-St. Petersburg-Clearwater FL San Diego-Carlsbad CA San Jose-Sunnyvale-Santa Clara CA Denver-Aurora-Lakewood CO Minneapolis-St. Paul-Bloomington MN-WI Charlotte-Concord-Gastonia NC-SC Austin-Round Rock TX San Francisco-Redwood City-South San Francisco CA Miami-Miami Beach-Kendall FL San Antonio-New Braunfels TX Portland-Vancouver-Hillsboro OR-WA Fort Worth-Arlington TX Warren-Troy-Farmington Hills MI Population Growth (in thousands) Rank Metro area Gain 1 Houston-The Woodlands-Sugar Land TX Atlanta-Sandy Springs-Roswell GA Phoenix-Mesa-Scottsdale AZ Dallas-Plano-Irving TX Orlando-Kissimmee-Sanford FL New York-Jersey City-White Plains NY-NJ Los Angeles-Long Beach-Glendale CA Austin-Round Rock TX Las Vegas-Henderson-Paradise NV Charlotte-Concord-Gastonia NC-SC Riverside-San Bernardino-Ontario CA Tampa-St. Petersburg-Clearwater FL Fort Worth-Arlington TX Washington-Arlington-Alexandria DC-VA-MD-WV Denver-Aurora-Lakewood CO San Antonio-New Braunfels TX Raleigh NC West Palm Beach-Boca Raton-Delray Beach FL Minneapolis-St. Paul-Bloomington MN-WI Miami-Miami Beach-Kendall FL San Diego-Carlsbad CA Seattle-Bellevue-Everett WA Fort Lauderdale-Pompano Beach-Deerfield Beach FL Oakland-Hayward-Berkeley CA Portland-Vancouver-Hillsboro OR-WA Over 97% of Camden s NOI is derived from these markets Source: Moody s Analytics January 2016 Estimated Gains: Highlighted represents Camden markets 15
16 Camden s Same Property Growth Revenue Growth 8% 6% 4% 2% Long-term Industry Avg ~3% 0% * NOI Growth 10% 8% 6% 4% 2% Long-term Industry Avg ~3% 0% * * 2016 Guidance provided 1/28/16 16
17 Same Property Revenue Growth by Market Over 5% 2015 Actual 2016 Guidance* Atlanta Atlanta Austin Austin Charlotte Dallas Dallas Denver Denver Las Vegas Las Vegas Orlando Orlando Phoenix Phoenix Raleigh Raleigh South Florida South Florida Southern California Southern California Tampa Tampa 3% - 5% Charlotte Under 3% Houston Washington, DC Houston Washington, DC * 2016 Guidance provided 1/28/16 17
18 New Leases & Renewals Average change in same property new lease and renewal rates vs. expiring lease rates when signed 8% 6% 4% 2% 0% 1Q15 2Q15 3Q15 4Q15 1Q16* New Leases Renewals * 1Q16 data through 3/7/16 18
19 Real Estate Transactions 19
20 Capital Recycling Since 2011 we have significantly improved the quality of our portfolio with minimal cash flow dilution $1.3B Total Acquisitions $1.7B Total Dispositions $635M $644M $757M $968M Wholly-owned Joint Ventures Wholly-owned Joint Ventures Average Age of 6 years* Average Age of 23 years* * Average age at time of purchase or sale 20
21 Development Value Creation Completed/ Stabilized Current Combined ( ) Pipeline Total Communities Apartment Homes 4,427 4,229 8,656 Total Cost $0.7B $1.1B $1.8B Market Value * $1.0B $1.4B $2.4B Value Creation $290M $330M $620M NAV Creation (per share) $3.16 $3.59 $6.75 * Value assuming current market cap rates ranging from 4.0%-5.25% for new product in our markets 21
22 Current Development Pipeline ($ in millions) Estimated Total Total Initial Construction Stabilized % Name Location Homes Cost Occupancy Completion Operations Leased (1) Camden Southline (JV) Charlotte, NC 266 $47 1Q15 4Q15 1Q16 93% Camden Flatirons Denver, CO Q14 3Q15 2Q16 89% Camden Paces Atlanta, GA Q14 4Q15 3Q16 81% Camden Glendale Glendale, CA Q15 3Q15 2Q16 76% Camden Chandler Chandler, AZ Q15 1Q16 4Q16 59% Camden Gallery Charlotte, NC Q16 3Q16 1Q17 11% Camden Victory Park Dallas, TX Q16 3Q16 1Q18 8% The Camden Los Angeles, CA Q16 4Q16 2Q17 - Camden Lincoln Station Denver, CO Q16 2Q17 1Q18 - Camden NoMa II Washington, DC Q17 4Q17 4Q19 - Camden Shady Grove Rockville, MD Q17 1Q18 4Q19 - Camden McGowen Station Houston, TX Q17 2Q18 3Q19 - Total 4,229 $1,091 Development Pipeline 72% funded with only $310M remaining to complete (2) (1) As of 3/7/16 (2) As of 12/31/15 22

")


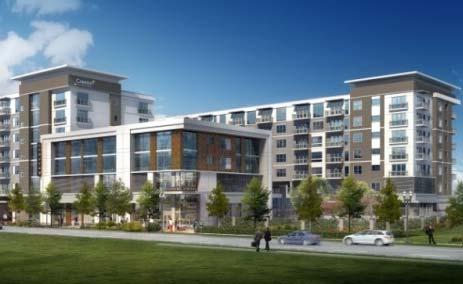
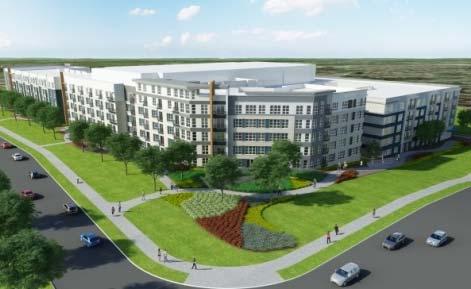
23 Current Development Pipeline Camden Southline (JV) Charlotte, NC Camden Flatirons Denver, CO Camden Paces Atlanta, GA Camden Glendale Glendale, CA Camden Chandler Chandler, AZ Camden Gallery Charlotte, NC Camden Victory Park Dallas, TX The Camden Los Angeles, CA Camden Lincoln Station Denver, CO Camden NoMa II Washington, DC Camden Shady Grove Rockville, MD Camden McGowen Station Houston, TX 23
24 Future Development Projects ($ in millions) Total Projected Estimated Project Location Homes Cost Camden Washingtonian Gaithersburg, MD 365 $90 Camden North End (1) Phoenix, AZ 1, Camden Buckhead Atlanta, GA Camden Arts District Los Angeles, CA Camden Conte (2) Houston, TX Camden Atlantic Plantation, FL Total 2,929 $777 (1) Project to be developed in 3 phases (2) Project to be developed in 2 phases 24


25 Redevelopment Activity Target well-located year old assets Update kitchen & bath areas, appliances, flooring, fixtures, lighting, etc. $228 million spent through 2015 $21 million budgeted for ,300 apartment homes completed at average cost of $11,400 per unit Average rental rate increase >$100 per month Over 10% cash-on-cash return Before - Kitchen Before - Bath After - Kitchen After - Bath 25
26 Capital Structure & Liquidity 26
27 Strong Capital Structure ($ in millions as of 2/29/16) Unsecured Credit Facilities $ x debt-to-ebitda Equity* $7,273 Mortgages $900 Senior Unsecured Notes $1, % weighted average interest rate on all debt 81.3% fixed-rate debt 67.8% unsecured debt 5.5 years weighted average maturity of debt Total Market Capitalization = $10 Billion Manageable debt maturities over next several years * Based on closing share price of $79.19 on 3/11/16 27
28 Manageable Debt Maturities Future scheduled maturities excluding Credit Facilities (as of 2/29/16) ($ in millions) $700 $644.1 $600 $500 $500.0 $400 $350.0 $300 $246.8 $250.0 $250.0 $200 $175.0 $100 $0 $0.0 $0.0 $
29 Liquidity (as of 2/29/16) $323M availability under unsecured credit facilities $315M equity issuance available under ATM program Sufficient liquidity to meet near-term capital needs Unencumbered asset pool of approximately $6.3B Strong credit ratings o Moody s: Baa1 Positive o Fitch: BBB+ Positive o Standard & Poor s: BBB+ Stable 29
30 Summary 30
31 Why Camden? Experienced management team with proven history of performance and sound business plan Consistent long-term focus and commitment to high-growth markets Strong balance sheet with ample liquidity Well-positioned to capitalize on future opportunities Ranked #9 by FORTUNE Magazine as one of the 100 Best Companies to Work For in America 31
32 Appendix 32
33 2016 Guidance EARNINGS LOW MIDPOINT HIGH FFO per share $4.75 $4.85 $4.95 EPS per share $1.71 $1.81 $1.91 SAME PROPERTY PERFORMANCE Revenue Growth 4.10% 4.60% 5.10% Expense Growth 4.30% 4.80% 5.30% NOI Growth 3.50% 4.50% 5.50% TRANSACTIONS Acquisitions $0 million $0 million $0 million Dispositions $150 million $250 million $350 million Development Starts $0 million $100 million $200 million * 2016 Guidance provided 1/28/16 33
34 Non-GAAP Financial Measures Definitions & Reconciliations This document contains certain non-gaap financial measures management believes are useful in evaluating an equity REIT's performance. Camden's definitions and calculations of non-gaap financial measures may differ from those used by other REITs, and thus may not be comparable. The non-gaap financial measures should not be considered as an alternative to net income as an indication of our operating performance, or to net cash provided by operating activities as a measure of our liquidity. FFO The National Association of Real Estate Investment Trusts ( NAREIT ) currently defines FFO as net income (computed in accordance with accounting principles generally accepted in the United States of America ("GAAP")), excluding gains (or losses) associated with previously depreciated operating properties, real estate depreciation and amortization, impairments of depreciable assets, and adjustments for unconsolidated joint ventures. Our calculation of diluted FFO also assumes conversion of all potentially dilutive securities, including certain noncontrolling interests, which are convertible into common shares. We consider FFO to be an appropriate supplemental measure of operating performance because, by excluding gains or losses on dispositions of operating properties, and depreciation, FFO can assist in the comparison of the operating performance of a company s real estate investments between periods or to different companies. A reconciliation of net income attributable to common shareholders to FFO is provided below: Three Months Ended Twelve Months Ended December 31, December 31, Net income attributable to common shareholders $60,593 $178,498 $249,315 $292,089 Real estate depreciation and amortization 64,286 60, , ,638 Adjustments for unconsolidated joint ventures 2,364 1,357 9,146 5,337 Income allocated to non-controlling interests 1,209 6,126 8,947 9,225 Gain on sale of unconsolidated joint venture properties (3,566) Gain on sale of operating properties, net of tax (18,870) (155,680) (104,015) (155,680) Funds from operations $109,582 $90,333 $414,497 $378,043 34
35 Non-GAAP Financial Measures Definitions & Reconciliations Adjusted FFO In addition to FFO, we compute Adjusted FFO ("AFFO") as a supplemental measure of operating performance. AFFO is calculated utilizing FFO less recurring capital expenditures which are necessary to help preserve the value of and maintain the functionality at our communities. Our definition of recurring capital expenditures may differ from other REITs, and there can be no assurance our basis for computing this measure is comparable to other REITs. A reconciliation of FFO to AFFO is provided below: Three Months Ended Twelve Months Ended December 31, December 31, Net income attributable to common shareholders $60,593 $178,498 $249,315 $292,089 Real estate depreciation and amortization 64,286 60, , ,638 Adjustments for unconsolidated joint ventures 2,364 1,357 9,146 5,337 Income allocated to non-controlling interests 1,209 6,126 8,947 9,225 Gain on sale of unconsolidated joint venture properties (3,566) Gain on sale of operating properties, net of tax (18,870) (155,680) (104,015) (155,680) Funds from operations $109,582 $90,333 $414,497 $378,043 Less: recurring capitalized expenditures (17,429) (18,397) (64,169) (59,854) Adjusted funds from operations $92,153 $71,936 $350,328 $318,189 Weighted average number of common shares outstanding: EPS diluted 90,418 90,233 89,490 88,468 FFO/AFFO diluted 91,502 91,045 91,386 90,366 Earnings per common share - diluted $0.67 $1.98 $2.76 $3.27 FFO per common share - diluted $1.20 $0.99 $4.54 $4.18 AFFO per common share - diluted $1.01 $0.79 $3.83 $
36 Non-GAAP Financial Measures Definitions & Reconciliations Expected FFO Expected FFO is calculated in a method consistent with historical FFO, and is considered an appropriate supplemental measure of expected operating performance when compared to expected earnings per common share (EPS). A reconciliation of the ranges provided for diluted EPS to expected FFO per diluted share is provided below: 1Q16 Range 2016 Range Low High Low High Expected earnings per common share - diluted $0.41 $0.45 $1.71 $1.91 Expected real estate depreciation and amortization Expected adjustments for unconsolidated joint ventures Expected income allocated to non-controlling interests Expected FFO per share - diluted $1.16 $1.20 $4.75 $4.95 EBITDA EBITDA is defined by the Company as earnings before interest, taxes, depreciation and amortization, excluding equity in (income) loss of joint ventures, (gain) loss on sale of unconsolidated joint venture interests, gain on acquisition of controlling interest in joint ventures, gain on sale of operating properties including land, net of tax, and income (loss) allocated to non-controlling interests. The Company considers EBITDA to be an appropriate supplemental measure of operating performance to net income attributable to common shareholders because it represents income before non-cash depreciation and the cost of debt, and excludes gains or losses from property dispositions. A reconciliation of net income attributable to common shareholders to EBITDA is provided below: Three Months Ended Twelve Months Ended December 31, December 31, Net income attributable to common shareholders $60,593 $178,498 $249,315 $292,089 Plus: Interest 23,740 24,846 97,312 94,906 Plus: Depreciation and amortization 65,886 61, , ,346 Plus: Income allocated to non-controlling interests from continuing operations 1,209 6,126 8,947 9,225 Plus: Income tax expense ,872 1,903 Less: Gain on sale of operating properties, including land (19,096) (155,680) (104,288) (159,289) Less: Impairment associated with land holdings 1,152 Less: Equity in income of joint ventures (1,681) (1,134) (6,168) (7,023) EBITDA $131,189 $114,870 $504,072 $470,309 36
37 Non-GAAP Financial Measures Definitions & Reconciliations Net Operating Income (NOI) NOI is defined by the Company as total property income less property operating and maintenance expenses less real estate taxes. The Company considers NOI to be an appropriate supplemental measure of operating performance to net income attributable to common shareholders because it reflects the operating performance of our communities without allocation of corporate level property management overhead or general and administrative costs. A reconciliation of net income attributable to common shareholders to net operating income is provided below: Three Months Ended Twelve Months Ended December 31, December 31, Net income attributable to common shareholders $60,593 $178,498 $249,315 $292,089 Less: Fee and asset management (1,916) (2,531) (6,999) (9,832) Less: Interest and other income (289) (80) (597) (842) Less: Income/(loss) on deferred compensation plans (1,607) (2,003) 264 (3,937) Plus: Property management 5,833 5,581 23,761 22,689 Plus: Fee and asset management 1,318 1,595 4,742 5,341 Plus: General and administrative 13,113 20,595 46,233 51,005 Plus: Interest 23,740 24,846 97,312 94,906 Plus: Depreciation and amortization 65,886 61, , ,346 Plus: Expense/(benefit) on deferred compensation plans 1,607 2,003 (264) 3,937 Less: Gain on sale of operating properties, including land (19,096) (155,680) (104,288) (159,289) Less: Impairment associated with land holdings 1,152 Less: Equity in income of joint ventures (1,681) (1,134) (6,168) (7,023) Plus: Income tax expense ,872 1,903 Plus: Income allocated to non-controlling interests from continuing operations 1,209 6,126 8,947 9,225 Net Operating Income (NOI) $149,248 $140,030 $571,212 $538,670 Same Property Communities $133,716 $126,462 $520,132 $494,325 Non-"Same Property" Communities 11,364 7,855 37,375 19,280 Development and Lease-Up Communities 3, , Dispositions/Other 730 5,016 5,226 24,071 Net Operating Income (NOI) $149,248 $140,030 $571,212 $538,670 37
38 Forward-Looking Statements In addition to historical information, this presentation contains forward-looking statements under the federal securities law. These statements are based on current expectations, estimates and projections about the industry and markets in which Camden (the Company ) operates, management's beliefs, and assumptions made by management. Forwardlooking statements are not guarantees of future performance and involve certain risks and uncertainties which are difficult to predict. Factors which may cause the Company s actual results or performance to differ materially from those contemplated by forward-looking statements are described under the heading Risk Factors in Camden s Annual Report on Form 10-K and in other filings with the Securities and Exchange Commission (SEC). Forward-looking statements made in this presentation represent management s opinions as of the date of this presentation, and the Company assumes no obligation to update or supplement these statements because of subsequent events. 38
39 Notes 39
40 40
Investor Presentation March 2017
 Investor Presentation March 2017 1 Table of Contents Company Overview & 2016 Highlights 3 6 Multifamily Fundamentals 7 11 Camden s Portfolio 12 21 Real Estate Transactions 22 28 Capital Structure & Liquidity
Investor Presentation September 2017
 Investor Presentation September 2017 1 Table of Contents Company Overview & 2017 Guidance 3 6 Multifamily Fundamentals 7 11 Camden s Portfolio 12 22 Real Estate Transactions 23 29 Capital Structure & Liquidity
Investor Presentation February 2015
 Investor Presentation February 2015 1 Forward-Looking Statements In addition to historical information, this presentation contains forward-looking statements under the federal securities law. These statements
Investor Presentation November 2017
 Investor Presentation November 2017 1 Table of Contents Company Overview & 2017 Highlights 3 6 Multifamily Fundamentals 7 11 Camden s Portfolio 12 22 Real Estate Transactions 23 29 Capital Structure &
Investor Presentation September 2014
 Investor Presentation September 2014 1 Forward-Looking Statements In addition to historical information, this presentation contains forward-looking statements under the federal securities law. These statements
FIRST QUARTER Supplemental Operating and Financial Data. Camden Sotelo - Tempe, AZ
 FIRST QUARTER 2014 Supplemental Operating and Financial Data Camden Sotelo - Tempe, AZ Camden Las Olas - Ft. Lauderdale, FL Year Built - 2004 420 Apartment Homes 97% Average 1st Quarter 2014 Occupancy
FOURTH QUARTER Supplemental Operating and Financial Data
 FOURTH QUARTER 2012 Supplemental Operating and Financial Data Camden Belleview Station - Denver, CO Year Built -2009 270 Apartment Homes Acquired December 20, 2012 Camden Property Trust Three Greenway
MAMA Risk Summary Data through 2011 Q3
 MAMA Risk Summary Data through 2011 Q3 Table of Contents Report Contents... 2 Summary... 3 MAMA Risk Summary Indicators for Largest 50 Metro Areas... 4 Home Prices Risk Indicator Summary Map... 6 Employment
MANAGEMENT PRESENTATION
 MANAGEMENT PRESENTATION SEPTEMBER 2014 RUF.U (USD) RUF.UN (CAD) RUF.DB.U (USD) Bear Creek Apartments, Dallas, TX AGENDA Valley Ranch Apartments, Dallas, TX 1. PURE ADVANTAGE Who we are 2. PURE PLAY What
Positioned for Performance. j u n e Fine Arts Building Berkeley, CA
 Positioned for Performance j u n e 2009 Fine Arts Building Berkeley, CA Trump Place New York, NY 180 Riverside Equity Residential has a portfolio of high-quality assets focused in high-growth markets where
Housing Affordability: Local and National Perspectives
 University of Pennsylvania ScholarlyCommons 2018 ADRF Network Research Conference Presentations ADRF Network Research Conference Presentations 11-2018 Housing Affordability: Local and National Perspectives
MANAGEMENT PRESENTATION JUNE Bear Creek Apartments, Dallas, TX
 MANAGEMENT PRESENTATION JUNE 2014 Bear Creek Apartments, Dallas, TX AGENDA Valley Ranch Apartments, Dallas, TX 1. PURE ADVANTAGE Who we are 2. PURE PLAY What we do 3. PURE STRATEGY How we do it 4. PURE
Table of Contents Page
 Table of Contents Page Page Company, Common Stock, and Earnings Call Information 1 Debt Information Definitions 2-3 Debt Maturities 20 Financial Information Unsecured Public Debt Covenants 21 Balance Sheets
NEWS RELEASE For immediate release
 NEWS RELEASE For immediate release Laura Clark 904 598 7831 LauraClark@RegencyCenters.com Regency Centers Reports Third Quarter 2018 Results Company Increases 2018 Guidance JACKSONVILLE, FL. (October 25,
FIRST INDUSTRIAL REALTY TRUST REPORTS FIRST QUARTER 2018 RESULTS
 First Industrial Realty Trust, Inc. 311 South Wacker Drive Suite 3900 Chicago, IL 60606 312/344-4300 FAX: 312/922-9851 MEDIA RELEASE FIRST INDUSTRIAL REALTY TRUST REPORTS FIRST QUARTER 2018 RESULTS Occupancy
STAG INDUSTRIAL ANNOUNCES SECOND QUARTER 2018 RESULTS
 STAG INDUSTRIAL ANNOUNCES SECOND QUARTER 2018 RESULTS Boston, MA July 31, 2018 - STAG Industrial, Inc. (the Company ) (NYSE:STAG), today announced its financial and operating results for the quarter ended
The U.S. Housing Confidence Index
 March 2018 www.pulsenomics.com 2014-2018 Pulsenomics LLC Pulsenomics, Housing Confidence Survey, and Housing Confidence Index are trademarks of Pulsenomics LLC. HCI Each Housing Confidence Index (HCI)
Highwoods Reports Third Quarter 2017 Results
 FOR IMMEDIATE RELEASE Ref: 17-20 Contact: Brendan Maiorana Senior Vice President, Finance and Investor Relations 919-431-1529 Highwoods Reports Third Quarter 2017 Results $0.55 Net Income per Share $0.86
Extra Space Storage Inc. Reports 2018 Fourth Quarter and Year-End Results
 Extra Space Storage Inc. Reports 2018 Fourth Quarter and Year-End Results February 20, 2019 SALT LAKE CITY, Feb. 20, 2019 /PRNewswire/ -- Extra Space Storage Inc. (NYSE: EXR) (the "Company"), a leading
Extra Space Storage Inc. Reports 2017 Fourth Quarter and Year-End Results
 Extra Space Storage Inc. Reports 2017 Fourth Quarter and Year-End Results February 20, 2018 SALT LAKE CITY, Feb. 20, 2018 /PRNewswire/ -- Extra Space Storage Inc. (NYSE: EXR) (the "Company"), a leading
FIRST INDUSTRIAL REALTY TRUST REPORTS FIRST QUARTER 2019 RESULTS
 First Industrial Realty Trust, Inc. 1 North Wacker Drive Suite 4200 Chicago, IL 60606 312/344-4300 MEDIA RELEASE FIRST INDUSTRIAL REALTY TRUST REPORTS FIRST QUARTER 2019 RESULTS Signed 1.8 Million Square
RESI Update 4 th Quarter 2016
 RESI Update 4 th Quarter 2016 Supplemental Investor Information George Ellison, CEO Robin Lowe, CFO 2017 Altisource Residential Corporation. All rights reserved. Forward Looking Statements This presentation
Definitions. CPI is a lease in which base rent is adjusted based on changes in a consumer price index.
 Annualized Rental Income is rental revenue under our leases on Operating Properties on a straight-line basis, which includes the effect of rent escalations and any tenant concessions, such as free rent,
Supplemental Information December 31, 2017
 Conference Call 888-632-3384 ID - EastGroup February 1, 2018 11:00 a.m. Eastern Standard Time webcast available at www.eastgroup.net Supplemental Information December 31, 2017 Alamo Ridge Business Park
MANAGEMENT PRESENTATION
 MANAGEMENT PRESENTATION NOVEMBER 2014 RUF.U (USD) RUF.UN (CAD) RUF.DB.U (USD) Bear Creek Apartments, Dallas, TX WHY PURE MULTI-FAMILY REIT LP Fairways at Prestonwood, Dallas, TX 1 2 Significant organic
Supplemental Information September 30, 2017
 Conference Call 888-632-3384 ID - EastGroup October 20, 2017 11:00 a.m. Eastern Daylight Time webcast available at www.eastgroup.net Supplemental Information September 30, 2017 Steele Creek Commerce Park
November November 2012
 NAREIT REIT World NAREIT REIT World November 2012 November 2012 1 Company Overview Multifamily NOI Current: 86% Target: 90% Multifamily Portfolio 35,067 apartment homes 115 apartment communities 96.4%
NEWS RELEASE For immediate release
 NEWS RELEASE For immediate release Laura Clark 904 598 7831 LauraClark@RegencyCenters.com Regency Centers Reports Second Quarter 2018 Results JACKSONVILLE, FL. (August 2, 2018) Regency Centers Corporation
Highwoods Reports Second Quarter 2018 Results
 FOR IMMEDIATE RELEASE Ref: 18-14 Contact: Brendan Maiorana Senior Vice President, Finance and Investor Relations 919-431-1529 Highwoods Reports Second Quarter 2018 Results $0.49 Net Income per Share $0.87
UDR Third Quarter 2011 Earnings Supplement
 UDR Third Quarter 2011 Earnings Supplement 95 Wall New York, NY (NYSE: UDR), has a demonstrated history of delivering superior and dependable returns by successfully managing, buying, selling, developing
PS Business Parks, Inc. Reports Results for the Quarter Ended September 30, 2018
 News Release PS Business Parks, Inc. 701 Western Avenue Glendale, CA 91201-2349 psbusinessparks.com For Release: Immediately Date: October 23, 2018 Contact: Jeff Hedges (818) 244-8080, Ext. 1649 PS Business
EastGroup Properties Announces Second Quarter 2018 Results
 EastGroup Properties Announces Second Quarter 2018 Results Contact: Marshall Loeb, President and CEO Brent Wood, CFO (601) 354-3555 Net Income Attributable to Common Stockholders of $.52 Per Share Compared
SUPPLEMENTAL INFORMATION
 SUPPLEMENTAL INFORMATION UNAUDITED FOURTH QUARTER 2018 STAG SUPPLEMENTAL INFORMATION FOURTH QUARTER 2018 1 Forward-Looking Statements This supplemental information package contains certain forward-looking
PS Business Parks, Inc. Reports Results for the Quarter Ended March 31, 2018
 News Release PS Business Parks, Inc. 701 Western Avenue Glendale, CA 91201-2349 psbusinessparks.com For Release: Immediately Date: April 24, 2018 Contact: Maria R. Hawthorne (818) 244-8080, Ext. 1370 PS
Highwoods Reports Third Quarter 2015 Results
 FOR IMMEDIATE RELEASE Ref: 15-22 Contact: Mark Mulhern Senior Vice President and Chief Financial Officer 919-875-6682 Reports Third Quarter 2015 Results $0.77 FFO per Share (Including $0.01 per Share of
Highwoods Reports Third Quarter 2018 Results
 FOR IMMEDIATE RELEASE Ref: 18-18 Contact: Brendan Maiorana Senior Vice President, Finance and Investor Relations 919-431-1529 Highwoods Reports Third Quarter 2018 Results $0.32 Net Income per Share $0.86
Conference Call ID EastGroup October 19, :00 a.m. Eastern Time webcast available at EastGroup.net
 Table of Contents 2018 THIRD QUARTER Conference Call 877-876-9176 ID EastGroup October 19, 2018 11:00 a.m. Eastern Time webcast available at EastGroup.net Supplemental Information 2018 400 W. Parkway Place,
PS Business Parks, Inc. Reports Results for the Quarter and Year Ended December 31, 2018
 News Release PS Business Parks, Inc. 701 Western Avenue Glendale, CA 91201-2349 psbusinessparks.com For Release: Immediately Date: February 20, 2019 Contact: Jeff Hedges (818) 244-8080, Ext. 1649 PS Business
Industrial Income Trust Inc.
 UNITED STATES SECURITIES AND EXCHANGE COMMISSION Washington, D.C. 20549 FORM 8-K CURRENT REPORT Pursuant to Section 13 or 15(d) of The Securities Exchange Act of 1934 Date of Report (Date of earliest event
ULI Houston Suburban Trends Marketplace Gadi Kaufmann, CEO RCLCO
 ULI Houston Suburban Trends Marketplace 2016 Gadi Kaufmann, CEO RCLCO April 7, 2016 gkaufmann@rclco.com www.rclco.com BEST MINDS IN REAL ESTATE Best Minds in Real Estate : A multidisciplinary team The
SITE CENTERS NOVEMBER 2018
 SITE CENTERS NOVEMBER 2018 JOINT VENTURE WITH CHINESE INSTITUTIONAL INVESTORS $607MM JOINT VENTURE ALLOWS SITE CENTERS TO ACCELERATE OPPORTUNISTIC INVESTING AND FURTHER IMPROVE THE BALANCE SHEET Dividend
NAREIT Presentation June George Ellison, CEO Robin Lowe, CFO. welcome. home Front Yard Residential. All rights reserved.
 NAREIT Presentation June 2018 George Ellison, CEO Robin Lowe, CFO welcome home. 2018 Front Yard Residential. All rights reserved. 1 Forward-looking Statements This presentation contains forward-looking
3rd Quarter Quarterly Supplemental
 Quarterly Supplemental 3rd Quarter 2018 Mkt at Springwoods Village Spring, TX Calhoun Commons Minneapolis, MN Mellody Farm Vernon Hills, IL El Camino Shopping Center Woodland Hills, CA Mellody Farm Vernon
UDR First Quarter 2011 Earnings Supplement
 First Quarter 2011 Earnings Supplement 10 Hanover Square New York, NY, Inc. (NYSE: ), has a demonstrated history of delivering superior and dependable returns by successfully managing, buying, selling,
Industrial Income Trust Inc.
 UNITED STATES SECURITIES AND EXCHANGE COMMISSION Washington, D.C. 20549 FORM 8-K CURRENT REPORT Pursuant to Section 13 or 15(d) of The Securities Exchange Act of 1934 Date of Report (Date of earliest event
DCT INDUSTRIAL TRUST REPORTS FOURTH QUARTER AND FULL-YEAR 2017 RESULTS. Net Earnings of $0.22 per Diluted Share in Q4; $1.11 per Diluted Share in 2017
 Press Release FOR IMMEDIATE RELEASE: DCT INDUSTRIAL TRUST REPORTS FOURTH QUARTER AND FULL-YEAR 2017 RESULTS Net Earnings of $0.22 per Diluted Share in Q4; $1.11 per Diluted Share in 2017 FFO, as adjusted,
2014 Operating and Financial Highlights
 FINANCIAL HIGHLIGHTS > 2014 Operating and Financial Highlights Operating Results Executed 203 leasing transactions representing approximately 2.8 million square feet, the highest gross leasing volume in
UDR Second Quarter 2011 Earnings Supplement
 Second Quarter 2011 Earnings Supplement Clockwise from left: Rivergate, 21 Chelsea Chelsea 21 Manhattan; View 14 Washington, D.C., Inc. (NYSE: ), has a demonstrated history of delivering superior and dependable
Investor Presentation December 2017
 Investor Presentation December 2017 Cautionary Statement This presentation includes statements concerning our expectations, beliefs, plans, objectives, goals, strategies, future events or performance and
SPECIAL REPORT. Single-Family Rent Index: H Review
 SPECIAL REPORT Rent Index: H1 2018 Review FEBRUARY 2018 1 National Overview Single-family rentals make up one-half of all residential rentals but are an overlooked segment of the housing market. Much like
PS Business Parks, Inc. Reports Results for the Quarter Ended March 31, 2017
 News Release PS Business Parks, Inc. 701 Western Avenue Glendale, CA 91201-2349 psbusinessparks.com For Release: Immediately Date: April 25, 2017 Contact: Edward A. Stokx (818) 244-8080, Ext. 1649 PS Business
Citigroup Global Property CEO Conference
 Citigroup Global Property CEO Conference March 2013 Company Overview Multifamily Portfolio 34,497 apartment homes 115 apartment communities 95.8% Occupancy Average age: 16.1 years Average revenue per unit:
Retail Opportunity Investments Corp. Reports Strong First Quarter Results & Raises FFO Guidance
 April 27, 2016 Retail Opportunity Investments Corp. Reports Strong First Quarter Results & Raises FFO Guidance $17.4% increase in FFO Per Diluted Share 7.6% Increase in Same-Center Cash Net Operating Income
Highwoods Properties Reports Fourth Quarter and Full Year 2011 Results
 FOR IMMEDIATE RELEASE Ref: 12-06 Contact: Tabitha Zane Vice President, Investor Relations 919-431-1529 Highwoods Properties Reports Fourth Quarter and Full Year 2011 Results $0.70 FFO per Share for Fourth
Extra Space Storage Inc. Reports 2017 Third Quarter Results
 Extra Space Storage Inc. Reports 2017 Third Quarter Results November 1, 2017 SALT LAKE CITY, Nov. 1, 2017 /PRNewswire/ -- Extra Space Storage Inc. (NYSE: EXR) (the "Company"), a leading owner and operator
Carter Validus Mission Critical REIT, Inc. Reports Second Quarter 2016 Results
 Carter Validus Mission Critical REIT, Inc. Reports Second Quarter 2016 Results TAMPA, FL (September 1, 2016) - Carter Validus Mission Critical REIT, Inc. (the Company ) announced today its operating results
NEWS RELEASE For immediate release
 NEWS RELEASE For immediate release Laura Clark 904 598 7831 LauraClark@RegencyCenters.com Regency Centers Reports First Quarter 2018 Results JACKSONVILLE, FL. (April 30, 2018) Regency Centers Corporation
AGREE REALTY CORPORATION REPORTS OPERATING RESULTS FOR THE SECOND QUARTER 2015
 FOR IMMEDIATE RELEASE CONTACT: Joey Agree Chief Executive Officer (248) 737-4190 AGREE REALTY CORPORATION REPORTS OPERATING RESULTS FOR THE SECOND QUARTER 2015 BLOOMFIELD HILLS, MI (July 27, 2015) - Agree
Supplemental Information. December 31, 2009
 Supplemental Information December 31, 2009 Page Page Company, Product and Investor Information 1-5 Tenant Industry Profile & Largest Tenants Summary 22 Financial Information Same Property Performance 23
Q2 18 Earnings Results
 July 26, 2018 Q2 18 Earnings Results (NYSE: SAFE) Forward-Looking Statements and Other Matters This release may contain forward-looking statements. All statements other than statements of historical fact
Guide for Estimating Affordability and Cap Exclusions for 2018 Deliveries
 Guide for Estimating Affordability and Exclusions for 2018 Deliveries This is a reference guide for how the percentage excluded from the scorecard cap for an individual deal is calculated. The Multifamily
Clipper Realty Inc. Announces Third Quarter 2018 Results Reports Record Revenues, Income From Operations and Adjusted Funds From Operations
 Clipper Realty Inc. Announces Third Quarter 2018 Results Reports Record Revenues, Income From Operations and Adjusted Funds From Operations NEW YORK, November 1, 2018 /Business Wire/ -- Clipper Realty
Strategic Capital Deployment
 Strategic Capital Deployment Disposition Acquisition Austin Braker Pointe III Dallas 750 West John Carpenter Freeway January 2017 Introduction Piedmont Office Realty Trust, Inc. (also referred to herein
4th Quarter Quarterly Supplemental
 Quarterly Supplemental 4th Quarter 2017 The Hub Hillcrest Market San Diego, CA Aventura Shopping Center Aventura, FL 4S Commons Town San Diego, CA Investor Relations irinfo@regencycenters.com One Independent
MANAGEMENT PRESENTATION. November 7, 2017
 MANAGEMENT PRESENTATION November 7, 2017 DISCLAIMER This presentation includes time-sensitive information that may be accurate only as of today s date, November 7, 2017. Estimates of future net income
General Growth Properties, Inc.
 General Growth Properties, Inc. Supplemental Financial Information For the Three and Nine Months Ended September 30, 2009 This presentation contains forward-looking statements. Actual results may differ
Achieved record annual revenues of $110.0 million for 2018, representing an increase of 5.8%
 Clipper Realty Inc. Announces Fourth Quarter and Full-Year 2018 Results Reports Record Annual Revenues, Record Annual Income from Operations and Record Quarterly and Annual Adjusted Funds from Operations
WP Glimcher Reports Second Quarter 2016 Results
 NEWS RELEASE WP Glimcher Reports Second Quarter 2016 Results COLUMBUS, OH August 3, 2016 WP Glimcher Inc. (NYSE: WPG) today reported financial and operating results for the second quarter ended June 30,
UDR First Quarter 2010 Earnings Supplement
 First Quarter 2010 Earnings Supplement Tribute Raleigh, North Carolina, Inc. (NYSE: ), has a demonstrated history of delivering superior and dependable returns by successfully managing, buying, selling,
Highwoods Properties Reports Third Quarter Results. $0.58 FFO per Diluted Share (Excluding Debt Extinguishment Loss and Property Acquisition Costs)
") FOR IMMEDIATE RELEASE Ref: 10-28 Contact: Tabitha Zane Vice President, Investor Relations 919-431-1529 Highwoods Properties Reports Third Quarter Results $0.58 FFO per Diluted Share (Excluding Debt Extinguishment
FOR IMMEDIATE RELEASE Ref: 10-28 Contact: Tabitha Zane Vice President, Investor Relations 919-431-1529 Highwoods Properties Reports Third Quarter Results $0.58 FFO per Diluted Share (Excluding Debt Extinguishment
Front Yard Residential Corporation Reports Third Quarter 2018 Results
 Front Yard Residential Corporation Reports Third Quarter 2018 Results November 7, 2018 CHRISTIANSTED, U.S. Virgin Islands, Nov. 07, 2018 (GLOBE NEWSWIRE) -- Front Yard Residential Corporation ( Front Yard
2nd Quarter Quarterly Supplemental
 Quarterly Supplemental 2nd Quarter 2018 Roosevelt Square Seattle, WA Cameron Village Raleigh, NC Grand Ridge Plaza Issaquah, WA Village at Tustin Legacy Tustin, CA Shops at Erwin Mill Durham, NC Investor
FOR IMMEDIATE RELEASE CONTACT: John Bucksbaum 312/ General Growth Properties, Inc. Reports Operating Results for the Third Quarter 2005
 News Release General Growth Properties, Inc. 110 North Wacker Drive Chicago, IL 60606 (312) 960-5000 FAX (312) 960-5475 FOR IMMEDIATE RELEASE CONTACT: John Bucksbaum 312/960-5005 Bernie Freibaum 312/960-5252
SEC Reg. G Compliance - Non-GAAP Financial Measures
 SEC Reg. G Compliance - Non-GAAP Financial Measures Funds From Operations (FFO) Reconciliation, Including Non-Cash Items 1 ($ in 000s, except per share amounts) Tentative Estimates Preliminary and Midpoint
SECURITIES AND EXCHANGE COMMISSION. Washington, D.C FORM 8-K CURRENT REPORT
 SECURITIES AND EXCHANGE COMMISSION Washington, D.C. 20549 FORM 8-K CURRENT REPORT PURSUANT TO SECTION 13 OR 15(d) OF THE SECURITIES EXCHANGE ACT OF 1934 Date of Report (Date of earliest event reported):
FOR IMMEDIATE RELEASE AUGUST 2, 2018 ARTIS REAL ESTATE INVESTMENT TRUST RELEASES SECOND QUARTER RESULTS
 FOR IMMEDIATE RELEASE AUGUST 2, 2018 ARTIS REAL ESTATE INVESTMENT TRUST RELEASES SECOND QUARTER RESULTS Today Artis Real Estate Investment Trust ( Artis or the "REIT") issued its financial results and
Q3 18 Earnings Results
 October 25, 2018 Q3 18 Earnings Results (NYSE: SAFE) Forward-Looking Statements and Other Matters This release may contain forward-looking statements. All statements other than statements of historical
NON-GAAP FINANCIAL MEASURES
 NON-GAAP FINANCIAL MEASURES Welltower Inc. (HCN) believes that revenues, net operating income from continuing operations (NOICO), net income and net income attributable to common stockholders (NICS), as
Glendale, California - PS Business Parks, Inc. (AMEX: PSB), reported operating results for the fourth quarter and the year ending December 31, 2001.
, reported operating results for the fourth quarter and the year ending December 31, 2001.") News Release PS Business Parks, Inc. 701 Western Avenue P.O. Box 25050 Glendale, CA 91221-5050 www.psbusinessparks.com For Release: Immediately Date: January 30, 2002 Contact: Mr. Jack Corrigan (818) 244-8080,
News Release PS Business Parks, Inc. 701 Western Avenue P.O. Box 25050 Glendale, CA 91221-5050 www.psbusinessparks.com For Release: Immediately Date: January 30, 2002 Contact: Mr. Jack Corrigan (818) 244-8080,
MARCH 2019 CITI 2019 GLOBAL PROPERTY CEO CONFERENCE
 MARCH 2019 CITI 2019 GLOBAL PROPERTY CEO CONFERENCE SAFE HARBOR This presentation contains forward-looking statements within the meaning of Section 27A of the Securities Act of 1933, and Section 21E of
Front Yard Residential Corporation Announces Transformative Acquisition and Reports Second Quarter 2018 Results
 Front Yard Residential Corporation Announces Transformative Acquisition and Reports Second Quarter 2018 Results August 9, 2018 CHRISTIANSTED, U.S. Virgin Islands, Aug. 09, 2018 (GLOBE NEWSWIRE) -- Front
OPTIBASE LTD. ANNOUNCES THIRD QUARTER RESULTS
 Media Contacts: Amir Philips, CEO, Optibase Ltd. 011-972-73-7073-700 info@optibase-holdings.com Investor Relations Contact: Marybeth Csaby, for Optibase +1-917-664-3055 Marybeth.Csaby@gmail.com OPTIBASE
FOR IMMEDIATE RELEASE
 FOR IMMEDIATE RELEASE American Finance Trust Announces Second Quarter Operating Results New York, August 9, - American Finance Trust, Inc. (Nasdaq: AFIN) ( AFIN or the Company ), a real estate investment
LUXURY MARKET REPORT. - May
 LUXURY MARKET REPORT - May 2018 - www.luxuryhomeing.com THIS IS YOUR LUXURY MARKET REPORT MAP OF LUXURY RESIDENTIAL MARKETS Welcome to the Luxury Report, your guide to luxury real estate market data and
Equity LifeStyle Properties. Community Quality Stability
 Equity LifeStyle Properties Community Quality Stability Forward-Looking Statements This presentation includes certain forward-looking statements within the meaning of the Private Securities Litigation
California s Housing Market: How Much Froth Is Out There?
 California s Housing Market: How Much Froth Is Out There? Conference Underwriter Polling Question: What Will Most Likely Occur to California s Housing Prices in the Next 2 Years? 1. Bubble Bursts 15% or
4th Quarter Quarterly Supplemental
 Quarterly Supplemental 4th Quarter 2018 Ballard Blocks Seattle, WA 4S Commons Town Center San Diego, CA Nocatee Town Center Ponte Vedra, FL Investor Relations irinfo@regencycenters.com One Independent
Market Trends and Outlook
 Residential Remodeling Market Trends and Outlook Kermit Baker Remodeling Futures Conference April 3, 2012 Remodeling Market Overview 1. Home improvement spending totaled an estimated $290 billion last
U.S. GDP (2012 Q Q2)
") U.S. GDP (2012 Q3 2014 Q2) U. S. Employment Employment Recovery Following the Last Two Downturns Rail Traffic: Containers Rail Traffic: Commodities Select Rail Traffic Residential Mortgages Pipeline of
U.S. GDP (2012 Q3 2014 Q2) U. S. Employment Employment Recovery Following the Last Two Downturns Rail Traffic: Containers Rail Traffic: Commodities Select Rail Traffic Residential Mortgages Pipeline of
NEWS RELEASE For immediate release
 NEWS RELEASE For immediate release Laura Clark 904 598 7831 LauraClark@RegencyCenters.com Regency Centers Updates 2017 and Introduces 2018 Earnings Guidance JACKSONVILLE, Fla. (January 11, 2018) Regency
Investor Presentation 2007
 Investor Presentation 2007 1 Forward Looking Statements This presentation contains forward-looking statements within the meaning of the federal securities laws. These statements reflect management s current
Public Storage Reports Results for the Quarter Ended March 31, 2017
 News Release Public Storage 701 Western Avenue Glendale, CA 91201-2349 www.publicstorage.com For Release Immediately Date April 26, 2017 Contact Clemente Teng (818) 244-8080, Ext. 1141 Public Storage Reports
A SIMULATION: MEASURING THE EFFECT OF HOUSING STIMULUS PROGRAMS ON FUTURE HOUSE PRICES
 Research Brief April 2010 First American CoreLogic A SIMULATION: MEASURING THE EFFECT OF HOUSING STIMULUS PROGRAMS ON FUTURE HOUSE PRICES www.facorelogic.com 800.345.7334 2009 First American CoreLogic,
FOR IMMEDIATE RELEASE: Equity One Reports Fourth Quarter and Year End 2014 Operating Results
 Equity One, Inc. For additional information: 410 Park Avenue, Suite 1220 Mark Langer, EVP and New York, NY 10022 Chief Financial Officer 212-796-1760 FOR IMMEDIATE RELEASE: Equity One Reports Fourth Quarter
AMH Corporate Update 2
 June 2014 Disclaimer The information in this presentation has been prepared solely for informational purposes. We, AMH, AH4R, the Company, the REIT, our and us refer to American Homes 4 Rent, a Maryland
MARCH 2018 CITI 2018 GLOBAL PROPERTY CEO CONFERENCE
 MARCH 2018 CITI 2018 GLOBAL PROPERTY CEO CONFERENCE SAFE HARBOR This presentation contains forward-looking statements within the meaning of Section 27A of the Securities Act of 1933, and Section 21E of
LUXURY MARKET REPORT. - March
 LUXURY MARKET REPORT - March 2018 - www.luxuryhomeing.com THIS IS YOUR LUXURY MARKET REPORT MAP OF LUXURY RESIDENTIAL MARKETS Welcome to the Luxury Report, your guide to luxury real estate market data
FOR IMMEDIATE RELEASE
 FOR IMMEDIATE RELEASE GLOBAL NET LEASE ANNOUNCES OPERATING RESULTS FOR SECOND QUARTER 2018 New York, August 8, 2018 Global Net Lease, Inc. (NYSE: GNL) ( GNL or the Company ), a real estate investment trust
NAREIT Conference. November 7-8, Together with you, we make a house a home.
 NAREIT Conference November 7-8, 2018 Together with you, we make a house a home. Disclaimer This presentation contains forward-looking statements within the meaning of Section 27A of the Securities Act
SAUL CENTERS, INC Wisconsin Avenue, Suite 1500, Bethesda, Maryland (301)
") SAUL CENTERS, INC. 7501 Wisconsin Avenue, Suite 1500, Bethesda, Maryland 20814-6522 (301) 986-6200 Saul Centers, Inc. Reports Third Quarter 2016 Earnings November 1, 2016, Bethesda, MD. Saul Centers, Inc.
SAUL CENTERS, INC. 7501 Wisconsin Avenue, Suite 1500, Bethesda, Maryland 20814-6522 (301) 986-6200 Saul Centers, Inc. Reports Third Quarter 2016 Earnings November 1, 2016, Bethesda, MD. Saul Centers, Inc.