CITY OF EAST POINT EAST POINT REDEVELOPMENT PLAN
|
|
|
- Denis Jennings
- 5 years ago
- Views:
Transcription


1 CITY OF EAST POINT EAST POINT REDEVELOPMENT PLAN TAX ALLOCATION DISTRICT #2 EAST POINT COMMERCIAL CORRIDORS AMENDED MAY 2017 PREPARED FOR: PREPARED BY:
2 TABLE OF CONTENTS Table of Contents... 2 Executive Summary... 4 Introduction... 4 The Opportunity and Vision for the Redevelopment Area... 5 Legal Basis and Qualifying Conditions for the TAD... 8 Key Redevelopment Challenges... 9 The Goal Introduction Proposal and Grounds for Exercise of Redevelopment Powers Geographic Boundaries (A) How Residents in East Point and Fulton County will Benefit Overview of Tax Allocation Districts Grounds for Exercise of Redevelopment Powers (B) Why the East Point Corridors Study Area Qualifies as a Redevelopment Area Market and Demographic Conditions Plan Vision and Goal Proposed Land Uses after Redevelopment (C) Proposed Redevelopment Projects (D) Contractual Relationships (E) Relocation Plans (F) Zoning & Land Use Compatibility (G) Method of Financing / Proposed Public Investments (H) TAD Potential of Downtown East Point Projects Assessed Valuation for TAD (I) Historic Property within Boundaries of TAD (J) Creation & Termination Dates for TAD (K) Tax Allocation Increment Base (M) Property Taxes for Computing Tax Allocation Increments (N) Tax Allocation Bond Issues (O, P, Q) Amount of Bond Issue Term of the Bond Issue or Issues Rate of Bond Issue Positive Tax Allocation Increments Property to be Pledged for Payment of the Bonds School System Impact Analysis (R) The Current Value of TAD #2 Verses the Fulton County School System s Tax Digest Implications of Status Quo Conditions to the FCSS Executive Summary 2
3 Proposed Redevelopment in East Point TAD # The Location of School Facilities within the Redevelopment Area An Estimate of Educational Special Purpose Local Option (ESPLOST) Sales Taxes and Incremental Business Personal Property Taxes Projected from TAD Development Conclusion Regarding School District Impacts Appendices Appendix A. LIST OF TAX PARCEL ID NUMBERS (PROPERTIES WITHIN THE TAD) Appendix B. East Point Mayor, City Council and City Manager Appendix C. Fulton County Board of Commissioners and County Manager Appendix D. Fulton County Board of Education and Superintendent of Schools * Headings followed by a letter in parenthesis [e.g. (A)] denote information required per Georgia Code Chapter 36, Title 44-3(9). Executive Summary 3
4 Tax Allocation District #2 - East Point Commercial Corridors EXECUTIVE SUMMARY INTRODUCTION In 2006, the City of East Point adopted a Redevelopment Plan (the Plan) creating Tax Allocation District #2 East Point Commercial Corridors (TAD #2). The Redevelopment Plan was prepared in conformance with the provisions of the Georgia Redevelopment Powers Law (O.C.G.A. Title 36 Chapter 44) which governs the creation of the Tax Allocation Districts in the state. 1 The Plan was prepared at the request of the City of East Point and duly adopted by resolution of the City Council. TAD #2 was later certified by the Georgia Commissioner of Revenue and became effective as of December 31, This document is intended to update and formally amend the original Plan, which is now more than 10 years old. Due in part to the impacts of the last recession, which was unforeseen at the time the original Redevelopment Plan was prepared, several of the projects upon which TAD #2 was based have failed to materialize more than a decade later. Other sites have been developed in ways different than forecast in 2006 and are no longer in play. So, while some growth has occurred within the TAD boundaries since 2006, the City is still struggling to recover fiscally from the severe economic and housing market downturn which occurred during and following the recession. The economic and fiscal justifications for creating TAD #2 are therefore more compelling in 2017 than they were when the Plan was first adopted more than a decade ago. Fulton County agreed to participate in TAD #2, but included in its consent a sunset provision which may limit the TAD s future financing capacity. The Fulton County School System s Board of Education (BOE) declined to consent to TAD #2 following its initial creation in After the BOE adopted a new policy toward Tax Allocation Districts, the City made a second, unsuccessful attempt to secure BOE consent in late Without the full participation of all three jurisdictions, the City will be unable to offer sufficient financial incentives to attract developers and implement redevelopment projects that are critical to the City s economic recovery. After several years of market inactivity, East Point has made recent progress in interesting developers to participate in its Downtown redevelopment efforts. The potential to resurrect some projects envisioned in 2006 has also increased the City s desire to obtain County and School District consent to TAD #2. Because of the market s recent improvement and emerging developer interest in TAD #2, the City has authorized the 2006 Redevelopment Plan to be amended reflect current economic conditions and present a realistic framework for County and School District participation. The scope of this plan amendment does not include changing the boundaries of or resetting the base value of TAD #2, and is limited to the following: 1. Updating the economic, demographic, and fiscal justifications for establishing TAD #2, to reflect market conditions as of early 2017; 1 The East Point Corridors Tax Allocation District and Redevelopment Plan was prepared for the City of East Point by Huntley Partners, Inc. of Atlanta, Georgia. The report was issued in December of Executive Summary (DRAFT) 4
5 2. Updating the list of potential redevelopment projects which remain possible under current economic conditions, IF adequate financial incentives can be leveraged through TAD #2 to make those projects financially feasible; 3. Reset the term the TAD will remain in effect, to preserve the option to issue TAD financing, should the City Council opt to do so; and 4. To comply with statutory changes made to the Redevelopment Powers Law since the 2006 Plan was prepared, particularly the requirements to prepare a School District Impact Analysis (Section (9)(R)). The following report contains much of the text of the original Redevelopment Plan and only updates those specific sections that have changed significantly since THE OPPORTUNITY AND VISION FOR THE REDEVELOPMENT AREA The overall purpose of the East Point Corridors Redevelopment Plan and Tax Allocation District (TAD) is to establish a financing mechanism to help facilitate recommended improvements which are outlined in this Plan. Specifically, the TAD was proposed for the following purposes: 1. To attract private, taxable redevelopment opportunities to the East Point Corridors sectors of the City of East Point. 2. To further the City s goals of improving underdeveloped urban areas as well as of attracting desirable development, including professional jobs. 3. To provide funding that, in turn, will attract additional regional, State and Federal funding to allow improvements to land use, transportation, and recreational areas. 4. To realize the full economic potential of an increasingly urbanized community. 5. To increase employment opportunities for residents of the TAD area and surrounding East Point neighborhoods. 6. To increase opportunities for market-driven residential and commercial development within the East Point Corridors area. 7. To overcome constraints to development generated by aged and obsolete commercial and residential structures, inefficient transportation infrastructure and inadequate physical connections to the surrounding community. Executive Summary 5
6 8. To achieve the basic goals that were stated in the LCI and Cleveland Avenue studies and incorporated into the redevelopment plan, as follows: Provide desirable residential product types in the central business district, preferably with an ownership preference. Provide additional retail, dining, entertainment and other commercial amenities such as better supermarkets within East Point. In addition, create a critical mass of people in the CBD sufficient to attract a destination retail market. Maximize land use advantages though the development of mixed-use projects allowing for live-work convenience to residents and closer retail in proximity to housing. Encourage development that will protect and enhance existing study area neighborhoods while connecting them to the civic and commercial center of the CBD. Enhance connectivity within and among East Point neighborhoods though the design, extension and general improvement of walking, bicycling and multi-use trails. Ensure the provision of sidewalks connecting open spaces and parks and allowing access to existing City amenities. Improve the possibilities for redevelopment of the surplus MARTA parking lot and Sylvan Road / Cleveland Avenue area. Improve the pedestrian environment (amenities, access, usability, traffic calming, lighting, personal safety) Increase usable greenspace/parks. Increase the tax base with which to fund basic city services. Create financing mechanisms, resources and incentives such as this Tax Allocation District to fund redevelopment. Create a better profile throughout Metro Atlanta with potential residents seeking unique, convenient, safe, community-oriented housing locations. Executive Summary 6

7 EAST POINT TAD #2 BOUNDARY The boundaries of the Redevelopment Area and Tax Allocation District #2 are shown on Map E-1 on the following page. The East Point Corridor TAD incorporates that portion of Cleveland Avenue stretching from the city limits of East Point and Atlanta one block west of I-85 to the Irene Kidd Parkway, where it continues to Church Street two blocks west of Main Street. The TAD also includes that portion of Main Street stretching from Vesta Avenue on the south to the City limits at Womack Avenue on the north. Additionally, the TAD incorporates the Washington Road corridor from the Central Business District to I-285, incorporating several commercial clusters along or in immediate proximity to Washington Road. MAP E-1: Executive Summary 7
8 LEGAL BASIS AND QUALIFYING CONDITIONS FOR THE TAD The City of East Point has the authority to exercise all redevelopment and other powers authorized or granted municipalities pursuant to the Redevelopment Powers Law (Chapter 44 of Title 36 of the O.C.G.A.), as approved by City voters by referendum. The redevelopment area qualifies as a TAD under the following specific definitions of the Redevelopment Powers Law under Sections (7), (A) and (B). Portions of the definition which are applicable to the East Point Corridors Redevelopment Area include the following: Criterion A: A "blighted or distressed area" is an area that is experiencing one or more conditions of blight as evidenced by: i ii iii The dilapidation, deterioration, age, or obsolescence of structures, buildings, or improvements; The presence of a predominant number of substandard, vacant, deteriorated, or deteriorating structures; the predominance of a defective or inadequate street layout or transportation facilities; or faulty lot layout in relation to size, accessibility, or usefulness Evidence of pervasive poverty defined as being greater than 10 percent of the population in the area as determined by current data from the United States Bureau of the Census, and an unemployment rate that is 10 percent higher than the state average; v. Any combination of the foregoing that substantially impairs or arrests the sound growth of the community; Criterion B: A "deteriorating area" is an area that is experiencing physical or economic decline or stagnation as evidenced by two or more of the following: i. The presence of a substantial number of structures or buildings that are 40 years old or older and have no historic significance); ii. High commercial or residential vacancies compared to the City as a whole; iii. Predominance of structures or buildings of relatively low value iv. Declining or stagnant rents ; As is discussed later in this report, East Point Corridors qualifies as a redevelopment area under the Redevelopment Powers Law due to its meeting and in most cases far exceeding the general criteria cited in the Law. Furthermore, this plan demonstrates that a continuation of the status quo is the least desirable and most costly financial outcome for the City, County, and School District. Executive Summary 8
9 The fundamental purpose of the East Point Corridors TAD Redevelopment Plan is to address the conclusion that the proposed East Point Corridors TAD area has not been subject to growth and development through private enterprise and cannot reasonably anticipate development without approval of this Plan. In addition, this area has been a long-established redevelopment priority. The East Point Corridors area has been designated as an area appropriate for redevelopment in the City of East Point Comprehensive Plan. Additionally, the City formally adopted the 2005 East Point Livable Centers Initiative plan and the 2006 Cleveland Avenue Corridor Study. The original and continuing intent of TAD #2 is to help leverage higher property tax collections within an area that was substantially under-performing in 2006 and remains under-performing in terms of property values and generation of tax revenues. The housing, retail and commercial redevelopment proposed for the tax allocation district would increase the City s existing property tax digest, by incentivizing redevelopment and helping to finance needed infrastructure improvements, which would not otherwise be financially feasible, at no additional cost to East Point taxpayers. In light of the TAD s actual performance over the past decade and the broader economic and fiscal issues facing East Point, the City has authorized the 2006 Redevelopment Plan to be amended in order to reflect current economic and market conditions. This amended redevelopment plan removes some of the original projects proposed in 2006, downsizes others, and focuses on more achievable near term opportunities that are focused primarily on MARTA-accessible downtown sites. The number and value of residential units forecast in the 2006 Plan, particularly forsale condominium products, has been substantially reduced to reflect market limitations on those products. Those housing adjustments in turn reduce population and school enrollment impacts that were forecast a decade ago. The City hopes that the County and School District will be more likely to consent to a Plan which focuses on achievable, near term projects, with more modest expectations and requiring smaller commitments of property tax increments. KEY REDEVELOPMENT CHALLENGES The City of East Point has invested substantial funds and effort to create a shared vision for its future, committing significant planning and other resources toward the revitalization and redevelopment of its Downtown and major commercial gateways into Downtown. The City s future challenge is to attract new private investment and create a density of population and economic activity that will be sufficient to support commercial success, within a city that has suffered from above average poverty and unemployment, stagnant population change and declining housing values. Older urbanized areas like Downtown East Point often suffer from surrounding development patterns, inadequate transportation facilities and antiquated infrastructure which do not support new development of a quality or character desired by community residents. The following specific observations were noted in Executive Summary 9
10 the 2006 Plan and summarize the specific challenges faced by, and reasons for designating the redevelopment area: (a) Structural Age and Deterioration: The majority of the retail buildings and apartments were constructed between 35 and 50 years ago. They have experienced only minor improvements since that time. Consequently, they are out of date and have become somewhat dilapidated due to the passage of time and frequent use. (b) Inefficient and Obsolete Commercial Design and Layout: The commercial centers and freestanding structures along the major roads within the East Point Corridors area are inefficient with respect to site use and density. Most are considered unattractive with respect to current retailer standards and obsolete with respect to consumer market appeal. Parking is inefficient, and store frontage and signage are below current market standards and design. (c) Lack of Retail Market Appeal: As reflected in both rent and sales, the limited number of retail businesses within the proposed East Point Corridors TAD do not have the brand recognition, product offerings, marketing capacity, pricing, merchandising or basic critical mass to appeal customers within either the primary or secondary retail markets. (d) Lack of Rental Revenue Generation: Commercial rental rates in the East Point Corridors Area are significantly below those achieved in developing Metro Atlanta neighborhoods. (e) Economic Underutilization of Developable Land: A significant proportion of developable land within the area is underutilized with respect to potential density, type of development and/or resulting market and taxable values. (f) Congested Access and Egress: The design and layout of the major roads and intersections within the East Point Corridors TAD contribute to traffic congestion and delays, particularly at major intersections at Cleveland Avenue and Norman Berry Drive; Irene Kidd Parkway at both Central Avenue and Main Street; Norman Berry Drive at Main Street; and Main Street at Willingham Drive. The area's internal network of feeder roadways is not conducive to the efficient flow of traffic into and out of the existing or contemplated retail, office and mixed-use projects in that area. The currently inadequate network of interior and residential streets within the area will become even less capable of handling both community and pass-through traffic. THE GOAL The creation of East Point TAD Number 2, known as East Point Commercial Corridors, is intended to provide the City with additional financial resources to attract private investment to key downtown development sites which are either served by or accessible to transit. The strategy envisioned in the TAD was to attract new development to the downtown area as a first step toward incrementally revitalizing the City s older established commercial districts. Increased future property tax revenues leveraged from Executive Summary 10
11 private investment within the TAD would also provide local funding to improve downtown streetscapes and infrastructure servicing development sites. The TAD s boundaries encompass the bulk of potential development sites in the core downtown area and, using the City s major commercial corridors, link a series of seven commercial clusters along or in close proximity to Washington Road. It was originally conceived that most of these clusters could accommodate mixed use development, and long range forecasts contained in the 2006 Plan included 1,950 residential units along with 717,000 SF of retail space, nearly 590,000 SF of office space and 200 hotel rooms. Characteristics of TAD #2 are summarized in Table E-1: Table E-1: East Point Tax Allocation District #2 - East Point Commercial Corridors - Parcel Information* Parcels (approximate)* 750 Acreage* TAD #2 Certified Base Digest $48,837, East Point Taxable (Digest) Value (M&O Portion) $911,372,181 TAD Certified Digest as a % of City s Taxable Value when created 5.4% 2016 East Point Taxable (Digest) Value (M&O Portion) $811,347,731 TAD Certified Digest as a % of City s 2016 Taxable Value 6.02% *TAD acreage and 2016 digest estimates are as reported by the Fulton County Assessor. Today, TAD#2 contains approximately 750 parcels covering nearly 295 taxable acres. In the decade following its creation in 2006, the taxable digest value of the district has increased from a base of $48.8 million to a 2016 digest of $55.6 million, according to Fulton County Assessment Department records. The total TAD digest has increased by a modest 14% over the decade, faster than the City but only a third of County and School District growth rates over the same period. The taxable real estate digest (40% value) within TAD #2 currently averages only $188,500 per acre (in 2016), far below forecast expectations made a decade ago. This low average value explains the City s desire to attract new, higher-density development into the most marketable locations along its under-valued and under-performing commercial corridors. Most importantly, the revitalization of these key areas was viewed as critical to stabilizing the value of the City s housing stock, which was aging and well below regional values when the TAD was formed. While some investment has occurred in TAD # 2 since 2006, the combination of recession and lack of financial resources has limited the TAD s value as a redevelopment incentive. The City s inability to achieve its redevelopment goals for TAD #2 has contributed to broader value declines elsewhere in the City. As illustrated in the following graphs, East Point s total taxable digest has decreased by 4% since 2000 and outside of the two TADs, digest values have fallen by more than $189 million (-22%). The fiscal implications of the status quo trends have thus been negative to all three taxing jurisdictions and there is no reason to expect that this 16-year negative growth trend will reverse itself, absent of achieving one or more game changing catalyst projects. After a decade of very limited success with the availability of City and County tax increment only, it is clear that Executive Summary 11
12 more financial assistance will be needed to attract desired development, on a sufficient scale, to positively impact existing conditions. Exhibit E-3: These graphs show the change in East Point s property tax digest by year, from 2000 through The top graph shows total Citywide digest change since The bottom compares digest growth in the City s two TAD s to the balance of the City. Digesr (40%) Value $1,200,000,000 $1,000,000,000 $800,000,000 $600,000,000 $400,000,000 Change in East Point M&O Tax Digest by Year: $200,000,000 $ Locations of Change in East Point's M&O Tax Digest by Year: $1,200,000,000 Balance of City Digest (40%) Value $1,000,000,000 $800,000,000 $600,000,000 $400,000,000 $200,000,000 $ TAD 1 TAD 2 Balance of City POTENTIAL REDEVELOPMENT PROJECTS The City had initially identified eleven potential redevelopment projects or project areas within TAD #2 where redevelopment efforts would be focused. These projects collectively represented the vision for the future of East Point as a mixed-use center and transit node, supported by attractive gateway corridors into downtown and multiple new development nodes near those commercial corridors. Together the projects involved more than 1.3 million SF of retail and office development, new hotels and more than 1,900 housing units, representing a combined construction cost of more than $500 million. Executive Summary 12
13 Table E-2: List of Proposed Projects 2006 Redevelopment Plan Corporate Office Townhomes MF Condos MF Apartments Site Retail (SF) Local Office (SF) (SF) Hotel (Rooms) (Units) (Units) (Units) 1 Buggy Works Expansion 70, , East Point Commons 52, Tri-Cities Plaza 100, MARTA South Parking Lot 50, , North Main District 25,000 25,000 50, North Main MXD 50,000 25, Central Main District 50,000 25,000 8 South Main District 50,000 10, SFMC Campus + King Bldg 175, Sylvan Road MXD Center 250,000 25, Wagon Works Expansion 20, Total 717, , , Source: East Point Corridors Tax Allocation District and Redevelopment Plan, 2006 Site With the passage of a decade and the impact of the Great Recession, most of the above list of projects are no longer financially feasible on the scale and in the time frame originally proposed. Some of these project sites have already been developed for similar or other uses or are otherwise no longer in play. In amending this redevelopment plan the City has evaluated and down-sized the original project list into six locations where redevelopment is most likely to be feasible, within a reasonable time period. Projects have also been re-scaled to reflect foreseeable, near-term market conditions and input the City has gathered from prospective developers. Residential impacts have also been substantially reduced, particularly for ownership products. Table E-3: Revised List of Proposed Projects 2017 Amended Redevelopment Plan Retail (SF) Local Office (SF) Corporate Office (SF) Hotel Townhomes (Rooms) (Units) Senior Housing (Units) MF Apartments (Units) 1 Buggy Works Expansion 50,000 25, East Point Commons 60, MARTA South Parking Lot 50,000 50, Central Main District 50,000 25,000 5 South Main District 50,000 10,000 6 Wagon Works Expansion 20,000 Total 280,000 60,000 50, The revised list of six projects appears in Table E-3. Development totals have been re-worked and focused on Downtown. If successful, these projects would still have Executive Summary 13
14 a positive economic and fiscal impact on the City, while generating minimal service costs impacts on the county and school system. The earliest of these projects to be implemented is the proposed East Point Commons, which is illustrated below the table. While the City would strongly consider proposals to invest TAD proceeds to support other redevelopment projects elsewhere in TAD #2, the following list of projects will be given priority in terms of focus and funding as it becomes available. Exhibit E-4: This exhibit shows a recent development concept for East Point Commons. The City and its Development Authority are actively negotiating to convey the assembled properties to a private developer. However, the project is not financially feasible without the investment of property tax increments contributed by all three taxing jurisdictions, through the TAD. TOTAL DEVELOPMENT POTENTIAL If these project areas are developed as forecast, BAG estimates that they could collectively support 390,000 SF of retail and office space, 120 hotel rooms and 580 residential units, including 180 units of senior housing. These estimates represent an approximate 70% reduction to both residential and commercial totals forecast in The primary adjustments made were the removal of for sale condominium units and a substantial reduction in retail and corporate office development. Revised retail totals also reflect and remove square footage that has already been developed. BAG estimates that when completed, these projects would have a full market value of nearly $126 million based on their current value. 2 The distribution the projects 2 Full market value in this context refers to the likely value assigned to completed developments by the Fulton County Tax Assessor. Full market value for tax purposes is different from, and should not be confused with, actual construction costs or sales prices. Executive Summary 14
15 market values by project and component is summarized in Table E-4. As shown, the largest investment is the East Point Commons, which accounts for nearly half of the estimated end value of the entire list. Table E-4: Estimated Full Market Value of Revised TAD Projects by Component 2017 Amended Redevelopment Plan Senior Multi-Family Project/Site Retail Office Hotel Townhomes Housing Apartments Total 1 Buggy Works Expansion $4,500,000 $2,375,000 $0 $24,000,000 $0 $0 $30,875,000 2 East Point Commons $5,400,000 $0 $0 $0 $25,200,000 $31,500,000 $62,100,000 3 MARTA South Parking Lot $4,500,000 $4,750,000 $9,600,000 $0 $0 $0 $18,850,000 4 Central Main District $4,500,000 $2,375,000 $0 $0 $0 $0 $6,875,000 5 South Main District $4,500,000 $950,000 $0 $0 $0 $0 $5,450,000 6 Wagon Works Expansion $1,800,000 $0 $0 $0 $0 $0 $1,800,000 Total $25,200,000 $10,450,000 $9,600,000 $24,000,000 $25,200,000 $31,500,000 $125,950,000 BAG further estimates that the projects listed in Table E-4 could potentially be built out over a 6 to 9-year period. The additional tax digest created by this new development, coupled with a most allowance for future appreciation and value change elsewhere in the TAD (based on historical value growth since 2006), would increase the TAD s digest from roughly $55.6 million (in 2016), to nearly $116.9 million in 10 years. Annual real estate taxes collected within the TAD by all jurisdictions would increase from $2.4 million currently to roughly $5.1 million by year 10, with approximately $2.1 million in taxes continuing to be received by the taxing jurisdictions respective general funds and the balance of nearly $3.0 million contributed as tax allocation increment to support redevelopment. This forecast appears in Table E-5. Executive Summary 15
16 Table E-5: Estimated TAD Revenues from Build Out of Revised TAD Projects 2017 Amended Redevelopment Plan Year (2017 = 1) TAD Base Digest Full Market Value of New Development Incremental Tax Digest from New Development Base Growth TOTAL TAD 2 Digest Total Tax Mils Base RE Taxes to General Funds Available Tax Allocation Increment 1 $48,837,930 $0 $0 $55,619,258 $55,619,258 $2,443,521 $2,145,597 $297,924 2 $48,837,930 $0 $0 $56,342,308 $56,342,308 $2,475,287 $2,145,597 $329,690 3 $48,837,930 $9,780,000 $3,912,000 $57,074,758 $60,986,758 $2,679,331 $2,145,597 $533,734 4 $48,837,930 $34,143,300 $13,657,320 $57,816,730 $71,474,050 $3,140,069 $2,145,597 $994,473 5 $48,837,930 $85,566,938 $34,226,775 $58,568,348 $92,795,123 $4,076,768 $2,145,597 $1,931,171 6 $48,837,930 $121,674,707 $48,669,883 $59,329,736 $107,999,619 $4,744,747 $2,145,597 $2,599,150 7 $48,837,930 $127,956,913 $51,182,765 $60,101,023 $111,283,788 $4,889,031 $2,145,597 $2,743,434 8 $48,837,930 $131,945,092 $52,778,037 $60,882,336 $113,660,373 $4,993,441 $2,145,597 $2,847,844 9 $48,837,930 $134,261,832 $53,704,733 $61,673,806 $115,378,539 $5,068,925 $2,145,597 $2,923, $48,837,930 $136,060,672 $54,424,269 $62,475,566 $116,899,835 $5,135,760 $2,145,597 $2,990, $48,837,930 $137,885,736 $55,154,294 $63,287,748 $118,442,043 $5,203,514 $2,145,597 $3,057, $48,837,930 $139,737,436 $55,894,974 $64,110,489 $120,005,464 $5,272,200 $2,145,597 $3,126, $48,837,930 $141,616,193 $56,646,477 $64,943,925 $121,590,403 $5,341,831 $2,145,597 $3,196, $48,837,930 $143,522,435 $57,408,974 $65,788,196 $123,197,170 $5,412,421 $2,145,597 $3,266, $48,837,930 $145,456,596 $58,182,638 $66,643,443 $124,826,081 $5,483,984 $2,145,597 $3,338, $48,837,930 $147,419,119 $58,967,648 $67,509,808 $126,477,455 $5,556,534 $2,145,597 $3,410, $48,837,930 $149,410,453 $59,764,181 $68,387,435 $128,151,616 $5,630,085 $2,145,597 $3,484, $48,837,930 $151,431,055 $60,572,422 $69,276,472 $129,848,894 $5,704,651 $2,145,597 $3,559, $48,837,930 $153,481,391 $61,392,556 $70,177,066 $131,569,622 $5,780,248 $2,145,597 $3,634, $48,837,930 $155,561,933 $62,224,773 $71,089,368 $133,314,141 $5,856,890 $2,145,597 $3,711, $48,837,930 $157,673,162 $63,069,265 $72,013,530 $135,082,795 $5,934,592 $2,145,597 $3,788, $48,837,930 $159,815,568 $63,926,227 $72,949,706 $136,875,933 $6,013,370 $2,145,597 $3,867, $48,837,930 $161,989,647 $64,795,859 $73,898,052 $138,693,910 $6,093,240 $2,145,597 $3,947, $48,837,930 $164,195,905 $65,678,362 $74,858,726 $140,537,088 $6,174,216 $2,145,597 $4,028, $48,837,930 $166,434,857 $66,573,943 $75,831,890 $142,405,832 $6,256,315 $2,145,597 $4,110, Year Totals $125,360,975 $53,639,919 $71,721,055 Future Revenues 6.0% $31,014,409 Source: Bleakly Advisory Group, Inc. POTENTIAL TAD FUNDING Should all three taxing jurisdictions commit their M&O millage to the TAD on the real estate (only), the above forecast could produce total estimated TAD proceeds of $71.7 million over 25 years. 3 This forecast represents an approximate 234% increase over likely tax revenues if existing conditions do not significantly change throughout the forecast. Of these estimated property tax increments pledged to the TAD, (and assuming that millage rates to not change significantly over the forecast), 3 We have used a 25-year forecast as representative of the total likely investment required of the taxing jurisdictions. The City will be requesting that the County and School District agree to extend the life of the TAD for a maximum of 30 years beginning from the City s point of signing a development agreement to provide TAD funding to a first project, or until all redevelopment costs are paid, whichever occurs first. Executive Summary 16
17 approximately $24.5 million would be contributed by the City, $17.1 million by Fulton County and $30.1 million by the School District. The balance of real estate tax collections from within the TAD of approximately $53.7 million over 25 years, would continue to be used for general fund purposes, along with tax revenues associated with growth in personal property tax digest associated with future retail, office and hotel development within the TAD. Table E-6: East Point TAD #2 East Point Commercial Corridors Potential Redevelopment Sites Potential Redevelopment Residential Units (Apartments, Townhomes & Senior Units) 580 Average Full Market Value/Unit $139,100 Commercial, Retail, Office & Hotel S.F. 444,000 Average Full Market Value/SF $ Future Market Value of TAD Projects at Build-out (Year 10) $136.0 Million Total TAD #2 Taxable Digest at Completion (Year 10) $116.9 Million Net New TAD Taxable Real Estate Digest at Completion $66.5 Million Total tax allocation increment to the TAD #2 Fund (Yr 10) $2.99 million Source: Developers, City of East Point and BAG BAG also estimates that the forecasted growth in tax increments could support potential financing or bond revenues of $31.0 million (net after issuance costs and reserves) for investment in redevelopment projects and additional public improvements. (This estimate assumes that approximately 70% to 80% of forecasted tax increments could be generated quickly enough to be pledged for financing purposes.) Should the Fulton County School System refuse to consent to the TAD, the amount of net proceeds available to invest in redevelopment projects (with City and County increments only) is reduced to roughly $17.5 million. This amount is unlikely to be sufficient to incentivize the quality or density of redevelopment needed to achieve the City s objectives and reduce long term trends. POTENTIAL INVESTMENTS OF TAD PROCEEDS Table E-7 distributes the estimated future TAD proceeds to each of the project sites listed in this Plan, based on the proportional share of future tax allocation increments those projects will create. Depending on the specific situation, TAD funds could be used to make public infrastructure improvements, build structured parking or provide direct financial incentives to developers to offset construction costs. Uses of TAD proceeds will be defined by the City of East Point during negotiations with individual developers on a case by case basis. Funding decisions will be based on the amount of incremental tax revenues those projects will generate, as well as the availability of current/future tax increments available to the TAD Special Fund. The City is committed to using TAD proceeds in most effective and appropriate manner allowed under the Redevelopment Powers Law, to achieve successful results. Executive Summary 17
18 Table E-7: Potential Uses of Estimated Future Proceeds TAD #2 - East Point Commercial Corridors Estimated Build Supportable Project/Site Out Value TAD Proceeds 1 Buggy Works Expansion $30,875,000 $7,602,678 2 East Point Commons $62,100,000 $15,291,539 3 MARTA South Parking Lot $18,850,000 $4,641,635 4 Central Main District $6,875,000 $1,692,904 5 South Main District $5,450,000 $1,342,011 6 Wagon Works Expansion $1,800,000 $443,233 Total $125,950,000 $31,014,000 The City recognizes that TAD #2 encompasses a larger area than is represented by these 6 projects listed above. Other, currently unforeseen projects may arise in the future, which merit public support. Although uses of TAD proceeds will be prioritized toward the projects listed in Table E-7, the City will also consider supporting other worthwhile redevelopment projects in TAD #2, if/when such opportunities arise. SCHOOL DISTRICT IMPACTS The fiscal consequences resulting from economic decline within older sections of East Point have been very detrimental to the FCSS for nearly two decades. Annual collections of school district taxes within the City have declined since the year 2000, while the number of students enrolled in the FCSS East Point Schools has steadily increased. The FCSS currently collects only 2.1% of all local school taxes from East Point residents and businesses, while nearly 8% of total District enrollment is based in schools that are physically located within the City limits. Local economic conditions have also made the task of educating students more challenging, as evidenced by above average child poverty rates, below average rates of home ownership, high percentages of single parent households and high mobility/turnover among the student population attending East Point Schools. A continuation of existing conditions in East Point will be costly to future FCSS operations and school performance. As demonstrated by the recent success of the City s Camp Creek TAD, potential impacts to the Fulton County Public Schools from participating in the proposed TAD #2 should be positive in the short term and very positive in the long term. Increased collections of personal property taxes from new commercial development and increased future e-splost revenues should be sufficient to offset a very marginal increase in school district enrollment, even while the TAD is in effect. Once the TAD is dissolved and real property taxes accrue to the School District, the Districts tax digest will be greatly increased over what is feasible absent of the TAD. Executive Summary 18
19 Impacts on the Fulton County Public School System from participating in East Point TAD #2 are as follows: The proposed TAD will affect the future appreciation on 0.16% (sixteen onehundredths of one percent) of the School s taxable digest. All current property taxes on real estate (roughly $902,700/year) will continue to go to the school system only increases above the current amount are pledged to the TAD. The redevelopment area will potentially attract 950 new residents and fewer than 60 school-aged children at build out, achieved after several years of construction. This represents an addition of 0.8% to the current enrollment of FCSS schools located within the City limits. There is one existing Fulton County School facility located inside the TAD boundary, Parklane Elementary School, which is located at 2809 Blount Street. (Parcel ID: LL018) When fully built out within roughly 10 years, the proposed redevelopment projects could collectively generate an additional $390,000 per year in net annual e-lost funds from new residents and businesses, during years in which the e-lost is in effect. In addition, increased commercial personal property digest, which is not pledged to the TAD, could generate roughly $280,000 per year in educational property taxes. Should the FCSS not consent to TAD #2 and as a result, no major redevelopment projects are implemented, it is likely that property values would continue to grow modestly, by the same average as occurred during the first decade since TAD #2 was formed. In such a case, the FCSS would instead receive an additional $8.0 million in increased real estate taxes from future value growth within TAD #2, cumulatively, over 25 years. 4 Maintaining status quo conditions in TAD #2 will also have no impact in reversing the long-term erosion of school tax revenues generated elsewhere in the City. By comparison, forecasted cumulative gains in e-lost and commercial personal property taxes from implementing the six identified TAD projects are estimated to total nearly $14.8 million to the FCSS over the same 25-year period. Increased FCSS revenues received from participating in the TAD, while it is in effect, thus exceed the modest amount of real estate taxes that might otherwise be collected by choosing to not to consent, if such a decision results in no major redevelopment occurring, and status quo conditions continue for another decade. More detailed findings are provided in the full report. 4 This estimate represents the incremental gain of 1.3% annual digest growth compounded, over existing FCSS revenues of $902,000 per year associated with the base value of the TAD. If the FCSS was currently participating in TAD #2, its total financial commitment to the TAD Special Fund would have been roughly $125,000 in Executive Summary 19
20 Tax Allocation District #2 - East Point Commercial Corridors INTRODUCTION In 2006, the City of East Point adopted a Redevelopment Plan (the Plan) creating Tax Allocation District #2 East Point Commercial Corridors (TAD #2). That Plan presented the justification, rationale, boundaries, fiscal data, and proposed projects which, at the time, were forecast to result from the establishment of TAD #2. The Redevelopment Plan was prepared in conformance with the provisions of the Georgia Redevelopment Powers Law (O.C.G.A. Title 36 Chapter 44) which governs the creation of the Tax Allocation Districts in the state. The Plan was prepared at the request of the City of East Point and duly adopted by resolution of the City Council. TAD #2 was later certified by the Georgia Commissioner of Revenue and became effective as of December 31, This document is intended to update and formally amend the original Plan, which is now more than 10 years old. The foundations for the original Redevelopment Plan and Tax Allocation District were assembled from earlier plans and sources that were compiled in 2005 and Those sources included (1) the 2005 City of East Point Livable Centers Initiative report prepared by Pond & Company in association with The Collaborative Firm, Sizemore Group and Market+Main; (2) the 2006 Cleveland Avenue Corridor Study: Masterplan prepared by Urban Studio, Inc. in association with WK Dickson & Co., Inc. and Iteris, Inc.; (3) the 2005 East Point MARTA Development: Real Estate Development Methods study prepared by the East Point MARTA Development Consultants team, and (4) the City of East Point s 2006 Comprehensive Plan Update. The Redevelopment Plan incorporated proposed projects and development forecasts contained in those studies, which were prepared during the high point of the housing market bubble which preceded the Great Recession. Due in part to the impacts of the last recession, which was unforeseen at the time the original Redevelopment Plan was prepared, several of the projects upon which TAD #2 was based have failed to materialize more than a decade later. Some of the identified redevelopment sites in that plan are also less likely to become available for redevelopment in the near term. So, while some growth has occurred within the TAD boundaries since 2006, the City is still struggling to recover fiscally from the severe economic and housing market downturn which occurred during and following the recession. The economic and fiscal justifications for creating TAD #2 are therefore equally or more compelling in 2017 as they were when the Plan was first adopted more than a decade ago. Fulton County agreed to participate in TAD #2, but included in its consent a sunset provision which may limit the TAD s future financing capacity. The Fulton County School System s Board of Education (BOE) declined to consent to TAD #2 following its initial creation in After the BOE adopted a new policy toward Tax Allocation Districts, the City made a second, unsuccessful attempt to secure BOE consent in late Without the full participation of all three jurisdictions, the City will be unable to offer sufficient financial incentives to attract developers and implement redevelopment projects that are critical to the City s economic recovery. Introduction 20
21 After several years of market inactivity, the City has made recent progress in interesting developers to participate in its Downtown redevelopment efforts. The potential to resurrect some projects envisioned in 2006 has also increased the City s desire to obtain County and School District consent to TAD #2. Because of the market s recent improvement and emerging developer interest in TAD #2, the City has authorized Bleakly Advisory Group (BAG) to update and amend the 2006 Redevelopment Plan to reflect current economic conditions and present a realistic framework for County and School District participation. The scope of this plan amendment does not include changing the boundaries of or resetting the base value of TAD #2, and is limited to the following: 1. Updating the economic, demographic, and fiscal justifications for establishing TAD #2, to reflect market conditions as of early 2017; 2. Updating the list of potential redevelopment projects which remain possible under current economic conditions, IF adequate financial incentives can be leveraged through TAD #2 to make those projects financially feasible; 3. Reset the term the TAD will remain in effect, to preserve the option to issue TAD financing, should the City Council opt to do so; and 4. To comply with statutory changes made to the Redevelopment Powers Law since the 2006 Plan was prepared, particularly the requirements to prepare a School District Impact Analysis (Section (9)(R)). The following report retains much of the text of the original Redevelopment Plan and only updates those specific sections that have changed significantly since PROPOSAL AND GROUNDS FOR EXERCISE OF REDEVELOPMENT POWERS GEOGRAPHIC BOUNDARIES (A) The East Point Corridor TAD incorporates that portion of Cleveland Avenue stretching from the city limits of East Point and Atlanta one block west of I-85 to the Irene Kidd Parkway, where it continues to Church Street two blocks west of Main Street. The TAD also includes that portion of Main Street stretching from Vesta Avenue on the south to the City limits at Womack Avenue on the north. Additionally, the TAD incorporates the Washington Road corridor from the Central Business District to I-285, incorporating several commercial clusters along or in immediate proximity to Washington Road. The following series of maps show the regional setting of the Redevelopment Area, followed by the TAD boundary map and enlarged insets showing the key redevelopment opportunities / sites within the TAD. Proposal (DRAFT) 21

22 Regional Setting and Major Roadways. Proposal (DRAFT) 22
23 Tax Allocation District #2 - East Point Commercial Corridors Map 1: TAD #2 Boundary Map (L) Proposal (DRAFT) 23

 North Main District (2)")
24 Tax Allocation District #2 - East Point Commercial Corridors Map 2: East Point Corridor TAD Boundaries: Enlarged Sub Areas Cleveland Avenue Corridor (1) North Main District (2) Proposal (DRAFT) 24
")
")
25 Central and South Main District (3) Washington Road Corridor - North (4) Proposal (DRAFT) 25

26 Washington Road Corridor - South (5) HOW RESIDENTS IN EAST POINT AND FULTON COUNTY WILL BENEFIT OVERVIEW OF TAX ALLOCATION DISTRICTS Tax allocation districts are Georgia s version of tax increment financing. Tax increment financing is a redevelopment funding mechanism that reinvests the future taxes from real estate development back into a project either (a) directly, as an incentive to attract new private investment into an area or (b) indirectly by paying for public improvements that could not be absorbed as a private development cost. As described by the Council of Development Finance Agencies. ( TIF was created and first used in California in Hundreds of TIF districts have helped spur urban redevelopment in cities across the country. Today, all 50 states and the District of Columbia use tax increment financing in some form. In 1985, the Georgia General Assembly authorized formation of Georgia s form of tax increment financing called Tax Allocation Districts (TADs). The purpose of a Georgia tax allocation district is similar to tax increment financing in any other state. A TAD allows increased property taxes generated by new development within the designated district to be used to finance costs related to the development, such as public infrastructure, land acquisition, relocation, demolition, parking structures, Proposal (DRAFT) 26
27 utilities, debt service and planning costs. Other allowed uses of TAD proceeds include: Sewer expansion and repair Storm drainage Street construction and expansion Water supply improvements Park improvements Bridge construction and repair Curb and sidewalk work Grading and earthwork Traffic control Cities and counties throughout Georgia have created TADs to stimulate major new construction and renovation or rehabilitation in underdeveloped or blighted areas. Nearly 80 Georgia cities and counties have either created or are considering establishing TADs in their communities. There were also several existing TAD s in Fulton County as of the end A TAD offers local governments the opportunity to promote worthwhile redevelopment projects that would otherwise not be financially viable, or are located in areas which would otherwise be unattractive to private investment. Prior to the last Recession in 2008 and 2009, other Georgia tax allocation districts such as Atlantic Station (Midtown Atlanta) and the Camp Creek Marketplace in East Point, demonstrated the economic benefits which TADs can generate. These benefits include: A stronger economic base TAD incentives can attract private development that would not otherwise have occurred absent of the District designation. The halo effect Several Georgia TADs have generated significant new investment in areas surrounding the TAD as well as within the tax allocation districts, further expanding positive economic impacts to the host taxing jurisdictions. No impact on current tax revenues Redevelopment is effectively promoted without tapping into existing general governmental revenues or levying special assessments on property owners. Expands the local tax base By stimulating economic activity, TAD s expand the local tax digest, create additional demand for retail sales and as a result, local sales taxes and SPLOST revenues. Is self-financing TADs are self-financing, since they are funded by the increased tax revenues from new development within the district. High leverage Typically TAD funds represent between 5-15% of project costs, leveraging 7-20 times their value in private investment. Proposal (DRAFT) 27
28 Tax Allocation District #2 - East Point Commercial Corridors In summary, a tax allocation district is a financing mechanism that can be used to pay for public infrastructure or reduce private development costs, to make an underutilized area attractive to private investment and development, at no additional cost to local taxpayers. Establishing a TAD does not create a tax increase for either the community or property owners within the District. Nor does a TAD reduce tax revenues to the community, below levels which existed at the time the District was certified. In many cases, TADs can increase general fund revenues from new business personal property taxes, added county sales taxes, hotel/motel taxes, business license fees and other revenues which are not pledged for redevelopment purposes and would not otherwise occur. GROUNDS FOR EXERCISE OF REDEVELOPMENT POWERS (B) Tax Allocation Districts are authorized in Georgia under the Redevelopment Powers Law, O.C.G.A. Title 36, Chapter 44. In 2009, the Redevelopment Powers Law was amended again, with the following definition of a redevelopment area. Redevelopment area means an urbanized area as determined by current data from the US Bureau of the Census or an area presently served by sewer that qualifies as a blighted or distressed area, a deteriorating area, or an area with inadequate infrastructure as follows: (A) A blighted or distressed area is an area that is experiencing one of more conditions of blight as evidenced by: (i) The presence of structures, buildings, or improvements that by reason of dilapidation; deterioration; age; obsolescence; inadequate provision for ventilation, light, air, sanitation, or open space; overcrowding; conditions which endanger life or property by fire or other causes; or any combination of such factors, are conducive to ill health, transmission of disease, infant mortality, high unemployment, juvenile delinquency, or crime and are detrimental to the public health, safety, morals, or welfare; (ii) Is substantially underutilized by containing open lots or parcels of land; (iii) Contains a predominant number of substandard, vacant, deteriorated, or deteriorating structures, the predominance of a defective or inadequate street layout, or transportation facilities; or faulty lot layout in relation to size, accessibility, or usefulness; (iv) Evidence of pervasive poverty, defined as being greater than 10 percent of the population in the area as determined by current data from the U.S. Bureau of the Census, and an unemployment rate that is 10 percent higher than the state average; (v) Adverse effects of airport or transportation related noise or environmental contamination or degradation or other adverse environmental factors that the political subdivision has determined to be impairing the redevelopment of the area; or (vi) The existence of conditions through any combination of the foregoing that substantially impair the sound growth of the community and retard the provision of housing accommodations or employment opportunities; (B) A deteriorating area is an area that is experiencing physical or economic decline or stagnation as evidenced by two or more of the following: (i) The presence of a substantial number of structures or buildings that are 40 years old or older and have no historic significance; (ii) High commercial or residential vacancies compared to the political subdivision as a whole; Method of Financing/Proposed Public Investments (DRAFT) 28
29 (iii) The predominance of structures or buildings of relatively low value compared to the value of structures or buildings in the surrounding vicinity or significantly slower growth in the property tax digest than is occurring in the political subdivision as a whole; (iv) Declining or stagnant rents or sales prices compared to the political subdivision as a whole; (v) In areas where housing exists at present or is determined by the political subdivision to be appropriate after redevelopment, there exists a shortage of safe, decent housing that is not substandard and that is affordable for persons of low and moderate income; (vi) Deteriorating or inadequate utility, transportation, or transit infrastructure; and (C) An area with inadequate infrastructure means an area characterized by: (i) Deteriorating or inadequate parking, roadways, bridges, pedestrian access, or public transportation or transit facilities incapable of handling the volume of traffic into or through the area, either at present or following redevelopment; or (ii) Deteriorating or inadequate utility infrastructure either at present or following redevelopment. -Georgia Redevelopment Powers Law WHY THE EAST POINT CORRIDORS STUDY AREA QUALIFIES AS A REDEVELOPMENT AREA The City of East Point has the authority to exercise all redevelopment and other powers authorized or granted municipalities pursuant to the Redevelopment Powers Law, as now or hereafter amended by virtue of a successful City voter referendum. The following section addresses how the proposed Redevelopment Area qualifies as meeting the conditions described in O.C.G.A. Section subsections A, B and C presented above. 5 It should be noted that the presence of substandard buildings is not necessarily prevalent throughout the entire Redevelopment Area, due in part to actions already taken. TAD#2 is envisioned as a catalyst to start new economic activity in Downtown East Point, that will eventually spread to other portions of the Redevelopment Area, and where the following conditions are prevalent: The following specific observed conditions were noted in the 2006 Plan illustrate the qualifying definition of a redevelopment area: (a) Structural Age and Deterioration: The majority of the retail buildings and apartments were constructed between 35 and 50 years ago. They have experienced only minor improvements since that time. Consequently, they are out of date and have become somewhat dilapidated due to the passage of time and frequent use. (b) Inefficient and Obsolete Commercial Design and Layout: The commercial centers and freestanding structures along the major roads within the East Point Corridors area are inefficient with respect to site use and density. Most are 5 The discussion in this section addresses the City of East Point rather than the 294-acre Redevelopment Area, which is primarily commercial in nature. Characteristics of the relatively small population that resides within TAD #2 are assumed to be similar to the City as a whole. Tax Allocation Bond Issues (O, P, Q) (DRAFT) 29
30 considered unattractive with respect to current retailer standards and obsolete with respect to consumer market appeal. Parking is inefficient, and store frontage and signage are below current market standards and design. (c) Lack of Retail Market Appeal: As reflected in both rent and sales, the limited number of retail businesses within the proposed East Point Corridors TAD do not have the brand recognition, product offerings, marketing capacity, pricing, merchandising or basic critical mass to appeal customers within either the primary or secondary retail markets. (d) Lack of Rental Revenue Generation: Commercial rental rates in the East Point Corridors Area are significantly below those achieved in developing Metro Atlanta neighborhoods. (e) Economic Underutilization of Developable Land: A significant proportion of developable land within the area is underutilized with respect to potential density, type of development and/or resulting market and taxable values. (f) Congested Access and Egress: The design and layout of the major roads and intersections within the East Point Corridors TAD contribute to traffic congestion and delays, particularly at major intersections at Cleveland Avenue and Norman Berry Drive; Irene Kidd Parkway at both Central Avenue and Main Street; Norman Berry Drive at Main Street; and Main Street at Willingham Drive. The area's internal network of feeder roadways are not conducive to the efficient flow of traffic into and out of the existing or contemplated retail, office and mixed-use projects in that area. The currently inadequate network of interior and residential streets within the area will become even less capable of handling both community and pass-through traffic. (g) City Redevelopment Priority: The East Point Corridors area has been designated as an area appropriate for redevelopment in the City of East Point Comprehensive Plan. Additionally, the City formally adopted the 2005 East Point Livable Centers Initiative plan and the 2006 Cleveland Avenue Corridor Study. The Comprehensive Plan is updated on an annual basis, and the recommendations of this plan are anticipated to be considered during the update process. (h) Pervasive Poverty and High Unemployment: The redevelopment area is primarily nonresidential in character, with more than 89% of the TAD s taxable land area classified as commercial or industrial property. Poverty and resident unemployment data were not collected for the small population that resides within the redevelopment area. However, City-wide data are likely to be a conservative reflection of localized conditions, as the redevelopment area s population is likely to be less affluent that the City as a whole. The 2017 median household income in East Point is estimated to be $40,340, which is 34% lower than the median household income in Fulton County ($61,084), or the median income for the Metro-Atlanta region ($60,749). More than 19% of the City s 14,700 households are estimated to currently earn incomes below $15,000 per year, a higher percentage than Fulton County (14%) and all Metro-Atlanta households (11%) within this same income bracket. And, according to the US Tax Allocation Bond Issues (O, P, Q) (DRAFT) 30

31 Census Bureau s American Community Survey, nearly 28% of the City s population earned incomes below the poverty level in 2015, roughly double the State average. This number included nearly 19% of all families with children. The unemployment rate among East Point residents was estimated in late 2016 at 7.7%, two full percentage points above Georgia s 5.2% unemployment. The redevelopment area therefore greatly exceeds both minimum thresholds for satisfying the statutory definition of pervasive poverty and high unemployment. Comparative historic unemployment rates. Source: Civic Dashboards, from US Bureau of Labor Statistics, Local Area Unemployment Statistics. (i) According to Claritas, Inc., approximately 28% of the housing supply in East Point consists of multi-family units and 52% of all existing housing is estimated to be renter occupied. The median age of existing housing is 46 years and 64% of all housing is estimated to have been built prior to The median value of owner occupied housing is estimated at $107,121, only 39% of the current median value of all owner-occupied housing in Fulton County ($276,825) and 56% of the Metro Atlanta median value of $191,671. As these numbers indicate, East Point possesses the presence of a substantial number of structures or buildings that are 40 years old or older and have no historic significance; and the predominance of structures or buildings of relatively low value compared to the value of structures or buildings in the surrounding vicinity. The City s housing stock also exhibits declining or stagnant rents or sales prices. Tax Allocation Bond Issues (O, P, Q) (DRAFT) 31


32 In summary, East Point Corridors qualifies as a redevelopment area under the Redevelopment Powers Law due to its meeting and in most cases exceeding the general criteria cited in the Law. The overall purpose of TAD #2 is to address and resolve the key challenges, conditions and barriers to private investment. East Point envisions its downtown to be a significantly larger, higher-density, mixed-use node which combines residential, retail, office, and public uses, served by transit. Improvement of the major gateways to downtown, represents an essential building block to support revitalization of this business district, consistent with the community s vision. If successful, a revitalized and growing downtown is expected to make other portions of the redevelopment area more viable economically and create opportunities to make comparable improvements to those areas. Absent of TAD #2, East Point lacks alternative resources to finance parking, build infrastructure and improve public amenities, which are essential to drawing private investment to the City. The following photos were taken within the East Point Corridors redevelopment area back in These conditions remain representative of the conditions cited above, that qualify the area as a TAD under the Redevelopment Powers Law. Tax Allocation Bond Issues (O, P, Q) (DRAFT) 32

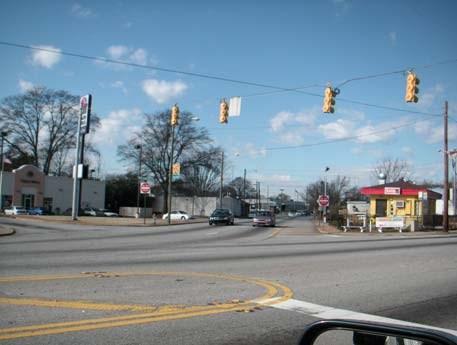

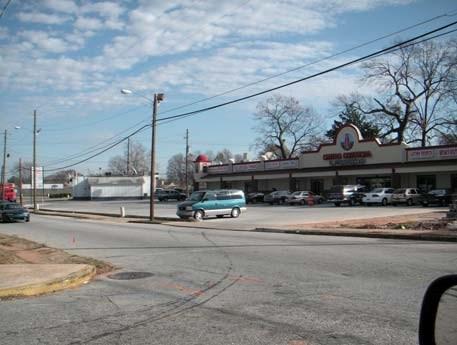
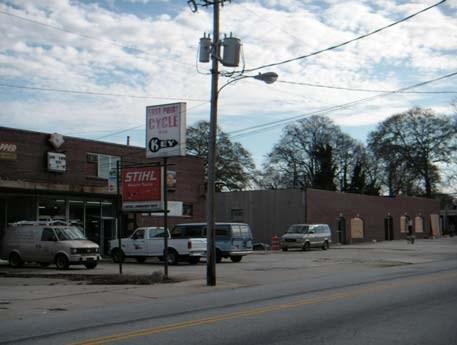
33 Tax Allocation Bond Issues (O, P, Q) (DRAFT) 33

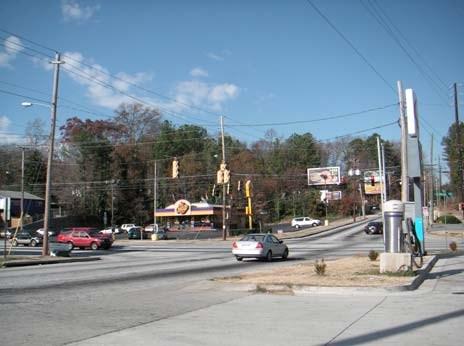


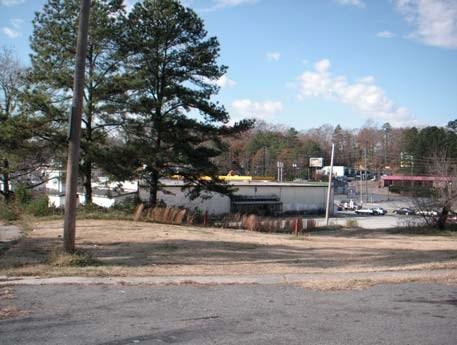
34 Tax Allocation Bond Issues (O, P, Q) (DRAFT) 34
35 MARKET AND DEMOGRAPHIC CONDITIONS According to Fulton County assessment data, as of 2016 TAD #2 contained 4.2% of the City s land area, and contributed a slightly higher percentage (6.9%) of the City s total tax digest. This is due to the fact that only 10.6% of TAD #2 s land area is residential, whereas Citywide, 59% of all taxable acreage is residentially classified. On a per acre basis, the taxable digest of residential property classifications in East Point average only $57,600 per acre, compared to nearly $239,000 of tax digest generated per acre of commercial land use. Within TAD #2, residential development has a slightly higher value of $63,000 per acre, because of higher residential density within the district. In terms of commercial tax digest, the value of real estate in TAD #2 averages roughly $220,400 per acre, compared to a City average of more than $238, Adjusted for the omission of personal property digest from TAD #2, commercial real estate values are comparable to the City average. However, it should be noted that with few exceptions, the value of taxable property in most East Point locations is very low compared to Fulton County and the Atlanta Region. Excluding the Camp Creek Marketplace in TAD #1, most developed commercial buildings in East Point are old and under-performing. In several respects, most of the City meets the definition of a redevelopment area under the statute. For that reason, the following trend data are reported City wide and demonstrate the City s fiscal challenges and resulting consequences to the County and School District. Demographic Characteristics TAD #2 Real Estate Digesr (40%) Value $70,000,000 $60,000,000 $50,000,000 $40,000,000 $30,000,000 $20,000,000 $10,000,000 $0 Change in East Point Corridors TAD #2 Tax Digest: Base Exhibit 3: The taxable real estate digest of TAD #2 resumed growth after bottoming out in Current values are still below the TAD s 2008 peak. Relevant characteristics of the City and the Redevelopment Area are summarized in the following paragraphs. 6 Commercial digest calculations are not strictly comparable. City-wide digest calculations include personal property value, while the TAD digest does not. Personal property tax increment is not pledged to either of East Point s two existing Tax Allocation Districts. Tax Allocation Bond Issues (O, P, Q) (DRAFT) 35
36 Population - The City of East Point has experienced dramatic population losses since 2000, in stark contrast to a growing County and Metro-Area. 7 From 2000 to 2017, East Point s population declined by more than 2,500 residents (-7%), while Fulton County s population grew by nearly 216,000 (26%) and the Metro-Atlanta region added nearly 1.6 million new residents. The City s recovery from population losses prior to 2010 has been slowed by Table 1: Population and Household Trends Population East Point Fulton County Atlanta Metro 2000 Census 39, ,971 4,263, Census 33, ,581 5,286, Estimate 36,506 1,031,774 5,843, Projection 38,230 1,101,874 6,234,160 CAGR Growth % 1.4% 1.9% CAGR (Fcst) % 1.3% 1.3% Households East Point Fulton County Atlanta Metro 2000 Census 14, ,218 1,559, Census 13, ,377 1,943, Estimate 14, ,714 2,158, Projection 15, ,688 2,307,874 CAGR Growth % 1.7% 1.9% CAGR (Fcst) % 1.5% 1.3% New Households , , Est. Average Household Size high vacancy rates created during the Great Recession, and the absence of new residential construction during this decade. The City s population is projected to resume nominal growth over the next five years, but remain well below county and regional averages. Households - The City has gained only 400 net new households since From 2000 to 2010, the City of East Point lost 1,000 households, and has only recently recovered those losses. During the same period the number of households in Fulton County increased by more nearly 107,500 (33%) and the number of households in the Atlanta region grew by nearly 38%. Modest household growth has resumed within the City since 2010, due to a reduction in rental market vacancy rates and the transition of foreclosed single family homes to rental housing. Sustaining future household growth over the next decade will require a resumption of new housing construction. Using TAD incentives to incentivize transit oriented development presents the best (and possibly only) opportunity for East Point to create any new housing within TAD #2. 7 Data reported in this section was obtained from the Nielson Company (Pop-Facts Demographic Snapshot 2017 Report). Tax Allocation Bond Issues (O, P, Q) (DRAFT) 36
37 Table 2: Household Income Distribution Household Income East Point Fulton County Atlanta Metro 2017 Est. Median Household Income $ 40,340 $ 61,084 $ 60,749 % of County Median Income Households by Income 66% 101% 100% HH with income >$15K 2,811 19% 58,621 14% 226,770 11% HH with income $15K - $35K 3,738 25% 74,867 17% 394,543 18% HH with income $35K - $50K 2,236 15% 50,766 12% 291,638 14% HH with income $50K - $100K 4,198 29% 111,245 26% 651,527 30% HH with income > $100K 1,707 12% 133,215 31% 594,100 28% Household Incomes Income levels among households living in East Point are substantially below those of the County and surrounding Region. The City s median household income is estimated at only $40,340 in 2017, 34% lower than the Fulton County median ($61,084). At the same time,19% of City households earn annual incomes of below $15,000 and only 12% earned incomes of more than $100,000 per year, the near opposite income distribution that is present in Fulton County. This lower income distribution appears to be attributable to the fact that more than half of East Point households are renters and the household population is slightly younger that the surrounding region. Many of these households are also living below the poverty level. Households Characteristics East Point has a smaller percentage of married couple families, a smaller percentage of families with children and a significantly higher percentage of female-headed households (both with and without children living at home) than either Fulton County or the Metro Atlanta Region. The smaller percentage of married, dual income households partly explains the income disparity shown in Table 2. Tax Allocation Bond Issues (O, P, Q) (DRAFT) 37
38 Table 3: Selected Household Characteristics Household Characteristics 2017 Est. Households by Household Size City of East Point 14,690 Fulton County 428,714 Metro Atlanta 2,158,578 1-person 5,056 34% 157,538 37% 559,953 26% 2-person 4,161 28% 123,514 29% 641,720 30% 3-person 2,361 16% 62,008 14% 373,946 17% 4-person 1,510 10% 48,309 11% 316,280 15% 5-person 800 5% 22,145 5% 155,860 7% 6-person 423 3% 9,129 2% 66,687 3% 7-or-more-person 379 3% 6,071 1% 44,132 2% 2017 Est. Average Household Size Est. Family HH Type by Presence of Own Child. 8, ,303 1,467,253 Married-Couple Family, own children 1,507 18% 71,763 30% 498,728 34% Married-Couple Family, no own children 2,227 26% 79,494 34% 536,547 37% Male Householder, own children 393 5% 7,539 3% 48,466 3% Male Householder, no own children 595 7% 10,203 4% 55,820 4% Female Householder, own children 2,049 24% 38,113 16% 189,337 13% Female Householder, no own children 1,790 21% 28,191 12% 138,355 9% 2017 Est. Households by Presence of People Under 18 14, ,714 2,158,578 Households with 1 or More People under Age 18: 4,882 33% 130,675 30% 823,068 38% Married-Couple Family 1,738 36% 75,216 58% 531,504 65% Other Family, Male Householder % 9,118 7% 59,365 7% Other Family, Female Householder 2,578 53% 45,387 35% 225,393 27% Nonfamily, Male Householder 32 1% 602 0% 4,816 1% Nonfamily, Female Householder 20 0% 352 0% 1,990 0% Households with No People under Age 18: 9,808 67% 298,039 70% 1,335,510 62% Married-Couple Family 1,995 20% 76,044 26% 503,733 38% Other Family, Male Householder 473 5% 8,616 3% 45,011 3% Other Family, Female Householder 1,257 13% 20,918 7% 102,268 8% Nonfamily, Male Householder 2,952 30% 92,298 31% 317,827 24% Nonfamily, Female Householder 3,131 32% 100,163 34% 366,671 27% Housing Tenure East Point has a dramatically lower rate of home ownership than the County and Region. Only 48% of existing housing in East Point is estimated to be owner-occupied in The percentage of homeowners is lower than Fulton County, where more than 53% of all housing is owneroccupied, even including the City of Atlanta, and substantially lower than the Atlanta Region, where only 34% of all households are renters. In addition, roughly 32% of the City s existing housing inventory (more than 5,900 units) is found in large multi-family buildings containing 5 or more units, while nearly 7,700 households are renters, suggesting that a significant percentage of these households rent single family homes rather than apartments. Housing Value Owner occupied housing in East Point is older and much lower valued than the County and Region. The median age of all owneroccupied housing in 2017 is estimated at 47 years, with only 27% of all units constructed since By comparison, the median age of all homes in Fulton County is only 25 years and 35% of the total inventory has been constructed since The age distribution of homes in East Point also translates to lower Tax Allocation Bond Issues (O, P, Q) (DRAFT) 38
39 average home values, with a median value of $107,121 and 46% of the inventory valued below $100,000. This median value is 2.6 times below that of Fulton County ($276,285), where only 17% of owner housing is valued below $100,000. Table 4: Selected Housing Characteristics Housing Characteristics Tenure % Owners East Point 48% Fulton County 53% Atlanta Metro 66% % Renters 52% 47% 34% Total Occupied Housing Units 14, ,714 2,158,578 Renter-Occupied Units 7, , ,934 Owner-Occupied Units 7, ,790 1,421,644 Owner Units Valued < $100K 3,250 46% 37,825 17% 269,687 19% Owner Units Val $100K-$200K 2,675 38% 48,073 21% 479,757 34% Owner Units Val $200K-$500K % 88,063 38% 530,111 37% Owner Units Val > $500K 159 2% 54,829 24% 142,089 10% Age of Housing Units Built since ,181 27% 175,017 32% 855,503 31% Units Built ,591 8% 141,473 26% 868,474 31% Units built pre ,760 65% 237,095 43% 1,054,550 38% Median age of housing unit (Years) Type of Housing 1 Unit Detatched (SF) 10,152 55% 233,682 48% 1,592,775 69% 1 Unit Attached (TH) 639 3% 32,536 7% 123,354 5% Small Multi-Family (2-4 Units/Bldg.) 1,762 10% 27,341 6% 97,981 4% Lg Multi-Family (5+ Units/Bldg.) 5,949 32% 194,267 40% 508,127 22% Development Density and Tax Revenues East Point is substantially underperforming in terms of its economic value and contribution of property tax revenues to the County and School District. Even though the City is largely built out and well located with respect to highway access, transit service and proximity to Hartsfield Jackson International Airport, the taxable digest within the entire city averages approximately $114,500 per acre. On a per acre basis, East Point produced an average of only $5,032 in combined City, County and School District general fund taxes in Tax values are also lower today than a decade ago when TAD #2 was created. The City is clearly under-performing its economic/fiscal potential as defined in the Redevelopment Powers Law, a factor which is equally true of the redevelopment area, with resulting negative fiscal consequences to both the County and School District. Specific revenue implications to the FCSS are discussed in the School District impact analysis section of this report. SUMMARY OF MARKET CONDITIONS RELATING TO THE QUALIFICATION AS A REDEVELOPMENT AREA In summary, designation of TAD #2 as a Redevelopment Area was fully justified in 2006, based on the statutory criteria at the time. Economic and fiscal conditions in East Point have not improved since the TAD was created and remain equally or more valid today. The experience of the past decade provides strong evidence to Tax Allocation Bond Issues (O, P, Q) (DRAFT) 39
40 suggest that the City s is unlikely to be successful in improving existing conditions within the TAD, absent of support from both the County and School District. PLAN VISION AND GOAL The overall purpose of the East Point Corridors Redevelopment Plan and Tax Allocation District (TAD) is to establish a financing mechanism to help facilitate recommended improvements which are outlined in this Plan. Specifically, the TAD is proposed for the following purposes: 1. To attract private, taxable redevelopment opportunities to the East Point Corridors sectors of the City of East Point. 2. To further the City s goals of improving underdeveloped urban areas as well as of attracting desirable development, including professional jobs. 3. To provide funding that, in turn, will attract additional regional, State and Federal funding to allow improvements to land use, transportation, and recreational areas. 4. To realize the full economic potential of an increasingly urbanized community. 5. To increase employment opportunities for residents of the TAD area and surrounding East Point neighborhoods. 6. To increase opportunities for market-driven residential and commercial development within the East Point Corridors area. 7. To overcome constraints to development generated by aged and obsolete commercial and residential structures, inefficient transportation infrastructure and inadequate physical connections to the surrounding community. 8. To maximize the tax revenue potential of the TAD area while achieving the following basic goals that were reiterated in the LCI and Cleveland Avenue studies and incorporated into the redevelopment plan, as follows: Provide desirable residential product types in the central business district, preferably with an ownership preference. Provide additional retail, dining, entertainment and other commercial amenities such as better supermarkets within East Point. In addition, create a critical mass of people in the CBD sufficient to attract a destination retail market. The boundaries of those study areas are shown on the following maps. Tax Allocation Bond Issues (O, P, Q) (DRAFT) 40


41 East Point LCI Study Area Many of the findings of the East Point LCI and Cleveland Avenue Corridor studies were incorporated into the findings of the 2006 TAD Redevelopment Plan. The Study Areas of those reports are indicated in these accompanying maps. Cleveland Avenue Corridor Study Area Tax Allocation Bond Issues (O, P, Q) (DRAFT) 41
42 Plan Vision and Goals (continued). Maximize land use advantages though the development of mixed-use projects allowing for live-work convenience to residents and closer retail in proximity to housing. Encourage development that will protect and enhance existing study area neighborhoods while connecting them to the civic and commercial center of the CBD. Enhance connectivity within and among East Point neighborhoods though the design, extension and general improvement of walking, bicycling and multi-use trails. Ensure the provision of sidewalks connecting open spaces and parks and allowing access to existing City amenities. Improve the possibilities for redevelopment of the surplus MARTA parking lot and Sylvan Road / Cleveland Avenue area. Improve the pedestrian environment (amenities, access, usability, traffic calming, lighting, personal safety) Increase usable greenspace/parks. Increase the tax base with which to fund basic city services. Create financing mechanisms, resources and incentives such as this Tax Allocation District to fund redevelopment. Create a better profile throughout Metro Atlanta with potential residents seeking unique, convenient, safe, community-oriented housing locations. PROPOSED LAND USES AFTER REDEVELOPMENT (C) The 2006 Redevelopment Plan identified several locations within the City where it was physically possible to achieve the above goals, given market conditions at the time the Plan was prepared. Proposed land uses and redevelopment projects had been developed in previous planning studies and were illustrated in the report. In total, eleven project areas were outlined in the original plan, as summarized in Table 5. Tax Allocation Bond Issues (O, P, Q) (DRAFT) 42
 (Units) 1 Buggy Works Expansion 70,000 150,000 150 2 East Point Commons 52,000 350 3 Tri-Cities Plaza 100,000 100 4 MARTA South Parking Lot 50,000 100,000 200 5 North Main District 25,000")
43 Table 5: Private Redevelopment Projects Identified in the 2006 Redevelopment Plan Corporate Office Townhomes MF Condos MF Apartments Site Retail (SF) Local Office (SF) (SF) Hotel (Rooms) (Units) (Units) (Units) 1 Buggy Works Expansion 70, , East Point Commons 52, Tri-Cities Plaza 100, MARTA South Parking Lot 50, , North Main District 25,000 25,000 50, North Main MXD 50,000 25, Central Main District 50,000 25,000 8 South Main District 50,000 10, SFMC Campus + King Bldg 175, Sylvan Road MXD Center 250,000 25, Wagon Works Expansion 20, Total 717, , , Source: East Point Corridors Tax Allocation District and Redevelopment Plan The above projects were estimated at the time to require a total investment of $502.6 million over a multi-year build out and result in the City s capacity to issue $98.3 million in TAD bond financing to both incentivize projects and build necessary public amenities and infrastructure to support the plan. The following concepts were incorporated into the 2006 Plan as examples of the types of desired land uses envisioned for the area after redevelopment. The following section is excerpted from the 2006 Plan. CLEVELAND AVENUE CORRIDOR (to Norman Berry Drive and Irene Kidd Parkway) Tax Allocation Bond Issues (O, P, Q) (DRAFT) 43


44 The Cleveland Avenue Corridor Study identified four activity nodes and associated development concepts in its master plan that fall within the TAD. The plan develops around these nodes or key areas of activity, which support walking within a mile radius. In addition, several important gateways to districts and neighborhoods were identified along the corridor. These gateways provide opportunities for pedestrian amenities, such as bus shelters, as well as creating focal points for neighborhood and district entrances. The TAD Redevelopment Plan adopted the Corridor Study plan of transforming Cleveland Avenue into a green boulevard, providing pedestrian access to and from neighborhoods, as well as vehicular access from I-85. Several traffic calming measures, such as narrowing travel lanes, adding a median, introducing a roundabout, and incorporating bulb-outs at pedestrian crossings are utilized to provide for safe and comfortable pedestrian traverse across Cleveland Avenue. The boulevard also features bike lanes and an off-street multi-use greenway trail. Several adjacent areas with strong redevelopment potential were also identified. Tax Allocation Bond Issues (O, P, Q) (DRAFT) 44
45 Key development nodes identified in the Cleveland Avenue Corridor study also encompassed a portion of the CBD near the MARTA station and the Buggy Works- Wagon Works complexes. Two development nodes of particular relevance which came out of that Corridor Study were the South Fulton Medical Center campus and the proposed Sylvan Road Mixed-use development. Both of those projects were incorporated into the 2006 TAD Redevelopment Plan and are highlighted below. SYLVAN ROAD MIXED-USE CENTER This development concept featured mixed-use development, including big-box retail and a mix of residential housing types within walking distance. The eastern portion of the Cleveland Avenue Corridor was receiving interest from developers due to its visibility and proximity to I-85. The largest potential assembly of parcels in the TAD was found there, and the area was identified as having a high potential for redevelopment at the time. The surrounding land uses were (and continue to be made up of) mostly Fulton County offices, a nursing home, one large office building and a cemetery. The Sylvan Road Mixed-Use Retail Area featured three distinct components: 1. Sylvan Rd/ Cleveland Avenue Neighborhood Commercial Gateway 2. Big Box Retail Center 3. Multifamily/Mixed Use Residential and Townhouses The Sylvan Road Neighborhood Commercial Center featured small shops and neighborhood services. This area also provides a convenient rest area for the greenway trail that winds through and crosses Cleveland in this area. With easy access for pedestrians from adjacent neighborhoods and connection to the trail system, this area focuses on pedestrian use. On-street parking is provided in front of shops. Tax Allocation Bond Issues (O, P, Q) (DRAFT) 45


46 Cleveland Avenue at Sylvan Road: This exhibit(above) shows the original development concept for the Sylvan Road Mixed Use Center, with the big box retail component highlighted inside the dashed line. In 2015 the City provided TAD financing to support development of the Wal-Mart Shopping Center shown in the aerial photograph. Tax Allocation Bond Issues (O, P, Q) (DRAFT) 46

47 In 2015 the City was able to provide $2.8 million in TAD #2 resources to partially implement the Big Box Center component of this concept plan, using a combination of accrued TAD funds and $1.2 million in debt. Ledbetter Development Partners LLC completed project and sold 21 acres to Wal-Mart in That site now includes a 151,450 SF Wal-Mart Supercenter that has a 2016 assessed (40%) value of $6.7 million. The taxable digest of this one parcel is roughly equivalent to the total value growth of $6.8 million achieved in the entire TAD #2 since its formation. SOUTH FULTON MEDICAL CENTER CAMPUS The SFMC campus concept plan featured medical office and supporting services connected to a walking trail system. Additionally, this area featured an educational campus with a new Park Lane elementary school building. Plans for the area included expanding medical office space in the Felton Drive area, improving the Park Lane School campus to allow greater access to a greenway trail, and adding outdoor amenities to the hospital campus for visitors. The district immediately surrounding the medical center included primarily medical offices. The hospital building and surrounding facilities serve the surrounding South Atlanta region and attract auxiliary doctors offices in the surrounding area. The 2006 Plan noted that this area is most likely to develop with additional medical offices, as well as services such as restaurants and retail to support the hospital and surrounding offices. Tax Allocation Bond Issues (O, P, Q) (DRAFT) 47
48 CENTRAL BUSINESS DISTRICT Several development opportunities had been identified in the downtown/cbd area of East Point, in the years prior to adoption of the 2006 Redevelopment Plan. Identified Downtown Redevelopment opportunities focused on Main Street and the area east of the rail line that includes the Wagon Works, the Buggy Works and the MARTA station. The LCI and Corridor studies also identified properties in the Central Business District that were vacant at the time (approximately 15) and most of those continue to remain vacant. The City s development strategy for the CBD area of the TAD includes: Civic Node New Municipal Complex Main Civic Axis Civic Green Mixed Use Development Main Street/MARTA Option A, on Main St. Option B, on East Point St. CBD Infill Redevelopment (Retail, Restaurants, etc.) Gateways The future land use map calls for this area as a general office commercial and public/institutional usage. The City owns a large amount of property on the northern tip of the Central Business District, which it has been marketing for mixed-use development. Tax Allocation Bond Issues (O, P, Q) (DRAFT) 48

49 Downtown / Central Business District An ideal location for infill development as described in the LCI study was identified in the area of Ware Avenue, between Main Street and East Point Street. Prior to adoption of the 2006 Plan, the City conducted a competitive bid process and selected Selig Enterprises to develop the project. After those plans stalled preceding the Recession, the City went through a second competitive process in Macauley Investments to was selected to redevelop the block as a mixed-use complex that will include residential, office and retail components, as shown in the following site plan. Tax Allocation Bond Issues (O, P, Q) (DRAFT) 49
 within walking distance of the MARTA station.")

50 BUGGY WORKS / WAGON WORKS HISTORIC DISTRICT Another potential development component in downtown East Point focuses on the Buggy Works, Wagon Works and adjoining blocks. The redevelopment concept for this area incorporated a mix of housing types and densities to support Transit Oriented Development (TOD) within walking distance of the MARTA station. Revitalization of the Buggy Works / Wagon Works Historic District is intended to complement the potential future development of the MARTA station, which would serve as a new gateway to Main Street. An additional feature of the proposed Buggy Works/Wagon Works redevelopment area would be the reconstruction of the old train depot, which could be re-used utilized as a commuter rail station and museum. MARTA SOUTH PARKING LOT The South Parking lot of the MARTA station also offers a potential development site that was identified a decade ago. This site could support a variety of uses, should MARTA Tax Allocation Bond Issues (O, P, Q) (DRAFT) 50

51 eventually make the site available for joint development with the private sector. Land use steps down in density from Cleveland Avenue into the neighborhood. Street patterns have been redeveloped to improve the neighborhood connectivity. Pocket parks and civic uses are incorporated to provide community focus. The streets include on-street parking for guests as residential structures are accessed through alleys. The area of the TAD between Martin Street and the Cleveland Avenue intersection with Norman Berry Drive contained the largest concentration of existing single-family residential housing. At the time the TAD was formed, Cleveland Avenue was transitioning to more commercial uses. The masterplan for the area designated additional live/ work uses with a slight increase in density and simplification of street patterns. Several small medical offices had also been built in the few years prior to 2006, building a presence of medical along the corridor. PROPOSED REDEVELOPMENT PROJECTS (D) TOTAL POTENTIAL REDEVELOPMENT The original estimated redevelopment potential for TAD #2, shown in Table 5, was ambitious and reflective of the strong market conditions which existed at the time. The planning effort to prepare the 2006 Redevelopment Plan also closely followed the City s success with its first TAD created in 2001 (Camp Creek), which by 2006 was far exceeding original expectations in both the pace and value of new construction. Over the past decade local market conditions have obviously become much more challenging and less optimistic than existed in 2005 and For this reason, the original TAD project list has been revised to reflect achievable levels of investment under current and likely future market conditions. The list also reflects changes to identified redevelopment sites that have occurred over the past decade, which have rendered some properties within the TAD no longer suitable for the uses proposed a decade ago. Tax Allocation Bond Issues (O, P, Q) (DRAFT) 51
52 A revised list of six projects appears in Table 6. Development totals have been reworked and focused on Downtown. If successful, these projects would still have a positive economic and fiscal impact on the City, while generating minimal service costs impacts on the county and school system. The earliest of these projects to be implemented is the proposed East Point Commons, which is illustrated on the next page. While the City would strongly consider proposals to invest TAD proceeds to support other redevelopment projects elsewhere in TAD #2, the following list of projects will be given priority in terms of focus and funding as it becomes available. Table 6: Revised List of Proposed Projects 2017 Amended Redevelopment Plan Senior Housing (Units) MF Apartments (Units) Local Office (SF) Corporate Office (SF) Hotel (Rooms) Townhomes (Units) Site Retail (SF) 1 Buggy Works Expansion 50,000 25, East Point Commons 60, MARTA South Parking Lot 50,000 50, Central Main District 50,000 25,000 5 South Main District 50,000 10,000 6 Wagon Works Expansion 20,000 Total 280,000 60,000 50, Table 7: Estimated Full Market Value of Revised TAD Projects by Component 2017 Amended Redevelopment Plan Senior Multi-Family Project/Site Retail Office Hotel Townhomes Housing Apartments Total 1 Buggy Works Expansion $4,500,000 $2,375,000 $0 $24,000,000 $0 $0 $30,875,000 2 East Point Commons $5,400,000 $0 $0 $0 $25,200,000 $31,500,000 $62,100,000 3 MARTA South Parking Lot $4,500,000 $4,750,000 $9,600,000 $0 $0 $0 $18,850,000 4 Central Main District $4,500,000 $2,375,000 $0 $0 $0 $0 $6,875,000 5 South Main District $4,500,000 $950,000 $0 $0 $0 $0 $5,450,000 6 Wagon Works Expansion $1,800,000 $0 $0 $0 $0 $0 $1,800,000 Total $25,200,000 $10,450,000 $9,600,000 $24,000,000 $25,200,000 $31,500,000 $125,950,000 Source: Bleakly Advisory Group, Inc., from the 2006 East Point Commercial Corridors Redevelopment Plan. If these project areas are developed as forecast, BAG estimates that they could collectively support 390,000 SF of retail and office space, 120 hotel rooms and 580 residential units, including 180 units of senior housing. These estimates represent an approximate 70% reduction to both residential and commercial totals forecast in The primary adjustments made were the removal of for sale condominium units and a substantial reduction in retail and corporate office development. Tax Allocation Bond Issues (O, P, Q) (DRAFT) 52
53 Revised retail totals also reflect and remove square footage that has already been developed. East Point Commons: This exhibit shows a recent development concept for East Point Commons. The City and its Development Authority are actively negotiating to convey the assembled properties to a private developer. However, the project is not financially feasible without the investment of property tax increments contributed by all three taxing jurisdictions, through the TAD. BAG estimates that when completed, these projects would have a full market value of nearly $126 million based on their current value. 8 The distribution of the projects market values by project and component is summarized in Table 7. As shown, the largest investment is the East Point Commons, which accounts for nearly half of the estimated end value of the entire list. BAG further estimates that the projects listed in Table 7 could potentially be built out over a 6 to 9-year period. The additional tax digest created by this new development, coupled with a most allowance for future appreciation and value change elsewhere in the TAD (based on historical value growth since 2006), would increase the TAD s digest from roughly $55.6 million (in 2016), to nearly $116.9 million in 10 years. Annual real estate taxes collected within the TAD by all jurisdictions would increase from $2.4 million currently to roughly $5.1 million by year 10, with approximately $2.1 million in taxes continuing to be received by the taxing jurisdictions respective general funds and the balance of nearly $3.0 million 8 Full market value in this context refers to the likely value assigned to completed developments by the Fulton County Tax Assessor. Full market value for tax purposes is different from, and should not be confused with, actual construction costs or sales prices. Tax Allocation Bond Issues (O, P, Q) (DRAFT) 53
54 contributed as tax allocation increment to support redevelopment. This forecast appears in Table 8. Table 8: Estimated TAD Revenues from Build Out of Revised TAD Projects 2017 Amended Redevelopment Plan Year (2017 = 1) TAD Base Digest Full Market Value of New Development Incremental Tax Digest from New Development Base Growth TOTAL TAD 2 Digest Total Tax Mils Base RE Taxes to General Funds Available Tax Allocation Increment 1 $48,837,930 $0 $0 $55,619,258 $55,619,258 $2,443,521 $2,145,597 $297,924 2 $48,837,930 $0 $0 $56,342,308 $56,342,308 $2,475,287 $2,145,597 $329,690 3 $48,837,930 $9,780,000 $3,912,000 $57,074,758 $60,986,758 $2,679,331 $2,145,597 $533,734 4 $48,837,930 $34,143,300 $13,657,320 $57,816,730 $71,474,050 $3,140,069 $2,145,597 $994,473 5 $48,837,930 $85,566,938 $34,226,775 $58,568,348 $92,795,123 $4,076,768 $2,145,597 $1,931,171 6 $48,837,930 $121,674,707 $48,669,883 $59,329,736 $107,999,619 $4,744,747 $2,145,597 $2,599,150 7 $48,837,930 $127,956,913 $51,182,765 $60,101,023 $111,283,788 $4,889,031 $2,145,597 $2,743,434 8 $48,837,930 $131,945,092 $52,778,037 $60,882,336 $113,660,373 $4,993,441 $2,145,597 $2,847,844 9 $48,837,930 $134,261,832 $53,704,733 $61,673,806 $115,378,539 $5,068,925 $2,145,597 $2,923, $48,837,930 $136,060,672 $54,424,269 $62,475,566 $116,899,835 $5,135,760 $2,145,597 $2,990, $48,837,930 $137,885,736 $55,154,294 $63,287,748 $118,442,043 $5,203,514 $2,145,597 $3,057, $48,837,930 $139,737,436 $55,894,974 $64,110,489 $120,005,464 $5,272,200 $2,145,597 $3,126, $48,837,930 $141,616,193 $56,646,477 $64,943,925 $121,590,403 $5,341,831 $2,145,597 $3,196, $48,837,930 $143,522,435 $57,408,974 $65,788,196 $123,197,170 $5,412,421 $2,145,597 $3,266, $48,837,930 $145,456,596 $58,182,638 $66,643,443 $124,826,081 $5,483,984 $2,145,597 $3,338, $48,837,930 $147,419,119 $58,967,648 $67,509,808 $126,477,455 $5,556,534 $2,145,597 $3,410, $48,837,930 $149,410,453 $59,764,181 $68,387,435 $128,151,616 $5,630,085 $2,145,597 $3,484, $48,837,930 $151,431,055 $60,572,422 $69,276,472 $129,848,894 $5,704,651 $2,145,597 $3,559, $48,837,930 $153,481,391 $61,392,556 $70,177,066 $131,569,622 $5,780,248 $2,145,597 $3,634, $48,837,930 $155,561,933 $62,224,773 $71,089,368 $133,314,141 $5,856,890 $2,145,597 $3,711, $48,837,930 $157,673,162 $63,069,265 $72,013,530 $135,082,795 $5,934,592 $2,145,597 $3,788, $48,837,930 $159,815,568 $63,926,227 $72,949,706 $136,875,933 $6,013,370 $2,145,597 $3,867, $48,837,930 $161,989,647 $64,795,859 $73,898,052 $138,693,910 $6,093,240 $2,145,597 $3,947, $48,837,930 $164,195,905 $65,678,362 $74,858,726 $140,537,088 $6,174,216 $2,145,597 $4,028, $48,837,930 $166,434,857 $66,573,943 $75,831,890 $142,405,832 $6,256,315 $2,145,597 $4,110, Year Totals $125,360,975 $53,639,919 $71,721,055 Future Revenues 6.0% $31,014,409 Source: Bleakly Advisory Group, Inc. The above forecast assumes that TAD funding would be available from all three taxing jurisdictions, and that these funds would be sufficient to incentivize redevelopment. Without adequate TAD proceeds, it is likely that the pattern of very slow commercial growth, which has averaged only 1.3% per year over the past decade, would continue indefinitely. Tax Allocation Bond Issues (O, P, Q) (DRAFT) 54
55 CONTRACTUAL RELATIONSHIPS (E) Pursuant to O.C.G.A (a), the East Point City Council will act as the redevelopment agent and will exercise redevelopment powers as needed to implement this plan. As TAD Redevelopment Agent/Administrator, the City, through City professional staff, carries out tasks in the following areas, among others: 1. Coordinating implementation activities with other major participants in the Redevelopment Plan and their respective development and planning entities, including the Fulton County Board of Commissioners, the Fulton County Board of Education, the neighborhoods impacted and other stakeholders, as well as with various City departments involved in implementing the Redevelopment Plan. 2. Conducting (either directly or by subcontracting for services) standard predevelopment activities, including - but not limited to - site analysis, environmental analysis, development planning, market analysis, financial feasibility studies, preliminary design, zoning compliance, facilities inspections, and overall analysis of compatibility of proposed development projects with the City s Comprehensive Development Plan and this East Point Corridors Tax Allocation District and Redevelopment Plan. 3. Seeking appropriate development projects, financing, and other forms of private investment in the Redevelopment Area from qualified sources. 4. Developing public-private ventures, loans to private enterprise and intergovernmental agreements as needed. 5. Marketing the Redevelopment Area among developers, capital sources and the general public. 6. Coordinating public improvement planning and construction with the City s Department of Public Works, Department of Economic Development, Department of Planning and Zoning and other relevant City, County and School System departments and offices. 7. Entering into negotiations, either directly or through contracted third parties, with property owners and real estate developers within the Redevelopment Area for the purpose of acquiring land and property for redevelopment in accordance with the Redevelopment Plan. 8. Preparing economic and financial analyses, project-specific feasibility studies and assessments of tax base increments in support of the issuance of Tax Allocation Bonds by the City. Tax Allocation Bond Issues (O, P, Q) (DRAFT) 55
56 The East Point City Council will perform either directly, through City departments and staff, and/or through contracted third parties, other duties as necessary to implement the Redevelopment Plan. RELOCATION PLANS (F) As is currently foreseen, no relocation of tenants or residents from private homes is anticipated within TAD #2. However, if the relocation of existing residences or businesses becomes necessary in the future, such relocation expenses shall be paid in accordance with all applicable federal, state and local regulations and guidelines, if public funds are used for property acquisition and such sources of funds require benefits to be offered to tenants and users for relocation purposes. ZONING & LAND USE COMPATIBILITY (G) The 2006 Redevelopment Plan for East Point TAD #2 extensively addressed the area s zoning, land use patterns and consistency with earlier City planning initiatives. The projects proposed in the original Redevelopment Plan conformed to the local comprehensive plan, master plan, zooming ordinance, and building codes of the City at the time. The City of East Point Comprehensive Development Plan and City Zoning Ordinance were the primary plans and policies that impact land use and development in the City. The Comprehensive Plan is updated on an annual basis, and reflects recommendations contained in the TAD redevelopment plan. The following section addresses evidence of the Redevelopment Plan s compatibility with zoning and consistency with City policy. It is taken directly from the 2006 Redevelopment Plan, with little change. EXISTING LAND USE AND DEVELOPMENT Property conditions within the East Point Corridors TAD generally fall into one or more of the following categories of use and/or condition: Underutilized commercial properties, often in substandard condition Automobile-related businesses Aging strip shopping centers Lack of pedestrian-friendly infrastructure in commercial areas and corridors connecting residential and commercial areas Pawn shops and check-cashing stores Convenience stores Franchise fast-food offerings Free-standing retail and services Downtown East Point is characterized by a compact grid street network, with low rise development. Most of the buildings are two to three stories. The low-rise Tax Allocation Bond Issues (O, P, Q) (DRAFT) 56
57 development and the small block sizes provide a suitable walking environment. The core of the downtown is defined by a one-way pair of streets; Main Street and East Point Street, from the intersection by Norman Berry Drive to Washington Street. MARTA rail and freight rail tracks parallel Main Street on the east side, with a MARTA station located on the west side, in the heart of downtown. This station is a major element in downtown. The Buggy Works and Wagon Works are two distinct buildings significant in size located east of the rail tracks have been recently renovated into office buildings. The rail tracks separate this development from the downtown. This area is connected to downtown by a pedestrian bridge at Cleveland Avenue. The pedestrian bridge is a powerful visual element that marks the downtown. Downtown consists of civic buildings, churches, several banks, retail and little residential product. The residential housing consists of several houses on East Point Street and a condominium development on Cleveland Avenue. The entire downtown is within approximately ¼ mile (five minute walking) radius. Current land uses as identified in the 2006 existing land use map were described as follows: Commercial Available These are buildings/properties that have been physically rehabilitated and are ready for commercial/retail developments. General Commercial These areas were developed on the fringe of the historic downtown business district along the main roadway corridors. In most cases, these are typical strip mall developments and single buildings with independent stores and parking provided in the front of the businesses. General Office Commercial - This is the second largest land use component in the study area. Although they are in the same category, a separate concentration of uses exists on the west side of Main Street versus the east side of Main Street. The west side of Main Street caters to a mixed- use component, including multi-level buildings with loft living or offices on the top floors, and retail storefronts at street level. This area tends to accommodate the pedestrian with sidewalks and street furniture that abuts the street. Typically, these businesses are served by on-street parking and supplemented by public parking lots. The east side of Main Street includes the old industrial buildings that are listed as a National Register Historic District. Two of the warehouses have been converted into office space, but some underutilized areas still exist. This area has large self-serving parking lots, but they are located in the rear of the lots. Tax Allocation Bond Issues (O, P, Q) (DRAFT) 57

58 Light Industrial Most of the industrial land is vacant or has underdeveloped parcels of land. The remaining areas include a logging company, portable toilet company, asphalt and paving company, a junk yard and several small shipping warehouses. Multi-Family These are apartment housing units, with some public housing included. Public Institutional These land use areas include property owned by a governmental or faith/based entity. These include: city hall, city auditorium, public safety facilities, cemetery, Tricities high school, and most of the churches. Park/Recreation/Conservation These areas are owned by the city government and provide recreational usage for the citizens including: Connally Nature Preserve, Sumner Park with the Velodrome and community building. Single Family These are detached single family homes/residences. This is the largest land use category within the study area. Transportation The MARTA Train Station and Water Utility Company are included in these areas. Tax Allocation Bond Issues (O, P, Q) (DRAFT) 58

59 Vacant/Underutilized These areas highlight underutilized lots for viable development including vacant lots with no buildings, lots with buildings that have no aesthetic, historic or architectural value or general open lots that have been used as unofficial gathering spaces. Zoning East Point s history had a large impct on the zoning that was in place in East Point has progressed from a small farming community of the 1820 s to a well-known industrial suburb in the late 1800 s and early 1900 s. East Point currently exhibits a mixture of industrial and small businesses throughout the City. Much of the industrial roots of the community were still evident through the zoning code that was in place in 2006, because a large majority of the redevelopment area was still zoned for light industrial uses, even though those areas were underutilized or had been converted to office space at the time. The following text describes the zoning that was in place at the time. The following zoning information appeared in the 2006 Plan and much of it remains accurate. The existing zoning is made up of a mixture that includes categories from Industrial to Single Family Residential. The commercial and medical categories are generally compatible in their adjacencies, however, there is a need for step-down categories or Tax Allocation Bond Issues (O, P, Q) (DRAFT) 59
60 buffer controls between single-family and I1, MI or C1 uses. The existing zoning categories do not support pedestrian activity or active uses along the street. Setback requirements and lack of architectural controls create a corridor that has a blighted experiential quality. Designation C1 = NEIGHBORHOOD BUSINESS DISTRICT C2 = CENTRAL BUSINESS DISTRICT CR = COMMERCIAL REDEVELOPMENT Purpose/Definition Provides convenient shopping goods and services required by the neighboring residence and excludes other uses which might have a detrimental effect upon residential usage. Provides an area for those commercial goods and services which serve the entire community. To facilitate and encourage innovative, functional, aesthetically pleasing and creative design and development of the most compatible and desirable mixed-use pattern of retail, commercial service, institutional and residential land uses which are primarily pedestrian and public transit oriented. MAIN STREET ARCHITECTURAL DISTRICT M-I = MEDICAL INSTITUTIONAL DISTRICT OIT = OFFICE INSTITUTIONAL TRANSITION DISTRICT Properties in this district will comply with architectural standards as seen fit under the architectural design review procedure. Provides for the establishment and maintenance of high-quality medical and institutional uses, structures, facilities and accessory uses, and excludes incompatible uses. Provides for the compatible transition from residential to limited office and institutional development. I-1 = LIGHT INDUSTRIAL Provides for light manufacturing, assembly, packaging ad warehousing operations, free from incompatible residential, commercial and heavy industrial activities. I-2 = HEAVY INDUSTRIAL Provides for light and heavy manufacturing, processing, assembly, packaging and warehousing operations. TRN = TRADITIONAL RESIDENTIAL NEIGHBORHOOD DISTRICT R1 = SINGLE FAMILY RESIDENTIAL R2 = TWO FAMILY RESIDENTIAL Provides for traditional residential neighborhood within walking distance of downtown, as there is currently no opportunity for construction of single-family residences along main street. Provides quiet low density residential neighborhood for single-family dwelling that will not generate any traffic other than that for the residents. Provides a quiet, medium density residential neighborhood consisting of single-family dwelling, and limited private and public community uses. R3 = MULTI-FAMILY RESIDENTIAL Provides a quiet, moderate density residential neighborhood consisting of single-family dwelling, and limited private and public community uses. R4 = MULTI-FAMILY RESIDENTIAL Provides a moderately concentrated residential area of single-family, two-family and multifamily dwellings, and limited private and public community uses. Tax Allocation Bond Issues (O, P, Q) (DRAFT) 60

61 In addition, a lack of retail, usable greenspace, and mixed-use development is evident and is not well supported under the current zoning categories. Except for a small area of CR zoning in the Buggy Works area, there are no architectural controls in these zoning categories. The zoning classifications and their intent are specified below. Within the TAD area and immediately adjacent neighborhoods, the principal zoning classifications are single-family residential, light industrial and commercial redevelopment. CHARACTER AND BUILDING CONDITIONS The following information was taken from the City s Comprehensive Plan to describe desired conditions in the Redevelopment Area. Downtown East Point has several vacant and under-utilized properties. It also has low-rise development and small building footprints. Except for White Way, the blocks between East Point Street and Main Street are sparsely developed. Thompson Avenue and Dorsey Avenue contain many under-utilized buildings set back from the street with surface parking, interspersed with several vacant properties. The downtown lacks a cohesive image and a continuous building edge to the street and defined blocks. Though there are retail establishments that engage the public on the weekdays, the activity level is relatively low in the evening and weekends as these establishments are closed. The renovated retail stretch along White Way and Main Street has several restaurants that offer some level of activity. Tax Allocation Bond Issues (O, P, Q) (DRAFT) 61

62 The MARTA station, which is a significant element, needs to be integrated into the downtown fabric. Some of the buildings need façade improvements and maintenance. There is a need for creating a focal point - a civic plaza or space in downtown that can define the heart of downtown. Clearly defined gateways are needed to mark the extents of downtown. Though Main Street will be getting anew street treatments shortly, there are opportunities to improve streetscape, landscape, way finding signage and art work in other parts of the downtown with a consistent theme and character to enhance the image and provide a cohesive character to downtown. The Comprehensive Plan also noted that the Tri-Cities Plaza [located at the intersection of Main Street and Willingham Drive] needs improvement. It has a suburban shopping strip character with large parking lot. The building is in average condition and has no architectural character of significance. It is in critical need of façade and landscaping improvements and could benefit from redevelopment. The shopping center consists of 3 parcels totaling 11.7 acres, with 135,400 SF of retail buildings built between 1958 and That site was incorporated into TAD #2 as a key potential redevelopment site. Woodward Academy acquired that shopping center in The center currently remains taxable with an assessed (40%) value of just under $1.92 million. Woodward Academy also owns an abutting 8.3-acre parcel that is used as a parking lot and is tax exempt, so it can be reasonably assumed that the shopping center could eventually be redeveloped with this adjacent parcel for Tax Allocation Bond Issues (O, P, Q) (DRAFT) 62
63 educational use. Should the Tri-Cities Plaza become tax exempt, 28% of all tax digest growth that has occurred in TAD #2 since its formation would be erased. TRANSPORTATION INFRASTRUCTURE Transportation infrastructure was extensive addressed in the LCI and corridor studies that were prepared prior to adoption of the 2006 Redevelopment Plan. The following conditions were noted in Roadways The transportation network within the East Point area is composed primarily of a grid system, with two primary north-south one way pairs within the downtown core, Main Street and East Point Street, which serve as both state and federal facilities (SR 14/US 29). The East Point MARTA heavy rail station is located near this split. Due to the proximity of these two routes, to each other, there is a large degree of internal circulation during peak traffic periods and a long running discussion as to whether this separation is warranted. Outside of these state highways, local streets in the area form a grid and therefore allowing for alternate routes and turning movements. This network configuration enables the vast majority of local and through traffic onto this state highway. Current traffic volumes do not exceed capacity but do create difficult conditions for pedestrians. The majority of traffic is gathered from multiple locations throughout the general Hartsfield/Jackson Airport area and funneled onto these two streets and several other major facilities. Several of other these major facilities, such as Cleveland Avenue and Norman Berry Drive move traffic in an east-west direction allowing access to Interstate 85. Other facilities, such as Headland Drive and Hogan Road provide east-west traffic to the Greenbriar Mall. Major Arterials US Route 29 (State Route 14, Main Street) Camp Creek Parkway Minor Arterials Washington Road / Irene Kidd Parkway / Cleveland Avenue Norman Berry Drive (from Semmes St. to Central Ave.) Bobby Brown Parkway East Point Street (from Forrest Ave. to Washington Rd.) Major Collectors Central Avenue/Connally Drive Delowe Drive (from Washington Road to the City limits) Headland Drive Hogan Road Lyle Road (between Dodson Drive and Washington Road) Tax Allocation Bond Issues (O, P, Q) (DRAFT) 63

64 Semmes Street (from Washington Road to Langford Memorial Parkway) Stanton Street Minor Collectors Church Street Delowe Drive (south of Washington Road) Lawrence Street Taylor Avenue According to GDOT, in 2006 the number of vehicles flowing through the study area along the Main Street/East Point Street axis during a 24-hour period was lower than the road network is designed to carry. Generally, the carrying capacity of US 29/SR 14 is between 14,890 vehicles per day near the Lakewood Freeway to 8,730 vehicles per day at Washington Road on the two lane, two-way segments and 22,640 vehicles per day on the one-way segments, which contain several lanes each with an additional lane that functions like a continuous left turn lane. Tax Allocation Bond Issues (O, P, Q) (DRAFT) 64
65 Several intersections in this general area are approaching capacity, however. For the purposes of the East Point LCI study, existing morning and afternoon peak hour turning movement volumes were obtained for the following area intersections: SR 14 and Washington Road SR 14 and Norman Berry Drive SR 14 and Church Avenue Headland Drive and Delowe Drive The redevelopment of the Fort McPherson site immediately north of the City limit at Main Street and Womack Avenue will likely increase traffic along the Main Street/East Point Street corridor significantly over the next several years. Sidewalks and Bicycle Facilities All streets within the study have some type of sidewalk, though conditions vary. Major streets within the downtown area have minimum sidewalk widths of five feet and maximum sidewalk widths of ten feet along the east side of Main Street near the MARTA station. They are continuous throughout. The streets, however, are In need of street treatments and a streetscape and sidewalk project is scheduled for Main Street south of Cleveland Avenue to the College Park border. The sidewalks on alive during lunch time and there is a good deal of pedestrian traffic generated by the MARTA station. The local street grid in and around the downtown core provides numerous opportunities for pedestrian access to several downtown attractions. However, a lack of sidewalks and pedestrian amenities such as shade trees, benches, and way-finding signage discourages pedestrians. Additionally, there is a pedestrian overpass from Central Avenue across to Main Street just north of the MARTA station. This helps pedestrians, including many students from Tri Cities High School to cross over the MARTA and freight rail tracks. Parking Based on an analysis of existing land uses in the East Point TAD area, an estimate of demand for parking spaces was calculated for the downtown commercial core and existing spaces were physically counted at the time. The physical count included surface parking lots and on-street parking. Based on this examination, 1,195 spaces were identified within the Central Business District. It was assumed that other land uses currently had sufficient on-site parking. Roughly 642 parking spaces were required to serve commercial and housing developments within the study area. That figure was established by multiplying the total square feet of development in the area by established parking standards. The above conditions were considered in proposing selective public infrastructure improvements to the Redevelopment Area, using a portion of the forecasted tax allocation increments generated within the TAD. As those Tax Allocation Bond Issues (O, P, Q) (DRAFT) 65
66 revenues have not yet materialized, most of the observed infrastructure conditions in 2006 remain unchanged. METHOD OF FINANCING / PROPOSED PUBLIC INVESTMENTS (H) TAD POTENTIAL OF DOWNTOWN EAST POINT PROJECTS The following section presents revised estimates of potential revenues from a scaled back list of redevelopment projects in TAD #2, assuming that both Fulton County and the Fulton School District pledge their respective M&O millage to the TAD redevelopment effort. 9 Should all three taxing jurisdictions commit their M&O millage to the TAD on the real estate (only), the above forecast could produce total estimated TAD proceeds of $71.7 million over 25 years. 10 This forecast represents an approximate 234% increase over likely tax revenues if existing conditions do not significantly change throughout the forecast. Of these estimated property tax increments pledged to the TAD, (and assuming millage rates to not change significantly over the forecast), approximately $24.5 million would be contributed by the City, $17.1 million by Fulton County and $30.1 million by the School District. The balance of real estate tax collections from within the TAD of approximately $53.7 million over 25 years, would continue to be used for general fund purposes, along with tax revenues associated with growth in personal property tax digest associated with future retail, office and hotel development within the TAD. Table 9: East Point TAD #2 East Point Commercial Corridors Potential Redevelopment Sites Potential Redevelopment Residential Units (Apartments, Townhomes & Senior Units) 580 Average Full Market Value/Unit $139,100 Commercial, Retail, Office & Hotel S.F. 444,000 Average Full Market Value/SF $ Future Market Value of TAD Projects at Build-out (Year 10) $136.0 Million Total TAD #2 Taxable Digest at Completion (Year 10) $116.9 Million Net New TAD Taxable Real Estate Digest at Completion $66.5 Million Total tax allocation increment to the TAD #2 Fund (Yr 10) $2.99 million Source: Developers, City of East Point and BAG 9 Counties and school districts in other parts of Georgia have requested and cities have agreed to rebate portions of their respective millage rates as a payment in lieu of taxes, reducing the effective millage rate pledged to the TAD. The following section assumes that East Point will NOT be asked to rebate County or School District Tax Increments as a payment in lieu of taxes, but financial models possess the capability to incorporate such assumptions. 10 We have used a 25-year forecast as representative of the total likely investment required of the taxing jurisdictions. The City will be requesting that the County and School District agree to extend the life of the TAD for a maximum of 30 years beginning from the City s point of signing a development agreement to provide TAD funding to a first project, or until all redevelopment costs are paid, whichever occurs first. Tax Allocation Bond Issues (O, P, Q) (DRAFT) 66
67 BAG also estimates that the forecasted growth in tax increments could support potential financing or bond revenues of $31.0 million (net after issuance costs and reserves) for investment in redevelopment projects and additional public improvements. (This estimate assumes that approximately 70% to 80% of forecasted tax increments could be generated quickly enough to be pledged for financing purposes.) Should the Fulton County School System refuse to consent to the TAD, the amount of net proceeds available to invest in redevelopment projects (with City and County increments only) is reduced to roughly $17.5 million. This amount is unlikely to be sufficient to incentivize the quality or density of redevelopment needed to achieve the City s objectives and reduce long term trends. POTENTIAL INVESTMENTS OF TAD PROCEEDS The Redevelopment Powers Law gives Georgia s communities wide latitude in the use of tax allocation district funds to support redevelopment. As enumerated in Section , the following are all eligible uses for TAD funds in a redevelopment area: Construction of building(s) for business, commercial, industrial, governmental, educational, charitable, or social uses Renovation, rehabilitation, reconstruction repair or demolition of any existing building Creation of public housing Creation of public works or public facilities Preservation of historic structures Creation or improvement of public spaces Creation or improvement of mass transit facilities Development, or improvement of telecommunications infrastructure Creation or improvement of pedestrian access and safety Property acquisition, site preparation, demolition, environmental remediation Infrastructure and utility relocation, rehabilitation or installation Table 10 distributes the estimated future TAD proceeds to each of the project sites listed in this Plan, based on the proportional share of future tax allocation increments those projects will create. Depending on the specific situation, TAD funds could be used to make public infrastructure improvements, build structured parking or provide direct financial incentives to developers to offset construction costs. Table 10: Potential Uses of Estimated Future Proceeds TAD #2 - East Point Commercial Corridors Tax Allocation Bond Issues (O, P, Q) (DRAFT) 67
68 Estimated Build Supportable Project/Site Out Value TAD Proceeds 1 Buggy Works Expansion $30,875,000 $7,602,678 2 East Point Commons $62,100,000 $15,291,539 3 MARTA South Parking Lot $18,850,000 $4,641,635 4 Central Main District $6,875,000 $1,692,904 5 South Main District $5,450,000 $1,342,011 6 Wagon Works Expansion $1,800,000 $443,233 Total $125,950,000 $31,014,000 Uses of TAD proceeds will be defined by the City of East Point during negotiations with individual developers on a case by case basis. Funding decisions will be based on the amount of incremental tax revenues those projects will generate, as well as the availability of current/future tax increments available to the TAD Special Fund. The City is committed to using TAD proceeds in most effective and appropriate manner allowed under the Redevelopment Powers Law, to achieve successful results. The City recognizes that TAD #2 encompasses a larger area than is represented by these 6 projects listed above. Other, currently unforeseen projects may arise in the future, which merit public support. Although uses of TAD proceeds will be prioritized toward the projects listed in Table 10, the City will also consider supporting other worthwhile redevelopment projects in TAD #2, if/when such opportunities arise. Proposed Public Investments. ASSESSED VALUATION FOR TAD (I) According to the Fulton County Tax Assessor and the City of East Point, TAD #2 had an assessed taxable base value of $48,837,930 in 2006, when the original Redevelopment Plan was adopted. That value was later certified State of Georgia Revenue Commissioner in accordance with the requirements of the Redevelopment Powers Law. The original tax parcels which formed the East Point Corridors TAD #2 are listed in Appendix B. HISTORIC PROPERTY WITHIN BOUNDARIES OF TAD (J) No property designated as a historic property under the Georgia Historic Preservation Act or eligible for listing on the National Register of Historic Places will be substantially altered in any way inconsistent with technical standards for rehabilitation or demolished unless feasibility for reuse has been evaluated based on technical standards for the review of historic preservation projects, which Tax Allocation Bond Issues (O, P, Q) (DRAFT) 68
69 technical standards for rehabilitation and review shall be those used by the state historic preservation officer. CREATION & TERMINATION DATES FOR TAD (K) The Tax Allocation District #2: East Point Commercial Corridors was created effective December 31, 2006 and was originally expected to remain in existence for 25 years. 11 The Redevelopment Powers Law provides that the district will be in existence until all redevelopment costs, including debt service, are paid in full. The City issued TAD #2 bonds in November of 2015, with a maturity date of August 1, Therefore, unless those bonds are repaid early, the TAD will remain in existence at least until that time. Because very limited progress was made during the first decade of the TAD s existence, the City proposes to reset the termination date of the TAD to 30 years (December 31, 2047) in order to preserve the option of leveraging TAD future financing with 25-year amortization terms. TAX ALLOCATION INCREMENT BASE (M) In December of 2006, the East Point City Council, acting as the redevelopment agent, applied to the State Revenue Commissioner for a determination of the tax allocation increment base of the proposed tax allocation district. The TAD represented 5.4% of the East Point s tax digest at the time it was created, well below the 10% maximum value threshold for all TADs in a given taxing jurisdiction as referenced by the Redevelopment Powers Law. The 2006 base valuation of the proposed TAD #2 was estimated as follows: Table 10: Certified Base Value of Tax Allocation District #2 - East Point Commercial Corridors* Parcels 750 Acreage** Taxable (Digest) Value* $48,837, City of East Point Tax Digest Value (Net M & O)* $911,372,181 TAD Taxable Value as a % of City s Taxable Value 5.4% *These value estimates are taken from Fulton County Assessment Records. ** Acreage totals exclude tax exempt property and rights of way. 11 The 2006 Plan proposed that the Redevelopment Area and accompanying Tax Allocation District remain in existence for a period equal to the anticipated term of the outstanding bond issues, which shall be no longer than 25 years from the date of creation of the East Point Corridors TAD. Tax Allocation Bond Issues (O, P, Q) (DRAFT) 69
70 PROPERTY TAXES FOR COMPUTING TAX ALLOCATION INCREMENTS (N) As provided in the Redevelopment Powers Law, total taxes to be included in the tax increment base for the tax allocation district were based on the following authorized millage rates, during the 2006 tax year when TAD#2 was formed: The base amount of property taxes within TAD #2, was calculated as follows: City of East Point General Fulton County General Fulton County Board of Education School Operations TOTAL: mills mills mills mills Total TAD Taxable Digest ($48,837,930) x useable (2006) Millage (37.601)* = $1,836,355 (*This revenue estimate assumes consent by the County and Fulton County School System.) For information purposes, most recent (2016) applicable millage rates are shown in Table 11. Table 11: (2016) M&O Millage Rates* City of East Point mills Fulton Co. M&O mills Fulton County Public School District mills *Levies for bonded indebtedness are not included in the calculation of the millage rates for TAD purposes. Source: Fulton County/Georgia Department of Revenue, latest available estimates. TAX ALLOCATION BOND ISSUES (O, P, Q) AMOUNT OF BOND ISSUE Upon adoption of this Redevelopment Plan, the City of East Point proposes to negotiate development agreements and as necessary issue tax allocation bonds or other financing instruments, in one or more issues. Estimated supportable levels of future financing could range from approximately $25 to $50 million depending upon the nature of projects that are proposed, whether all taxing jurisdictions consent to participate, terms available at the time of issuance and the types of financing methods used. These terms would result in a net of roughly $10 to $35 million being available for direct investment in projects. Table 10 presents a representative scenario whereby the TAD generates $31.0 million net for investment in redevelopment projects. TERM OF THE BOND ISSUE OR ISSUES The City of East Point proposes to issue tax allocation bonds or alternative forms of financing for a term no longer than 30 years. Under current market conditions, the City expects that actual financing terms will range from 20 to 25 years. Tax Allocation Bond Issues (O, P, Q) (DRAFT) 70
71 RATE OF BOND ISSUE The City of East Point intends to issue fixed-rate tax exempt bonds or comparable financing as available. Actual interest rates and payment terms will be determined at the time of issuance based upon general market conditions, anticipated development within the redevelopment area, assessed taxable property values, and federal tax law considerations. The City reserves the option to either operate the district on a pay-as-you-go basis or consider other potential financing options including other commercial financing to support future projects, as appropriate. POSITIVE TAX ALLOCATION INCREMENTS The positive tax allocation increments for the period covered by the term of the bonds is estimated to range from $2.9 million to $3.2 million annually after the build out is complete within 8 to 10 years. The actual amount will depend upon the pace at which the Redevelopment Plan is implemented and the impact of the redevelopment activities and other economic factors on the tax base within the district as a whole. It is also dependent upon whether intergovernmental agreements can be reached with the School District and whether the Board of Education will consent to contribute all or only part of School District millage to the TAD. PROPERTY TO BE PLEDGED FOR PAYMENT OF THE BONDS Should the respective taxing jurisdictions consent to participate, bonds will be secured by the positive tax allocation increment from eligible ad valorem taxes on real estate, as levied by the City of East Point, Fulton County and the Fulton County School System. Incremental revenue increases in either local sales taxes or taxes on commercial personal property will not be pledged to the TAD. Tax Allocation Bond Issues (O, P, Q) (DRAFT) 71
72 Tax Allocation District #2 - East Point Commercial Corridors SCHOOL SYSTEM IMPACT ANALYSIS (R) Georgia s Redevelopment Powers Law was amended during the 2009 legislative session to include a new provision under section (9)(R), which required preparation of a School System Impact Analysis. Although not required when the 2006 Plan was prepared, the City has added this section to assist the Board of Education in evaluating the effects of redevelopment on the Fulton County School System (FCSS). The information provided also exceeds the minimum requirements (9)(R). THE CURRENT VALUE OF TAD #2 VERSES THE FULTON COUNTY SCHOOL SYSTEM S TAX DIGEST The original base tax digest for TAD #2 was set at $48.8 million when certified in Over the past decade, the taxable assessed value of the TAD has increased to $55.6 million (13.9%). According to the Georgia Department of Revenue, the Fulton County School System s latest published (2016) net taxable M&O digest exceeded $30.6 billion. The base digest of the proposed TAD thus represents only sixteen one hundredths of one percent (0.16%) of the School District s total taxable digest. The amount of ad valorem school taxes on real estate collected from the certified base value of the proposed TAD will continue to flow to the Fulton County School District throughout the remaining operation of the TAD. (This revenue is currently estimated at roughly $902,700). The value of business personal property associated with the development of new retail, office and hospitality space within the TAD will also continue to flow to the School District s General Fund. Table 12: East Point TAD #2 TAD Digest as a Percent of Taxing Jurisdictions* Net Taxable Taxing Jurisdiction M&O Digest TAD #2 Certified Base Digest $48,837,930 City of East Point (Fulton County Portion) $811,347,731 Fulton County $50,315,707,364 Fulton Public Schools $30,638,052,593 East Point TAD #2 Taxable Digest as a % of City of East Point (Fulton County Portion) 6.02% Fulton County 0.10% Fulton County School System 0.16% * This Table reports published 2016 Digest values for comparison purposes. SOURCE: Georgia Department of Revenue, Local Government Services Division School District Impact Analysis (R) (DRAFT) 72
73 BAG estimates that if all TAD projects are successfully implemented according to the schedule, and average values indicated in the redevelopment plan, all taxpayers within the TAD would pay a total of roughly $2.2 million in aggregate School District property taxes on real estate (at the current school millage rate) when fully built out in roughly 10 years. Over an assumed 25-year commitment to the TAD, cumulative School District real estate taxes total $52.75 million. Of that total, BAG estimates that roughly $22.6 million would continue to accrue to the School District s general fund and $30.2 million (in total over 25 years) would be utilized as School District tax increments by the TAD Special Fund. Most of these increments would be due toward the back end of the TAD and potentially never be contributed if bond financing is paid off early and the TAD is dissolved before the end of an agreement. Only $1.7 million of School District tax increments would be contributed, cumulatively, over the first five years of the TAD if the City is successful in implementing projects envisioned in the Redevelopment Plan. IMPLICATIONS OF STATUS QUO CONDITIONS TO THE FCSS The required scope of a school system impact analysis under the Redevelopment Powers Law is limited to identifying potential additional service costs to a school district that could result, should redevelopment projects be successfully implemented. The scope of analysis does not require an analysis of existing conditions, nor a determination of how a continuation of the status quo could impact the host school system. In many cases, the fiscal impacts of doing nothing to change the status quo, can be several times costlier to a school district than pledging TAD proceeds, which are only contributed in the event redevelopment projects are successful and tax digest growth occurs. Grounds for making such a case clearly exist in East Point, as illustrated in the following exhibits. In 2000, approximately $16.4 million of $322.7 million in FCSS property taxes raised to fund education, were generated within the City of East Point, which was responsible for supplying 5.1% of all school district general fund property taxes levied that year. In 2016, the FCSS raised nearly $566.3 million in property taxes to fund education, a 75% increase over the amount levied 16 years earlier. However, total school taxes raised within the City of East Point in 2016 totaled less than $13.2 million, representing a reduction of $3.2 million below the amount levied in The percentage of FCSS property taxes raised within East Point also fell from 5.1% to 2.3% of the District s total. If inflation effects are added, resulting revenue losses from East Point would be even more striking. Revenue losses from East Point have been mitigated by substantial value growth in other areas of the District. It should also be noted that revenue losses to the School District would have been much worse had the City not succeeded in implementing TAD #1 Camp Creek, which has produced a substantial increase in business personal property digest and E-LOST revenues to the FCSS, partially offsetting steeper value declines that have occurred elsewhere in the City. The FCSS is also receiving annual payments of School District Impact Analysis (R) (DRAFT) 73
74 excess school tax allocation increments, which exceed likely real estate taxes the FCSS would be collecting today had the Camp Creek TAD never been created. 12 FCSS Property Tax Revenues from East Point $20,000,000 $18,000,000 $16,000,000 $14,000,000 $12,000,000 $10,000,000 $8,000,000 $6,000,000 $4,000,000 $2,000,000 $0 Trends in FCSS Geneneral Fund Property Taxes Collected within the City of East Point: FCSS Property Taxes from East Point East Point % Share of Total FCSS Property Taxes 6.0% 5.0% 4.0% 3.0% 2.0% 1.0% 0.0% East Point Share of Total FCSS Tax Levy Total FCSS Property Tax Collections within the City of East Point were lower in 2016 than they were in 2000, even before considering inflation. Growth is the City s tax digest since 2000 as averaged only a minor fraction of growth district wide. 12 The Intergovernmental Agreement between City and School District calls for the annual rebating of excess educational tax allocation increments after debt service obligations on TAD bonds have been met. Annual surpluses in TAD #1 have grown to the point where this provision now applies. School District Impact Analysis (R) (DRAFT) 74
75 While school revenues generated within East Point have decreased in both nominal and real terms for more than a decade, the number of students enrolled in FCSS schools which are located inside the City has been increasing, from a low point of 6,244 FTE students in 2004, to 7,345 in Although attendance zones for these schools in some cases extend beyond the City Limits of East Point, a large majority of those students are city residents. The percentage of FCSS students in East Pointbased schools has also stabilized at between 7.4% to 8.2% of total District enrollment, indicating that the District s cost to educate those students is roughly 4 times greater than the percentage of local revenues raised from the same area to fund education. FTE Students in East Point-Based FCSS Schools 7,600 7,400 7,200 7,000 6,800 6,600 6,400 6,200 6,000 5,800 5,600 FCSS Enrollment in Public Schools Located within the City of East Point: % 10.0% 8.0% 6.0% 4.0% 2.0% 0.0% % of District-Wide Enrollment Total FTE Enrollment in East Point Schools % of FCSS Erollment in East Point Schools The following additional statistics, taken directly from the US Census Bureau s 2015 American Community Survey, shed additional light on existing characteristics and conditions of families and students living within the East Point portion of the Fulton County School District: Roughly 85% of East Point s population is comprised of minorities; 7.8% of the City s population was estimated to be foreign born of which, more than 70.6% were born in Latin American countries; 23.8% of households consisted of families with children under 18 living at home; Among households with children, 34.2% were married couple families, and the balance were single-parent households. In total 55.3% of all East Point families with children were headed by single females and 10.5% by males; 19.2% of all households were occupied by at least one person over the age of 65; School District Impact Analysis (R) (DRAFT) 75
76 The vacancy rate in the City s housing stock was still estimated at nearly 23% in 2015; 58% of all occupied housing units were estimated to be rented, roughly 20 percentage points higher than the renter occupancy rate district-wide; 19.1% of the City s population was estimated to have occupied a different housing unit a year earlier, suggesting a high turnover rate of households and a highly mobile student population; 68.5% of the City s housing stock was estimated to be is more than 35 years old, and the median value of owner occupied housing was estimated at only $88,400 in 2015; 40.5% of homeowners and 59% of renters had issues with housing affordability, defined as paying more than 30% of their household income on housing costs; and Nearly 44.4% of East Point s student-aged population (age 5 to 17) lived in families with incomes below the poverty level, more than 3 times the State average. These indicators provide additional evidence of the educational challenges posed by existing conditions in East Point. Like the City, FCSS has a significant stake in seeing economic conditions improved, for both the fiscal benefit of the school system and for the benefit of its families and students. PROPOSED REDEVELOPMENT IN EAST POINT TAD #2 A continuation of status quo trends, which have persisted and worsened for nearly two decades, would clearly hurt the FCSS. Although implementation of the redevelopment plan will not, alone, reverse these trends, there is little evidence to suggest that improvement is possible otherwise. The City s best hope to reverse long term trends is to incentivize one or more catalyst redevelopment projects in the Downtown Area, taking advantage of its valuable but underutilized transit infrastructure. As has been demonstrated in several similarly sized cities throughout the region, the successful revitalization of downtowns eventually helps to stabilize and increase housing values in surrounding neighborhoods. As detailed earlier in this plan, there are six most likely locations for redevelopment projects to occur within the 295-acre East Point TAD#2. These areas would be priority locations for investment of TAD proceeds. Redevelopment Plan calls for a higher-density mix of uses which will expand the existing Downtown business district and attract residential, employment and retail/entertainment uses. Based on the proposed plan, the new development could increase the total digest (40%) value of taxable real estate within the TAD by nearly $54.4 million over current levels. The projects could include: An estimated 580 new residential units including new apartments, townhomes and senior living units within Downtown East Point; and School District Impact Analysis (R) (DRAFT) 76
77 Approximately 400,000 SF of commercial space including retail, office, hospitality and possible flex space in planned retail centers and mixed-use developments. ESTIMATED NUMBER OF FUTURE PUBLIC SCHOOL STUDENTS LOCATED WITHIN THE TAD Based on the proposed projects, the following table presents an estimate of the number of new residents and school children that could be anticipated to live in the proposed TAD as a result of successful redevelopment, at the end of an approximate 10-year construction period. These increases would be phased over time and would be unlikely to produce any significant change in School District enrollment within the first five years following certification of TAD #2. Table 13: East Point Corridors TAD #2 Estimated Residents and School Aged Children Associated with Proposed Residential Components at Build Out Residential Products Units Resident Multiplier* Estimated Residents School Aged Children Multiplier* Estimated School Aged Children For- Sale Townhomes bedroom (80% ) bedroom (20% ) Senior Living bedroom (100% ) bedroom (0% ) Multi-Family Apartments bedroom (50% ) bedroom (50% ) Total Units 580 Total 1+2 Bedroom Units 560 % 1+ 2 Bedroom units 97% Total Residents/Total Pupils TotalResidents/Pupils/Unit Source: Rutgers University/Center for Urban Policy Research, 2006/BAG *"for owner and renter units combined As shown in the above table, there would be an estimated 953 new residents and 58 school aged children from the combined potential development of 580 residential units when completed and fully occupied ten or more years into the future. Fulton County Schools that serve East Point s student population had an October 2017 FTE enrollment of 7,345, out of a total district wide enrollment of 96,122, according to the Georgia Department of Education web site. Therefore, potential residential development in the proposed TAD would have an impact of less than eight tenths of one percent (0.79%) on FCSS enrollment in East Point-based schools when completed, assuming local enrollment remains at current levels. District-wide, enrollment impacts are negligible at 0.06%. School District Impact Analysis (R) (DRAFT) 77
78 The most significant impact to the School District would occur if successful redevelopment of Downtown East Point eventually results in the stabilization and improvement of surrounding neighborhoods, and the transition of single-family detached rental housing, (which is not located inside the TAD) back to home ownership over time. The City s goal is to reverse the deterioration of home values in existing neighborhoods and stop the erosion of the City s and School District s tax base. A side benefit to FCSS would be to partially replace a highly mobile student population dominated by transient rental households, with more stable families that will remain in the neighborhoods and schools for multiple years. THE LOCATION OF SCHOOL FACILITIES WITHIN THE REDEVELOPMENT AREA There is one Fulton County Schools facility located in the East Point Corridor TAD: Parklane Elementary School, which is located at 2809 Blount Street (Parcel ID: LL018). AN ESTIMATE OF EDUCATIONAL SPECIAL PURPOSE LOCAL OPTION (ESPLOST) SALES TAXES AND INCREMENTAL BUSINESS PERSONAL PROPERTY TAXES PROJECTED FROM TAD DEVELOPMENT In terms of the potential redevelopment projects described in the Redevelopment Plan, a portion of those projects would create new retail, commercial or hotel space that would generate potential e-splost revenues in future years. A portion of the households residing in the TAD would also be new to the County and would be expected to generate additional e-splost through their taxable household purchases made within the County. This part of Fulton County has also historically been underserved by retailers and County residents have tended to travel to nearby Clayton or other neighboring counties to make retail purchases. This leakage and resulting loss of e-splost dollars to the Fulton County School District was greatly reduced by the development of Camp Creek Marketplace and could be further helped by complementary commercial development in Downtown East Point and in nearby College Park. Finally, new commercial, retail, hotel, s and office space would increase the School District s business personal property tax digest. Only the real estate portion of the School Tax Digest within TAD #2 would be pledged to the TAD. Personal property taxes on commercial and industrial property would continue to flow to the School District General Fund. In 2016, 32.8% of East Point s total commercial tax digest was comprised of personal property rather than real estate, meaning that for every $1.00 of existing commercial real estate digest in the City, an additional $0.49 in commercial personal property value was also created. It can therefore be reasonably assumed that for every dollar of contributed school district TAD increment created by future commercial or industrial redevelopment within TAD #2, the School District would receive roughly $0.49 in additional personal property digest that would immediately flow to the School District s General Fund, in addition to total revenues associated with the certified base value of the TAD. Cumulatively School District Impact Analysis (R) (DRAFT) 78
79 over 25 years it is estimated that the FCSS would receive an additional $6.17 million in new school tax revenues from commercial personal property. Table 14: Forecast of Incremental FCSS Revenues Assuming Participation In East Point Commercial Corridors, TAD #2 Year Added PP Digest PP Taxes ELOST Total $0 $0 $0 $ $0 $0 $0 $ $739,500 $13,668 $57,094 $70, $2,298,379 $42,481 $148,709 $191, $7,866,297 $145,393 $242,151 $387, $12,680,312 $234,370 $319,107 $553, $13,773,911 $254,583 $359,802 $614, $14,417,000 $266,469 $382,325 $648, $14,731,358 $272,280 $386,118 $658, $14,942,634 $276,185 $389,949 $666, $15,157,255 $280,152 $393,819 $673, $15,375,277 $284,181 $397,727 $681, $15,596,759 $288,275 $401,675 $689, $15,821,761 $292,434 $405,662 $698, $16,050,343 $296,658 $409,688 $706, $16,282,567 $300,951 $413,755 $714, $16,518,495 $305,311 $417,863 $723, $16,758,192 $309,742 $422,012 $731, $17,001,722 $314,243 $426,202 $740, $17,249,152 $318,816 $430,434 $749, $17,500,550 $323,463 $434,708 $758, $17,755,983 $328,184 $439,026 $767, $18,015,522 $332,981 $443,386 $776, $18,279,239 $337,855 $447,790 $785, $18,547,205 $342,808 $451,948 $794,756 Totals: $6,161,482 $8,620,950 $14,782,432 ** Assumes a Fulton County Schools Millage Rate of Source: Bleakly Advisory Group, Inc. At build-out, East Point TAD#2 could be expected to generate a modest net gain of approximately $390,000 annually in e-splost revenues to the Fulton County Schools during years in which an e-splost is in effect. In addition, BAG estimates that the District would gain roughly $276,000 per year in increased tax revenues from business personal property, associated with proposed hotels, retail centers and office development components. The increased personal property taxes and real estate taxes on the base value of the TAD will generate roughly $1.2 million in total annual property tax revenues to the School District by year 10. The increase in school district revenues from personal School District Impact Analysis (R) (DRAFT) 79
80 property alone represents added local revenues of roughly $4,800 per expected additional student. Adding expected increases in e-splost raises annual School District revenues to nearly $1.6 million from the TAD at build out. Combined increases in e-splost and taxes on commercial personal property are less than contributed school tax increments in year 10, but substantially higher that likely FCSS revenues if recent trends in East Point remain unchanged. Absent of the TAD and its ability to accelerate implementation of the City s redevelopment effort within Downtown, it is likely to take decades for the Fulton County School District to achieve comparable revenue growth from property and sales taxes generated within this area of East Point. CONCLUSION REGARDING SCHOOL DISTRICT IMPACTS Impacts on the Fulton County Public School System from participating in East Point TAD #2 are as follows: The proposed TAD will affect the future appreciation on 0.16% (sixteen onehundredths of one percent) of the School s taxable digest. All current property taxes on real estate (roughly $902,700/year) will continue to go to the school system only increases above the current amount are pledged to the TAD. The redevelopment area will potentially attract 950 new residents and fewer than 60 school-aged children at build out, achieved after several years of construction. This represents an addition of 0.8% to the current enrollment of FCSS schools located within the City limits. There is one existing Fulton County School facility located inside the TAD boundary, Parklane Elementary School, which is located at 2809 Blount Street. (Parcel ID: LL018) When fully built out within roughly 10 years, the proposed redevelopment projects could collectively generate an additional $390,000 per year in net annual e-lost funds from new residents and businesses, during years in which the e-lost is in effect. In addition, increased commercial personal property digest, which is not pledged to the TAD, could generate roughly $280,000 per year in educational property taxes. Should the FCSS not consent to TAD #2 and as a result, no major redevelopment projects are implemented, it is likely that property values would continue to grow modestly, by the same average as occurred during the first decade since TAD #2 was formed. In such a case, the FCSS would instead receive an additional $8.0 million in increased real estate taxes from future value growth within TAD #2, School District Impact Analysis (R) (DRAFT) 80
81 cumulatively, over 25 years. 13 Maintaining status quo conditions in TAD #2 will also have no impact in reversing the long-term erosion of school tax revenues generated elsewhere in the City. By comparison, forecasted cumulative gains in e-lost and commercial personal property taxes from implementing the six identified TAD projects are estimated to total nearly $14.8 million to the FCSS over the same 25-year period. Increased FCSS revenues received from participating in the TAD, while it is in effect, thus exceed the modest amount of real estate taxes that might otherwise be collected if the FCSS chooses not to consent, and such a decision results in no major redevelopment projects being implemented, and status quo conditions continue on the path experienced over the past decade. Thus we conclude that the potential revenue gains to the Fulton County Schools from participating in the proposed TAD will be significantly positive due to the future growth in its tax digest and e-splost revenues over existing levels not only over the long term, but also during the period while the TAD is still in effect, with minimal impact on the demand for school services. SUMMARY CONCLUSION: POTENTIAL BENEFITS OF CREATING TAD #2 - EAST POINT COMMERCIAL CORRIDORS As summarized in the following table, the amended TAD #2 - East Point Commercial Corridors could generate $126 million in new development which would increase the current $55.6 million taxable digest value of the TAD by an additional $54.4 million, an increase of 97%. More than $1.6 million SF of new/rehabilitated commercial development within the TAD could potentially house 750 to800 local jobs when fully occupied. This projected investment would result in approximately $2.9 million in new, incremental annual property tax receipts from real estate by the 10 th year of implementation and support net TAD funding for up to $31.0 million in needed infrastructure IF the City chose to issue TAD Bonds and all taxing jurisdictions consent to participate. The use of TAD proceeds as local match to supplement other forms of project financing obtained by the City, or on a-pay-as-you-go basis, could be expected to leverage differing levels of project funding. 13 This estimate represents the incremental gain of 1.3% annual digest growth compounded, over existing FCSS revenues of $902,000 per year associated with the base value of the TAD. If the FCSS was currently participating in TAD #2, its total financial commitment to the TAD Special Fund would have been roughly $125,000 in School District Impact Analysis (R) (DRAFT) 81
82 Tax Allocation District #2 - East Point Commercial Corridors APPENDICES APPENDIX A. LIST OF TAX PARCEL ID NUMBERS (PROPERTIES WITHIN THE TAD) APPENDIX B. EAST POINT MAYOR AND CITY COUNCIL APPENDIX C. FULTON COUNTY BOARD OF COMMISSIONERS APPENDIX D. FULTON COUNTY BOARD OF EDUCATION Appendices (DRAFT) 82
83 Tax Allocation District #2 - East Point Commercial Corridors APPENDIX A. LIST OF TAX PARCEL ID NUMBERS (PROPERTIES WITHIN THE TAD) The following pages contain the original list of tax parcels, owners, 2006 values, and acreage associated with the properties that made up Tax Allocation District #2 East Point Commercial Corridors. Appendices (DRAFT) 83
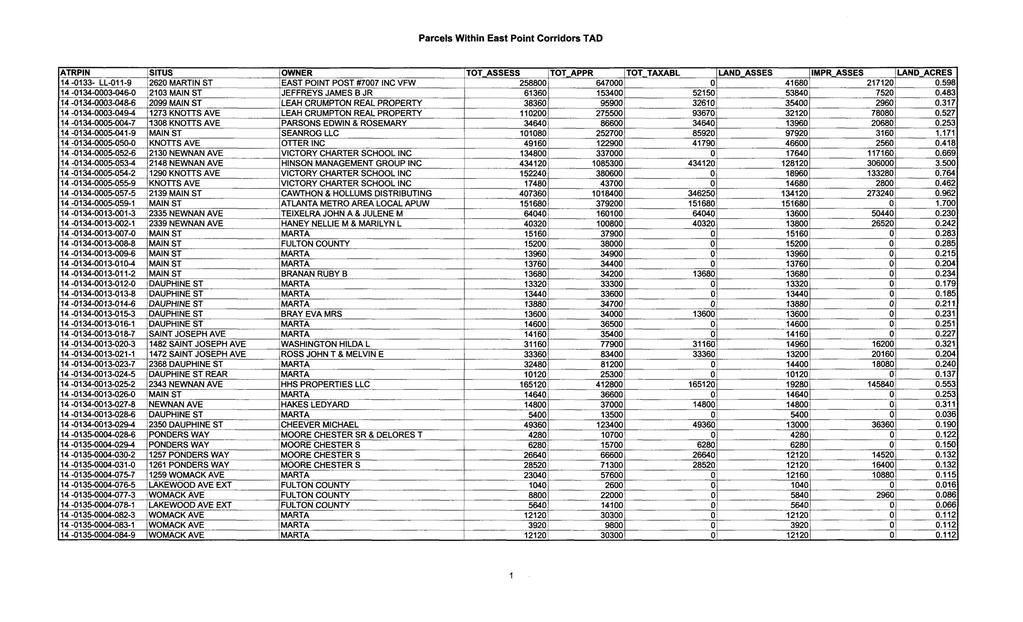
84
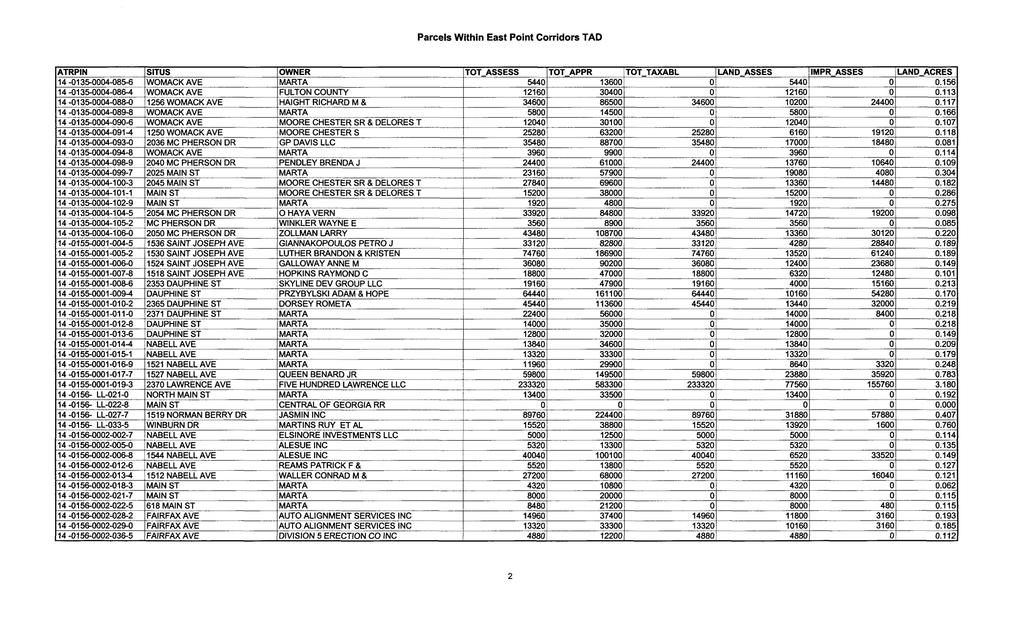
85
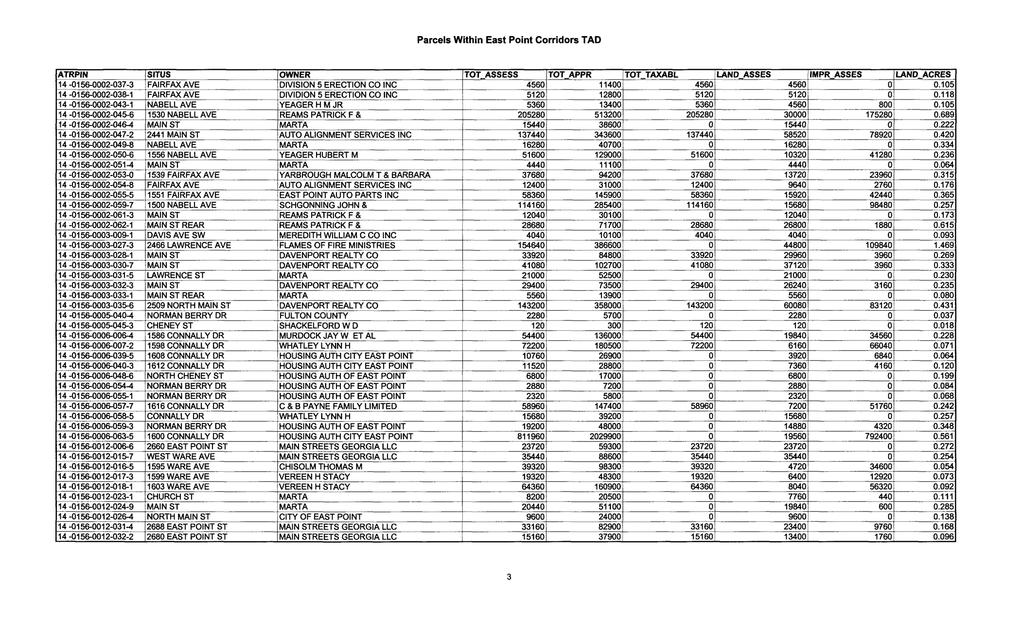
86
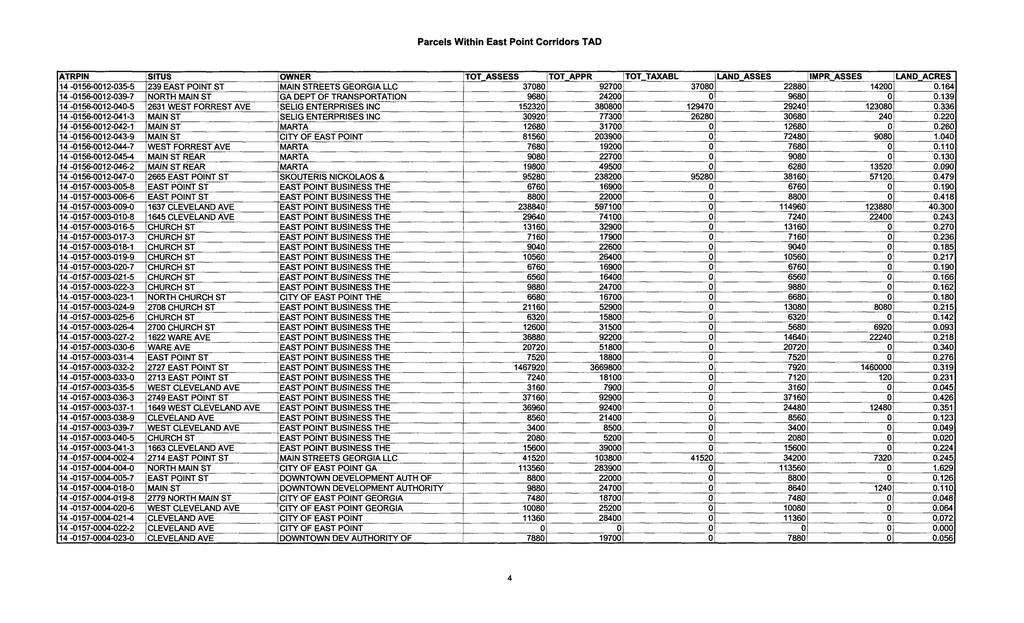
87
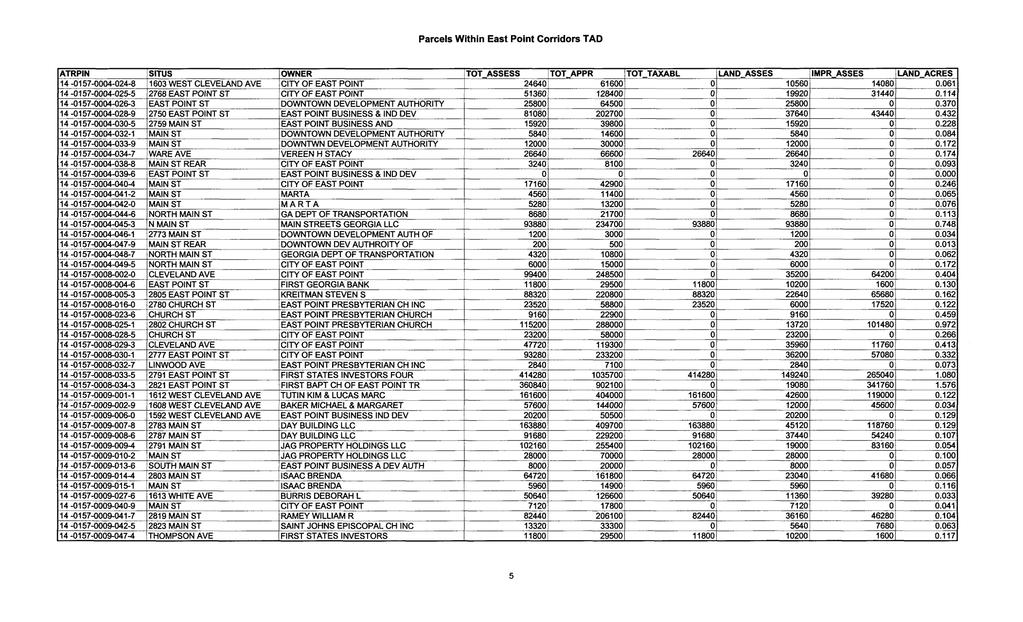
88
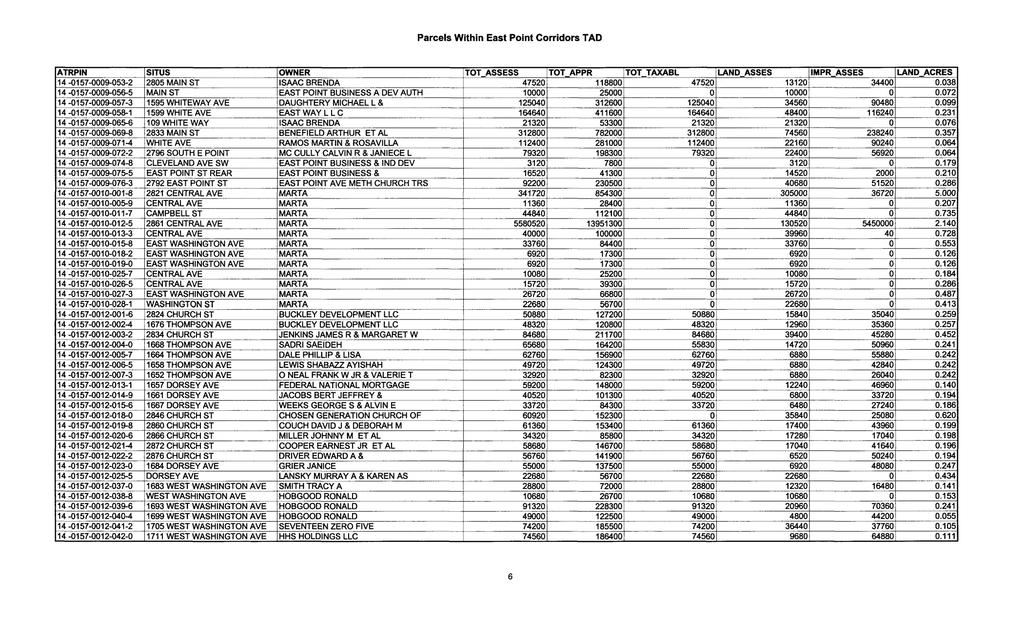
89
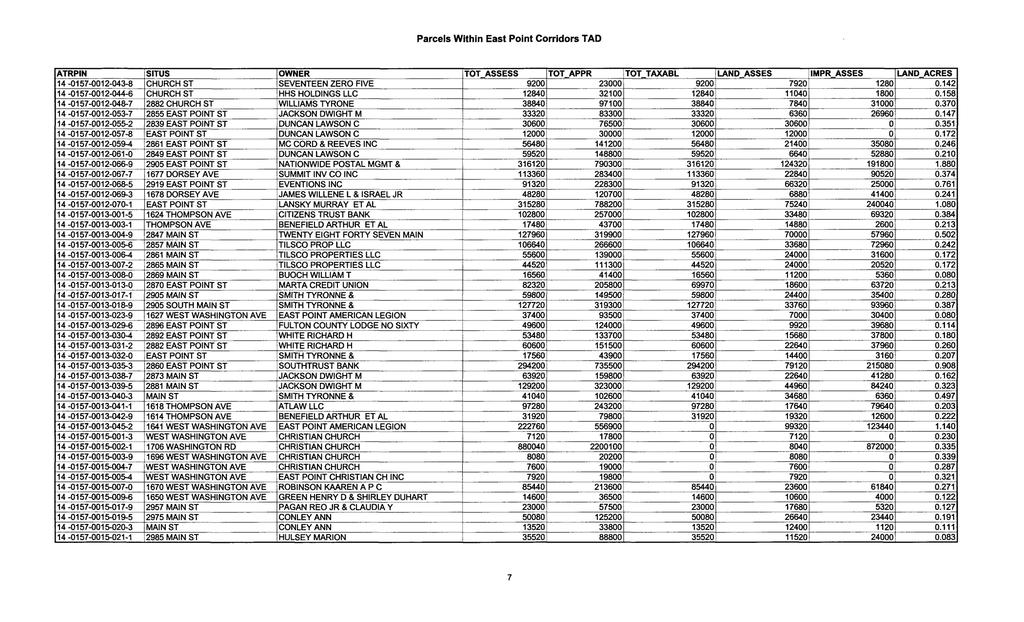
90
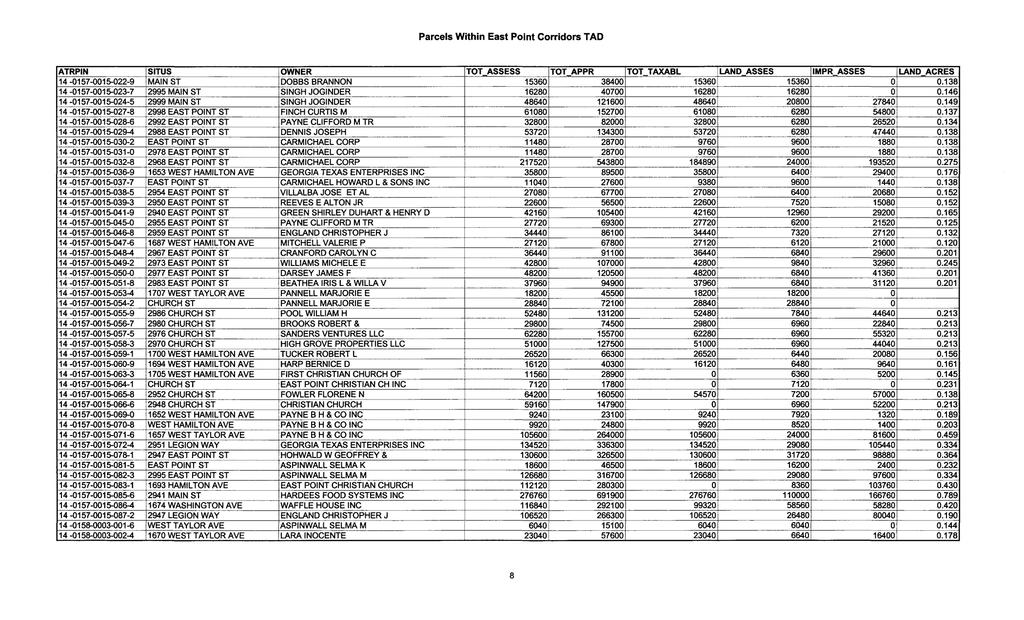
91
92
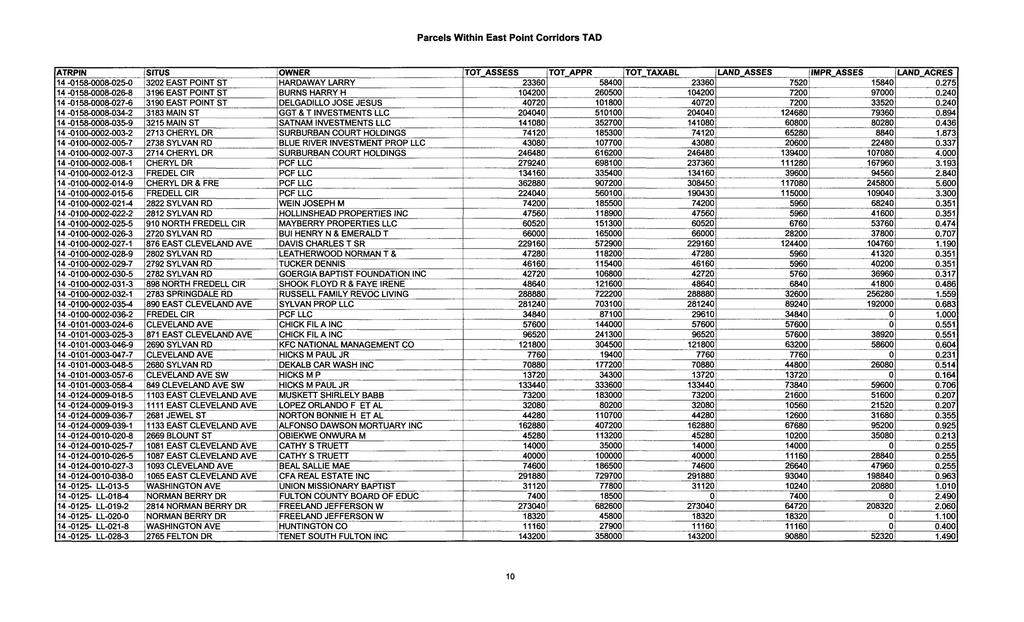
93
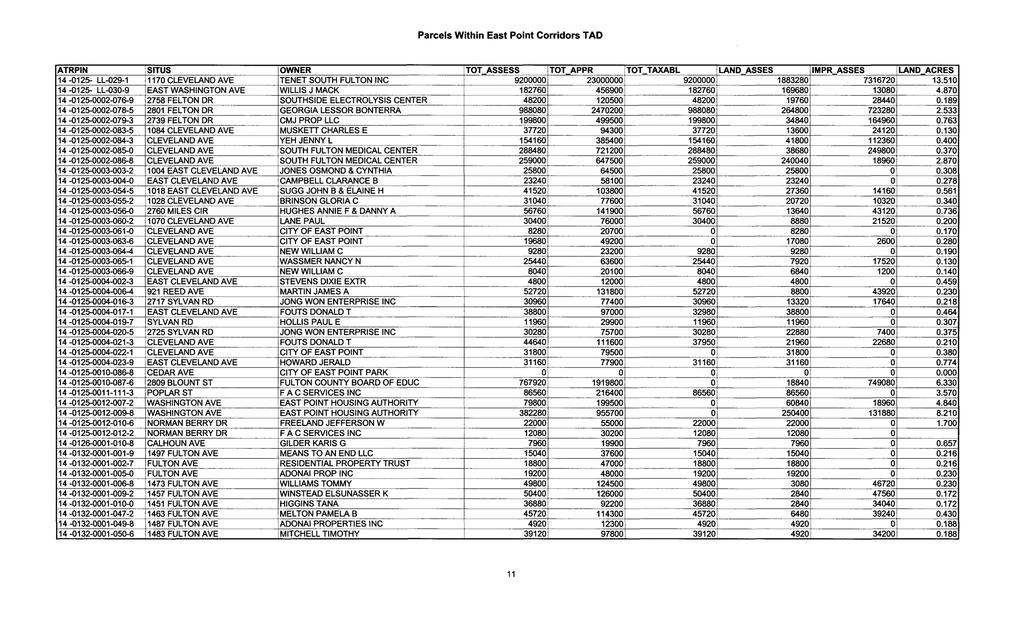
94
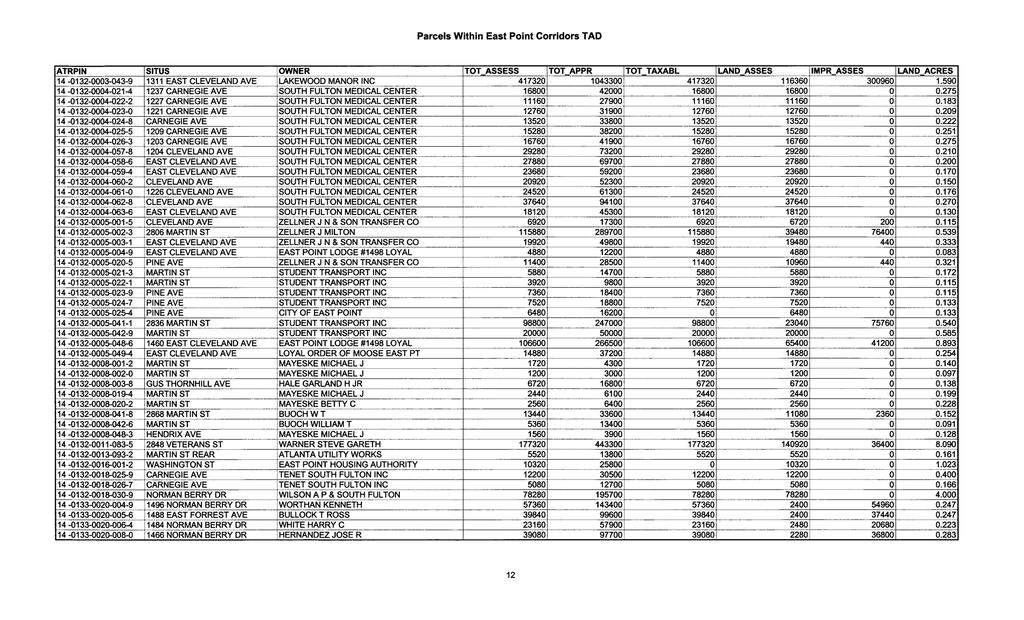
95
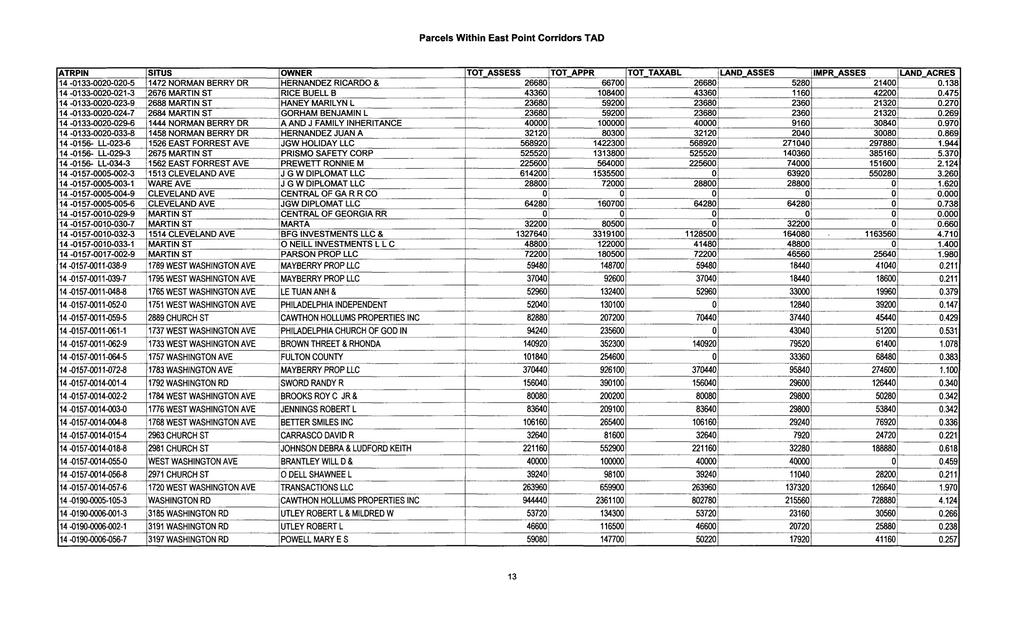
96
97 Tax Allocation District #2 - East Point Commercial Corridors APPENDIX B. EAST POINT MAYOR, CITY COUNCIL AND CITY MANAGER Jannquell Peters, Mayor Sharon Shropshire, Councilmember Ward A At-Large Alexander Gothard, Councilmember, Ward A Karen Rene, Councilmember, Ward B At-Large Thomas Calloway, Councilmember, Ward B Nanette Saucier, Councilmember, Ward C, At-Large Myron B. Cook, Councilmember, Ward C Deana Holiday Ingraham, Councilmember, Ward D, At-Large Stephanie Gordon, Councilmember, Ward D Frederick D. Gardner, AICP, City Manager Appendices (DRAFT) 97


98 Tax Allocation District #2 - East Point Commercial Corridors APPENDIX C. FULTON COUNTY BOARD OF COMMISSIONERS AND COUNTY MANAGER John H. Eaves, Chairman, District 7, At-Large Liz Hausmann, District 1 Commissioner Bob Ellis, District 2 Commissioner Lee Morris, District 3 Commissioner Joan P. Garner, Vice Chair, District 4 Commissioner Marvin S. Arrington, Jr., District 5 Commissioner Emma I. Darnell, District 6 Commissioner Richard Anderson, County Manager Appendices (DRAFT) 98
Summary. Draft Redevelopment Plan Summary Flowery Branch Tax Allocation District # 1:
 Summary Draft Redevelopment Plan Summary Flowery Branch Tax Allocation District # 1: Flowery Branch Tax Allocation District Old Town and Commercial Gateways 1 Public Hearing Presentation November 21, 2007
TITLE TEXT HERE WRITE YOUR TEXT HERE
 TITLE TEXT HERE WRITE YOUR TEXT HERE + City of Powder Springs Atlanta Regional Commission Bleakly Advisory Group Southeastern Engineering Morris & Fellows Springs in Motion is the 10-Year Update to the
PEACHTREE INDUSTRIAL BOULEVARD small area study
 PEACHTREE INDUSTRIAL BOULEVARD small area study EXECUTIVE SUMMARY: MARKET RESEARCH FINDINGS DUNWOODY CITY COUNCIL RETREAT JUNE 4, 2018 STUDY SCOPE AND GOALS Bleakly Advisory Group (BAG) was retained to
Understanding Texas TIRZ Statute Chapter 311 Texas Tax Code
 CDFA/TEDC TIRZ SEMINAR Understanding Texas TIRZ Statute Chapter 311 Texas Tax Code Clark Stockton Lord Constitutional Authority The legislature by general law may authorize an incorporated city or town
TASK 2 INITIAL REVIEW AND ANALYSIS U.S. 301/GALL BOULEVARD CORRIDOR FORM-BASED CODE
 TASK 2 INITIAL REVIEW AND ANALYSIS U.S. 301/GALL BOULEVARD CORRIDOR FORM-BASED CODE INTRODUCTION Using the framework established by the U.S. 301/Gall Boulevard Corridor Regulating Plan (Regulating Plan),
PRELIMINARY PROJECT PLAN AND REINVESTMENT ZONE FINANCING PLAN FOR PROPOSED TAX INCREMENT REINVESTMENT ZONE NO. 1, CITY OF OAK RIDGE NORTH
 PRELIMINARY PROJECT PLAN AND REINVESTMENT ZONE FINANCING PLAN FOR PROPOSED TAX INCREMENT REINVESTMENT ZONE NO. 1, CITY OF OAK RIDGE NORTH DECEMBER 15, 2014 TABLE OF CONTENTS 1. Overview 1.1 Background...
Community Revitalization Efforts 2016 Thresholds and Scoring Criteria
 s 2016 Thresholds and Scoring Criteria Definitions: a deliberate, concerted, and locally approved plan or documented interconnected series of local approvals and events intended to improve and enhance
CITY CLERK. Consolidated Clause in Policy and Finance Committee Report 7, which was considered by City Council on July 19, 20, 21 and 26, 2005.
 CITY CLERK Consolidated Clause in Report 7, which was considered by City Council on July 19, 20, 21 and 26, 2005. 3 Regent Park Revitalization - Financial Strategy (Ward 28) City Council on July 19, 20,
URBAN REVITALIZATION PLAN CITY OF DECORAH, IOWA 2014 DECORAH HOUSING URBAN REVITALIZATION AREA ADOPTED NOVEMBER 3, 2014
 URBAN REVITALIZATION PLAN CITY OF DECORAH, IOWA 2014 DECORAH HOUSING URBAN REVITALIZATION AREA ADOPTED NOVEMBER 3, 2014 Public Hearing held September 2, 2014 Second Public Hearing held October 6, 2014
WRT. October 16, Arthur Collins President Collins Enterprises, LLC 2001 West Main Street, Suite 175 Stamford, CT 06902
 Planning & Design October 16, 2010 Arthur Collins President Collins Enterprises, LLC 2001 West Main Street, Suite 175 Stamford, CT 06902 Re: Review of The Landmark at Talbot Park Philadelphia Dallas Lake
Hennepin County Department of. Housing, Community Works and Transit. Transit Oriented Development (TOD) Guidelines
 Guidelines") Hennepin County Department of Housing, Community Works and Transit 2007 Transit Oriented Development (TOD) Guidelines Hennepin County Transit Oriented Development (TOD) Bond Funds Hennepin County Housing,
Hennepin County Department of Housing, Community Works and Transit 2007 Transit Oriented Development (TOD) Guidelines Hennepin County Transit Oriented Development (TOD) Bond Funds Hennepin County Housing,
When the Plan is not Enough
 When the Plan is not Enough Christine Maguire, AICP, EDFP Redevelopment Manager Planning & Community Development 1 Rail~Volution 2012 When the Plan is Not Enough: Garland, TX 16 October 2012 About the
CLARK COUNTY NEIGHBORHOOD REVITALIZATION PLAN. Effective Date. January 1, Revised
 CLARK COUNTY NEIGHBORHOOD REVITALIZATION PLAN Effective Date January 1, 2007 Revised January 1, 2010 KANSAS NEIGHBORHOOD REVITALIZATION ACT K.S.A. 1996 Supp. 12-17, 114 et seq. This law authorizes any
Shawnee Landing TIF Project. City of Shawnee, Kansas. Need For Assistance Analysis
 Shawnee Landing TIF Project City of Shawnee, Kansas Need For Assistance Analysis December 17, 2014 Table of Contents 1 EXECUTIVE SUMMARY... 1 2 PURPOSE... 2 3 THE PROJECT... 3 4 ASSISTANCE REQUEST... 7
Chapter 1: Community & Planning Context
 Chapter 1: Community & Planning Context Yesterday, Today & Tomorrow Comprehensive Plan 2040 2 INTRODUCTION The City of Lauderdale is a small town with a long history. Nestled between Saint Paul and Minneapolis,
DESCRIPTION OF THE DISTRICT
 DESCRIPTION OF THE DISTRICT The project plan for City of Wausau, Tax Increment District #11 has been prepared in compliance with Wisconsin Statutes Chapter 66.1105(4). The plan establishes the need for
Summary Report on the Economic Impact of the State Center Project Baltimore, MD
 Summary Report on the Economic Impact of the State Center Project Baltimore, MD Prepared for: Maryland Department of Transportation Prepared by: BAE Urban Economics March 2011 Summary of Key Findings Phase
HOUSING & RESIDENTIAL AREAS
 CHAPTER 10: HOUSING & RESIDENTIAL AREAS OVERVIEW With almost 90% of Ridgefield zoned for residential uses, the patterns and form of residential development can greatly affect Ridgefield s character. This
DRAFT. Amendment to the Master Plan Land Use Element for Block 5002, Lot Township of Teaneck, Bergen County, New Jersey.
 DRAFT Amendment to the Master Plan Land Use Element for Block 5002, Lot 18.01 Township of Teaneck, Bergen County, New Jersey Prepared for: Township of Teaneck Planning Board Prepared by: Janice Talley,
PLANNED UNIT DEVELOPMENTS (Ordinance No.: 3036, 12/3/07; Repealed & Replaced by Ordinance No.: 4166, 10/15/12)
") 159.62 PLANNED UNIT DEVELOPMENTS (Ordinance No.: 3036, 12/3/07; Repealed & Replaced by Ordinance No.: 4166, 10/15/12) A. PURPOSE 1. General. The Planned Unit Development (PUD) approach provides the flexibility
159.62 PLANNED UNIT DEVELOPMENTS (Ordinance No.: 3036, 12/3/07; Repealed & Replaced by Ordinance No.: 4166, 10/15/12) A. PURPOSE 1. General. The Planned Unit Development (PUD) approach provides the flexibility
City of Winnipeg Housing Policy Implementation Plan
 The City of Winnipeg s updated housing policy is aligned around four major priorities. These priorities are highlighted below: 1. Targeted Development - Encourage new housing development that: a. Creates
PROPOSED METRO JOINT DEVELOPMENT PROGRAM: POLICIES AND PROCESS July 2015 ATTACHMENT B
 PROPOSED METRO JOINT DEVELOPMENT PROGRAM: POLICIES AND PROCESS ATTACHMENT B TABLE OF CONTENTS I. INTRODUCTION / PURPOSE............................ 3 II. OBJECTIVES / GOALS..................................
City of Lawrence Neighborhood Revitalization Plan and Program: 1101/1115 Indiana Street Lawrence, KS
 City of Lawrence Neighborhood Revitalization Plan and Program: 1101/1115 Indiana Street Lawrence, KS Definition: Area - used interchangeably with Property, referring to the property located at 1101/1115
POPULATION FORECASTS
 POPULATION FORECASTS Between 2015 and 2045, the total population is projected to increase by 373,125 residents to reach 2.2 million. Some areas will see major increases, while other areas will see very
CITY OF COLD SPRING ORDINANCE NO. 304
 CITY OF COLD SPRING ORDINANCE NO. 304 AN ORDINANCE AMENDING THE CITY CODE OF COLD SPRING BY ADDING SECTIONS 555 AND 510 PERTAINING TO PAYMENT-IN-LIEU-OF-PARKING THE CITY COUNCIL OF THE CITY OF COLD SPRING,
TOTTENHAM SECONDARY PLAN
 TOTTENHAM SECONDARY PLAN AMENDMENT NO. 11 TO THE OFFICIAL PLAN OF THE TOWN OF NEW TECUMSETH The following text and schedules to the Official Plan of the Town of New Tecumseth constitute Amendment No. 11
3. FISCAL IMPACT ANALYSIS FISCAL IMPACT ANALYSIS 29
 3. FISCAL IMPACT ANALYSIS FISCAL IMPACT ANALYSIS 29 The purpose of fiscal impact analysis is to estimate the impact of a development or a land use change on the budgets of governmental units serving the
Downtown & East Town CRA Expansion Plan City of Eustis
 Downtown & East Town CRA Expansion Plan City of Eustis May 2018 Contents 1 Introduction... 1 CRA Overview/History... 1 2 Existing Conditions... 2 Downtown & East Town Community Redevelopment Area Expansion...
CITY OF EAST LANSING BROWNFIELD REDEVELOPMENT AUTHORITY REVISED BROWNFIELD PLAN AMENDMENT 4. June 17, 2010
 CITY OF EAST LANSING BROWNFIELD REDEVELOPMENT AUTHORITY REVISED BROWNFIELD PLAN AMENDMENT 4 June 17, 2010 FOR THE WEST VILLAGE REDEVELOPMENT PROJECT (FORMER GREYHOUND BUS STATION) Prepared on Behalf of:
Generic Environmental Impact Statement. Build-Out Analysis. City of Buffalo, New York. Prepared by:
 Generic Environmental Impact Statement Build-Out Analysis City of Buffalo, New York 2015 Prepared by: TABLE OF CONTENTS 1.0 INTRODUCTION 1 2.0 METHODOLOGY 2 3.0 EXISTING LAND USE 3 4.0 EXISTING ZONING
GWINNETT COUNTY, GEORGIA TAX ALLOCATION DISTRICT POLICIES AND GUIDELINES SECTION I. TAD POLICY AND GUIDELINES
 GWINNETT COUNTY, GEORGIA TAX ALLOCATION DISTRICT POLICIES AND GUIDELINES SECTION I. TAD POLICY AND GUIDELINES I. General Policy A. It is the policy of Gwinnett County to consider the use of TAD financing
Analysis of Proposed College Park Redevelopment Plan. Tax Allocation District #1, Downtown and Airport Gateways SEPTEMBER 29, 2015
 SEPTEMBER 29, 2015 REVISED MARCH 2, 2016 Analysis of Proposed College Park Redevelopment Plan: Tax Allocation District #1, Downtown and Airport Gateways Table of Contents Introduction 1 Summary of Tax
Housing Characteristics
 CHAPTER 7 HOUSING The housing component of the comprehensive plan is intended to provide an analysis of housing conditions and need. This component contains a discussion of McCall s 1990 housing inventory
Redevelopment Project Plan and Eligibility Report for the: Cook County Project Area. Village of East Dundee, Illinois. Draft: July 18, 2012
 for the: Cook County Project Area Village of East Dundee, Illinois Draft: Created By: Vandewalle & Associates 2012 Table of Contents TABLE OF CONTENTS Table of Contents... i Executive Summary... 1 Part
Downtown Meridian Urban Renewal Area URBAN RENEWAL ELIGIBILITY REPORT. Prepared for The City of Meridian and The Meridian Development Corporation
 Downtown Meridian Urban Renewal Area URBAN RENEWAL ELIGIBILITY REPORT Prepared for The City of Meridian and The Meridian Development Corporation by McKibben + Cooper Architects June 19, 2002 Authorization
CLASS 7B ELIGIBILITY BULLETIN
 COOK COUNTY ASSESSOR J O S EPH BE R RIOS COOK COUNTY ASSESSOR S OFFICE 118 NORTH CLARK STREET, CHICAGO, IL 60602 PHONE: 312.443.7550 FAX: 312.603.3616 WWW.COOKCOUNTYASSESSOR.COM CLASS 7B ELIGIBILITY BULLETIN
Wheaton Sector Plan. Preliminary. Recommendations. Montgomery County Planning Board
 Sector Plan Preliminary Recommendations Montgomery County Planning Board 12-03-09 Scope of Work September 2008 Status Report June 2009 Preliminary Recommendations December 2009 1952 Process Today Community
DRAFT REPORT. Boudreau Developments Ltd. Hole s Site - The Botanica: Fiscal Impact Analysis. December 18, 2012
 Boudreau Developments Ltd. Hole s Site - The Botanica: Fiscal Impact Analysis DRAFT REPORT December 18, 2012 2220 Sun Life Place 10123-99 St. Edmonton, Alberta T5J 3H1 T 780.425.6741 F 780.426.3737 www.think-applications.com
HOUSING ELEMENT GOALS, OBJECTIVES, AND POLICIES
 HOUSING ELEMENT GOALS, OBJECTIVES, AND POLICIES GOAL 1: To promote the preservation and development of high-quality, balanced, and diverse housing options for persons of all income levels throughout the
PHASE 1 AMENDMENT TO THE STATION AREA REDEVELOPMENT PLAN BOROUGH OF NETCONG, MORRIS COUNTY, NEW JERSEY
 PHASE 1 AMENDMENT TO THE STATION AREA REDEVELOPMENT PLAN BOROUGH OF NETCONG, MORRIS COUNTY, NEW JERSEY PREPARED BY PHILLIPS PREISS GRYGIEL LLC PLANNING & REAL ESTATE CONSULTANTS AUGUST 2016 Adopted October
ARLINGTON COUNTY, VIRGINIA. County Board Agenda Item Meeting of September 24, 2016
 ARLINGTON COUNTY, VIRGINIA County Board Agenda Item Meeting of September 24, 2016 DATE: September 20, 2016 SUBJECT: Allocation of Fiscal Year 2017 Affordable Housing Investment Fund (AHIF) loan funds for
Chapter 12 Changes Since This is just a brief and cursory comparison. More analysis will be done at a later date.
 Chapter 12 Changes Since 1986 This approach to Fiscal Analysis was first done in 1986 for the City of Anoka. It was the first of its kind and was recognized by the National Science Foundation (NSF). Geographic
Town of Yucca Valley GENERAL PLAN 1
 Town of Yucca Valley GENERAL PLAN 1 This page intentionally left blank. 3 HOUSING ELEMENT The Housing Element is intended to guide residential development and preservation consistent with the overall values
A PRELIMINARY FINANCIAL AND ECONOMIC REDEVELOPMENT FEASIBILITY STUDY FOR THE CITY OF FERNLEY, NEVADA
 TECHNICAL REPORT UCED 2015/16-07 A PRELIMINARY FINANCIAL AND ECONOMIC REDEVELOPMENT FEASIBILITY STUDY FOR THE CITY OF FERNLEY, NEVADA UNIVERSITY OF NEVADA, RENO A PRELIMINARY FINANCIAL AND ECONOMIC REDEVELOPMENT
WASHTENAW COUNTY BROWNFIELD REDEVELOPMENT AUTHORITY ACT 381 WORK PLAN TO CONDUCT ELIGIBLE DEQ RESPONSE AND/OR MSF NON-ENVIRONMENTAL ACTIVITIES
 WASHTENAW COUNTY BROWNFIELD REDEVELOPMENT AUTHORITY ACT 381 WORK PLAN TO CONDUCT ELIGIBLE DEQ RESPONSE AND/OR MSF NON-ENVIRONMENTAL ACTIVITIES 400 NORTH RIVER STREET THE HISTORIC THOMPSON BLOCK REDEVELOPMENT
Analysis Prepared by David L. Sjoquist and Robert J. Eger III
 GEORGIA STATE UNIVERSITY ANDREW YOUNG SCHOOL OF POLICY STUDIES FISCAL RESEARCH CENTER DECEMBER 1, 2006 SUBJECT: Estimated Effects of Population Growth on Atlanta Public School s Revenue and Expenditures
Place Type Descriptions Vision 2037 Comprehensive Plan
 Place Type Descriptions Vision 2037 Comprehensive Plan The Vision 2037 Comprehensive Plan establishes a range of place types for Oxford, ranging from low intensity (limited development) Rural and Natural
Public Improvement District (PID) Policy
 Policy") Public Improvement District (PID) Policy OVERVIEW Public Improvement Districts ( PIDs ), per the Texas Local Government Code Chapter 372 ( the code or PID Act ), provide the City of Marble Falls ( the
Public Improvement District (PID) Policy OVERVIEW Public Improvement Districts ( PIDs ), per the Texas Local Government Code Chapter 372 ( the code or PID Act ), provide the City of Marble Falls ( the
Village of Port Jefferson Urban Renewal Plan
 Urban Renewal Plan Village of Port Jefferson Urban Renewal Plan Port Jefferson, New York PREPARED FOR Village of Port Jefferson Village Board 121 West Broadway Port Jefferson, NY 11777 631.473.4724 PREPARED
Housing. Imagine a Winnipeg...: Alternative Winnipeg Municipal Budget
 Housing Housing, and the need for affordable housing in cities and towns across Canada, has finally caught the attention of politicians. After a quarter century of urging from housing advocates, there
METRO JOINT DEVELOPMENT PROGRAM: POLICY Updated January 2017
 METRO JOINT DEVELOPMENT PROGRAM: POLICY TABLE OF CONTENTS I. INTRODUCTION / PURPOSE............................ 3 II. OBJECTIVES / GOALS.................................. 4 III. POLICIES............................................
Goals, Objectives and Policies
 Goals, Objectives and Policies 1. GOAL SUPPORT THE PROVISION OF DECENT, SAFE AND SOUND HOUSING IN A VARIETY OF TYPES, SIZES, LOCATIONS AND COSTS TO MEET THE NEEDS OF CURRENT AND FUTURE RESIDENTS OF UNINCORPORATED
Draft for Public Review. The Market and Octavia Neighborhood Plan
 Draft for Public Review The Market and Octavia Neighborhood Plan San Francisco Planning Department As Part of the Better Neighborhoods Program December 00 . Housing People OBJECTIVE.1 MIXED-USE RESIDENTIAL
7. IMPLEMENTATION STRATEGIES
 7. IMPLEMENTATION STRATEGIES A. GENERAL APPROACH FOR IMPLEMENTATION Implementing the plan will engage many players, including the Municipality of Anchorage (MOA), the Government Hill Community Council,
CITY OF HAMILTON. Community Services Housing & Homelessness Division
 CITY OF HAMILTON Community Services Housing & Homelessness Division TO: Chair and Members Emergency & Community Services Committee WARD(S) AFFECTED: CITY WIDE COMMITTEE DATE: April 20, 2011 SUBJECT/REPORT
Transit-Oriented Development Specialized Real Estate Services
 COLLIERS INTERNATIONAL Transit-Oriented Development Specialized Real Estate Services Accelerating success. Colliers International transit-oriented development GROUP P. 1 2 transit-oriented development
CITY OF CLAREMONT MASTER PLAN 2017 CHAPTER 6: HOUSING
 CITY OF CLAREMONT MASTER PLAN CHAPTER 6: HOUSING Prepared by the Claremont Planning Board and the Claremont Planning and Development Department Vision Claremont Master Plan Chapter 6: Housing Quality housing
CHAPTER V: IMPLEMENTING THE PLAN
 CHAPTER V: IMPLEMENTING THE PLAN A range of resources is available to fund the improvements included in the Action Plan. These resources include existing commitments of County funding, redevelopment-related
Cent ral Neighborhoods U rban Ren ewal Plan ( )
") Central Neighborhoods Urban Renewal Plan City of Golden, Colorado Cent ral Neighborhoods U rban Ren ewal Plan (4.18.20 1 3) 010252\0001\1819714.2 Central Neighborhoods Urban Renewal Plan City of Golden,
Central Neighborhoods Urban Renewal Plan City of Golden, Colorado Cent ral Neighborhoods U rban Ren ewal Plan (4.18.20 1 3) 010252\0001\1819714.2 Central Neighborhoods Urban Renewal Plan City of Golden,
1.0 INTRODUCTION PURPOSE OF THE CIP VISION LEGISLATIVE AUTHORITY Municipal Act Planning Act...
 April 2017 TABLE OF CONTENTS 1.0 INTRODUCTION... 1 2.0 PURPOSE OF THE CIP... 1 3.0 VISION... 1 4.0 COMMUNITY IMPROVEMENT PROJECT AREA..3 5.0 LEGISLATIVE AUTHORITY... 3 5.1 Municipal Act... 3 5.2 Planning
TO MEMBERS OF THE FINANCE AND CAPITAL STRATEGIES COMMITTEE: DISCUSSION ITEM
 F13 Office of the President TO MEMBERS OF THE FINANCE AND CAPITAL STRATEGIES : For Meeting of DISCUSSION ITEM ORCHARD PARK FAMILY HOUSING AND GRADUATE STUDENT HOUSING REDEVELOPMENT PROJECT AND WEST VILLAGE
City of St. Petersburg, Florida Consolidated Plan. Priority Needs
 City of St. Petersburg, Florida 2000-2005 Consolidated Plan Priority Needs Permanent supportive housing and services for homeless and special needs populations. The Pinellas County Continuum of Care 2000
Downtown Development Focus Area: I. Existing Conditions
 Downtown Development Focus Area: I. Existing Conditions The Downtown Development Focus Area is situated along Route 1, south of the train tracks, except for the existing Unilever property. It extends west
THAT Council receives for information the Report from the Planner II dated April 25, 2016 with respect to the annual Housing Report update.
 Report to Council Date: April 25, 2016 File: 1200-40 To: From: Subject: City Manager Laura Bentley, Planner II, Policy & Planning Annual Housing Report Update Recommendation: THAT Council receives for
Housing and Economic Development Strategic Plan for Takoma Park OCTOBER 18, 2017
 Housing and Economic Development Strategic Plan for Takoma Park OCTOBER 18, 2017 1 Three Part Process Housing and Economic Data Analysis SWOT Analysis: Strengths, Weaknesses, Opportunities and Threats
VILLAGE OF MT. HOREB, WISCONSIN TAX INCREMENTAL FINANCE DISTRICT #5 PROJECT PLAN. April 8, Prepared By: MSA Professional Services, Inc.
 VILLAGE OF MT. HOREB, WISCONSIN TAX INCREMENTAL FINANCE DISTRICT #5 PROJECT PLAN April 8, 2009 Prepared By: MSA Professional Services, Inc. TABLE OF CONTENTS Page I. INTRODUCTION AND PURPOSE 3 II. STATEMENT
4.13 Population and Housing
 Environmental Impact Analysis Population and Housing 4.13 Population and Housing 4.13.1 Setting This section evaluates the impacts to the regional housing supply and population growth associated with implementation
Residential Capacity Estimate
 Residential Capacity Estimate Montgomery County Department of Park & Planning Research & Technology Center January 2005 Current plans allow 75,000 more housing units. by Matthew Greene, Research Planner
LILLIAN WEBB PARK DEVELOPMENT PROPOSAL. City of Norcross, Georgia 2034 Comprehensive Plan
 LILLIAN WEBB PARK DEVELOPMENT PROPOSAL City of Norcross, Georgia 2034 Comprehensive Plan AGENDA Overview: Zoning/Process: Market Studies: Design: Benefits: Bucky Johnson, Mayor John Bemis, DDA Chair Matt
ECONOMIC EVALUATION OF PROPERTY TAX EXEMPTION PROGRAM FOR MULTIFAMILY DEVELOPMENT
 OF PROPERTY TAX EXEMPTION PROGRAM FOR MULTIFAMILY DEVELOPMENT CITY OF TACOMA PROPERTY COUNSELORS SEPTEMBER 2007 TABLE OF CONTENTS Page I. Introduction and Summary... 1 Introduction... 1 Summary... 2 Program
Town Centre Community Improvement Plan
 2012 Town Centre Community Improvement Plan City of Greater Sudbury Growth and Development Department 1.0 PLAN BACKGROUND 1.1 Introduction The following Community Improvement Plan (CIP) has been prepared
Proposed Development at Ajax Plaza Windcorp Grand Harwood Place Ltd.
 Proposed Development at Ajax Plaza Windcorp Grand Harwood Place Ltd. Presentation to Ajax Council July 4, 2013 Introduction 1. Background 2. Planning Policies and Regulations 3. Downtown Community Improvement
Young-Adult Housing Demand Continues to Slide, But Young Homeowners Experience Vastly Improved Affordability
 Young-Adult Housing Demand Continues to Slide, But Young Homeowners Experience Vastly Improved Affordability September 3, 14 The bad news is that household formation and homeownership among young adults
ECONOMIC ANALYSIS AND REDEVELOPMENT STRATEGY FOR THE NORTHWEST QUADRANT
 City of Roswell ECONOMIC ANALYSIS AND REDEVELOPMENT STRATEGY FOR THE NORTHWEST QUADRANT February 23, 2007 Prepared For: The City of Roswell Prepared By: TABLE OF CONTENTS 1.0 Introduction 3 2.0 Key Findings
Building Livable Communities with Transit. Introduction to Financing Livable Communities. Portland Lindbergh City Center Case Study
 Portland 2010 Introduction to Financing Livable Communities Lindbergh City Center Case Study A Livable Community Is A pedestrian oriented neighborhood with good sidewalks and street trees and outdoor furnishings
4.0 Implementation & Phasing Strategies
 VISION MANDATE: To ensure that the City Centre Area Plan (CCAP) develops in an orderly, sustainable and fi nancially sound manner: Build Community : Ensure that the necessary infrastructure and community
Town of Prescott Valley 2013 Land Use Assumptions
 Town of Prescott Valley 2013 Land Use Assumptions Raftelis Financial Consultants, Inc. November 22, 2013 Table of Contents Purpose of this Report... 1 The Town of Prescott Valley... 2 Summary of Land Use
City of Oakland Programs, Policies and New Initiatives for Housing
 City of Oakland Programs, Policies and New Initiatives for Housing Land Use Policies General Plan Update In the late 1990s, the City revised its general plan land use and transportation element. This included
H 7291 S T A T E O F R H O D E I S L A N D
 LC000 01 -- H 1 S T A T E O F R H O D E I S L A N D IN GENERAL ASSEMBLY JANUARY SESSION, A.D. 01 A N A C T RELATING TO TOWNS AND CITIES -- REDEVELOPMENT AGENCIES AND PROJECTS Introduced By: Representatives
Land Use Planning Analysis. Phase 2 Drayton Valley Annexation Proposal
 Land Use Planning Analysis Phase 2 Drayton Valley Annexation Proposal Prepared for Town of Drayton Valley Prepared by Mackenzie Associates Consulting Group Limited March, 2011 TABLE OF CONTENTS 1.0 INTRODUCTION...
Provide a diversity of housing types, responsive to household size, income and age needs.
 8 The City of San Mateo is a highly desirable place to live. Housing costs are comparably high. For these reasons, there is a strong and growing need for affordable housing. This chapter addresses the
City of Lonsdale Section Table of Contents
 City of Lonsdale City of Lonsdale Section Table of Contents Page Introduction Demographic Data Overview Population Estimates and Trends Population Projections Population by Age Household Estimates and
HOUSING ELEMENT Inventory Analysis
 HOUSING ELEMENT Inventory Analysis 2.100 INVENTORY Age of Housing Stock Table 2.25 shows when Plantation's housing stock was constructed. The latest available data with this kind of breakdown is 2010.
Chapter 5: Testing the Vision. Where is residential growth most likely to occur in the District? Chapter 5: Testing the Vision
 Chapter 5: Testing the Vision The East Anchorage Vision, and the subsequent strategies and actions set forth by the Plan are not merely conceptual. They are based on critical analyses that considered how
WEST BOARDMAN URBAN RENEWAL REPORT
 CITY OF BOARDMAN WEST BOARDMAN URBAN RENEWAL REPORT OCTOBER 2013 Prepared For: CITY OF BOARDMAN, OREGON By: JOHNSON REID, LLC CITY OF BOARDMAN, URBAN RENEWAL REPORT 1 TABLE OF CONTENTS I. Introduction...
Oakland Renaissance. Incentive District
 Oakland Renaissance Incentive District 1 An Historic Development Neighborhood Rejuvenation Opportunity Enhancing Cultural Assets Institution and Business Growth Update 12-12-2017 2 Urban Decline: Perceived
Rule 80. Preservation of Primary Agricultural Soils Revised and approved by the Land Use Panel during its public meeting on January 31, 2006.
 Rule 80. Preservation of Primary Agricultural Soils Revised and approved by the Land Use Panel during its public meeting on January 31, 2006. (A) Purpose. In accordance with 10 V.S.A. Sections 6025(b)
PLANNING COMMISSION STAFF REPORT
 PLANNING COMMISSION STAFF REPORT REZONING CASE: RZ-16-001 REPORT DATE: March 8, 2016 CASE NAME: Trailbreak Partners Rezoning PLANNING COMMISSION DATE: March 16, 2016 ADDRESSES OF REZONING PROPOSAL: 5501
DEKALB CENTRAL BUSINESS DISTRICT Redevelopment Project Area
 CITY OF DEKALB, IL DEKALB CENTRAL BUSINESS DISTRICT Redevelopment Project Area Tax Increment Financing District Eligibility Study, Redevelopment Plan and Project, and Housing Impact Study June 4, 2018
Comprehensive Plan /24/01
 IV The is a central component of the Comprehensive Plan. It is an extension of the general goals and policies of the community, as well as a reflection of previous development decisions and the physical
Financial Analysis of Urban Development Opportunities in the Fairfield and Gonzales Communities, Victoria BC
 Financial Analysis of Urban Development Opportunities in the Fairfield and Gonzales Communities, Victoria BC Draft 5 December 2016 Prepared for: City of Victoria By: Table of Contents Summary... i 1.0
Charlottesville Planning Commission, Neighborhood Associations & News Media
 CITY OF CHARLOTTESVILLE A World Class City Department of Neighborhood Development Services City Hall Post Office Box 911 Charlottesville, Virginia 22902 Telephone 434-970-3182 Fax 434-970-3359 www.charlottesville.org
The URD II Plan, for example, drafted in 1991 recognized both the need and opportunity for affordable housing development stating on page 49:
 PROPOSAL TO MISSOULA REDEVELOPMENT AGENCY FOR AFFORDABLE HOUSING PROGRAM The lack of inventory and inaccessibility to affordable housing in Missoula are longrecognized and well-documented problems. Too
CITY OF ALBUQUERQUE SIXTEENTH COUNCIL
 City of Albuquerque Albuquerque/Bernalillo County Government Center One Civic Plaza Albuquerque, NM 87102 Legislation Text File #: R-04-159, Version: 3 CITY OF ALBUQUERQUE SIXTEENTH COUNCIL COUNCIL BILL
2016 Census Bulletin Changing Composition of the Housing Stock
 Metro Vancouver s Role Every five years, the Census of Canada provides benchmark data that is instrumental in analyzing and evaluating local government planning policies and services. Representing member
Glendale Housing Development Project Plan
 Glendale Housing Development Project Plan Draft for Public Review May 29, 2015 Table of Contents I. Introduction... 1 II. Description of Project... 1 A. Boundary of Housing Development Project... 1 B.
OFFICE OF THE CITY ADMINISTRATIVE OFFICER
 REPORT FROM OFFICE OF THE CITY ADMINISTRATIVE OFFICER Date: To: From: Reference: October 28, 2014 The Honorable Members of the City Council Miguel A. Santana, City Administrative Officer Chair Municipal
METHODOLOGY GUIDE VALUING LANDS IN TRANSITION IN ONTARIO. Valuation Date: January 1, 2016
 METHODOLOGY GUIDE VALUING LANDS IN TRANSITION IN ONTARIO Valuation Date: January 1, 2016 August 2017 August 22, 2017 The Municipal Property Assessment Corporation (MPAC) is responsible for accurately assessing
Saskatchewan Municipal Financing Tools
 Saskatchewan Municipal Financing Tools The following is a list of financing tools currently available to Saskatchewan municipalities. Authority for a municipality to use any of these tools is provided
Mayport Village Community Redevelopment Area Community Workshop #1 Marine Science Education Center February 12, 2015
 Mayport Village Community Redevelopment Area Community Workshop #1 Marine Science Education Center February 12, 2015 Team Introductions Project Overview and Goals CRA and TIF 101 Role of CAC and TAC Mayport