Hunt County Appraisal District 2013 Mass Appraisal Report
|
|
|
- Lily Blake
- 6 years ago
- Views:
Transcription
1 INTRODUCTION Scope of Responsibility The Hunt County Appraisal District has prepared and published this report to provide our citizens and taxpayers with a better understanding of the district's responsibilities and activities. This report has several parts: a general introduction and then several sections describing the appraisal effort by the appraisal district. The Hunt County Appraisal District (CAD) is a political subdivision of the State of Texas created effective January 1, The provisions of the Texas Property Tax Code govern the legal, statutory, and administrative requirements of the appraisal district. An 8 member board of directors, appointed by the taxing units within the boundaries of Hunt County, constitutes the district s governing body. The chief appraiser, appointed by the board of directors, is the chief administrator and chief executive officer of the appraisal district. The appraisal district is responsible for local property tax appraisal and exemption administration for nearly 34 jurisdictions or taxing units in the county. Each taxing unit, such as the county, a city, school district, municipal utility district, etc., sets its own tax rate to generate revenue to pay for such things as police and fire protection, public schools, road and street maintenance, courts, water and sewer systems, and other public services. Appraisals established by the appraisal district allocate the year's tax burden on the basis of each taxable property's January 1 st market value. We also determine eligibility for various types of property tax exemptions such as those for homeowners, the elderly, disabled veterans, and charitable and religious organizations. Except as otherwise provided by the Property Tax Code, all taxable property is appraised at its market value as of January 1 st. Under the tax code, market value means the price at which a property would transfer for cash or its equivalent under prevailing market conditions if: exposed for sale in the open market with a reasonable time for the seller to find a purchaser; both the seller and the buyer know of all the uses and purposes to which the property is adapted and for which it is capable of being used and of the enforceable restrictions on its use, and; both the seller and buyer seek to maximize their gains and neither is in a position to take advantage of the exigencies of the other. The Property Tax Code defines special appraisal provisions for the valuation of residential homestead property (Sec ), productivity (Sec ), real property inventory (Sec ), 1
2 dealer inventory (Sec , , and ), nominal (Sec ) or restricted use properties (Sec ) and allocation of interstate property (Sec ). The owner of business personal property inventory may elect to have the inventory appraised at its market value as of September 1 st of the year preceding the tax year to which the appraisal applies by filing an application with the chief appraiser requesting that the inventory be appraised as of September 1 st. The Texas Property Tax Code, under Sec , requires each appraisal office to implement a plan to update appraised values for real property at least once every three years. The district s current policy is to conduct a general reappraisal of all property every year. Appraised values are reviewed annually and are subject to change for purposes of equalization. The appraised value of real estate is calculated using specific information about each property. Using computer-assisted mass appraisal programs, and recognized appraisal methods and techniques, we compare that information with the data for similar properties, and with recent market data. The district follows the standards of the International Association of Assessing Officers (IAAO) regarding its appraisal practices and procedures, and subscribes to the standards promulgated by the Appraisal Foundation known as the Uniform Standards of Professional Appraisal Practice (USPAP) to the extent they are applicable. In cases where the appraisal district contracts for professional valuation services, the contract that is entered into by each appraisal firm requires adherence to similar professional standards. Personnel Resources The Office of the Chief Appraiser is primarily responsible for overall planning, organizing, staffing, coordinating, and controlling of district operations. The Administration Department s function is to plan, organize, direct and control the business support functions related to human resources, budget, finance, records management, purchasing, fixed assets, facilities and postal services. The Appraisal Department is responsible for the valuation of all real and personal property accounts. The property types appraised include commercial, residential, business personal, and industrial. The district s appraisers are subject to the provisions of the Property Taxation Professional Certification Act and must be duly registered with The Texas Department of Licensing and Regulation. Support functions including records maintenance, information and assistance to property owners, and hearings support are coordinated by the Support Services Department. The appraisal district staff consists of 22 employees with the following classifications: _3_- Official/Administrator (Executive level administration) _1_ - Professional (Supervisory and Management) _11_ - Technicians (Appraisers, program appraisers and network support) _7_ - Administrative Support (professional, customer service, clerical and other) Data The district is responsible for establishing and maintaining approximately 69,000 real and personal property accounts covering 882 square miles within Hunt County. This data includes 2
3 property characteristic and ownership and exemption information. Property characteristic data on new construction is updated through an annual field effort; existing property data is maintained through a field review that is prioritized by last field inspection date. 3 Sales are routinely validated during a separate field effort; however, numerous sales are validated as part of the new construction and data review field activities. General trends in employment, interest rates, new construction trends, and cost and market data are acquired through various sources, including internally generated questionnaires to buyer and seller, university research centers, and market data centers and vendors. The district has a geographic information system (GIS) that maintains cadastral maps and various layers of data, including zip code, facet and aerial photography. The district s website makes a broad range of information available for public access, including detailed information on the appraisal process, property characteristics data, certified values, protests and appeal procedures, property maps, and a tax calendar. Downloadable files of related tax information and district forms, including exemption applications and business personal property renditions are also available. Information Systems The Information Systems Department maintains the district s data processing facility, software applications, Internet website, and geographical information system. The district operates under a hierarchical non-relational database. The mainframe hardware/system software is 3 Dell Servers/PACSSERVER-Win 2005 Server OS; which hosts our LAN, Internet, and document imaging; an ESRI Autocad Map & Autocad LT operates the geographic information system; and the user base is served by 23 Dell Optiplex Computers, 10 Fujitsu Stylistic Penpads, and one HP G60 Notebook Laptop which are on a combination of Windows XP OS, Win Vista OS and Window 7 OS. SHARED APPRAISAL DISTRICT BOUNDARIES The district established procedures whereby ownership and property data information are routinely exchanged. Appraisers from adjacent appraisal districts discuss data collection and valuation issues to minimize the possibility of differences in property characteristics, legal descriptions, and other administrative data. INDEPENDENT PERFORMANCE TEST According to Chapter 5 of the TPTC, At least once every two years, the Comptroller shall conduct a study in each appraisal district to determine the degree of uniformity of and the median level of appraisals by the appraisal district within each major category of property. The comptroller shall publish a report of the findings of the study, including in the report the median levels of appraisal for each major category of property, the coefficient of dispersion around the median level of appraisal for each major category of property and any other standard statistical measures that the comptroller considers appropriate. There are 17 independent school districts in Hunt CAD for which appraisal rolls are annually developed. The preliminary results of this study are released in January in the year following the year of appraisement. The final results of this study are certified to the Education Commissioner of the Texas Education Agency (TEA) in the following July of each year for the year of appraisement. This outside (third party) ratio
4 study provides additional assistance to the CAD in determining areas of market activity or changing market conditions. In addition to this there is an additional study performed at least every two years referred to as the MAPS review. Section refers to this review as At least once every two years, the comptroller shall review the governance of each appraisal district, taxpayer assistance provided, and the operating and appraisal standards, procedures, and methodology used by each appraisal district, to determine compliance with generally accepted standards, procedures, and methodology. 4
5 Appraisal Activities INTRODUCTION Appraisal Responsibilities The field appraisal staff is responsible for collecting and maintaining property characteristic data for classification, valuation, and other purposes. Accurate valuation of real and personal property by any method requires a physical description of personal property, and land and building characteristics. This appraisal activity is responsible for administering, planning and coordinating all activities involving data collection and maintenance of all commercial, residential and personal property types which are located within the boundaries of Hunt County. The data collection effort involves the field inspection of real and personal property accounts, as well as data entry of all data collected into the existing information system. The goal is to field inspect residential and personal properties in Hunt County every year, and commercial properties every year. Meeting this goal is dependent on budgetary constraints. Appraisal Resources Personnel - The appraisal activities consists of 12 appraisers and 7 technical personnel. Data - The data used by field appraisers includes the existing property characteristic information contained in a CAMA (Computer Mass Appraisal System) from the district s computer system. The data can be printed on a property record card (PRD), personal property data sheets or accessed on a penpad or other personal portable device. Other data used includes maps, sales data, fire and damage reports, building permits, photos and actual cost information. PRELIMINARY ANALYSIS Data Collection/Validation Data collection of real property involves maintaining data characteristics of the property on PACS (Property Appraisal and Collections System), which is a computer mass appraisal system. The information contained in PACS includes site characteristics, such as land size and topography, and improvement data, such as square foot of living area, year built, quality of construction, and condition. Field appraisers use listing manuals that establish uniform procedures for the correct listing of real property. All properties are coded according to these manuals and the approaches to value are structured and calibrated based on this coding system. The field appraisers use these manuals during their initial training and as a guide in the field inspection of properties. Data collection for personal property involves maintaining information on PACS (Property Appraisal and Collections System). The type of information contained in PACS includes personal property such as business inventory, furniture and fixtures, machinery and equipment, cost and location. The field appraisers conducting on-site 5
6 inspections use a personal property manual during their initial training and as a guide to correctly list all personal property that is taxable. The listing procedure manuals that are utilized by the field appraisers are available in the district offices. Manuals are also located in the customer service area for public inspection. If a property owner/agent wants a copy of the listing procedural manual, customer service will handle this request. Appraisers periodically update the listing procedural manuals with input from the valuation group. Sources of Data The sources of data collection are through the new construction field effort, data review/relist field effort, data mailers, hearings, sales validation field effort, commercial sales verification, newspapers and publications, and property owner correspondence via the Internet. A principal source of data comes from building permits received from taxing jurisdictions that require property owners to take out a building permit. Where available, permits are received electronically and loaded to our Building Permit System (BPS). Otherwise, paper permits are received and matched manually with the property s tax account number for data entry. Data review of entire neighborhoods is generally a good source for data collection. Appraisers drive entire neighborhoods to review the accuracy of our data and identify properties that have to be relisted. The sales validation effort in real property pertains to the collection of data of properties that have sold. In residential, the sales validation effort involves on-site inspection by field appraisers, letters from buyers and sellers, and other third party sources to verify the accuracy of the property characteristics data and confirmation of the sales price. In commercial, the commercial appraisers are responsible for contacting both grantee, grantor and other third party sources to confirm sales prices and to verify pertinent data. Property owners are one of the best sources for identifying incorrect data that generates a field check. Frequently, the property owner provides sufficient enough data to allow correction of records without having to send an appraiser on-site. As the district has increased the amount of information available on the Internet, property owner s requests to correct data inconsistencies have also increased. For the property owner without access to the Internet, letters are often submitted notifying the district of inaccurate data. Properties identified in this manner are added to a work file and inspected at our earliest opportunity. Data Collection Procedures Field data collection requires organization, planning and supervision of the field effort. Data collection procedures have been established for residential, commercial, and personal property. The appraisers are assigned throughout Hunt County to conduct field inspections. Appraisers conduct field inspections and record information either on a property record card (PRD), a personal property data sheet or into a portable electronic device, such as a penpad, that will be downloaded into PACS. The quality of the data used is extremely important in establishing accurate values of taxable property. While production standards are established and upheld for the various field activities, quality of data is emphasized as the goal and responsibility of each appraiser. New appraisers 6
7 are trained in the specifics of data collection set forth in the listing manual as rules to follow. Experienced appraisers are routinely re-trained in listing procedures prior to major field projects such as new construction, sales validation or data review. A quality assurance process exists through supervisory review of the work being performed by the field appraisers. Quality assurance supervision is charged with the responsibility of ensuring that appraisers follow listing procedures, identify training issues and provide uniform training throughout the field appraisal staff. Data Maintenance The field appraiser is responsible for the data entry of his/her fieldwork directly into the computer file. This responsibility includes not only data entry directly entered by the appraiser, but also quality assurance for that entered by the clerical staff. INDIVIDUAL VALUE REVIEW PROCEDURES Field Review The date of last inspection, extent of that inspection, and the CAD appraiser responsible are listed on the CAMA record. If a property owner or jurisdiction dispute the district s records concerning this data during a hearing, via a telephone call or correspondence received, CAMA may be altered based on the evidence provided. Typically, a field inspection is requested to verify this evidence for the current year s valuation or for the next year s valuation. Every year a field review of certain areas or neighborhoods in the jurisdiction is done during the data review/re-list field effort. PERFORMANCE TEST The valuation appraisers are responsible for conducting ratio studies and comparative analysis. (Refer to the individual valuation process summary reports). Field appraisers, in many cases may conduct field inspections to insure the ratios produced are accurate and the appraised values utilized are based on accurate property data characteristics. 7
8 Residential Valuation Process INTRODUCTION Scope of Responsibility The Residential Valuation appraisers are responsible for developing equal uniform market values for residential improved and vacant property. There are approximately 32,598 residential improved parcels and 13,392 vacant residential properties in Hunt County. Appraisal Resources Personnel - The Residential Valuation appraisal staff consists of 8 appraisers. The following appraisers are responsible for determining residential values: James Chapman Grady Ewing Mike Gomez Shirley Grant Billy Jones Jamie Martinez Don Spencer Chris Williams Data - A common set of data characteristics for each residential dwelling in Hunt County is collected in the field and data entered to the computer. The property characteristic data drives the computer-assisted mass appraisal (CAMA) approach to valuation. VALUATION APPROACH (Model Specification) Area Analysis Data on regional economic forces such as demographic patterns, regional locational factors, employment and income patterns, general trends in real property prices and rents, interest rate trends, availability of vacant land, and construction trends and costs are collected from private vendors and public sources and provide the field appraiser a current economic outlook on the real estate market. Information is gleaned from real estate publications and sources such as continuing education in the form of IAAO and other TDLR approved classes. Neighborhood and Market Analysis Neighborhood analysis involves the examination of how physical, economic, governmental and social forces and other influences affect property values. The effects of these forces are also used to identify, classify, and stratify comparable properties into smaller, manageable subsets of the universe of properties known as neighborhoods. Residential valuation and neighborhood analysis is conducted on each of the political entities known as Independent School Districts (ISD). The first step in neighborhood analysis is the identification of a group of properties that share certain common traits. A "neighborhood" for analysis purposes is defined as the largest 8
9 geographic or demographic grouping of properties where the property s physical, economic, governmental and social forces are generally similar and uniform. Geographic stratification accommodates the local supply and demand factors that vary across a jurisdiction. Once a neighborhood has been identified, the next step is to define its boundaries. This process is known as "delineation". Some factors used in neighborhood delineation include location, sales price range, lot size, age of dwelling, quality of construction and condition of dwellings, square footage of living area, and story height. Delineation can involve the physical drawing of neighborhood boundary lines on a map, but it can also involve statistical separation or stratification based on attribute analysis. Part of neighborhood analysis is the consideration of discernible patterns of growth that influence a neighborhood s individual market. Few neighborhoods are fixed in character. Each neighborhood may be characterized as being in a stage of growth, stability or decline. The growth period is a time of development and construction. As new neighborhoods in a community are developed, they compete with existing neighborhoods. An added supply of new homes tends to induce population shift from older homes to newer homes. In the period of stability, or equilibrium, the forces of supply and demand are about equal. Generally, in the stage of equilibrium, older neighborhoods can be more desirable due to their stability of residential character and proximity to the workplace and other community facilities. The period of decline reflects diminishing demand or desirability. During decline, general property use may change from residential to a mix of residential and commercial uses. Declining neighborhoods may also experience renewal, reorganization, rebuilding, or restoration, which promotes increased demand and economic desirability. Neighborhood identification and delineation is the cornerstone of the residential valuation system at the district. All the residential analysis work done in association with the residential valuation process is neighborhood specific. Neighborhoods are field inspected and delineated based on observable aspects of homogeneity. Neighborhood delineation is periodically reviewed to determine if further neighborhood delineation is warranted. Whereas neighborhoods involve similar properties in the same location, a neighborhood group is simply defined as similar neighborhoods in similar locations. Each residential neighborhood is assigned to a neighborhood group based on observable aspects of homogeneity between neighborhoods. Neighborhood grouping is highly beneficial in cost-derived areas of limited or no sales, or use in direct sales comparison analysis. Neighborhood groups, or clustered neighborhoods, increase the available market data by linking comparable properties outside a given neighborhood. Sales ratio analysis, discussed below, is performed on a neighborhood basis, and in soft sale areas on a neighborhood group basis. Highest and Best Use Analysis The highest and best use of property is the reasonable and probable use that supports the highest present value as of the date of the appraisal. The highest and best use must be physically possible, legal, financially feasible, and productive to its maximum. The highest and best use of residential property is normally its current use. This is due in part to the fact that residential development, in many areas, through use of deed restrictions and zoning, precludes other land uses. Residential valuation undertakes reassessment of highest and best use in transition areas and areas of mixed residential and commercial use. In transition areas with 9
10 ongoing gentrification, the appraiser reviews the existing residential property use and makes a determination regarding highest and best use. Once the conclusion is made that the highest and best use remains residential, further highest and best use analysis is done to decide the type of residential use on a neighborhood basis. As an example, it may be determined in a transition area that older, non-remodeled homes are economic misimprovements, and the highest and best use of such property is the construction of new dwellings. In areas of mixed residential and commercial use, the appraiser reviews properties in these areas on a periodic basis to determine if changes in the real estate market require reassessment of the highest and best use of a select population of properties. VALUATION AND STATISTICAL ANALYSIS (Model Calibration) Cost Schedules All residential parcels in the district are valued from identical cost schedules using a comparative unit method. The district s residential cost schedules, originally adopted from a National Costing Service, have been customized to fit Hunt County s local residential building and labor market. The cost schedules are reviewed regularly as a result of recent state legislation requiring that the appraisal district clearly state the reason for any variation between generally accepted cost data and locally produced cost data if the data vary by more than 10%; and make available to the property owner on request all applicable market data that demonstrate the difference between the replacement cost of the improvements to the property and the depreciated value of the improvements. Sales analysis indicated that local market modifiers lowering the schedules greater than 10% of the Marshall Swift indicated values for residential property were appropriate to adjust the schedules to the present market. Copies of these resulting ratio reports are available if requested by a taxpayer. Sales Information A sales file for the storage of snapshot sales data at the time of sale is maintained. Residential vacant land sales, along with commercial improved and vacant land sales are maintained in a separate sales information system. Residential improved and vacant sales are collected from a variety of sources, including: district questionnaires sent to buyer and seller, field discovery, protest hearings, Board of Realtor s MLS, various sale vendors, builders, and realtors. A system of type, source, validity and verification codes was established to define salient facts related to a property s purchase or transfer. School district or neighborhood sales reports are generated as an analysis tool for the appraiser in the development of value estimates. Land Analysis Residential land analysis is conducted by the land appraiser. The appraiser develops a base lot, primary rate, and assigns each unique neighborhood to a certain set of land tables. The per unit land table is designed to systematically value the primary and residual land based on a specified percentage of the primary rate. A computerized land table file stores the land information required to consistently value individual parcels within neighborhoods. Specific land influences are used, where necessary, to adjust parcels outside the neighborhood norm for such factors as view, shape, size, and topography, among others. 10 The appraiser uses
11 abstraction and allocation methods to insure that the land values created best reflect the contributory market value of the land to the overall property value. Statistical Analysis The residential valuation appraisers perform statistical analysis annually to evaluate whether values are equitable and consistent with the market. Ratio studies are conducted on each of the approximately 22 residential classes in the district and then broken down into stratification of neighborhoods to judge the two primary aspects of mass appraisal accuracy--level and uniformity of value. Appraisal statistics of central tendency and dispersion generated from sales ratios are available for each class and appropriate neighborhoods. These may be further stratified by year built, size of living area and other indicators of the market. These summary statistics including, but not limited to, the weighted mean, median, standard deviation, coefficient of variation, and coefficient of dispersion provide the appraisers a tool by which to determine both the level and uniformity of appraised value on a stratified neighborhood basis. The level of appraised values is determined by the weighted mean for individual properties within a neighborhood, and a comparison of neighborhood weighted means reflect the general level of appraised value between comparable neighborhoods. Review of the standard deviation, coefficient of variation, and coefficient of dispersion discerns appraisal uniformity within and between stratified neighborhoods. Every neighborhood is reviewed annually by the appraiser through the sales ratio analysis process. The first phase involves neighborhood ratio studies that compare the recent sales prices of neighborhood properties to the appraised values of these sold properties. This set of ratio studies affords the appraiser an excellent means of judging the present level of appraised value and uniformity of the sales. The appraiser, based on the sales ratio statistics and designated parameters for valuation update, makes a preliminary decision as to whether the value level in a neighborhood needs to be updated in an upcoming reappraisal, or whether the level of market value in a neighborhood is at an acceptable level. Market Adjustment or Trending Factors Neighborhood, or market adjustment, factors are developed from appraisal statistics provided from ratio studies and are used to ensure that estimated values are consistent with the market. The district s primary approach to the valuation of residential properties uses a hybrid cost-sales comparison approach. This type of approach accounts for neighborhood market influences not specified in the cost model. The following equation denotes the hybrid model used: MV = [LMA (LV)] +[IMA (RCN D)] whereas, the market value equals the land market adjustment factor times the land value plus the improvement market adjustment factor times replacement cost new less depreciation. As the cost approach separately estimates both land and building values and uses depreciated replacement costs, which reflect only the supply side of the market, it is expected that adjustments to the cost values are needed to bring the level of appraisal to an acceptable standard. Market, or location adjustments are applied uniformly within neighborhoods to 11
12 account for locational variances between market areas or across a jurisdiction. While efforts are made to gather rental information, due to the predominance of owner occupied residential property, little weight is applied to the Income Approach. The hybrid model used combines both the Cost and Market approaches in a manner that will best indicate the market value of single family residences. If a neighborhood is to be updated, the appraiser uses a cost ratio study that compares recent sales prices of properties appropriately adjusted for the effects of time within a delineated neighborhood with the properties actual cost value. The calculated ratio derived from the sum of the sold properties cost value divided by the sum of the sales prices indicates the neighborhood level of value based on the unadjusted cost value for the sold properties. This cost-to-sale ratio is compared to the appraisal-to-sale ratio to determine the market adjustment factor for each neighborhood. This market adjustment factor is needed to trend the values obtained through the cost approach closer to the actual market evidenced by recent sales prices within a given neighborhood. The sales used to determine the market adjustment factor will reflect the market influences and conditions only for the specified neighborhood, thus producing more representative and supportable values. The market adjustment factor calculated for each update neighborhood is applied uniformly to all properties within a neighborhood. Once the market-trend factors are applied, a second set of ratio studies is generated that compares recent sale prices with the proposed appraised values for these sold properties. From this set of ratio studies, the appraiser judges the appraisal level and uniformity in both update and nonupdate neighborhoods, and finally, for the school district as a whole. TREATMENT OF RESIDENCE HOMESTEADS Beginning in 1998, the State of Texas implemented a constitutional classification scheme concerning the appraisal of residential property that receives a residence homestead exemption. Under the new law, beginning in the second year a property receives a homestead exemption, increases in the value of that property are "capped." The value for tax purposes (appraised value) of a qualified residence homestead will be the LESSER of: the market value of the appraised value of the property for the most recent tax year that the market value was determined by the appraisal office: or the sum of: (A) 10 percent of the appraised value of the property for the preceding tax year; (B) The appraised value of the property for the preceding tax year; and (C) The market value of all new improvements to the property. Values of capped properties must be recomputed annually. If a capped property sells, the cap automatically expires as of January 1 st of the following year. In that following year, that home is reappraised at its market value to bring its appraisal into uniformity with other properties. An analogous provision applies to new homes. While a developer owns them, unoccupied residences are appraised as part of an inventory using the district s land value and the 12
13 developer s construction costs as of the valuation date. However, in the year following sale, they are reappraised at market value. INDIVIDUAL VALUE REVIEW PROCEDURES Field Review The appraiser identifies individual properties in critical need of field review through sales ratio analysis, information gained through the equalization process, and from information from owners of specific properties as well as other taxpayers concerns. These properties are coded for recheck for the following year with a code 01/01/(next appraisal year). During the year when time permits, properties are coded 01/02/current year for additional rechecks. Properties picked up during the year in early stages of construction are also coded for inspection at the end of the year to determine the percentage complete for the January 1 valuation date as prescribed by the Property Tax Code. During these rechecks, the appraiser frequently field reviews subjective data items such as quality of construction, condition, and physical, functional and economic obsolescence, factors contributing significantly to the market value of the property. After preliminary estimates of value have been determined in targeted areas, the appraiser takes valuation documents to the field to test the computer-assisted values against his own appraisal judgment. PERFORMANCE TESTS Sales Ratio Studies The district s ratio studies were designed and prepared, to the maximum extent possible, under the guidelines set forth in the International Association of Assessing Officers current Standard on Ratio Studies. The ratio studies are calculated in order to evaluate the relationship between the appraisals and the sales prices as of the assessment date of January 1 and used to estimate the general level of appraisal and the uniformity of appraisal. Ratio studies were conducted by each residential construction class and the entire county for the period of January 1, 2012 thru March 4, This period was used to gather sufficient sales in the market to determine the level and uniformity of appraisal in our system. All sales were used and screened to ensure, to the extent possible, that only valid indicators of market value were included. Examples of sales that were excluded included sales involving atypical financing, sales between relatives or corporate affiliates, estate sales, or sales under duress. Foreclosures are reviewed as to determine the condition of the improvements. Further information from the taxpayer may indicate that the foreclosure sales price is indicative of the market for a similar property in the same condition. If there is an area which has a significant number of foreclosures and it appears to set the tone for the market for that neighborhood, these prices are considered in the final market values for that neighborhood. This would be the case where foreclosures represent 50 percent or more of the sales and there are a significant number of sales for that neighborhood. Since Texas does not have mandatory sales disclosure, Hunt County Appraisal District does not have access to all property transactions, which limits 13
14 the sales used to those acquired through a commercial vendor or submitted voluntarily by the property owners. The median ratio for each residential class along with the ratio for the total residential sales file is an indicator of the level of appraisal for the population of single family residences. The median is the preferred measure of central tendency because it gives equal weight to each ratio and is less affected by extreme ratios. The Coefficient of Dispersion (COD) is a measure of variability and generally the smaller the measure of variability, the better the uniformity. Trimming the sales for outliers is performed in a manner consistent with the appendix of the Standard on Ratio Studies. Management Review Process Once the proposed value estimates are finalized, the appraiser reviewed the sales ratios by neighborhood and presents pertinent valuation data, such as, history of hearing protest, sale-toparcel ratio, and level of appraisal to the Chief Appraiser for final review and approval. This review includes comparison of level of value between related neighborhoods within and across jurisdiction lines. The primary objective of this review is to ensure that the proposed values have met preset appraisal guidelines appropriate for the tax year in question. 14
15 Commercial Valuation Process INTRODUCTION Appraisal Responsibility This mass appraisal assignment includes all of the commercially classed real property which falls within the responsibility of the commercial valuation appraisers of the Hunt County Appraisal District and located within the boundaries of this taxing jurisdiction. The attached appraisal roll displays and identifies each parcel of real property individually. Commercial appraisers appraise the fee simple interest of properties according to statute. However, the affect of easements, restrictions, encumbrances, leases, contracts or special assessments are considered on an individual basis, as is the appraisement of any non exempt taxable fractional interests in real property (i.e. certain multi-family housing projects). Fractional interests or partial holdings of real property are appraised in fee simple for the whole property and divided programmatically based on their prorated interests. Appraisal Resources The improved real property appraisal responsibilities are categorized according to major property types of multi-family or apartment, office, retail, warehouse and special use (i.e. hotels, hospitals and, nursing homes). 2 appraisers are assigned to improved commercial property types. They each appraise both the land and improvements of the properties they are responsible for. Data - The data used by the commercial appraiser includes verified sales of vacant land and improved properties and the pertinent data obtained from each (sales price levels, capitalization rates, income multipliers, equity dividend rates, marketing period, etc.). Other data used by the appraiser includes actual income and expense data (typically obtained through the hearings process), actual contract rental data, leasing information (commissions, tenant finish, length of terms, etc.), and actual construction cost data. In addition to the actual data obtained from specific properties, market data publications are also reviewed to provide additional support for market trends. PRELIMINARY ANALYSIS Pilot Study Pilot studies are utilized to test new or existing procedures or valuation modifications in a limited area (a sample of properties) of the district and are also considered whenever substantial changes are made. These studies, which are inclusive of ratio studies, reveal whether a new system is producing accurate and reliable values or whether procedural modifications are required. The appraiser implements this methodology when developing both the cost approach and income approach models. 15
16 Survey of Similar Jurisdictions: Hunt CAD coordinates its discovery and valuation activities with adjoining Appraisal Districts. Numerous field trips, interviews and data exchanges with adjacent appraisal districts have been conducted to ensure compliance with state statues. In addition, Hunt CAD administration and personnel interact with other assessment officials through professional trade organizations including the International Association of Assessing Officers, Texas Association of Appraisal Districts and its subchapter Texas Metropolitan Association of Appraisal Districts and the Texas Association of Assessing Officers. VALUATION APPROACH (Model Specification) Area Analysis Data on regional economic forces such as demographic patterns, regional locational factors, employment and income patterns, general trends in real property prices and rents, interest rate trends, availability of vacant land, and construction trends and costs are collected from private vendors and public sources. Continuing education in the form of IAAO, Texas Association of Assessing Officers (TAAO), Texas Association of Appraisal Districts (TAAD) and Texas Department of Licensing and Regulation (TDLR) approved courses. Neighborhood Analysis The neighborhood is comprised of the land area and commercially classed properties located within the boundaries of this taxing jurisdiction. This area consists of a wide variety of property types including residential, commercial and industrial. Neighborhood analysis involves the examination of how physical, economic, governmental and social forces and other influences affect property values. The effects of these forces are also used to identify, classify, and organize comparable properties into smaller, manageable subsets of the universe of properties known as neighborhoods. In the mass appraisal of commercial properties these subsets of a universe of properties are generally referred to as market areas or economic areas. Economic areas are defined by each of the improved property use types (apartment, office, retail, warehouse and special use) based upon an analysis of similar economic or market forces. These include but are not limited similarities of rental rates, classification of projects (known as building class by area commercial market experts), date of construction, overall market activity or other pertinent influences. Economic area identification and delineation by each major property use type is the benchmark of the commercial valuation system. All income model valuation (income approach to value estimates) is economic area specific. Economic areas are periodically reviewed to determine if redelineation is required. The geographic boundaries as well as, income, occupancy and expense levels and capitalization rates by age within each economic area for all commercial use types and its corresponding income model may be found in the Commercial Valuation Manual. Highest and Best Use Analysis The highest and best use is the most reasonable and probable use that generates the highest present value of the real estate as of the date of valuation. The highest and best use of any given property must be physically possible, legally permissible, financially feasible, and maximally productive. For improved properties, highest and best use is evaluated as improved 16
17 and as if the site were still vacant. This assists in determining if the existing improvements have a transitional use, interim use, nonconforming use, multiple uses, speculative use, excess land, or a different optimum use if the site were vacant. For vacant tracts of land within this jurisdiction, the highest and best use is considered speculative based on the surrounding land uses. Improved properties reflect a wide variety of highest and best uses which include, but are not limited to: office, retail, apartment, warehouse, light industrial, special purpose, or interim uses. In many instances, the property's current use is the same as its highest and best use. This analysis insures that an accurate estimate of market value (sometimes referred to as value in exchange) is derived. On the other hand, value in use represents the value of a property to a specific user for a specific purpose. This is significantly different than market value, which approximates market price under the following assumptions: (i) no coercion of undue influence over the buyer or seller in an attempt to force the purchase or sale, (ii) well-informed buyers and sellers acting in their own best interests, (iii) a reasonable time for the transaction to take place, and (iv) payment in cash or its equivalent. Market Analysis A market analysis relates directly to market forces affecting supply and demand. This study involves the relationships between social, economic, environmental, governmental, and site conditions. Current market activity including sales of commercial properties, new construction, new leases, lease rates, absorption rates, vacancies, allowable expenses (inclusive of replacement reserves), expense ratio trends, capitalization rate studies are analyzed. DATA COLLECTION / VALIDATION Data Collection Manuals The primary manual pertinent to data collection and documentation is the Commercial/Industrial Appraisal Manual. This manual is continually updated, providing a uniform system of itemizing the multitude of components comprising improved properties. All properties located in Hunt CAD s inventory are coded according to this manual and the approaches to value are structured and calibrated based on this coding system. The most recent revision of the Commercial/Industrial manual was Sources of Data In terms of commercial sales data, Hunt CAD receives a copy of the deeds recorded in Hunt County that convey commercially classed properties. The deeds involving a change in commercial ownership are entered into the sales information system and researched in an attempt to obtain the pertinent sale information. Other sources of sale data include the hearings process and local, regional and national real estate and financial publications. For those properties involved in a transfer of commercial ownership, a sale file is produced which begins the research and verification process. The initial step in sales verification involves a computer-generated questionnaire, which is mailed to both parties in the transaction (Grantor and Grantee). If a questionnaire is not returned within thirty days a second questionnaire is mailed. If a questionnaire is answered and returned, the documented responses are recorded 17
18 into the computerized sales database system. If no information is provided, verification is then attempted via phone calls to both parties. If the sales information is still not obtained, other sources are contacted such as the brokers involved in the sale, property managers or commercial vendors. In other instances sales verification is obtained from local appraisers or others that may have the desired information. Finally, closing statements are often provided during the hearings process. The actual closing statement is the most reliable and preferred method of sales verification. VALUATION ANALYSIS (Model Calibration) Model calibration involves the process of periodically adjusting the mass appraisal formulas, tables and schedules to reflect current local market conditions. Once the models have undergone the specification process, adjustments can be made to reflect new construction procedures, materials and/or costs, which can vary from year to year. The basic structure of a mass appraisal model can be valid over an extended period of time, with trending factors utilized for updating the data to the current market conditions. However, at some point, if the adjustment process becomes too involved, the model calibration technique can mandate new model specifications or a revised model structure. Cost Schedules The cost approach to value is applied to all improved real property utilizing the comparative unit method. This methodology involves the utilization of national cost data reporting services as well as actual cost information on comparable properties whenever possible. Cost models are typically developed based on the Marshall Swift Valuation Service. Cost models include the derivation of replacement cost new (RCN) of all improvements. These include comparative base rates, per unit adjustments and lump sum adjustments. This approach also employs the sales comparison approach in the valuation of the underlying land value. Time and location modifiers are necessary to adjust cost data to reflect conditions in a specific market and changes in costs over a period of time. Because a national cost service is used as a basis for the cost models, locational modifiers are necessary to adjust these base costs specifically for Hunt County. These modifiers are provided by the national cost services. Depreciation schedules are developed based on what is typical for each property type at that specific age. Depreciation schedules have been implemented for what is typical of each major class of commercial property by economic life categories. Schedules have been developed for improvements with 15, 20, 30, 40, 50 and 60 year expected life. These schedules are then tested to ensure they are reflective of current market conditions. The actual and effective ages of improvements are noted in CAMA. Effective age estimates are based on the utility of the improvements relative to where the improvement lies on the scale of its total economic life and its competitive position in the marketplace. Effective age estimates are based on 3 levels of renovation and are described in the Commercial / Industrial Appraisal Manual. Market adjustment factors such as external and/or functional obsolescence can be applied if warranted. A depreciation calculation override can be used if the condition or effective age of a property varies from the norm by appropriately noting the physical condition and functional utility ratings on the property data characteristics. These adjustments are typically applied to a 18
19 specific property type or location and can be developed via ratio studies or other market analyses. Accuracy in the development of the cost schedules, condition ratings and depreciation schedules will usually minimize the necessity of this type of an adjustment factor. Income Models The income approach to value is applied to those real properties which are typically viewed by market participants as income producing, and for which the income methodology is considered a leading value indicator. The first step in the income approach pertains to the estimation of market rent on a per unit basis. This is derived primarily from actual rent data furnished by property owners and from local market study publications. This per unit rental rate multiplied by the number of units results in the estimate of potential gross rent. A vacancy and collection loss allowance is the next item to consider in the income approach. The projected vacancy and collection loss allowance is established from actual data furnished by property owners and on local market publications. This allowance accounts for periodic fluctuations in occupancy, both above and below an estimated stabilized level. The market derived stabilized vacancy and collection loss allowance is subtracted from the potential gross rent estimate to yield an effective gross rent. Next a secondary income or service income is calculated as a percentage of stabilized effective gross rent. Secondary income represents parking income, escalations, reimbursements, and other miscellaneous income generated by the operations of real property. 19 The secondary income estimate is derived from actual data collected and available market information. The secondary income estimate is then added to effective gross rent to arrive at an effective gross income. Allowable expenses and expense ratio estimates are based on a study of the local market, with the assumption of prudent management. An allowance for non-recoverable expenses such as leasing costs and tenant improvements are included in the expenses. A non-recoverable expense represents costs that the owner pays to lease rental space. Different expense ratios are developed for different types of commercial property based on use. For instance, retail properties are most frequently leased on a triple-net basis, whereby the tenant is responsible for his pro-rata share of taxes, insurance and common area maintenance. In comparison, a general office building is most often leased on a base year expense stop. This lease type stipulates that the owner is responsible for all expenses incurred during the first year of the lease. However, any amount in excess of the total per unit expenditure in the first year is the responsibility of the tenant. Under this scenario, if the total operating expense in year one (1) equates to $8.00 per square foot, any increase in expense over $8.00 per square foot throughout the remainder of the lease term would be the responsibility of the tenant. As a result, expense ratios are implemented based on the type of commercial property. Another form of allowable expense is the replacement of short-lived items (such as roof or floor coverings, air conditioning or major mechanical equipment or appliances) requiring expenditures of large lump sums. When these capital expenditures are analyzed for consistency and adjusted, they may be applied on an annualized basis as stabilized expenses. When performed according to local market practices by commercial property type, these expenses when
20 annualized are known as replacement reserves. Subtracting the allowable expenses (inclusive of non-recoverable expenses and replacement reserves) from the effective gross income yields an estimate of net operating income. Rates and multipliers are used to convert income into an estimate of market value. These include income multipliers, overall capitalization rates, and discount rates. Each of these is used in specific applications. Rates and multipliers also vary between property types, as well as by location, quality, condition, design, age, and other factors. Therefore, application of the various rates and multipliers must be based on a thorough analysis of the market. These procedures are documented in the Commercial Appraisal Manual. The last time this manual was updated was in Capitalization analysis is used in the income approach models. This methodology involves the capitalization of net operating income as an indication of market value for a specific property. Capitalization rates, both overall (going-in) cap rates for the direct capitalization method and terminal cap rates for discounted cash flow analyses, can be derived from the market. Sales of improved properties from which actual income and expense data are obtained provide a very good indication of what a specific market participant is requiring from an investment at a specific point in time. In addition, overall capitalization rates can be derived from the built-up method (band-of-investment). This method relates to satisfying the market return requirements of both the debt and equity positions of a real estate investment. This information is obtained from real estate and financial publications. Rent loss concessions are made on specific properties with vacancy problems. A rent loss concession accounts for the impact of lost rental income while the building is moving toward stabilized occupancy. The rent loss is calculated by multiplying the rental rate by the percent difference of the property s stabilized occupancy and its actual occupancy. Build out allowances (for first generation space or retrofit/second generation space as appropriate) and leasing expenses are added to the rent loss estimate. The total adjusted loss from these real property operations is discounted using an acceptable risk rate. The discounted value (inclusive of rent loss due to extraordinary vacancy, build out allowances and leasing commissions) becomes the rent loss concession and is deducted from the value indication of the property at stabilized occupancy. A variation of this technique allows that for every year that the property s actual occupancy is less than stabilized occupancy a rent loss deduction may be estimated. Hotels The Hunt County hotels were evaluated this year on a new model. The hotels were ranked according to quality and then divided into corridors of Influence for uniformity. There were three ranks used in the model. Rank 3 were comprised of the newer larger motels with a typical rate range of $70 to $100. Allowable expenses were 66% of their Room Revenue, along with a 4% Reserve for Replacements. A 10.5% Capitalization Rate was used on these properties. 20
21 Rank 2 were comprised of the older hotels with a typical rate range of Under $70 and approximately greater than 30 rooms. Allowable expenses were 70% of their Room Revenue, along with a 4% Reserve for Replacements. A 10% Capitalization Rate was used on these properties. Rank 1 were comprised of the smaller properties, many of which have tenants that stay for periods of over 30 days. Allowable expenses were 70% of their Room Revenue, along with a 4% Reserve for Replacements. A 9.5% Capitalization Rate was used on these properties. The following Corridors of Influence were used: Greenville I-30 and US 69 Corridor Greenville I-30 and Wesley Corridor Greenville I-30 away from the Main Intersections Commerce West Tawakoni By breaking the hotels down by corridors of influence and ranks, Gross Room Revenue Multipliers were developed for uniformity. Actual Room Revenues reported to the Comptroller s Office for the Hotel Occupancy Tax was used in the model. There were a few exceptions to the model used in the valuation. One was an older hotel which sold and was undergoing extensive remodeling towards the last quarter of the year. Its revenue was annualized from the first three quarters. The second was a new hotel and the revenues did not appear to be indicative of a full year of normal occupancy. For this hotel the valuation was based on the Average per room valuation of two very similar hotels in the same corridor of influence. Where no revenue was reported or operations has ceased during the year, other facts and considerations were used to value the properties. Expense Allowances were developed using PKF Hospitality Research Motel Trends for the 2011 Actual numbers and then comparing them to the 2012 Numbers when available. This is a nationally reputable source and used percentages of actual Revenue reported which takes the uncertainty of vacancy out of the equation. Capitalization Rates were developed using Realty Rates, Investor Survey, information and other sources. Information was requested from the owners of the local properties during the equalization phase of the appraisal process. The information received was reviewed for accuracy and consistency. This information will be used in subsequent models. Sales Comparison (Market) Approach Although all three of the approaches to value are based on market data, the Sales Comparison Approach is most frequently referred to as the Market Approach. This approach is utilized not only for estimating land value but also in comparing sales of similarly improved properties to each parcel on the appraisal roll. As previously discussed in the Data Collection / Validation section of this report, pertinent data from actual sales of properties, both vacant and improved, is pursued throughout the year in order to obtain relevant information which can be used in all aspects of valuation. Sales of similarly improved properties can provide a basis for the depreciation schedules in the Cost Approach, rates and multipliers used in the Income Approach, and as a direct comparison in the Sales Comparison Approach. Improved sales are 21
22 also used in ratio studies, which afford the appraiser an excellent means of judging the present level and uniformity of the appraised values. Final Valuation Schedules Based on the market data analysis and review discussed previously in the cost, income and sales approaches, the cost and income models are calibrated and finalized. The calibration results are keyed to the schedules and models on the mainframe CAMA system for utilization on all commercial properties in the district. The schedules and models are summarized in the Commercial Manual. This manual is provided to appraisers and is made available to the public in an easy to understand format. Statistical and Capitalization Analysis Statistical analysis of final values is an essential component of quality control. This methodology represents a comparison of the final value against the standard and provides a concise measurement of the appraisal performance. Statistical comparisons of many different standards are used including sales of similar properties, the previous year s appraised value, audit trails, value change analysis and sales ratio analysis. Appraisal statistics of central tendency and dispersion generated from sales ratios are available for each property type. These summary statistics including, but not limited to, the weighted mean, standard deviation and coefficient of variation, provide the appraisers an analytical tool by which to determine both the level and uniformity of appraised value of a particular property type. The level of appraised values can be determined by the weighted mean for individual properties within a specific type, and a comparison of weighted means can reflect the general level of appraised value. Review of the standard deviation and the coefficient of variation can discern appraisal uniformity within a specific property type. The appraisers review every commercial property type annually through the sales ratio analysis process. The first phase involves ratio studies that compare the recent sales prices of properties to the appraised values of the sold properties. This set of ratio studies affords the appraiser an excellent means of judging the present level of appraised value and uniformity of the appraised values. The appraiser, based on the sales ratio statistics and designated parameters for valuation update, makes a preliminary decision as to whether the value level of a particular property type needs to be updated in an upcoming reappraisal, or whether the level of market value is at an acceptable level. Potential gross rent estimates, occupancy levels, secondary income, allowable expenses (inclusive of non-recoverables and replacement reserves), net operating income and capitalization rate and multipliers are continuously reviewed utilizing frequency distribution methods or other statistical procedures or measures. Income model conclusions are compared to actual information obtained on individual commercial properties during the hearings process as well as information from published sources and area vendors. INDIVIDUAL VALUE REVIEW PROCEDURES Field Review The date of last inspection, extent of that inspection, and the Hunt CAD appraiser responsible 22
23 are listed in the CAMA system. If a property owner disputes the District's records concerning this data in a protest hearing, CAMA may be altered based on the credibility of the evidence provided. Typically, a new field check is then requested to verify this evidence for the current year's valuation or for the next year's valuation. In addition, if a building permit is filed for a particular property indicating a change in characteristics, that property is added to a work file. Finally, even though every property cannot be inspected each year, each appraiser typically designates certain segments of their area of responsibility to conduct field checks. Commercial appraisers are somewhat limited in the time available to field review all commercial properties of a specific use type. However, a major effort is made by appraisers to field review as many properties as possible or economic areas experiencing large numbers of remodels, renovations, or retrofits, changes in occupancy levels or rental rates, new leasing activity, new construction, or wide variations in sale prices. Additionally, the appraisers frequently field review subjective data items such as building class, quality of construction (known as cost modifiers), condition, and physical, functional and economic obsolescence factors contributing significantly to the market value of the property. In some cases field reviews are warranted when sharp changes in occupancy or rental rate levels occur between building classes or between economic areas. With preliminary estimates of value in these targeted areas, the appraisers test computer assisted values against their own appraisal judgment. While in the field, the appraisers physically inspect sold and unsold properties for comparability and consistency of values. Office Review Office reviews are completed on properties not subject to field inspections and are performed in compliance with the guidelines contained in the Commercial Manual. The Commercial Review Manual outlines the application of the three approaches to value (including Discounted Cash Flow - DCF). This manual is rigorously maintained and updated frequently. The last update of the Commercial Manual was in Office reviews are typically limited by the data presented in final value reports. These reports summarize the pertinent data of each property as well as comparing the previous values (two year value history) to the proposed value conclusions of the various approaches to value. These reports show proposed percentage value changes, income model attributes or overrides, economic factor (cost overrides) and special factors affecting the property valuation such as new construction status, prior year litigation and a three years sales history (USPAP property history requirement for non-residential property). The appraiser may review methodology for appropriateness to ascertain that it was completed in accordance with USPAP or more stringent statutory and district policies. This review is performed after preliminary ratio statistics have been applied. If the ratio statistics are generally acceptable overall the review process is focused primarily on locating skewed results on an individual basis. Previous values resulting from protest hearings are individually reviewed to determine if the value remains appropriate for the current year based on market conditions. Each appraiser's review is limited to properties in their area of responsibility by property type (improved) or geographic area (commercial vacant land). 23
24 Once the appraiser is satisfied with the level and uniformity of value for each commercial property within their area of responsibility, the estimates of value go to noticing. Each parcel is subjected to the value parameters appropriate for its use type. If one of the parcel s component values, land value, improvement value or total value exceeds the permissible change in value range it "fails the value edits". In this case, the parcel does not shift to noticing, but it is placed on a rework list. Therefore, although the value estimates are determined in a computerized mass appraisal environment, value edits and rework lists enable an individual parcel review of value anomalies before the estimate of value is released for noticing. PERFORMANCE TESTS The primary tool used to measure mass appraisal performance is the ratio study. A ratio study compares appraised values to market values. 24 In a ratio study, market values (value in exchange) are typically represented by sales prices (i.e. a sales ratio study). Independent, expert appraisals may also be used to represent market values in a ratio study (i.e. appraisal ratio study). If there are not enough sales to provide necessary representativeness, independent appraisals can be used as indicators for market value. This can be particularly useful for commercial, warehouse or industrial real property for which sales are limited. In addition, appraisal ratio studies can be used for properties statutorily not appraised at market value, but reflect the use-value requirement. an An example of this are multi-family housing projects subject to subsidized rent provisions or other governmental guarantees as provided by legislative statutes (affordable housing) or agricultural lands to be appraised on the basis of productivity or use value. Hunt CAD has adopted the policies of the IAAO STANDARD ON RATIO STUDIES, circa 2010 regarding its ratio study standards and practices. Ratio studies generally have six basic steps: (1) determination of the purpose and objectives, (2) data collection and preparation, (3) comparing appraisal and market data, (4) stratification, (5) statistical analysis, and (6) evaluation and application of the results. Sales Ratio Studies Sales ratio studies are an integral part of establishing equitable and accurate market value estimates, and ultimately assessments for this taxing jurisdiction. The primary uses of sale ratio studies include the determination of a need for general reappraisal; prioritizing selected groups of properties types for reappraisal; identification of potential problems with appraisal procedures; assist in market analyses; and, to calibrate models used to derive appraised values during valuation or reappraisal cycles. However, these studies cannot be used to judge the accuracy of an individual property appraised value. The Hunt County Appraisal Review Board may make individual value adjustments based on unequal appraisal (ratio) protest evidence submitted on a case-by-case basis during the hearing process. Overall sales ratios are generated by use type semi-annually (or more often in specific areas) to allow appraisers to review general market trends in their area of responsibility. The appraisers utilize desktop applications such as MS EXCEL programs to evaluate subsets of data by economic area or a specific and unique data item. On the desktop, this may be customized and performed by building class and age basis. In many cases, field checks may be conducted to
25 insure the ratios produced are accurate and the appraised values utilized are based on accurate property data characteristics. These ratio studies aid the appraisers by providing an indication of market activity by economic area or changing market conditions (appreciation or depreciation). A copy of the district s latest ratio study is attached. Comparative Appraisal Analysis The commercial appraiser performs an average unit value comparison in addition to a traditional ratio study. These studies are performed on commercially classed properties by property use type (such as apartment, office, retail and warehouse usage or special use). The objective to this evaluation is to determine appraisal performance of sold and unsold properties. Appraisers average unit prices of sales and average unit appraised values of the same parcels and the comparison of average value changes of sold and unsold properties. These studies are conducted on substrata such as building class and on properties located within various economic areas. In this way, overall appraisal performance is evaluated geographically, by specific property type to discern whether sold parcels have been selectively appraised. When sold parcels and unsold parcels are appraised equally, the average unit values are similar. These horizontal equity studies are performed prior to annual noticing. 25
26 Industrial Valuation Process INTRODUCTION Appraisal Responsibility The Industrial Appraisers and/or Contract Appraisers of the Hunt County Appraisal District are responsible for developing fair, uniform market values for improved industrial real properties and industrial vacant land as well as the valuation of all tangible general industrial personal property and utilities in Hunt County. There are approximately 64 parcels of industrial real property in Hunt County, of which 63 are improved parcels and 0 are vacant properties. The industrial appraisers appraise approximately 643 parcels of tangible personal property. Appraisal Resources Personnel - The industrial section consists of 1 appraiser. In addition, Hunt CAD contracts with Capitol Appraisal Group, LLC to value utilities for which the district does not have the available personnel or resources. They appraise approximately 579 utility accounts for Hunt CAD. Data - The industrial appraisers and contract appraisal staff inspect their assigned properties to obtain information about buildings, site improvements, process and shop equipment, and various items of personal property. In addition, appraisal personnel use information provided by property owners concerning the cost to purchase, install, and construct items of real and personal property. The individual characteristics of the property being appraised are the primary factors that drive the appraised value. VALUATION APPROACH (MODEL SPECIFICATION) Area Analysis The scope of market forces affecting industrial products and the capital goods used in the production process tends to extend beyond regional considerations. The effects of information and transportation technology are such that most industrial market forces are measured globally. One exception to this general concept is the market for industrial land. The pricing of land tends to be closely tied to possible alternative uses in the area. For this reason, appraisers assigned to land valuation analyze market forces for specific areas and adjust land value schedules appropriately. Neighborhood Analysis Neighborhood analysis of the type of properties valued by the industrial appraiser is not meaningful. Industrial properties do not have the type of generic sameness that is appropriate for neighborhood models. 26
27 Highest and Best Use Analysis The highest and best use of real or personal property is the most reasonable and probable use of the property on the date of appraisal that is physically and financially feasible, legal, and that derives maximum production from the property. Usually, the current use of the property is the highest and best use of that property. Industrial facilities are most commonly located in areas that support industrial use. In areas where mixed use does occur, the highest and best use of the property is examined by the appraiser to estimate the effect of this factor. Market Analysis Market analysis is the basis for finalizing value estimates on properties for which the industrial appraiser has responsibility. Even though many industrial properties are unique in nature, the market for this type property is analyzed to see how the values of similar or similar as possible properties are affected by market forces. Industrial properties, such as machine shops, have many similar facilities that can be compared to the subject property in terms of type and size of equipment, type of property fabricated or serviced at the subject facility, and other factors. Those similarities help the appraiser estimate the value of the subject property. However, some facilities, such as specialty chemical plants, are so unique in nature that the appraiser must use the closest available plant in terms of output quantity, type of product manufactured, and other factors to estimate the value of the subject property. Many industrial properties use the same type of building and, depending on the type of business, may use the same type of manufacturing or service equipment. However, the manner in which the entire business operation is put together makes that particular facility unique. The district uses information from similar businesses to examine the real and personal property values at a particular business, but the individual characteristics of the business being reviewed determine the value estimation. Many of the buildings encountered at industrial facilities are generic in construction, such as pre-engineered metal buildings. The cost per square foot to construct these type structures can be used to estimate values at facilities that have similarly constructed buildings. However, the building as constructed will have differences that must be taken into account when estimating the final value of the property being reviewed. A similar analysis is used for personal property. Many items of personal property, such as furniture and fixtures, computers, and even machinery and equipment are generic in construction, but individual characteristics that affect value, such as usage, environment where used, and level of care will have an effect on the final value estimation. When cost data for this type property is available and considered reliable, it is used for value estimation purposes at other plant facilities. However, on-site inspection and information provided by the property owner will affect the final value. Due to the fact that most of the industrial properties being highly specialized and owner occupied, the Income Approach is considered inappropriate in most cases and receives little weight in the valuation. DATA COLLECTION/VALIDATION Data Collection Manuals 27
28 An extended range of variations may exist within the same class of industrial property, and there are a multitude of property types within the industrial category. For this reason, effective data collection procedures would be very difficult to organize in a single comprehensive manual. The district has adopted the Marshall & Swift Commercial Estimator Cost guide and its occupancy codes to standardize data and its collection for buildings assigned to the industrial appraisal staff. Industrial personal property also consists of many different classes of assets with a wide range of variation within each class. The district has adopted the convention of listing assets and estimating effective age of assets in the field. The field listing is then compared with information furnished by property owners during the final valuation review. Sources of Data The original real and personal property data used by Hunt CAD was supplied by the Hunt County Tax Assessor. Since that time, the district and contract appraisal personnel have updated that information based on field review. As new facilities are built, the appraisal personnel collect all the real and personal property data necessary to value the property initially and thereafter update the information when the property is again visited. The district receives building permit information from the cities and from the county when a facility is being built outside an incorporated city. Other sources of data include publications such as the Texas Register regarding waste control permits, various refining and chemical industry magazine articles, and Texas Industrial Expansion articles on new construction. Data Collection Procedures The district appraisal personnel annually or periodically visit assigned plants. The frequency of the visit is determined by the nature of the business conducted at each facility. For example, refineries and chemical plants are continually changing or adding to processes to extract greater efficiencies or make new products, but machine shops may not add or remove equipment over a period two or more years. The appraisers take with them the historical data on the buildings and site improvements and the previous listing of personal property at the facility being visited. Changes to the existing structures and personal property are noted and that information is used for value estimation purposes. If cost information for the real or personal property is supplied later, the field data can be compared to that information to judge the accuracy of the information. New district appraisers are trained by accompanying appraisers who have performed field visit and appraisal functions for a number of years. Each district appraiser is responsible for the completeness and correctness of their valuation work, but a new appraiser is encouraged to seek the advice of and review by experienced appraisal staff if that person is not sure of their value estimation results. 28
29 VALUATION ANALYSIS (MODEL CALIBRATION) Final Valuation Schedules The schedules used by the district are those integrated into Marshall & Swift Commercial Estimator Valuation System for real property improvements. The real property valuation schedules are updated annually through the use of update disks supplied by Marshall & Swift. The valuation schedule incorporated into the district s records are updated annually using a calculated index factor compiled from data in Chemical Engineering Magazine. Hunt CAD develops schedules based on indexed Marshall & Swift depreciation factors for use in the valuation of all business and industrial personal property. These schedules are updated annually by the Hunt CAD appraisal staff. The contract appraisal firms use similar schedules and methodology based on their experience in valuing real and personal property. INDIVIDUAL VALUE REVIEW PROCEDURES Field Review The district s personnel periodically review their assigned real and personal property accounts annually. The results of prior year hearings and indication of building permits being issued are another source of required field visits. Many times during hearings, issues are presented that cause a value adjustment. Those issues must be field checked to see if these influences will be on going and warrant permanent value adjustment or are transitory and a permanent adjustment is not warranted. This information needs to be recorded so the appraiser will be better able to estimate the property value. Building permits must be field checked to see what effect these have on existing structures. Any new construction is noted and the information necessary to value the structure is recorded. Additionally, any structure demolition is noted so the improvement value can be adjusted accordingly. Part of the field review includes noting any land characteristics that would affect the land value. The district values all land for the properties over which it has responsibility, including those properties assigned to contract appraisal firms. The contract appraisal firms must advise the district of any characteristics that would affect the value of the land associated with that assigned facility. PERFORMANCE TESTS Sales Ratio Studies Ratio studies are an important tool to examine how close appraised values are to market values. appraisals. The ratio study may use available sales data or may use independent, expert Typically, there are not enough sales of industrial properties to show representativeness of that class of property in a ratio study. Ratio studies of industrial properties usually have to rely on independent appraisals as an indicator of market values. Comparative Appraisal Analysis This type of analysis is usually not done on industrial properties due to the unique nature of the property and also because of time and budget constraints regarding available appraisal staff. 29
30 Only in an instance where a jurisdiction would file a jurisdiction challenge with the Appraisal Review Board would the district perform such an analysis. If a jurisdiction challenge is received by Hunt CAD on an industrial category of properties, the appraisers assigned to those accounts will research the appraisal roll to see what other similar properties exist. The real property values can be compared on an average value per square foot of structure basis, but the differences from one facility to another must be carefully compared because it is unlikely that two different facilities are going to build like improvements and use them in similar ways. In like manner, the personal property values can be compared per category, such as furniture and fixtures, machinery and equipment, etc., but the same comparison of the type of and use of the property must be examined to ensure property comparison. 30
31 Business Personal Property Valuation Process INTRODUCTION Appraisal Responsibility There are four different personal property types appraised by the district s personal property section: Business Personal Property accounts; Leased Assets; Vehicles; and Multi-Location Assets. There are approximately 2198 business personal property accounts in Hunt County. Appraisal Resources Personnel - The personal property staff consists of 1 appraisers and 1 support staff. Data - A common set of data characteristics for each personal property account in Hunt County is collected in the field and data entered to the district s computer. The property characteristic data drives the computer-assisted personal property appraisal (CAPPA) system. The field data is collected by the personal property appraiser. VALUATION APPROACH (Model Specification) SIC Code Analysis Four digit numeric codes, called Standard Industrial Classification (SIC) codes that were developed by the federal government. These classifications are used by Hunt CAD as a way to classify personal property by business type. Hunt CAD has further stratified these accounts by using an additional Business Personal Property Class Code of four digits that is the first four digits of the Geo ID to group business types that have similar personal property characteristics. SIC code and Class Code identification and delineation is the cornerstone of the personal property valuation system at the district. All of the personal property analysis work done in association with the personal property valuation process is SIC code and Class code specific. SIC codes are delineated based on observable aspects of homogeneity. SIC code and Class Code delineation is periodically reviewed to determine if additional delineation is warranted. Highest and Best Use Analysis The highest and best use of property is the reasonable and probable use that supports the highest present value as of the date of the appraisal. The highest and best use must be physically possible, legally permissible, financially feasible, and maximally productive. The highest and best use of personal property is normally its current use. DATA COLLECTION/VALIDATION Data Collection Procedures Personal property data collection procedures are published and distributed to all appraisers involved in the appraisal and valuation of personal property. The appraisal procedures are reviewed and revised to meet the changing requirements of field data collection. The most recent revision of the personal property data collection procedures was in Sources of Data 31
32 Business Personal Property The district s property characteristic data was originally received from Hunt County, and various school district records in 1980, and where absent, collected through a massive field data collection effort coordinated by the district over a period of time. When revaluation activities permit, district appraisers collect new data via an annual field drive-out. This project results in the discovery of new businesses not revealed through other sources. Various discovery publications such as state sales tax listings and local occupancy permits are also used to discover personal property. Tax assessors, city and local newspapers, and the public often provide the district information regarding new personal property and other useful facts related to property valuation. Vehicles An outside vendor, Just Texas, provides Hunt CAD with a listing of commercially registered vehicles within Hunt County. The vendor develops this listing from the Texas Department of Transportation (DOT) Title and Registration Division records. They use NADA values as a guide along with other resourced values. Other sources of data include property owner renditions and field inspections. Leased and Multi-Location Assets The primary source of leased and multi-location assets is property owner renditions of property. Other sources of data include field inspections. Special Inventory Special Inventory (which includes motor vehicles, boats, manufactured houses and heavy equipment at the retail level of trade) is discovered and valued in conjunction with monthly tax statements and annual declaration forms filed by the owner. Copies of the monthly statements and annual declarations are maintained by Hunt CAD. Alternative discovery methods may sometimes be used as with standard BPP accounts described earlier in this report. The discovery and valuation of certain utility and pipeline accounts is contracted out to third party appraisal firms. Uniform Standards of Professional Appraisal Practices or USPAP certification and reappraisal plan information on these properties are maintained at the contractors individual offices. A list of our third party vendors is available upon request. VALUATION AND STATISTICAL ANALYSIS (model calibration) Cost Schedules Cost schedules are developed by SIC code by district personal property valuation appraisers. The cost schedules are developed by analyzing cost data from property owner renditions, hearings, state schedules, and published cost guides. The cost schedules are reviewed as necessary to conform to changing market conditions. The schedules are typically in a price per square foot format, but some exception SIC s are in an alternate price per unit format, such as per room for hotels. Statistical Analysis 32
33 Summary statistics including, but not limited to, the median, weighted mean, and standard deviation provide the appraisers a analytical tool by which to determine both the level and uniformity of appraised value by SIC code. Review of the standard deviation can discern appraisal uniformity within SIC codes. Depreciation Schedule and Trending Factors: Business Personal Property Hunt CAD s primary approach to the valuation of business personal property is the cost approach. Because we are not valuating the Going Business Concern the Income Approach is not considered relevant. Due to the lack of sales of a business continuing its operations from owner to owner and the difficulty in separating the sales price of the going concern, real property and personal property parts of the sale, the Sales Market Approach receives little weight. The replacement cost new (RCN) is either developed from property owner reported historical cost or from Hunt CAD developed valuation models. The trending factors used by Hunt CAD to develop RCN are based on published valuation guides. The percent good depreciation factors used by Hunt CAD are also based on published valuation guides. The Business Personal Property Model is : MARKET VALUE ESTIMATE = HISTORICAL COST X PERCENT GOOD FACTOR This mass appraisal depreciation schedule is used to ensure that estimated values are uniform and consistent within the market. Computer Assisted Personal Property Appraisal (CAPPA) The CAPPA valuation process has two main objectives: 1) Analyze and adjust existing SIC models. 2) Develop new models for business classifications not previously integrated into CAPPA. The delineated sample is reviewed for accuracy of SIC code, square footage, field data, and original cost information. Models are created and refined using actual original cost data to derive a typical replacement cost new (RCN) per square foot for a specific category of assets. The RCN per square foot is depreciated by the estimated age using the depreciation table adopted for the tax year. The data sampling process is conducted in the following order: 1) Prioritizing Standard Industrial Classification (SIC) codes for model analysis. 2) Compiling the data and developing the reports. 3) Field checking the selected samples. The models are built and adjusted using internally developed software. The models are then tested against the previous year's data. The typical RCN per square foot (or applicable unit) is determined by a statistical analysis of the available data. CAPPA model values are used in the general business personal property valuation program to estimate the value of new accounts for which no property owner's rendition is filed. Model values are also used to establish tolerance parameters for testing the valuation of property for which prior data years' data exist or for which current year rendered information is available. The calculated current year value or the prior year's value is compared to the indicated model value by the valuation program. If the value being tested is within an established acceptable percentage tolerance range of the model value, the account passes that range check and 33
34 moves to the next valuation step. If the account fails the tolerance range check, it is flagged for individual review. Allowable tolerance ranges may be adjusted from year to year depending on the analysis of the results of the prior year. Vehicles Value estimates for vehicles are provided by an outside vendor and are based on NADA published book values as well as other sources. Vehicles that are not valued by the vendor are valued by an appraiser using PVF schedules or published guides. Leased and Multi-Location Assets Leased and multi-location assets are valued using the valuation model mentioned above. If the asset to be valued in this category is a vehicle, then NADA published book values are used. Assets that are not valued by the vendor are valued by an appraiser using PVF schedules or published guides. INDIVIDUAL VALUE REVIEW PROCEDURES Office Review Business Personal Property A district valuation computer program exists in a mainframe environment that identifies accounts in need of review based on a variety of conditions. Property owner renditions, accounts with field or other data changes, accounts with prior hearings, new accounts, and SIC cost table changes are all considered. The accounts are processed by the valuation program and pass or fail preset tolerance parameters by comparing appraised values to prior year and model values. Accounts that fail the tolerance parameters are reviewed by the appraisers. Vehicles A vehicle master file is received on tape from an outside vendor and vehicles in the district s system from the prior year are programmatically matched to current DOT records. The vehicles remaining after the matching process are sorted by owner name and the owners are then prioritized by the number of vehicles owned. These vehicles are then matched to existing accounts and new accounts are created as needed. Vehicles that are not valued by the vendor are valued by an appraiser using depreciation schedules or published guides. Leased and Multi-Location Assets Leasing and multi-location accounts that have a high volume of vehicles or other assets are loaded programmatically if reported by the property owner electronically. Electronic renditions, usually on diskette, often require reformatting before they can be loaded to the account. Accounts that render by hard copy are either data entered by CAD or sent to an outside data entry vendor. After matching and data entry, reports are generated and reviewed by an appraiser. Once proofed, the report is then mailed to the property owner for review. Corrections are made and the account is noticed after supervisor approval. 34
35 The commercial and business aircraft accounts are simultaneously valued/reviewed with rendered data and third party market value data. Hunt CAD s perpetual account tracking system ensures special inventory dealers without a current declaration on file are contacted to advise them of their legal filing requirements and to provide Hunt CAD with the most current valuation/review data available. PERFORMANCE TESTS Ratio Studies Each year the Property Tax Division of the state comptroller s office conducts a property value study (PVS). The PVS is a ratio study used to gauge appraisal district performance. Results from the PVS play a part in school funding. Rather than a sales ratio study, the personal property PVS is a ratio study using state cost and depreciation schedules to develop comparative personal property values. These values are then compared to Hunt CAD s personal property values and ratios are formed. Internal Testing Hunt CAD can test new or revised cost and depreciation schedules by running the valuation program in a test mode prior to the valuation cycle. This can give appraisers a chance to make additional refinements to the schedules if necessary. 35
36 LIMITING CONDITIONS The appraised value estimates provided by the district are subject to the following conditions: 1. The appraisals were prepared exclusively for ad valorem tax purposes. 2. The property characteristic data upon which the appraisals are based is assumed to be correct. Exterior inspections of the property appraised were performed as staff resources and time allowed. 3. Validation of sales transactions was attempted through questionnaires to buyer and seller, telephone survey and field review. In the absence of such confirmation, residential sales data obtained from vendors was considered reliable. 4. I have attached a list of staff providing significant mass appraisal assistance to the person signing this certification. 5. Attached is the district s latest ratio study results. 36
37 Certification Statement: "I, Brent South, Chief Appraiser for the Hunt County Appraisal District, certify that, to the best of my knowledge and belief: The statements of fact contained in this report are true and correct. The reported analyses, opinion, and conclusions are limited only by the reported assumptions and limiting conditions, and are my personal, impartial, and unbiased professional analyses, opinions and conclusions. I have no (unless previously disclosed to Hunt CAD) present or prospective interest in the property that is the subject of this report, and I have no (unless previously disclosed to Hunt CAD) personal interest with respect to the parties involved. I have performed no (unless previously disclosed to Hunt CAD) services, as an appraiser or in any other capacity, regarding the property that is the subject of this report within the three-year period immediately preceding acceptance of this assignment. I have no bias with respect to any property that is the subject of this report or to the parties involved with this assignment. My engagement in this assignment was not contingent upon developing or reporting predetermined results. My compensation for completing this assignment is not contingent upon the reporting of a predetermined value or direction in value that favors the cause of the client, the amount of the value opinion, the attainment of a stipulated result, or the occurrence of a subsequent event directly related to the intended use of this appraisal. My analyses, opinions and conclusions were developed, and this report has been prepared, in conformity with the Uniform Standards of Professional Appraisal Practice. I have made a personal inspection of a portion of the properties that are the subject of this report. The attached list contains the Hunt County Appraisal District Appraisers and Contract Appraisers who provided significant mass appraisal assistance in appraising the property that is the subject of this report. Brent South Chief Appraiser 37
38 STAFF PROVIDING SIGNIFICANT MASS APPRAISAL ASSISTANCE NAME TITLE TDLR NUMBER TYPE OF ASSISTANCE Tamra Burton Deputy Chief Appraiser Commercial Real Property Appraisals(Inspects Property) Don Spencer Residential Appraisal Supervisor/Commercial Appraiser Supervises Residential Appraisers, Commercial Real Property Appraisal (Inspects Property) James Chapman Appraiser Residential Appraiser (Inspects Property) Grady Ewing Appraiser Residential Appraiser (Inspects Property) Mike Gomez Appraiser Residential Appraiser (Inspects Property) Shirley Grant Appraiser Residential Appraiser (Inspects Property) Billy Jones Appraiser Residential Appraiser (Inspects Property) Sheila Krodle Appraiser Land Appraiser (Inspects Property) Jamie Martinez Appraiser Residential Appraiser (Inspects Property) Tiffany Tadlock Appraiser Personal Property Appraiser (Inspects Property) Chris Williams Appraiser/Analyst Residential Appraiser/Updated Residential Valuation Models(Inspects Property) Capitol Appraisal Group, LLC Utilities(Inspects Property) 38
39 2013 Frame Final Number Calculations After Cost Multipler and Local Multipliers and Market Factor QUALITY LOW Fair AVERAGE GOOD VERY GOOD EXCELLENT Depreciation 45 Yr. Life 50YR F RES 55YR F RES 55YR F RES 60YR F RES 60YR F RES MAX SQ FT 1F 2F 2+F 3F 3+F 4F 4+F 5F 5+F 6F 6+F
40 2013 Masonry Final Number Calculations After Cost Multiplier and Local Multiplier and Market Factor QUALITY LOW Fair AVERAGE GOOD VERY GOOD EXCELLENT Depreciation 50YR 55YR 60YR 60YR 60YR 65YR MAX SQ FT 1M 2M 2+M 3M 3+M 4M 4+M 5M 5+M 6M 6+M
41
42
43
44
45
46
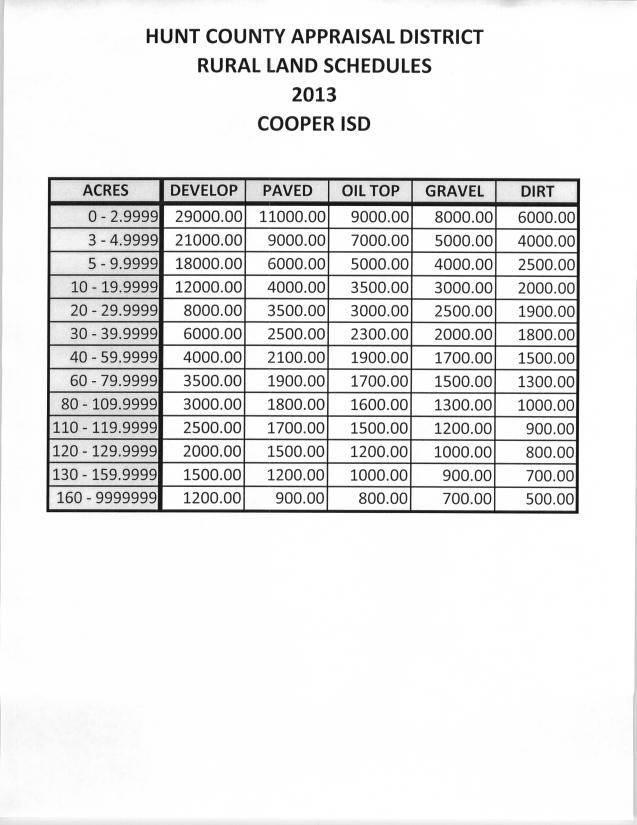
47
Hunt County Appraisal District 2015 Mass Appraisal Report
 Hunt County Appraisal District 2015 Mass Appraisal Report INTRODUCTION Scope of Responsibility The Hunt County Appraisal District has prepared and published this report to provide our citizens and taxpayers
ATASCOSA COUNTY APPRAISAL DISTRICT 2014 MASS APPRAISAL REPORT
 ATASCOSA COUNTY APPRAISAL DISTRICT 2014 MASS APPRAISAL REPORT INTRODUCTION Scope of Responsibility The Atascosa County Appraisal District (CAD) has prepared and published this report to provide our citizens
Caldwell County Appraisal District
 Caldwell County Appraisal District Reappraisal Plan for Tax Years 2019 and 2020 INTRODUCTION Scope of Responsibility The Caldwell County Appraisal District has prepared and published this reappraisal plan
Lee Central Appraisal District
 Lee Central Appraisal District 2015 Mass Appraisal Report 1 INTRODUCTION Scope of Responsibility The Lee Central Appraisal District has prepared and published this report to provide citizens and taxpayers
Cooke County Appraisal District Reappraisal Plan
 Cooke County Appraisal District 2015 2016 Reappraisal Plan INTRODUCTION Scope of Responsibility The Cooke County Appraisal District has prepared and published this report to provide our citizens and taxpayers
Henderson County Appraisal District Mass Appraisal Report
 Henderson County Appraisal District 2016 Mass Appraisal Report 1 Purpose The purpose of this report is to better inform the property owners within the boundaries of the Henderson County Appraisal District
Reappraisal Plan. and. Mass Appraisal Report
 Reappraisal Plan and Mass Appraisal Report ADOPTED September 13, 2012 REVISED May 23, 2013 Bastrop CAD Board of Directors Reappraisal Plan and Mass Appraisal Report FORWARD Outlook for 2013 2014 The Reappraisal
DALLAS CENTRAL APPRAISAL DISTRICT. 2007/2008 Reappraisal Plan
 DALLAS CENTRAL APPRAISAL DISTRICT 2007/2008 Reappraisal Plan DALLAS CENTRAL APPRAISAL DISTRICT 2007-2008 REAPPRAISAL PLAN INTRODUCTION General Overview of Tax Code Requirement Passage of Senate Bill 1652
NUECES COUNTY APPRAISAL DISTRICT
 NUECES COUNTY APPRAISAL DISTRICT REAPPRAISAL PLAN FOR TAX YEARS 2013 & 2014 AMENDED APRIL 10, 2013 Reappraisal Plan - Nueces County Appraisal District Page 1 TABLE OF CONTENTS Nueces County Appraisal District
DALLAS CENTRAL APPRAISAL DISTRICT. 2011/2012 Reappraisal Plan
 DALLAS CENTRAL APPRAISAL DISTRICT 2011/2012 Reappraisal Plan DALLAS CENTRAL APPRAISAL DISTRICT 2011-2012 REAPPRAISAL PLAN INTRODUCTION General Overview of Tax Code Requirement Passage of Senate Bill 1652
RAINS COUNTY APPRAISAL DISTRICT
 RAINS COUNTY APPRAISAL DISTRICT 2017 MASS APPRAISAL SUMMARY REPORT mass appraisal report 2017 uspap_appr_report RAINS COUNTY APPRAISAL DISTRICT 2017 MASS APPRAISAL SUMMARY REPORT Identification of Subject:
2016 MASS APPRAISAL REPORT
 THROCKMORTON CENTRAL APPRAISAL DISTRICT 2016 MASS APPRAISAL REPORT WEBSITE HOMEPAGE http://www.throckmortoncad.org 2016 MASS APPRAISAL REPORT PG 1 ORGANIZATION http://www.throckmortoncad.org/organization
PREFACE TO CCAD BIANNUAL REAPPRAISAL PLAN
 PREFACE TO CCAD 2017-2018 BIANNUAL REAPPRAISAL PLAN The purpose of this reappraisal plan is to comply with SB-1652., Sec 6.05i and Sec. 25.18 of Texas Property Tax Code. The appraisal district shall develop
El Paso Central Appraisal District
 El Paso Central Appraisal District MASS APPRAISAL REPORT SEPTEMBER, 2018 Table of Contents 1.0 INTRODUCTION... - 5-1.1 Scope of Responsibility... - 5-1.2 Personnel Resources... - 6-1.3 Data... - 8-1.4
Midland Central Appraisal District BIENNIAL REAPPRAISAL PLAN
 BIENNIAL REAPPRAISAL PLAN FOR THE TAX YEARS 2015 AND 2016 BY THE MIDLAND CENTRAL APPRAISAL DISTRICT BOARD OF DIRECTORS September 10, 2014 TABLE OF CONTENTS ITEM PAGE Executive Summary... 4 General Overview
ATASCOSA COUNTY APPRAISAL DISTRICT
 Atascosa County Appraisal District Michelle L. Cardenas RPA, RTA, CTA, CCA Chief Appraiser P. 0. Box 139 Poteet, TX. 78065 Tel: 830-742-3591 Fax: 830-742-3044 ATASCOSA COUNTY APPRAISAL DISTRICT Reappraisal
ATASCOSA COUNTY APPRAISAL DISTRICT
 Atascosa County Appraisal District Michelle L. Cardenas RPA, RTA, CTA, CCA Chief Appraiser P. 0. Box 139 Poteet, TX. 78065 Tel: 830-742-3591 Fax: 830-742-3044 ATASCOSA COUNTY APPRAISAL DISTRICT Reappraisal
Wise County Appraisal District Reappraisal Plan
 Wise County Appraisal District 2017-2018 Reappraisal Plan INTRODUCTION Scope of Responsibility The Wise County Appraisal District has prepared and published this reappraisal plan and appraisal report to
RESIDENTIAL PROPERTY VALUATION PROCESS
 RESIDENTIAL PROPERTY VALUATION PROCESS Introduction Gregg County is comprised of approximately 276 square miles of area. Gregg County Appraisal District (GCAD) is responsible for the appraisal of the approximately
LLANO CENTRAL APPRAISAL DISTRICT REAPPRAISAL PLAN FOR TAX YEARS 2017 & 2018 AS ADOPTED BY THE BOARD OF DIRECTORS
 LLANO CENTRAL APPRAISAL DISTRICT REAPPRAISAL PLAN FOR TAX YEARS 2017 & 2018 AS ADOPTED BY THE BOARD OF DIRECTORS TABLE OF CONTENTS ITEM PAGE Executive Summary 5 Revaluation Decision (Statutory or Administrative)
REAPPRAISAL PLAN
 Brown County Appraisal District REAPPRAISAL PLAN 2019-2020 1 2 Table of Contents Executive Summary 5 Plan For Periodic Appraisal 7 Revaluation Decision 8 Performance Analysis 8 Reappraisal Year Process
REAPPRAISAL PLAN and 2018 HUNT COUNTY APPRAISAL DISTRICT
 REAPPRAISAL PLAN 2017 and 2018 HUNT COUNTY APPRAISAL DISTRICT Adopted by the Board of Directors September 14, 2016 TABLE OF CONTENTS Table of Contents Page 2-4 Executive Summary Page 5-12 Tax Code Requirement
REAPPRAISAL PLAN CENTRAL APPRAISAL DISTRICT TAYLOR COUNTY
 REAPPRAISAL PLAN 2017-2018 CENTRAL APPRAISAL DISTRICT OF TAYLOR COUNTY Adopted April 21, 2016 TABLE OF CONTENTS Executive Summary 5-9 General Information 10 Personnel Resources 11 Staff Education 11 Data
Reappraisal Plan
 Tarrant Appraisal District 2011-2012 Reappraisal Plan Approved By TAD Board of Directors September 17, 2010 TABLE OF CONTENTS Chapter Page INTRODUCTION... 3 CONDITIONAL STATEMENT... 7 OVERVIEW OF DISTRICT
INTRODUCTION MISSION OVERVIEW
 INTRODUCTION The Austin County Appraisal District is a political subdivision of the State of Texas. The Constitution of the State of Texas, the Texas Property Tax Code, and the Rules of the Texas Comptroller
WALLER COUNTY APPRAISAL DISTRICT MASS APPRAISAL REPORT APPRAISAL YEAR 2018
 WALLER COUNTY APPRAISAL DISTRICT MASS APPRAISAL REPORT APPRAISAL YEAR 2018 ADDENDUM TO WCAD REAPPRAISAL PLAN FOR 2017 AND 2018 WALLER COUNTY APPRAISAL DISTRICT Uniform Standards of Professional Appraisal
Rockwall CAD. Basics of. Appraising Property. For. Property Taxation
 Rockwall CAD Basics of Appraising Property For Property Taxation ROCKWALL CENTRAL APPRAISAL DISTRICT 841 Justin Rd. Rockwall, Texas 75087 972-771-2034 Fax 972-771-6871 Introduction Rockwall Central Appraisal
2016 Annual Report. Carmen Ottmer, Chief Appraiser AUSTIN COUNTY APPRAISAL DISTRICT 906 E. AMELIA ST., BELLVILLE, TEXAS 77418
 2016 Annual Report Carmen Ottmer, Chief Appraiser AUSTIN COUNTY APPRAISAL DISTRICT 906 E. AMELIA ST., BELLVILLE, TEXAS 77418 INTRODUCTION The Austin County Appraisal District is a political subdivision
2014 Annual Report. Fayette County Appraisal District P. O. Box 836 La Grange, TX 78945
 2014 Annual Report Fayette County Appraisal District P. O. Box 836 La Grange, TX 78945 FCAD 2014 Annual Report 1 2014 ANNUAL REPORT FAYETTE COUNTY APPRAISAL DISTRICT INTRODUCTION The Fayette County Appraisal
San Patricio County Appraisal District. Reappraisal Plan For. Tax Years 2013 & 2014
 San Patricio County Appraisal District Reappraisal Plan For Tax Years 2013 & 2014 (adopted by SPCAD Board of Directors on September 11 th, 2012) 1 TABLE OF CONTENTS ITEM PAGE Executive Summary 4 Revaluation
Reappraisal Plan
 2017-2018 Reappraisal Plan Approved By Board of Directors 08/19/2016 TABLE OF CONTENTS Chapter Page INTRODUCTION...3 OVERVIEW OF DISTRICT OPERATIONS...7 OVERVIEW OF REAPPRAISAL ACTIVITIES... 12 RESIDENTIAL
DALLAS CENTRAL APPRAISAL DISTRICT DCAD VALUATION PROCESSES
 DALLAS CENTRAL APPRAISAL DISTRICT DCAD VALUATION PROCESSES DALLAS CENTRAL APPRAISAL DISTRICT DCAD DCAD appraisers appraise a large universe of properties by developing appraisal models DCAD appraisers
2018 Annual Report. Fayette County Appraisal District P. O. Box 836 La Grange, TX 78945
 2018 Annual Report Fayette County Appraisal District P. O. Box 836 La Grange, TX 78945 FCAD 2018 Annual Report 1 2018 ANNUAL REPORT FAYETTE COUNTY APPRAISAL DISTRICT INTRODUCTION The Fayette County Appraisal
Annual Report Appraisal Year 2016
 Annual Report Appraisal Year 2016 Issued September 2016 Coryell Central Appraisal District September 2016 Property Owners of Coryell County, Texas I am pleased to present the Annual Report of the Coryell
2017 Annual Report. Fayette County Appraisal District P. O. Box 836 La Grange, TX 78945
 2017 Annual Report Fayette County Appraisal District P. O. Box 836 La Grange, TX 78945 FCAD 2017 Annual Report 1 2017 ANNUAL REPORT FAYETTE COUNTY APPRAISAL DISTRICT INTRODUCTION The Fayette County Appraisal
NUECES COUNTY APPRAISAL DISTRICT
 NUECES COUNTY APPRAISAL DISTRICT REAPPRAISAL PLAN TAX YEARS 2015 & 2016 TABLE OF CONTENTS Introduction 1 Executive Summary 5 Scope of Responsibilities 6 District Operations 7 Residential Valuation Process
YOUNG CENTRAL APPRAISAL DISTRICT
 YOUNG CENTRAL APPRAISAL DISTRICT 2018 - MASS APPRAISAL REPORT AS OF 8/07/2018 1 2 2018 - MASS APPRAISAL REPORT INTRODUCTION: The Young Central Appraisal District has prepared and published this report
Hidalgo County Appraisal District Re-Appraisal Plan Approved By: Hidalgo County Appraisal District Board of Directors September 12, 2018
 Hidalgo County Appraisal District Re-Appraisal Plan 2019-2020 Approved By: Hidalgo County Appraisal District Board of Directors September 12, 2018 Table of Contents Executive Summary 1 Plan for Periodic
DIRECTIVE # This Directive Supersedes Directive # and #92-003
 Division Of Property Valuation Docking State Office Building 915 SW Harrison St., Room 400N Topeka, KS 66612-1588 Nick Jordan, Secretary David N. Harper, Director phone: 785-296-2365 fax: 785-296-2320
TRAVIS CENTRAL APPRAISAL DISTRICT REAPPRAISAL PLAN FOR TAX YEARS
 TRAVIS CENTRAL APPRAISAL DISTRICT REAPPRAISAL PLAN FOR TAX YEARS 2017-2018 ADOPTED: August 29, 2016 Table of Contents Table of Contents... 2 Notice... 4 Executive Summary... 5 Texas Property Tax Code Requirements...
Brazoria County Appraisal District
 Brazoria County Appraisal District Annual Report 2018 Mission Statement Our mission as public servants is to demand excellence in the services provided to the taxpayers and taxing jurisdictions of Brazoria
Pecos County Appraisal District. Chief Appraiser: Sam Calderon III
 Pecos County Appraisal District Chief Appraiser: Sam Calderon III Meet Your Appraiser Staff Agenda The goals and objectives of this presentation is to provide Property Owner s an overview of PCAD s Appraisal
Dear Brazos County Citizens and Property Owners,
 2017 Annual Report Dear Brazos County Citizens and Property Owners, It is my pleasure to present the 2017 Annual Report of the Brazos Central Appraisal District. The annual report provides general information
Harris County Appraisal District Reappraisal Plan Tax Years Adopted by the Board of Directors
 Harris County Appraisal District Reappraisal Plan Tax Years 2019-2020 Adopted by the Board of Directors August 15, 2018 TABLE OF CONTENTS Executive Summary... 1 Reappraisal Plan... 3 Tax Code Requirement...
VAN ZANDT COUNTY APPRAISAL DISTRICT 2018 ANNUAL REPORT
 VAN ZANDT COUNTY APPRAISAL DISTRICT 2018 ANNUAL REPORT INTRODUCTION The Van Zandt County Appraisal District is a political subdivision of the state. The Constitution of the State of Texas, the Texas Property
Past & Present Adjustments & Parcel Count Section... 13
 Assessment 2017 Report This report includes specific information regarding the 2017 assessment as well as general information about both the appeals and assessment processes. Contents Introduction... 3
Swisher County Appraisal District 2017 Mass Appraisal Report
 Swisher County Appraisal District 2017 Mass Appraisal Report Prepared Pursuant to Standard 6 of the Uniform Standards of Professional Appraisal Practice 1 TABLE OF CONTENTS Introduction 3 Listing of Taxing
MAP. METHODS AND ASSISTANCE PROGRAM 2013 REPORT McLennan County Appraisal District. Susan Combs Texas Comptroller of Public Accounts
 MAP METHODS AND ASSISTANCE PROGRAM 2013 REPORT McLennan County Appraisal District Susan Combs Texas Comptroller of Public Accounts January 22, 2014 Chief Appraiser County Appraisal District Board of Directors
Mass Appraisal of Income-Producing Properties
 Chapter 10 Mass Appraisal of Income-Producing Properties Whether valuing income-producing property or residential property, you can use similar information and methods for collecting and analyzing data
COMAL APPRAISAL DISTRICT ANNUAL APPRAISAL REPORT
 COMAL APPRAISAL DISTRICT 2016 ANNUAL APPRAISAL REPORT TABLE OF CONTENTS Introduction..2 Mission Statement... 2 Purpose of Report...2 Entities Served..2 Legislative Changes.3 Property Types.3 Appraisal
Van Zandt County Appraisal District 2017 Annual Report
 Van Zandt County Appraisal District 2017 Annual Report Introduction The Van Zandt County Appraisal District is a political subdivision of the state. The Constitution of the State of Texas, the Texas Property
MAP. METHODS AND ASSISTANCE PROGRAM 2013 REPORT Hood County Appraisal District. Susan Combs Texas Comptroller of Public Accounts
 MAP METHODS AND ASSISTANCE PROGRAM 2013 REPORT Hood County Appraisal District Susan Combs Texas Comptroller of Public Accounts January 22, 2014 Chief Appraiser County Appraisal District Board of Directors
Harris County Appraisal District Reappraisal Plan Tax Years
 Harris County Appraisal District Reappraisal Plan Tax Years 2017-2018 Adopted by the Board of Directors August 17, 2016 (Amended on January 24, 2018) TABLE OF CONTENTS Executive Summary... 1 Reappraisal
Introduction. Bruce Munneke, S.A.M.A. Washington County Assessor. 3 P a g e
 Assessment 2016 Report This report includes specific information regarding the 2016 assessment as well as general information about both the appeals and assessment processes. Contents Introduction... 3
COMAL APPRAISAL DISTRICT ANNUAL APPRAISAL REPORT
 COMAL APPRAISAL DISTRICT 2017 ANNUAL APPRAISAL REPORT TABLE OF CONTENTS Introduction..2 Mission Statement... 2 Purpose of Report...2 Entities Served..2 Legislative Changes.3 Property Types.3 Appraisal
YOUNG COUNTY APPRAISAL DISTRICT
 YOUNG COUNTY APPRAISAL DISTRICT 2017 - ANNUAL APPRAISAL REPORT AS OF 10/6/2017 1 2 TABLE OF CONTENTS ITEM PAGE Introduction 4 Purpose of Report...4 Taxing Entities, Rates & Exemptions 5 Property Types
How the Montgomery Central Appraisal District Appraises Residential Property
 How the Montgomery Central Appraisal District Appraises Residential Property The following presentation is provided to educate Montgomery County residential property owners about the Analysis & Valuation
Camp Central Appraisal District LEGAL AND ADMINISTRATIVE REQUIREMENTS
 Camp Central Appraisal District LEGAL AND ADMINISTRATIVE REQUIREMENTS Counties are responsible for creating and establishing an Appraisal District. As a political subdivision of the state the major responsibility
MAP. METHODS AND ASSISTANCE PROGRAM 2013 REPORT Liberty County Central Appraisal District. Susan Combs Texas Comptroller of Public Accounts
 MAP METHODS AND ASSISTANCE PROGRAM 2013 REPORT Liberty County Central Appraisal District Susan Combs Texas Comptroller of Public Accounts January 22, 2014 Chief Appraiser County Appraisal District Board
Van Zandt County Appraisal District 2015 Annual Report
 Van Zandt County Appraisal District 2015 Annual Report Introduction The Van Zandt County Appraisal District is a political subdivision of the state. The Constitution of the State of Texas, the Texas Property
Pickens County Reassessment Program. Utilizing CAMA GIS MLS SQL
 1 Pickens County 2019 Reassessment Program Utilizing CAMA GIS MLS SQL Pickens County Reassessment History 1980 Countywide Reappraisal 1990 Countywide Reappraisal 1999 Countywide Reappraisal 2004 Countywide
SCURRY COUNTY APPRAISAL DISTRICT
 SCURRY COUNTY APPRAISAL DISTRICT REAPPRAISAL PLAN FOR TAX YEARS 2019 & 2020 AS ADOPTED BY THE BOARD OF DIRECTORS SUMMARY Passage of S.B. 1652 amended the Property Tax Code to require a written biennial
STEVEN J. DREW Assessor OFFICE OF THE ASSESSOR Service, Integrity, Fairness, Internationally Recognized for Excellence
 STEVEN J. DREW Assessor OFFICE OF THE ASSESSOR Service, Integrity, Fairness, Internationally Recognized for Excellence OVERVIEW OF RESIDENTIAL APPRAISAL PROCESS And Cost Valuation Report Introduction The
2017 Reappraisal Preliminary Report. February 6, 2017
 2017 Reappraisal Preliminary Report February 6, 2017 Reappraisal is required at least every 8 years per NCGS105-286 Last reappraisal was conducted for 2011 Reappraisal includes both land and improvements.
How to Read a Real Estate Appraisal Report
 How to Read a Real Estate Appraisal Report Much of the private, corporate and public wealth of the world consists of real estate. The magnitude of this fundamental resource creates a need for informed
MCLENNAN COUNTY APPRAISAL DISTRICT PROPERTY VALUATION WORKSHOP
 MCLENNAN COUNTY APPRAISAL DISTRICT PROPERTY VALUATION WORKSHOP WORKSHOP OBJECTIVES To understand: Property Tax System The valuation process What is Market Value Market Trends Time frame for protesting
2015 Annual Report. The appraisal district is governed by a Board of Directors whose primary responsibilities are to:
 Refugio County Appraisal District Mailing Address: PO Box 156, Refugio, Texas 78377-0156 Physical Location: 420 North Alamo Street, Refugio, Texas 78377 Telephone Number: 361-526-5994 Website: www.refugiocad.org
Brazoria County Appraisal District
 Brazoria County Appraisal District Annual Report 2017 Mission Statement Our mission as public servants is to demand excellence in the services provided to the taxpayers and taxing jurisdictions of Brazoria
Course Mass Appraisal Practices and Procedures
 Course 331 - Mass Appraisal Practices and Procedures Course Description This course is designed to build on the subject matter covered in Course 300 Fundamentals of Mass Appraisal and prepare the student
Tax Year 2018 Mass Appraisal of Properties
 The Office of the Chief Appraiser David Luther, RPA, RTA, CCA Registered Professional Appraiser, TDLR #1306 Registered Texas Assessor, TDLR #1306 Mass Appraisal Report for Tax Year 2018 Mass Appraisal
REAPPRAISAL PLAN FOR THE 2015 AND 2016 APPRAISAL YEARS FOR ELLIS APPRAISAL DISTRICT 06/05/2014
 REAPPRAISAL PLAN FOR THE 2015 AND 2016 APPRAISAL YEARS FOR ELLIS APPRAISAL DISTRICT 06/05/2014 Kathy A. Rodrigue, RPA, RTA Chief Appraiser John Ostendorf, RPA, CCA Deputy Chief Appraiser Page 2 Table of
Assessment Year 2016 Assessment Valuations / Mass Appraisal Summary Report
 Assessment Year 2016 Assessment Valuations / Mass Appraisal Summary Report Overview Following up on last year s work, additional work was done cleaning up the sales data. The land valuation model was further
WICHITA APPRAISAL DISTRICT ANNUAL REPORT
 WICHITA APPRAISAL DISTRICT 2017 ANNUAL REPORT Appraised s Wichita Appraisal District is responsible for local property tax appraisal and exemption administration for the twelve taxing jurisdictions within
McLennan County Appraisal District Annual Report. MCAD Waco, TX. 1 P age
 McLennan County Appraisal District Waco, TX Administration Annual Report McLennan County Appraisal District 2016 Annual Report MCAD Waco, TX 1 P age Appraisal District Overview The McLennan County Appraisal
2018 Annual Appraisal Report
 2018 Annual Appraisal Report SUMMARY OF APPRAISAL ACTIVITIES, EXEMPTIONS, EQUALIZATION AND TAX RATES FOR 2018 TAX YEAR Wendy Grams, RPA, CTA, CCA CENTRAL APPRAISAL DISTRICT OF BANDERA COUNTY P. O. BOX
Central Appraisal District Colorado County
 Central Appraisal District Colorado County APPRAISAL PROCESS 1. OVERVIEW A. Definition of Property Tax A tax that is measured by the value of property that a taxpayer owns. Property taxes are also called
2011 ASSESSMENT RATIO REPORT
 2011 Ratio Report SECTION I OVERVIEW 2011 ASSESSMENT RATIO REPORT The Department of Assessments and Taxation appraises real property for the purposes of property taxation. Properties are valued using
MAP. METHODS AND ASSISTANCE PROGRAM 2013 REPORT Real County Appraisal District. Susan Combs Texas Comptroller of Public Accounts
 MAP METHODS AND ASSISTANCE PROGRAM 2013 REPORT Real County Appraisal District Susan Combs Texas Comptroller of Public Accounts January 22, 2014 Chief Appraiser County Appraisal District Board of Directors
PROPERTY ASSESSMENT KNOWLEDGE
 A P E N DE UM NOUN A COLLECTION OF CONCISE BUT DETAILED INFORMATION ABOUT APPRAISAL AND APPRAISAL MANAGEMENT, ESPECIALLY IN THE PROPERTY ASSESSMENT INDUSTRY. PROPERTY ASSESSMENT KNOWLEDGE KNOWLEDGE AREAS
concepts and techniques
 concepts and techniques S a m p l e Timed Outline Topic Area DAY 1 Reference(s) Learning Objective The student will learn Teaching Method Time Segment (Minutes) Chapter 1: Introduction to Sales Comparison
DELTA COUNTY APPRAISAL DISTRICT 2016 ANNUAL APPRAISAL REPORT
 DELTA COUNTY APPRAISAL DISTRICT 2016 ANNUAL APPRAISAL REPORT Introduction The Delta County Appraisal District is a political subdivision of the State of Texas. The Constitution of the State of Texas, the
CALDWELL COUNTY APPRAISAL DISTRICT
 CALDWELL COUNTY APPRAISAL DISTRICT 2018 Mass Appraisal Report INTRODUCTION Scope of Responsibility The Caldwell County Appraisal District has prepared and published this report to provide our citizens
Wise County Appraisal District
 Wise County Appraisal District Fall 2015 To the Citizens of Wise County The Wise County Appraisal District has prepared the 2015 Annual Report to better assist the citizens and taxpayers of Wise County
ASSESSORS ANSWER FREQUENTLY ASKED QUESTIONS ABOUT REAL PROPERTY Assessors Office, 37 Main Street
 A. THE ASSESSMENT PROCESS: ASSESSORS ANSWER FREQUENTLY ASKED QUESTIONS ABOUT REAL PROPERTY Assessors Office, 37 Main Street What is mass appraisal? Assessors must value all real and personal property in
IMPORTANT ANNOUNCEMENT: Our website is changing! Please click here for details.
 IMPORTANT ANNOUNCEMENT: Our website is changing! Please click here for details. Home Search Downloads Exemptions Agriculture Maps Tangible Links Contact Home Frequently Asked Questions (FAQ) Frequently
DELTA COUNTY APPRAISAL DISTRICT 2014 ANNUAL APPRAISAL REPORT
 DELTA COUNTY APPRAISAL DISTRICT 2014 ANNUAL APPRAISAL REPORT Introduction The Delta County Appraisal District is a political subdivision of the State of Texas. The Constitution of the State of Texas, the
CALLAHAN COUNTY APPRAISAL DISTRICT 2017 ANNUAL APPRAISAL REPORT
 CALLAHAN COUNTY APPRAISAL DISTRICT 2017 ANNUAL APPRAISAL REPORT Introduction The Callahan County Appraisal District is a political subdivision of the state. The Constitution of the State of Texas, the
April 12, The Honorable Martin O Malley And The General Assembly of Maryland
 April 12, 2011 The Honorable Martin O Malley And The General Assembly of Maryland As required by Section 2-202 of the Tax-Property Article of the Annotated Code of Maryland, I am pleased to submit the
New Models for Property Data Verification and Valuation
 New Models for Property Data Verification and Valuation for 2006 IAAO Councils and Sections Joint Seminar May 9-11, 2006 Charleston, South Carolina Presented by George Donatello, CMS Principal Consultant
METHODOLOGY GUIDE VALUING LANDS IN TRANSITION IN ONTARIO. Valuation Date: January 1, 2016
 METHODOLOGY GUIDE VALUING LANDS IN TRANSITION IN ONTARIO Valuation Date: January 1, 2016 August 2017 August 22, 2017 The Municipal Property Assessment Corporation (MPAC) is responsible for accurately assessing
Terrell County Appraisal District 2018 Annual Report
 Terrell County Appraisal District 2018 Annual Report Introduction The Terrell County Appraisal District is a political subdivision of the State of Texas. The Texas Constitution, Texas Property Tax Code
Guide to Personal Property Rendition
 Guide to Personal Property Rendition If you own a business, you are required by law to report personal property that is used in that business to your county appraisal district. There are substantial penalties
Harris County Appraisal District
 Harris County Appraisal District Presentation to Houston ISD Board of Trustees 4/2/2015 1 Items covered Quick facts about HCAD Overview of the property tax process and timelines Roles and responsibilities
Fannin Central Appraisal District Annual Appraisal Report
 Fannin Central Appraisal District Introduction The Fannin Central Appraisal District is a political subdivision of the state. The jurisdictional boundary of the Appraisal District covers 899 square miles.
UNDERSTANDING PROPERTY TAXES IN COLORADO
 UNDERSTANDING PROPERTY TAXES IN COLORADO This brochure was created to provide general information on the Colorado property tax system. For more specific information on any one of these topics, please visit
CITY OF OWATONNA ASSESSMENT REPORT. Steele County Assessor s Department. William G. Effertz, SAMA Steele County Assessor
 2017 CITY OF OWATONNA ASSESSMENT REPORT Steele County Assessor s Department William G. Effertz, SAMA Steele County Assessor Tyler Diersen, AMA, Assistant County Assessor April 11, 2017 2017 Assessment
HUNT COUNTY APPRAISAL DISTRICT
 2018 ANNUAL REPORT HUNT COUNTY APPRAISAL DISTRICT P.O. BOX 1339 4801 KING STREET GREENVILLE, TEXAS 75403-1339 (903) 454-3510 FAX (903) 454-4160 www.hunt-cad.org GENERAL INFORMATION The Hunt County Appraisal
2016 Mass Appraisal Report Archer County Appraisal District
 2016 Mass Appraisal Report Archer County Appraisal District Archer County Appraisal District 112 East Walnut St P.O. Box 1141 Archer City, Texas 76351 (940) 574-2172 Kimbra York, RPA,RTA Chief Appraiser
The Honorable Larry Hogan And The General Assembly of Maryland
 2015 Ratio Report The Honorable Larry Hogan And The General Assembly of Maryland As required by Section 2-202 of the Tax-Property Article of the Annotated Code of Maryland, I am pleased to submit the Department