Documenting the Economic Contribution of Office, Industrial, and Retail Real Estate to the Local Community. Prepared for
|
|
|
- Nancy Hancock
- 5 years ago
- Views:
Transcription
1 Documenting the Economic Contribution of Office, Industrial, and Retail Real Estate to the Local Community Prepared for The National Association of Office and Industrial Properties Research Foundation By Stephen S. Fuller, Ph.D. Dwight Shar Faculty Chair and University Professor Director of the Center for Regional Analysis George Mason University Fairfax, Virginia October 2004
2 Table of Contents Section Page Number Introduction 3 General Guidelines 4 Analytical Procedures 6 Definitions 8 Information Sources 10 Work Sheets 12 Office Building Economic Impact Work Sheet 13 Retail Economic Impact Work Sheet 16 Industrial Building Economic Impact Work Sheet 19 RIMS II State Multipliers: Office, Industrial and Commercial Buildings 22 2
3 Introduction New and existing commercial real estate constitute a major source of economic activity within local communities. Many of these contributions can be documented and measured in terms of dollar value, jobs supported/created and housed, personal earnings generated, sales and value added, and tax revenues produced. The measurement of these economic and fiscal impacts often involves complex calculations and requires extensive data collection. However, these benefits also can be estimated employing more simple methods that rely on public information and widely accepted industry standards. This simplified approach to the measurement of economic and fiscal impacts focuses on identifying the larger and more visible sources of impacts and does not attempt to represent an all-inclusive scope. While providing a-less-than-100 percent accounting, this approach can be represented as providing a conservative estimate of impacts, one that does not overstate the importance of the industry; that is, one that demonstrates its value without overstatement or subjectivity. The analytical methods outlined herein for calculating the economic impacts of office, industrial and retail real estate rely on common data sources and techniques while also reflecting necessary differences that may characterize the specific class of land use. These methods will distinguish between new construction and the existing stock of buildings. It will also distinguish between the direct and the total economic impacts. Lastly, the analyses will distinguish between economic impacts that flow from the building type being analyzed and the economic impacts generated by the building s use following construction. These later impacts magnify the value of the commercial base by accounting for the work being done within the buildings the workers housed, the payroll generated, and the value added to the economy. With the exception of government and non-profit activities, the productive output of the community is done within the commercial base; this is where the value of goods and services that constitutes the local GDP is generated. Consequently, the value of commercial buildings is much more than the sum of their construction outlays or their assessed valuation. The methods outlined herein provide the guidance required to identify and measure the full range of economic impacts of office, industrial and retail real estate emphasizing the sources of benefits that comprise the large majority of economic impacts and that are widely appreciated and understood by the general public. The results of these analyses can be used to educate the public regarding the broad value of the commercial real estate industry and to establish the range of benefits that would flow to the community as a result of the construction of a proposed commercial building. Finally, as public attitudes towards any new growth harden, having facts that demonstrate the critical contributions made by commercial development to the community s economic vitality becomes even more important in balancing the debate. 3
4 General Guidelines To undertake the measurement of economic impacts of the accumulated stock of buildings or the new construction during a given year or span of years in a given community requires planning and training prior to data collection and analysis. While the exact sequence of steps may vary, they should include the following: 1. Establish a technical committee or panel to manage the process and to act as an advisory resource to revolve questions that may arise during the analyses; 2. Determine the geographic and industry focus of the analysis; is the analysis to report the economic and fiscal impacts of the entire stock of a specific type or class of commercial buildings or of new construction during a set time span? 3. Identify the responsible person who will conduct the analysis: --staff --intern with supervision --volunteers --outsource to a consultant 4. The technical committee and staff person/intern should meet to review procedures, clarify assumptions and data sources, develop a contact list, establish the data collection schedule, review the computational steps and assignments (who will do what and when?); 5. The first step should be to collect information that is published, available on websites, and available from industry sources and then pursue remaining, hard-tocollect data from identified sources (people in local government offices) these contacts need to be protected as sources of information that only they can provide; that is, do not wear out your welcome with key data providers by asking them for data that are easily available elsewhere; public sources are generally considered more objective than industry or proprietary sources. 6. Document all data collected by source for future reference or for follow up (name, place, date); keep complete records throughout the process; 7. Do not collect data you do not need; be disciplined or the data collection process could become too time consuming and confusing; 8. After collecting all of the required information, calculate impacts following the guidance provided in this manual; always total your rows and columns and make sure they add up; and, 4
5 (9) Assign the report writing to someone knowledgeable about the analyses process, the industry and the objectives of the report; use summary tables to simplify the communications of findings, keep the report short, place data tables and supporting materials in the appendix. (10) Determine the audience and dissemination procedures for the results of the analysis. 5
6 Analytical Procedures To identify and calculate the economic and fiscal impacts of a commercial building or the total inventory of commercial real estate within a community, follow these steps: Define the Problem: This phase involves establishing the objectives of the exercise. This would include determining whether the scope is restricted the totality of office buildings and uses existing in the local community, some other set of structures (e.g., all Class A office structures or to a single building (e.g., a proposed new office complex). These objectives must be realistic in terms of available time and budget as well as the skill of the staff and availability of data. While a full fiscal analysis might be desirable, such an analysis will be far too complex to accomplish with voluntary labor and with little or no professional experience in pubic finance. Still, some fiscal impacts can be identified, such as real estate tax revenues or sales taxes generated. These should be represented for what they are and not used to suggest the net fiscal benefit; that would require all local public expenditure demands to be totaled and subtracted from the total revenues generated by the commercial properties being analyzed. This phase would also specify the geographic scope of the analysis. The best jurisdictional scale (because the best economic information is available) is the county. At the city scale or any subdivision of a city or county, there are serious data constraints. The state level may also provide a useful analytical scale as the economic multipliers increase in value with larger geographic scales; that is, the county multipliers are smaller than the encompassing metro area s multipliers and these are both smaller than the state s within which the county (metro area) is located. All analytical assumptions should be established at this early stage of the analysis. These assumptions should include: the amount of gross square feet per office worker, retail worker, and warehouse/industrial worker; hard cost-soft cost splits if not established in fact; pricing and value information if not known in fact; mean salary levels for jobs housed as a result of the completed buildings if not known in fact (these must be mean or arithmetic averages and not median values); average inventory-wide annual per square foot values for building maintenance and repair and for operations (HVAC, custodial services, utilities, management) should be determined; other data requirements for which actual official data are not available will also need careful estimating based on industry standards. These values should be documented and referenced to a published or accepted source such as NAIOP, ULI, or a recognized trade publication. Collect and Analyze the Data: see General Guidelines and Informational Sources. Data collection table shells with explanatory notes are provided herein to assist in the data collection and analysis process. Whether all of the indicated information is actually required or some other form of this information would be more appropriate will be determined by the specification of research objectives. This should be accomplished in the initial problem definition phase where the research scope and data requirements are established. 6
7 Prepare and Disseminate the Report: While the staff assigned to collect the required information for calculating the economic and fiscal impacts may have the analytical and expository skills to prepare the report, this assignment might be better fulfilled by a more senior professional. It could also involve joint authorship. The technical committee/panel should make this assignment. Before preparing a report, determine to whom the report is being directed. For almost any audience, a short report is more effective. A one-page summary of impacts a fact sheet is an effective device for disseminating the big picture values. A question and answer sheet can also be effective. A model for a three-page Executive Summary is as follows: (1) an introduction that briefly presents the objectives and scope of the report, (2) the key findings of the research as one-line bullet points organized from macro to micro (general to specific), and (3) a conclusion that states the importance of the findings supported by one simple summary table. This Executive Summary could be attached to a full report if that was determined to be useful or it could be supported solely by appendix materials. Such an executive summary would imply a full and detailed report but none would have to be available for distribution. How to disseminate the findings? The answer to this question is best determined by the reason for conducting the analysis in the first place. If it is to support a specific project application, then that is the sole audience. If it is to educate the elected officials and broader business community, the scope and packaging of the report needs to be different. If it is to provide response materials for a no-growth debate or to inform the media, the release of the findings could be accomplished through an open press briefing or through a selected newspaper columnist, which ever best achieves the purpose. Consulting a communications professional would be beneficial in determining the most favorable PR strategy for achieving the appropriate placement of facts and findings. 7
8 Definitions Area of Analysis the geographic unit of analysis, normally a political unit for which economic, demographic and fiscal information is reported. Building Value construction value would include hard costs (costs of the structure) and soft costs (management, engineering, design, taxes, fees); the finished commercial value would reflect cash flow potential or current performance; assessed valuation for tax purposes may be accepted as an appropriate substitute for actual market value. Direct Benefit the dollar value of the output of an industry or firm produced either as An intermediate good or service or for final demand; for real estate this would include the actual expenditures associated with a construction project, operating outlay, or spending for maintenance and repair. Gross Domestic Product (GDP), Gross State Product (GSP), Gross County Product (GCP) - the value of goods and services produced within the economy of the respective geographic area (nation, state, county/city). Gross Square Feet as a measure of an individual building size or aggregate inventory of building space reflecting the total envelope of the structures and not the occupied or usable building area. Indirect Benefit the additional economic benefits measured in dollars or jobs resulting from the accumulated additional value generated by the direct outlays or expenditures, as these dollars are re-spent within the economy (e.g., payroll and purchases of goods and services inclusive of induced effects). Induced Effects the impacts of the payroll spending of workers in the specific industry or sector on local businesses providing goods and services to households. Infrastructure utilities, roads, parking lots, storm drainage structures; other site improvements could be included in estimating these costs if not included elsewhere; if these improvements are financed by the private sector, whether on- or off-site, their cost should be reflected in the base values for calculating industry economic impacts. Land Value either assessed land value exclusive of structures or purchase price. Multiplier a numerical factor that captures the total value of a direct outlay of or benefit produced by an industry (firm) on the economy as it is re-spent within that economy; an output multiplier measures the contribution (impact) of a direct outlay on the overall economy, an employment multiplier measures the total 8
9 number of jobs that can be supported by a direct outlay; and a personal earnings multiplier measures the total personal earnings (wages and salaries) generated within the jurisdiction as a result of a direct outlay and the jobs its supports. Output the goods and services produced for sale to other firms or industries as intermediate goods or services or for sale to consumers as final good or services. Sector a grouping of industries or firms by similar characteristics of operations (e.g., retail trade sector, manufacturing sector, construction sector, mining sector, service sector, government sector). Total Output the sum of the direct and indirect benefits (outlays) reflecting the combination of the initial sales of a firm (cost of an output) and its subsequent accumulated value as it is cycled through the economy inclusive of benefits (induced) generated by the re-spending of personal earnings; contribution to GDP, GSP or GCP. Value Added a measure of the incremental dollar value created by an industry, firm or individual employee as a result of its production (work performed) process; the value created beyond the value of the individual inputs. 9
10 Information Sources (1) Regional Input-Output Multipliers (available at county or state levels; not available at city or town level) may be purchased from the Bureau of Economic Analysis (BEA), US Department of Commerce as follows. The current price for one report (jurisdiction) is $ The delivery times ranges from one to two weeks. Hard copy of multiplier tables and on disk sent via federal express. a) Go to b) Complete the form on-line and then print out the form. c) Fax the completed form to: (202) d) The BEA will fax to you a completed purchase order for confirmation. e) Call BEA at (202) to confirm order and to pay by credit card. (2) Building/Inventory Information will generally be developed from industry (private, sometimes proprietary) sources. For new or proposed structures, respective developers would be the logical sources. For the total inventory, local real estate research firms can provide most of the required information; some may need to be estimated. The technical committee or other local experts may be able to fill in the data gaps on the size of the inventory and building operating costs. (3) Real Estate Tax Information may be available on line for the jurisdiction being analyzed. Each year, local governments release what is generally titled a Comprehensive Annual Financial Report (CAFR) that presents the audited revenues and expenditures for the previous fiscal year. Many jurisdictions have their CAFRs on-line. If not on-line, the CAFR would be available from the city/county Department of Finance or the Executive s office. Real estate tax revenues and tax rates are included in the CAFR as are all other financial information concerning the jurisdiction. The CAFR is a superior source to the budget as it documents actual revenues and expenditures while budgets only specific expected outcomes. The total assessed valuation of all real estate in the jurisdiction may not be included in the CAFR. Also, its division between commercial and non-commercial land uses is not likely to be reported in the CAFR. For these data, a call or visit to the Department of Finance (or equivalent office) to gather this information for the most recent year; historic trends would also be available. (4) Economic Data, including employment by sector, unemployment, and income, are available from several standard sources: local economic development agency (government office or Authority), state-level employment commission (these issue quarterly reports for most jurisdictions within their state with a 6 to 9 month commonly referred to as the 202 survey), or employment and income data can be purchased commercially from local and national vendors. Obtain the most recent release as these reports may change monthly or quarterly. Annual values are also available. The most recent year is subject to revision during the first quarter of the following year (e.g.,
11 employment data released during the year are revised after one month and both monthly and annual values will be revised again by March of 2005). One national vendor is NPA Data Services, Inc. of Arlington, Virginia ( For a small fee, a county-level report can be purchased presenting employment by sector, income generated by corresponding sector, population, per capita income, households and household income for the period These are available for every county, state, and metropolitan area in the US as well as for the nation, but not for cities as cities are always part of an economy that extends into a surrounding jurisdiction(s). When purchasing county-level data, also purchase the state; also acquire the metro area if the county is part of one, and the nation in order to be able to show relative sizes and comparative trends. A service fee (less than $100) plus a charge for each jurisdiction ordered would bring the total for four jurisdictions (county, metro, state and US) to under $200. Orders are usually filled within 48 hours. These data are updated and revised two times a year. Other vendors are available. Local universities that have an economic or business research center may be able to provide these data at no costs or for a small fee. (5) Operating, Repair and Maintenance Expenditures. Per square foot annual operating outlays associated with occupied buildings will vary from market to market and therefore are best developed from local industry sources. Major brokerages would be a primary source for these data. For annual repair and maintenance expenditures associated with maintaining the building stock, local industry sources may provide reliable data. Alternatively, office building income and expense data is available from BOMA (Building Owners and Managers Association, or and office building and shopping center information from IREM (Institute of Real Estate Management, or NAIOP also has information about industrial properties in its Industrial Income and Expense Report ( ) or go to 11
12 Work Sheets The work sheets presented herein are designed as general guides for the identification of data inputs for the analysis of economic impacts. As such they may require modification to fit a specific application. The analysis of a single building s impacts (which is not the focus of this report) would require some modification of scope and may involve additional data sources. Before commencing any data collection, a data collection plan should be developed that focuses the data requirements specifically to the end product. It is important for the person collecting data to know exactly what data are required and why, so that the requests are clear to the provider. It is not unusual that the provider of the requested data will misunderstand the request and provide what is thought to be the data requested even though they are not quite the right information. If the person collecting the data cannot distinguish the requested data from the provided data, getting the correct data will at least require a second request and extra time, but could also produce incorrect analytical results if no one else has noticed the error. It is also important that the data sources be recognized as being objective sources. Objectivity should take precedence over convenience. Usually, implies that public sources are to be preferred over private or proprietary sources. Garbage in garbage out is a constant threat to the credibility of the research results. 12
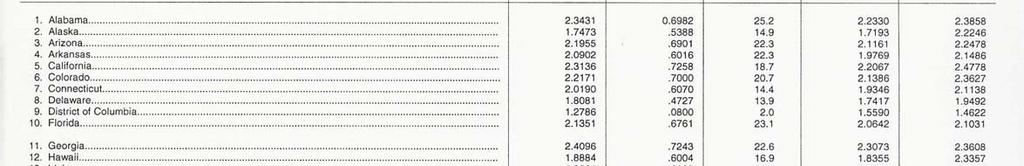
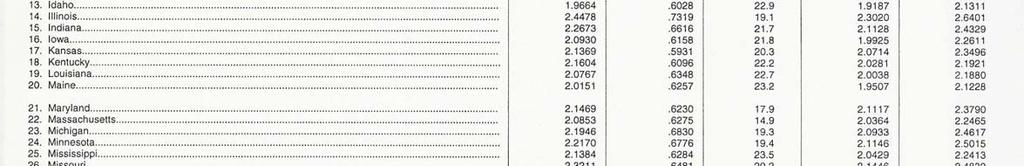
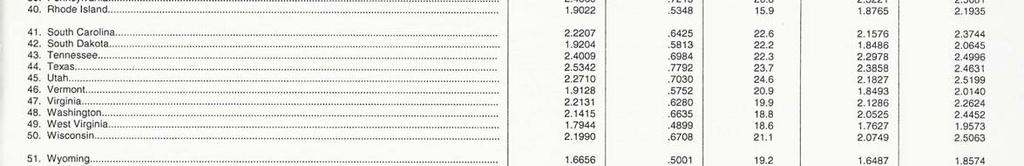
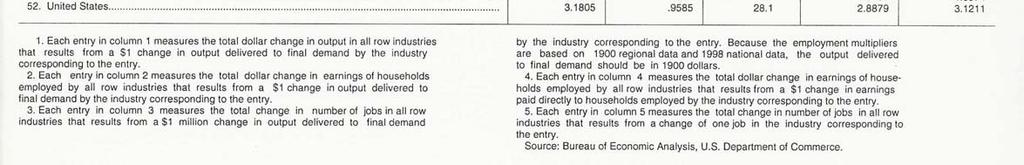
13 Office Building Economic Impact Work Sheet Total Inventory Impact Analysis Total assessed value (1) Total real estate tax revenue (2) (Tax rate/$100 x value) Total square feet (3) Total estimated work force (4) (Total sf divided by sf/worker) Total estimated payroll (5) (Workers times mean salary) Total building operating outlays (6) (Cost/sf times total sf) Total repair and maintenance outlays (7) (Cost/sf times total sf) 1. See Information Sources paragraph #3. 2. See Information Sources paragraph #3. 3. See Information Sources paragraph #2. 4. Multiply the total inventory square footage by the accepted number of workers per gross square feet in the locale (e.g., 250 gross sf per worker)* 5. Multiply the mean annual salary for office workers (service sector employment may be used) developed from local sources (Chamber of Commerce, Department of Economic Development) times the number of office workers being housed. 6. Multiply the annual average per square foot operating costs (excluding utilities) reflecting local prices or use industry standard from appropriate source (e.g., Property Managers Association) times the inventory s total number of square feet. 7. Multiply the annual average per square foot repair and maintenance cost for office uses (from local sources or industry association publications [e.g., BOMA, IREM]) times the number of gross square feet in the inventory. The total economic impacts of the dollar values developed for the spending potential of the work force housed in the office inventory and the outlays associated with operating and maintaining this inventory as determined in the work sheet above can be calculated by applying the appropriate economic multiplier to each category of impact. As each source of spending has an indirect effect on the local economy as these new dollars are re-spent locally, the value of this additional spending represents an important contribution to the economy s overall vitality. The magnitude of these combined economic impacts (direct and indirect) are represented by the multiplier for each respective source of new spending; for example, for each new dollar of spending for building operations in Fairfax County, Virginia, the total economic impact in the County is $1.55. The source of these multipliers (by county) is provided in paragraph #1 under Information Sources. 13
14 New Construction Analysis (total current year construction or cumulative years) Also, the economic impacts associated with one year s (or the cumulative impact of several year s) of new construction can be calculated by applying the appropriate construction multipliers as outlined below. Value of construction in dollars (round to thousands or millions for presentation) Hard Costs (1) Soft Costs (1) Total Building Costs (sum of hard and soft $s) Land Costs (1) Associated Infrastructure (value) On-site (1) Off-Site (1) Total value of new construction sum of above (2) Estimate added annual value to existing real estate base (3) $ 1. See Information Sources paragraph #2. 2. this value* would be used to calculate economic impacts using BEA multipliers at the county or state levels): see Information sources, paragraph #1. 3. this value would be representative of the assessed valuation of the built inventory so would exclude off-site costs incurred by the developer and some soft costs that would not be reflected in an appraisal). Insurance and financing costs and fees would be excluded as these outlays have little or no impact on the local economy; all soft costs that reflect professional services should be included as these outlays clearly represent economic activity generated within the local economy as a consequence of the building industry. 14
15 Value Added Impacts (of one or more years of new construction) - the objective of this analysis is to calculate the economic output associated with the work or activity that is enabled due to the new building capacity provided. This work/activity includes both the outlays associated with operating the new inventory of buildings and the work of the jobs housed in the building. Building Operations and Maintenance and Repair (1) Building operations outlays (management, utilities, custodial) Annual maintenance and repair outlays $ /sf $ /sf Building or inventory square feet Total annual outlays to support building/office inventory (2) $ Persons working in the office 250 sf/worker (3) Average (mean) salary of office jobs in current year (4) $ Payroll impact of housed workers(5) $ 1. See Information Sources paragraph # Square feet times cost per square foot summed 3. Use local worker/sf value here 4. See Information Sources paragraph #4; all the local department of economic development or chamber of commerce may be able to provide estimates for average salaries. 5. # of workers times mean salary To calculate the total value of these outlays on the local economy, the respective spending values should be multiplied by the appropriate total output, personal income and job multipliers from the BEA tables - see Information Sources paragraph #1 regarding multipliers. Different multipliers are available for each county in the US for new construction (commercial maybe distinguished from residential), architectural and engineering services or specialized design services (soft costs), management companies (operating outlays), facilities support services (operating outlays), services to buildings (operating outlays), retail trade, personal services, health and education services and restaurant and entertainment (employee spending impacts). 15
16 Retail Economic Impact Work Sheet The data requirements and analytical approach for retail space will parallel the requirements and processes outlined for office buildings. Assumptions concerning workers per square foot, payroll, and construction and operating costs should reflect industry specifics. Total Inventory Impact Analysis Total assessed value (1) Total real estate tax revenue (2) (Tax rate/$100 x value) Total square feet (3) Total estimated work force (4) (Total sf divided by sf/worker) Total estimated payroll (5) (Workers times mean salary) Total building operating outlays (6) (Cost/sf times total sf) Total repair and maintenance outlays (7) (Cost/sf times total sf) Total retail sales generated by the inventory (sales/sf times total square feet of stock) 1. See Information Sources paragraph #3. 2. See Information Sources paragraph #3. 3. See Information Sources paragraph #2 4. Multiply the total inventory square footage by the accepted number of workers per gross square feet in the locale (e.g., 450 gross sf per worker)* 5. Multiply the mean annual salary for retail workers (retail sector employment may be used) developed from local sources (Chamber of Commerce, Department of Economic Development) times the number of retail workers being housed. 6. Multiply the annual average per square foot operating costs (excluding utilities) reflecting local prices or use industry standard from appropriate source (e.g., IREM) times the inventory s total number of square feet. 7. Multiply the annual average per square foot repair and maintenance cost for retail uses (from local sources or industry association publications [e.g., IREM]) times the number of gross square feet in the inventory. The total economic impacts of the dollar values developed for the spending potential of the work force housed in the retail building inventory and the outlays associated with operating and maintaining this inventory as determined in the work sheet above can be calculated by applying the appropriate economic multiplier to each category of impact. As each source of spending has an indirect effect on the local economy as these new 16
17 dollars are re-spent locally, the value of this additional spending represents an important contribution to the economy s overall vitality. The magnitude of these combined economic impacts (direct and indirect) are represented by the multiplier for each respective source of new spending; for example, for each new dollar of spending for building operations in Fairfax County, Virginia, the total economic impact in the County is $1.55. The source of these multipliers (by county) is provided in paragraph #1 under Information Sources. New Construction Analysis (total current year construction or cumulative years) Also, the economic impacts associated with one year s (or the cumulative impact of several year s) of new construction can be calculated by applying the appropriate construction multipliers as outlined below. Value of construction in dollars (round to thousands or millions for presentation) Hard Costs (1) Soft Costs (1) Total Building Costs (sum of hard and soft $s) Land Costs (1) Associated Infrastructure (value) On-site (1) Off-Site (1) Total value of new construction sum of above (2) Estimate added annual value to existing real estate base (3) $ 1. See Information Sources paragraph #2. 2. This value* would be used to calculate economic impacts using BEA multipliers at the county or state levels): see Information sources, paragraph #1. 3. This value would be representative of the assessed valuation of the built inventory so would exclude off-site costs incurred by the developer and some soft costs that would not be reflected in an appraisal). Insurance and financing costs and fees would be excluded as these outlays have little or no impact on the local economy; all soft costs that reflect professional services should be included as these outlays clearly represent economic activity generated within the local economy as a consequence of the building industry. 17
18 Value Added Impacts (of one or more years of new construction) - the objective of this analysis is to calculate the economic output associated with the work or activity that is enabled due to the new building capacity provided. This work/activity includes both the outlays associated with operating the new inventory of buildings and the work of the jobs housed in the building. Building Operations and Maintenance and Repair (1) Building operations outlays (management, utilities, custodial) Annual maintenance and repair outlays $ /sf $ /sf Building or inventory square feet Total annual outlays to support retail space inventory (2) Persons working in the retail 450 sf/worker (3) Average (mean) salary of retail jobs in current year (4) Payroll impact of housed workers (5) $ $ $ 1. See Information Sources paragraph # Square feet times cost per square foot summed 3. Use local worker/sf value here 4. See Information Sources paragraph #4; all the local department of economic development or chamber of commerce may be able to provide estimates for average salaries. 5. # of workers times mean salary To calculate the total value of these outlays on the local economy, the respective spending values should be multiplied by the appropriate total output, personal income and job multipliers from the BEA tables - see Information Sources paragraph #1 regarding multipliers. Different multipliers are available for each county in the US for new construction (commercial maybe distinguished from residential), architectural and engineering services or specialized design services (soft costs), management companies (operating outlays), facilities support services (operating outlays), services to buildings (operating outlays), retail trade, personal services, health and education services and restaurant and entertainment (employee spending impacts). 18
19 Industrial Building Economic Impact Work Sheet The data requirements and analytical approach for industrial building space will parallel the requirements and processes outlined for office building and retail centers. Assumptions concerning workers per square foot, payroll, and construction and operating costs should reflect industry specifics. Total Inventory Impact Analysis Total assessed value (1) Total real estate tax revenue (2) (Tax rate/$100 x value) Total square feet (3) Total estimated work force (4) (Total sf divided by sf/worker) Total estimated payroll (5) (Workers times mean salary) Total building operating outlays (6) (Cost/sf times total sf) Total repair and maintenance outlays (7) (Cost/sf times total sf) Total retail sales generated by the inventory (sales/sf times total square feet of stock) 1. See Information Sources paragraph #3. 2. See Information Sources paragraph #3. 3. See Information Sources paragraph #2 4. Multiply the total inventory square footage by the accepted number of workers per gross square feet in the locale (e.g., 900 gross sf per worker)* 5. Multiply the mean annual salary for industrial workers (manufacturing or wholesale sector employment may be used) developed from local sources (Chamber of Commerce, Department of Economic Development) times the number of retail workers being housed. 6. Multiply the annual average per square foot operating costs (excluding utilities) reflecting local prices or use industry standard from appropriate source (e.g., NAIOP) times the inventory s total number of square feet. 7. Multiply the annual average per square foot repair and maintenance cost for industrial/warehouse uses (from local sources or industry standards [e.g., NAIOP]) times the number of gross square feet in the inventory. The total economic impacts of the dollar values developed for the spending potential of the work force housed in the industrial building inventory and the outlays associated with operating and maintaining this inventory as determined in the work sheet above can be calculated by applying the appropriate economic multiplier to each category of impact. 19
20 As each source of spending has an indirect effect on the local economy as these new dollars are re-spent locally, the value of this additional spending represents an important contribution to the economy s overall vitality. The magnitude of these combined economic impacts (direct and indirect) are represented by the multiplier for each respective source of new spending; for example, for each new dollar of spending for building operations in Fairfax County, Virginia, the total economic impact in the County is $1.55. The source of these multipliers (by county) is provided in paragraph #1 under Information Sources. New Construction Analysis (total current year construction or cumulative years) Also, the economic impacts associated with one year s (or the cumulative impact of several year s) of new construction can be calculated by applying the appropriate construction multipliers as outlined below. Value of construction in dollars (round to thousands or millions for presentation) Hard Costs (1) Soft Costs (1) Total Building Costs (sum of hard and soft $s) Land Costs (1) Associated Infrastructure (value) On-site (1) Off-Site (1) Total value of new construction sum of above (2) Estimate added annual value to existing real estate base (3) $ 1. See Information Sources paragraph #2. 2. this value* would be used to calculate economic impacts using BEA multipliers at the county or state levels): see Information sources, paragraph #1. 3. this value would be representative of the assessed valuation of the built inventory so would exclude off-site costs incurred by the developer and some soft costs that would not be reflected in an appraisal). insurance and financing costs and fees would be excluded as these outlays have little or no impact on the local economy; all soft costs that reflect professional services should be included as these outlays clearly represent economic activity generated within the local economy as a consequence of the building industry. 20
21 Value Added Impacts (of one or more years of new construction) - the objective of this analysis is to calculate the economic output associated with the work or activity that is enabled due to the new building capacity provided. This work/activity includes both the outlays associated with operating the new inventory of buildings and the work of the jobs housed in the building. Building Operations and Maintenance and Repair (1) Building operations outlays (management, utilities, custodial) Annual maintenance and repair outlays $ /sf $ /sf Building or inventory square feet Total annual outlays to support industrial building inventory (2) $ Persons working in the industrial 900 sf/worker (3) Average (mean) salary of industrial jobs in current year (4) Payroll impact of housed workers (5) $ $ 1. See Information Sources paragraph # Square feet times cost per square foot summed 3. Use local worker/sf value here 4. See Information Sources paragraph #4; all the local department of economic development or chamber of commerce may be able to provide estimates for average salaries. 5. # of workers times mean salary To calculate the total value of these outlays on the local economy, the respective spending values should be multiplied by the appropriate total output, personal income and job multipliers from the BEA tables - see Information Sources paragraph #1 regarding multipliers. Different multipliers are available for each county in the US for new construction (commercial maybe distinguished from residential), architectural and engineering services or specialized design services (soft costs), management companies (operating outlays), facilities support services (operating outlays), services to buildings (operating outlays), retail trade, personal services, health and education services and restaurant and entertainment (employee spending impacts). 21

22 22
AN ECONOMIC, FISCAL AND CAPITAL ASSET IMPACT ANALYSIS OF THIRTEEN PROPOSED NEW DEVELOPMENTS ON THE TOWN OF DENTON, MARYLAND.
 AN ECONOMIC, FISCAL AND CAPITAL ASSET IMPACT ANALYSIS OF THIRTEEN PROPOSED NEW DEVELOPMENTS ON THE TOWN OF DENTON, MARYLAND Prepared for The Denton Town Council Denton, Maryland by Dean D. Bellas, Ph.D.
The Local Impact of Home Building in Douglas County, Nevada. Income, Jobs, and Taxes generated. Prepared by the Housing Policy Department
 The Local Impact of Home Building in Douglas County, Nevada Income, Jobs, and Taxes generated = Prepared by the Housing Policy Department May 2007 National Association of Home Builders 1201 15th Street,
THE IMPACT OF REAL ESTATE ON THE FLORIDA ECONOMY. --UPDATE FOR (Using Roll Year 2002 Property Appraiser Data)
") THE IMPACT OF REAL ESTATE ON THE FLORIDA ECONOMY --UPDATE FOR 2003-- (Using Roll Year 2002 Property Appraiser Data) Douglas White May 2003 Shimberg Center for Affordable Housing M. E. Rinker, Sr. School
THE IMPACT OF REAL ESTATE ON THE FLORIDA ECONOMY --UPDATE FOR 2003-- (Using Roll Year 2002 Property Appraiser Data) Douglas White May 2003 Shimberg Center for Affordable Housing M. E. Rinker, Sr. School
Economic Impacts of MLS Home Sales and Purchases In The province of Québec and The Greater Montréal Area
 Home Sales and Purchases In The province of Québec and The Greater Montréal Area Home Sales and Purchases In The Province of Québec and The Greater Montréal Area Prepared for: The Greater Montréal Real
Economic Impacts of MLS Home Sales and Purchases in Canada and the Provinces
 Economic Impacts of MLS Home Sales and Purchases in Canada and the Provinces 2006 2008 FINAL REPORT April 24, 2009 Economic Impacts of MLS Home Sales and Purchases in Canada and the Provinces 2006-2008
Economic Significance of the Property Industry to the. OTAGO Economy PREPARED FOR PROPERTY COUNCIL NEW ZEALAND BY URBAN ECONOMICS
 Economic Significance of the Property Industry to the OTAGO Economy PREPARED FOR PROPERTY COUNCIL NEW ZEALAND BY URBAN ECONOMICS 2016 ABOUT PROPERTY COUNCIL NEW ZEALAND Property Council New Zealand is
THE IMPACT OF REAL ESTATE ON THE FLORIDA ECONOMY --UPDATE FOR
 THE IMPACT OF REAL ESTATE ON THE FLORIDA ECONOMY --UPDATE FOR 2002-- Douglas White October 2002 Shimberg Center for Affordable Housing M. E. Rinker, Sr. School of Building Construction College of Design,
Economic Impact of Commercial Multi-Unit Residential Property Transactions in Toronto, Calgary and Vancouver,
 Economic Impact of Commercial Multi-Unit Residential Property Transactions in Toronto, Calgary and Vancouver, 2006-2008 SEPTEMBER 2009 Economic Impact of Commercial Multi-Unit Residential Property Transactions
Economic Significance of the Property Industry to the. WELLINGTON Economy PREPARED FOR PROPERTY COUNCIL NEW ZEALAND BY URBAN ECONOMICS
 Economic Significance of the Property Industry to the WELLINGTON Economy PREPARED FOR PROPERTY COUNCIL NEW ZEALAND BY URBAN ECONOMICS 2016 ABOUT PROPERTY COUNCIL NEW ZEALAND Property Council New Zealand
H12 Economic Impact Analysis: Hickory Creek
 H12 Economic Impact Analysis: Hickory Creek 2012 Executive Summary $5.3 million of local income generated from Dallas Habitat s construction efforts in Hickory Creek 117 new jobs generated in construction
Economic Impact Analysis: Cedar Creek Ranch Neighborhood
 2012 Economic Impact Analysis: Cedar Creek Ranch Neighborhood Dallas Area Habitat for Humanity Neighborhood Investment 9/1/2012 Executive Summary Income to local businesses was almost $1.1 million from
Chapter 37. The Appraiser's Cost Approach INTRODUCTION
 Chapter 37 The Appraiser's Cost Approach INTRODUCTION The cost approach for estimating current market value starts with the recognition that a parcel of real estate contains two components - the land and
HOUSING IMPACT FEE NEXUS STUDY
 HOUSING IMPACT FEE NEXUS STUDY SUBMITTED TO City of Salinas January 2016 Prepared by VERNAZZA WOLFE ASSOCIATES, INC. www.vernazzawolfe.com 2909 Shasta Road Tel: (510) 548-8229 Berkeley, California 94708
Chapter 35. The Appraiser's Sales Comparison Approach INTRODUCTION
 Chapter 35 The Appraiser's Sales Comparison Approach INTRODUCTION The most commonly used appraisal technique is the sales comparison approach. The fundamental concept underlying this approach is that market
.01 The objective of this Standard is to prescribe the accounting treatment for investment property and related disclosure requirements.
 COMPARISON OF GRAP 16 WITH IAS 40 GRAP 16 IAS 40 DIFFERENCES Objective.01 The objective of this Standard is to prescribe the accounting treatment for investment property and related disclosure requirements.
Economic and Fiscal Impact Analysis of Future Station Transit Oriented Development
 Florida Department of Transportation Central Florida Commuter Rail Transit Project Economic and Fiscal Impact Analysis of Future Station Transit Oriented Development Seminole County Summary Report Revised
City of Salinas Nexus Studies Overview and Summary February 2016
 City of Salinas Nexus Studies Overview and Summary February 2016 1) Introduction The City of Salinas is looking at ways to increase the supply of affordable housing in Salinas. The City already has a successful
Economic Impact Analysis Grand Oaks St. Johns County, Florida
 Economic Impact Analysis Grand Oaks St. Johns County, Florida December 2016 Prepared for Southeast Development Partners, LLC Ponte Vedra Beach, Florida By URBANOMICS, Inc Urban and Real Estate Economics
This article is relevant to the Diploma in International Financial Reporting and ACCA Qualification Papers F7 and P2
 REVENUE RECOGNITION This article is relevant to the Diploma in International Financial Reporting and ACCA Qualification Papers F7 and P2 For almost all entities other than financial institutions, revenue
RESOLUTION NO ( R)
") RESOLUTION NO. 2013-06- 088 ( R) A RESOLUTION OF THE CITY COUNCIL OF THE CITY OF McKINNEY, TEXAS, APPROVING THE LAND USE ASSUMPTIONS FOR THE 2012-2013 ROADWAY IMPACT FEE UPDATE WHEREAS, per Texas Local
RESOLUTION NO. 2013-06- 088 ( R) A RESOLUTION OF THE CITY COUNCIL OF THE CITY OF McKINNEY, TEXAS, APPROVING THE LAND USE ASSUMPTIONS FOR THE 2012-2013 ROADWAY IMPACT FEE UPDATE WHEREAS, per Texas Local
Virginia Real Estate
 Real Estate Economic Impact Analysis A special report from the and the George Mason University Center for Regional Analysis ABOUT THIS REPORT The real estate industry is recognized as a key contributor
Addressing the Impact of Housing for Virginia s Economy
 Addressing the Impact of Housing for Virginia s Economy A REPORT FOR VIRGINIA S HOUSING POLICY ADVISORY COUNCIL NOVEMBER 2017 Appendix Report 1: Economic Impacts of Virginia s Housing Industry Terry Clower
Mass Appraisal of Income-Producing Properties
 Chapter 10 Mass Appraisal of Income-Producing Properties Whether valuing income-producing property or residential property, you can use similar information and methods for collecting and analyzing data
BUSINESS COMBINATIONS: CLARIFYING THE DEFINITION OF A BUSINESS
 BUSINESS COMBINATIONS: CLARIFYING THE DEFINITION OF A BUSINESS Prepared by: Robert Dombrowski, Partner, National Professional Standards Group, RSM US LLP robert.dombrowski@rsmus.com, +1 847 413 6209 TABLE
International Financial Reporting Standards (IFRS)
") FACT SHEET February 2011 IAS 40 Investment Property (This fact sheet is based on the standard as at 1 January 2011.) Important note: This fact sheet is based on the requirements of the International Financial
FACT SHEET February 2011 IAS 40 Investment Property (This fact sheet is based on the standard as at 1 January 2011.) Important note: This fact sheet is based on the requirements of the International Financial
APPENDIX A FACTORS INFLUENCING COUNTY FINANCES
 APPENDIX A FACTORS INFLUENCING COUNTY FINANCES This page left blank intentionally Appendix A Factors Influencing County Finances The finances of counties are affected by many different factors. Some of
Chapter 8. How much would you pay today for... The Income Approach to Appraisal
 How much would you pay today for... Chapter 8 One hundred dollars paid with certainty each year for five years, starting one year from now. Why would you pay less than $500 Valuation Using the Income Approach
TANGIBLE CAPITAL ASSETS
 Administrative Procedure 535 Background TANGIBLE CAPITAL ASSETS The Division will follow a prescribed procedure to record and manage the tangible capital assets (TCA) owned by the Division. The treatment
concepts and techniques
 concepts and techniques S a m p l e Timed Outline Topic Area DAY 1 Reference(s) Learning Objective The student will learn Teaching Method Time Segment (Minutes) Chapter 1: Introduction to Sales Comparison
APPENDIX A FACTORS INFLUENCING COUNTY FINANCES
 APPENDIX A FACTORS INFLUENCING COUNTY FINANCES This page left blank intentionally Appendix A Factors Influencing County Finances The finances of counties are affected by many different factors. Some of
Chapter 8. How much would you pay today for... The Income Approach to Appraisal
 How much would you pay today for... Chapter 8 One hundred dollars paid with certainty each year for five years, starting one year from now. Why would you pay less than $500 Valuation Using the Income Approach
Extending the Right to Buy
 Memorandum for the House of Commons Committee of Public Accounts Department for Communities and Local Government Extending the Right to Buy MARCH 2016 4 Key facts Extending the Right to Buy Key facts 1.8m
PETALUMA THEATRE DISTRICT PARKING GARAGE
 PETALUMA THEATRE DISTRICT PARKING GARAGE PETALUMA, CALIFORNIA Prepared for: Basin Street Properties Project Number 33-1608.00 135 Main Street, Suite 1030 San Francisco, CA 94105 Voice: 415.644.0630 Fax:
Intangibles CHAPTER CHAPTER OBJECTIVES. After careful study of this chapter, you will be able to:
 CHAPTER Intangibles CHAPTER OBJECTIVES After careful study of this chapter, you will be able to: 1. Explain the accounting alternatives for intangibles. 2. Record the amortization or impairment of intangibles.
International Financial Reporting Standards (IFRS)
") FACT SHEET September 2011 IAS 31 Interests in joint ventures (This fact sheet is based on the standard as at 1 January 2011.) Important note: This fact sheet is based on the requirements of the International
FACT SHEET September 2011 IAS 31 Interests in joint ventures (This fact sheet is based on the standard as at 1 January 2011.) Important note: This fact sheet is based on the requirements of the International
820 First Street, NE, Suite 510, Washington, DC Tel: Fax:
 820 First Street, NE, Suite 510, Washington, DC 20002 Tel: 202-408-1080 Fax: 202-408-1056 center@cbpp.org www.cbpp.org March 16, 2004 HUD S RELIANCE ON RENT TRENDS FOR HIGH-END APARTMENTS TO CRITICIZE
Estimating National Levels of Home Improvement and Repair Spending by Rental Property Owners
 Joint Center for Housing Studies Harvard University Estimating National Levels of Home Improvement and Repair Spending by Rental Property Owners Abbe Will October 2010 N10-2 2010 by Abbe Will. All rights
Office of the County Auditor. Broward County Property Appraiser Report on Transition Review Services
 Office of the County Auditor Broward County Property Appraiser Report on Transition Review Services January 14, 2005 Table of Contents BACKGROUND AND SCOPE...3 FINDINGS AND RECOMMENDATIONS...3 1. Financial
STATE OF OHIO FINANCIAL REPORTING APPROACH GASB 34 IMPLEMENTATION ISSUES TRANSPORTATION INFRASTRUCTURE
 TRANSPORTATION INFRASTRUCTURE GASB 34 Reporting Requirements (Paragraphs 19 through 26) Paragraph 19 includes infrastructure assets in the definition of capital assets. Infrastructure assets are defined
NOTICE OF PROPOSED CLASSIFICATION ACTIONS BY THE HUMAN RESOURCES DIRECTOR
 NOTICE OF PROPOSED CLASSIFICATION ACTIONS BY THE HUMAN RESOURCES DIRECTOR The following actions are being posted in accordance with Civil Service Rule 109. In the absence of a protest addressed to the
Agenda Item 11: Revenue and Non-Exchange Expenses
 Agenda Item 11: Revenue and Non-Exchange Expenses David Bean, Anthony Heffernan, and Amy Shreck IPSASB Meeting June 21-24, 2016 Toronto, Canada Page 1 Proprietary and Copyrighted Information Agenda Item
APPENDIX A FACTORS INFLUENCING COUNTY FINANCES
 APPENDIX A FACTORS INFLUENCING COUNTY FINANCES Appendix A Factors Influencing County Finances The finances of counties are affected by many different factors. Some of the variation results from decisions
AFFORDABLE WORKFORCE HOUSING REPORT OF THE WORKING GROUP Recommendations for our Region Approved February 22, 2006
 AFFORDABLE WORKFORCE HOUSING REPORT OF THE WORKING GROUP Recommendations for our Region Approved February 22, 2006 www.rrregion.org RAPPAHANNOCK RAPIDAN REGIONAL COMMISSION WORKFORCE HOUSING WORKING GROUP
Assessor s offices may observe rules or policy items that
 Understanding the Scope of Work Rule and Advisory Opinion 32 Kenneth L. Joyner, RES, AAS The statements made or opinions expressed by authors in Fair & Equitable do not necessarily represent a policy position
RATE STUDY IMPACT FEES PARKS
 RATE STUDY FOR IMPACT FEES FOR PARKS CITY OF KENMORE, WASHINGTON May 15, 2001 TABLE OF CONTENTS Executive Summary................................................... 1 1. Statutory Basis and Methodology
How to Set Permit Fees
 Michigan State University Extension Land Use Series How to Set Permit Fees Original version: April 4, 2001 Last revised: December 9, 2008 Keep it Simple The following might be used as an outline for a
METROPOLITAN COUNCIL S FORECASTS METHODOLOGY
 METROPOLITAN COUNCIL S FORECASTS METHODOLOGY FEBRUARY 28, 2014 Metropolitan Council s Forecasts Methodology Long-range forecasts at Metropolitan Council are updated at least once per decade. Population,
Section 1 - Current Metro Rent Details. Asking Rent by Age Asking Rent Distribution Asking Rent Growth Rate Distribution $788 $859 $860 $931
 Section 1 - Current Metro Rent Details Asking Rent by Age Asking Rent Distribution Asking Rent Growth Rate Distribution Year Built Rent Before 1970 $516 1970-1979 $484 1980-1989 $602 1990-1999 $702 After
Project Appraisal Guidelines for National Roads Unit Introduction
 Project Appraisal Guidelines for National Roads Unit 1.0 - Introduction October 2016 TRANSPORT INFRASTRUCTURE IRELAND (TII) PUBLICATIONS About TII Transport Infrastructure Ireland (TII) is responsible
OAKLAND AFFORDABLE HOUSING IMPACT FEE NEXUS ANALYSIS
 OAKLAND AFFORDABLE HOUSING IMPACT FEE NEXUS ANALYSIS Prepared for CITY OF OAKLAND This Report Prepared by VERNAZZA WOLFE ASSOCIATES, INC. and HAUSRATH ECONOMICS GROUP March 10, 2016 1212 BROADWAY, SUITE
Appendix A. Factors Affecting City Expenditures
 Appendix A Factors Affecting City Expenditures Factors Affecting City Expenditures The finances of cities are affected by many different factors. Some of the variation results from decisions made by city
How to Read a Real Estate Appraisal Report
 How to Read a Real Estate Appraisal Report Much of the private, corporate and public wealth of the world consists of real estate. The magnitude of this fundamental resource creates a need for informed
FINAL REPORT AN ANALYSIS OF SECONDARY ROAD MAINTENANCE PAYMENTS TO HENRICO AND ARLINGTON COUNTIES WITH THE DECEMBER 2001 UPDATE
 FINAL REPORT AN ANALYSIS OF SECONDARY ROAD MAINTENANCE PAYMENTS TO HENRICO AND ARLINGTON COUNTIES WITH THE DECEMBER 2001 UPDATE Robert A. Hanson, P.E. Senior Research Scientist Cherie A. Kyte Senior Research
Monroe County, Tennessee Property Tax Incentive Program Policies and Procedures
 Monroe County, Tennessee Property Tax Incentive Program Policies and Procedures Revised 1/2010 MONROE COUNTY, TENNESSEE PROPERTY TAX INCENTIVE PROGRAM POLICIES AND PROCEDURES Section I General Purpose
FASB Updates Business Definition
 On January 5, 2017, the Financial Accounting Standards Board (FASB) issued Accounting Standards Update (ASU) 2017-01, s (Topic 805): Clarifying the Definition of a Business. This definition is significant
The Economic & Fiscal Impacts of the Blanche Hotel Redevelopment Project
 The Economic & Fiscal Impacts of the Blanche Hotel Redevelopment Project December 12, 2014 Prepared by Fishkind & Associates, Inc. 12051 Corporate Boulevard Orlando, Florida 32817 407-382-3256 fishkind.com
Business Valuation More Art Than Science
 Business Valuation More Art Than Science One of the more difficult aspects of business planning is business valuation. It is also one of the more important aspects. While owners of closely held businesses
Business Combinations
 Business Combinations Indian Accounting Standard (Ind AS) 103 Business Combinations Contents Paragraphs OBJECTIVE 1 SCOPE 2 IDENTIFYING A BUSINESS COMBINATION 3 THE ACQUISITION METHOD 4 53 Identifying
December 13, delivery: To: Subject: File Reference No
 Email delivery: To: director@fasb.org Subject: File Reference No. Technical Director File Reference No. Financial Accounting Standards Board 401 Merritt 7 PO Box 5116 Norwalk, CT 06856-5116 Ladies and
The Financial Accounting Standards Board
 V A L U A T I O N How the New Leases Standard May Impact Business Valuations By Judith H. O Dell, CPA, CVA The Financial Accounting Standards Board issued the 485 page Leases Standard (Topic 842) in February,
Yorklyn Village Market Study and Economic Analysis: Executive Summary Yorklyn Village, Delaware
 Yorklyn Village Market Study and Economic Analysis: Executive Summary Yorklyn Village, Delaware Prepared For: Delaware Department of Natural Resources and Environmental Control (DNREC) and Auburn Village
The Remodeling Market International Builders Show January 21, Paul Emrath VP-Survey and Housing Policy Research
 The Remodeling Market International Builders Show January 21, 2010 Paul Emrath VP-Survey and Housing Policy Research Outline NAHB Remodeling Market Index (RMI) NAHB forecasts Legislative/regulatory developments
Volume Title: Well Worth Saving: How the New Deal Safeguarded Home Ownership
 This PDF is a selection from a published volume from the National Bureau of Economic Research Volume Title: Well Worth Saving: How the New Deal Safeguarded Home Ownership Volume Author/Editor: Price V.
Analysing lessee financial statements and Non-GAAP performance measures
 February 2019 IFRS Foundation The Essentials Issue No. 5 Analysing lessee financial statements and Non-GAAP performance measures Introduction Investors and company managers generally view free cash flow
A Demonstration Appraisal Report. Of a. Located at. Date of Appraisal. Prepared for. Prepared by
 A Demonstration Appraisal Report Of a Located at Date of Appraisal Prepared for Prepared by International Association of Assessing Officers Professional Designation Subcommittee 314 W. 10 th Street Kansas
APPENDIX A. Market Study Standards and Requirements
 APPENDIX A Market Study Standards and Requirements Section 42(m)(1)(A)(iii) of the IRS Code and Section IV(A)(2) of the 2018 Qualified Allocation Plan (QAP) require market studies for all low-income housing
REQUEST FOR QUALIFICATIONS (RFQ) FOR COMPREHENSIVE HOUSING ACTION PLAN
 FOR COMPREHENSIVE HOUSING ACTION PLAN") REQUEST FOR QUALIFICATIONS (RFQ) FOR COMPREHENSIVE HOUSING ACTION PLAN RFQ Issued: July 17 th, 2018 City Contact: KENT JARCIK PLANNING & ZONING DIRECTOR kentj@ci.williston.nd.us PO Box 1306 113 4 th ST.
REQUEST FOR QUALIFICATIONS (RFQ) FOR COMPREHENSIVE HOUSING ACTION PLAN RFQ Issued: July 17 th, 2018 City Contact: KENT JARCIK PLANNING & ZONING DIRECTOR kentj@ci.williston.nd.us PO Box 1306 113 4 th ST.
Appendix A. Factors Affecting City Current Expenditures
 Appendix A Factors Affecting City Current Expenditures Factors Affecting City Current Expenditures Every city faces a unique situation based upon its demographic composition, location, tax base, and many
will not unbalance the ratio of debt to equity.
 paragraph 2-12-3. c.) and prime commercial paper. All these restrictions are designed to assure that debt proceeds (including Title VII funds disbursed from escrow), equity contributions and operating
Chapter 15 Leases 15-1
 Chapter 15 Leases 1. Why Leasing sometimes makes more sense 2. The accounting issues in recording a lease transaction 3. The types of contractual provisions in lease 4. The lease classification: capital
Technical Description of the Freddie Mac House Price Index
 Technical Description of the Freddie Mac House Price Index 1. Introduction Freddie Mac publishes the monthly index values of the Freddie Mac House Price Index (FMHPI SM ) each quarter. Index values are
Economic Impact Analysis. Prepared By: Lambert Advisory 2601 South Bayshore Drive Miami, Florida 33133
 WEST BRICKELL CENTRE Major Use Special Permit 290 SW 10 th Street, 245 SW 11 th Street,240-270 SW 10 th Street, 251-253 SW 11 th Street, 255 SW 11 th Street, and 267 SW 11 th Street Prepared By: Lambert
ALBERTA GRAZING LEASE 2005 IN-KIND COST SURVEY RESULTS
 ALBERTA GRAZING LEASE 2005 IN-KIND COST SURVEY RESULTS NOVEMBER 15, 2007 2007 Redstone Management Consulting Ltd. 1 INTRODUCTION ALBERTA GRAZING LEASE 2005 IN-KIND COST SURVEY RESULTS Redstone Management
Chapter 8. The Income Approach to Appraisal. Two Approaches to Income Valuation. How Does DCF Differ from Direct Cap? Rationale:
 The Income Approach to Appraisal Chapter 8 Valuation Using the Income Approach Rationale: Value of a property is the present value of its anticipated income. Often called income capitalization Capitalize:
Real Estate & REIT Modeling: Quiz Questions Module 1 Accounting, Overview & Key Metrics
 Real Estate & REIT Modeling: Quiz Questions Module 1 Accounting, Overview & Key Metrics 1. How are REITs different from normal companies? a. Unlike normal companies, REITs are not required to pay income
Selected Paper prepared for presentation at the Southern Agricultural Economics Association s Annual Meetings Mobile, Alabama, February 4-7, 2007
 DYNAMICS OF LAND-USE CHANGE IN NORTH ALABAMA: IMPLICATIONS OF NEW RESIDENTIAL DEVELOPMENT James O. Bukenya Department of Agribusiness, Alabama A&M University P.O. Box 1042 Normal, AL 35762 Telephone: 256-372-5729
How Did Foreclosures Affect Property Values in Georgia School Districts?
 Tulane Economics Working Paper Series How Did Foreclosures Affect Property Values in Georgia School Districts? James Alm Department of Economics Tulane University New Orleans, LA jalm@tulane.edu Robert
VALUATION REPORTING REVISED Introduction. 3.0 Definitions. 2.0 Scope INTERNATIONAL VALUATION STANDARDS 3
 4.4 INTERNATIONAL VALUATION STANDARDS 3 REVISED 2007 1.0 Introduction 1.1 The critical importance of a Valuation Report, the final step in the valuation process, lies in communicating the value conclusion
METROPOLITAN COUNCIL S FORECASTS METHODOLOGY JUNE 14, 2017
 METROPOLITAN COUNCIL S FORECASTS METHODOLOGY JUNE 14, 2017 Metropolitan Council s Forecasts Methodology Long-range forecasts at Metropolitan Council are updated at least once per decade. Population, households
Review of the Prices of Rents and Owner-occupied Houses in Japan
 Review of the Prices of Rents and Owner-occupied Houses in Japan Makoto Shimizu mshimizu@stat.go.jp Director, Price Statistics Office Statistical Survey Department Statistics Bureau, Japan Abstract The
Acquisition of investment properties asset purchase or business combination?
 Acquisition of investment properties asset purchase or business combination? Our IFRS Viewpoint series provides insights from our global IFRS team on applying IFRSs in challenging situations. Each edition
Appraisers and Assessors of Real Estate
 http://www.bls.gov/oco/ocos300.htm Appraisers and Assessors of Real Estate * Nature of the Work * Training, Other Qualifications, and Advancement * Employment * Job Outlook * Projections Data * Earnings
The What, Why and How of Project Work Breakdown Structures (WBS)
") PM TUTORIAL The What, Why and How of Project Work Breakdown Structures (WBS) Purpose This document is a guide for understanding, preparing and using a Work Breakdown Structure (WBS) as a part of planning
PM TUTORIAL The What, Why and How of Project Work Breakdown Structures (WBS) Purpose This document is a guide for understanding, preparing and using a Work Breakdown Structure (WBS) as a part of planning
Re: Exposure Draft, Revenue from Contracts with Customers IASB Reference ED 2011/6
 March 27, 2012 International Accounting Standards Board 30 Cannon Street, 1st Floor London EC4M 6XH United Kingdom Dear Sirs: Re: Exposure Draft, Revenue from Contracts with Customers IASB Reference ED
Impact Fee Nexus & Economic Feasibility Study
 Impact Fee Nexus & Economic Feasibility Study Stakeholder Working Group November 12, 2015 Urban Economics Oakland Impact Fee Stakeholder Working Group November 12, 2015 INTRODUCTIONS 1 Agenda Introductions
Community Revitalization Efforts 2016 Thresholds and Scoring Criteria
 s 2016 Thresholds and Scoring Criteria Definitions: a deliberate, concerted, and locally approved plan or documented interconnected series of local approvals and events intended to improve and enhance
ALI-ABA Course of Study Modern Real Estate Transactions. July 25-28, 2007 San Francisco, California. Big Box Leasing - Questions and Answers
 1971 ALI-ABA Course of Study Modern Real Estate Transactions July 25-28, 2007 San Francisco, California Big Box Leasing - Questions and Answers By Richard R. Goldberg Ballard Spahr Andrews & Ingersoll,
Addressing the Impact of Housing for Virginia s Economy
 Addressing the Impact of Housing for Virginia s Economy A REPORT FOR VIRGINIA S HOUSING POLICY ADVISORY COUNCIL NOVEMBER 2017 Appendix Report 2: Housing the Commonwealth's Future Workforce 2014-2024 Jeannette
The cost of increasing social and affordable housing supply in New South Wales
 The cost of increasing social and affordable housing supply in New South Wales Prepared for Shelter NSW Date December 2014 Prepared by Emilio Ferrer 0412 2512 701 eferrer@sphere.com.au 1 Contents 1 Background
APPENDIX A FACTORS INFLUENCING CITY FINANCES
 APPENDIX A FACTORS INFLUENCING CITY FINANCES This page left blank intentionally Appendix A Factors Influencing City Finances The finances of cities are affected by many different factors. Some of the variation
CENTRAL GOVERNMENT ACCOUNTING STANDARDS
 CENTRAL GOVERNMENT ACCOUNTING STANDARDS NOVEMBER 2016 STANDARD 4 Requirements STANDARD 5 INTANGIBLE ASSETS INTRODUCTION... 75 I. CENTRAL GOVERNMENT S SPECIALISED ASSETS... 75 I.1. The collection of sovereign
Sales Ratio: Alternative Calculation Methods
 For Discussion: Summary of proposals to amend State Board of Equalization sales ratio calculations June 3, 2010 One of the primary purposes of the sales ratio study is to measure how well assessors track
ANNUAL LOCAL GOVERNMENT REVENUE ANALYSIS OF THE 13 th FLOOR INVESTMENTS RESIDENTIAL DEVELOPMENT IN TAMARAC, FLORIDA
 ANNUAL LOCAL GOVERNMENT REVENUE ANALYSIS OF THE 13 th FLOOR INVESTMENTS RESIDENTIAL DEVELOPMENT IN TAMARAC, FLORIDA Wednesday, January 9, 2019 Report Commission 13th Floor Investments commissioned this
Report on Inspection of Ferlita, Walsh, Gonzalez & Rodriguez, P.A. (Headquartered in Tampa, Florida) Public Company Accounting Oversight Board
 Public Company Accounting Oversight Board") 1666 K Street, N.W. Washington, DC 20006 Telephone: (202) 207-9100 Facsimile: (202) 862-8433 www.pcaobus.org Report on 2017 Gonzalez & Rodriguez, P.A. (Headquartered in Tampa, Florida) Issued by the Public
1666 K Street, N.W. Washington, DC 20006 Telephone: (202) 207-9100 Facsimile: (202) 862-8433 www.pcaobus.org Report on 2017 Gonzalez & Rodriguez, P.A. (Headquartered in Tampa, Florida) Issued by the Public
Economic Impact of New Affordable Residential Development and Occupancy Supported by Federal Tax Credits in North Carolina
 Economic Impact of New Affordable Residential Development and Occupancy Supported by Federal Tax Credits in North Carolina North Carolina Community Development Association Spring Training Conference Wilmington,
General Market Analysis and Highest & Best Use. Learning Objectives
 General Market Analysis and Highest & Best Use Learning Objectives Module & Title Module 1 Real Estate Markets and Analysis Module 2 Types and Levels of Market Analysis Module 3 The Six-Step Process and
City of. Hood River. Housing and. Income Metrics. Report. Prepared by: Decisions Decisions
 City of Prepared by: Decisions Decisions Hood River Housing and Income Metrics Project Manager: Allison Handler, Associate 503-249-0000 allison@decision2.com Report December 14, 2009 1001 SE Water Avenue,
Re-sales Analyses - Lansink and MPAC
 Appendix G Re-sales Analyses - Lansink and MPAC Introduction Lansink Appraisal and Consulting released case studies on the impact of proximity to industrial wind turbines (IWTs) on sale prices for properties
INVESTOR PRESENTATION MAY 2013
 INVESTOR PRESENTATION MAY 2013 Forward-Looking Statements This presentation includes forward-looking statements. These statements are subject to a number of risks, uncertainties and other factors that
2018 SCCAI RESIDENTIAL SYMPOSIUM USPAP OF THE FUTURE. Paula Konikoff, JD, MAI, AI GRS
 USPAP OF THE FUTURE Paula Konikoff, JD, MAI, AI GRS WHERE WE ARE NOW 2 Joint task force for Improvement of USPAP Appraisal Institute and Appraisal Foundation develop USPAP Optimization Concept 3 When unnecessary