JUNE 2017 MERLIN PROPERTIES COMPANY OVERVIEW
|
|
|
- Christiana Allison
- 5 years ago
- Views:
Transcription


1 JUNE 2017 MERLIN PROPERTIES COMPANY OVERVIEW
2 DISCLAIMER This presentation has been prepared by MERLÍN Properties, SOCIMI, S.A. (the Company) for informational use only. The information contained in this presentation does not purport to be comprehensive or to contain all the information that a prospective purchaser of securities of the Company may desire or require in deciding whether or not to purchase such securities, and has not been verified by the Company or any other person. The information contained in this document is subject to change without notice. Neither the Company nor any of affiliates, advisors or agents makes any representation or warranty, express or implied, as to the accuracy or completeness of any information contained or referred to in this document. Each of the Company and its employees, officers, directors, advisors, agents or affiliates expressly disclaims any and all liabilities whatsoever (in negligence or otherwise, whether direct or indirect, in contract, tort or otherwise) for any loss howsoever arising from any use of this presentation, the information contained or referred to therein, any errors therein or omissions therefrom or otherwise arising in connection with this presentation. Neither the Company, nor any of its affiliates, advisors or agents undertakes any obligation to provide the recipients with access to additional information or to update this document or to correct any inaccuracies in the information contained or referred to therein. Certain statements in this document regarding the market and competitive position data may be based on the internal analyses of the Company, which involve certain assumptions and estimates. These internal analyses may have not been verified by any independent sources and there can be no assurance that the assumptions or estimates are accurate. Additionally, certain information in this presentation may be based on management accounts and estimates of the Company and may have not been audited or reviewed by the Company s auditors, whereas the information on Metrovacesa S.A. and on certain competitors contained herein is based on publicly available information which has not been verified by the Company. Accordingly, recipients should not place undue reliance on this information. This information is provided to the recipients for informational purposes only and recipients must undertake their own investigation of the Company. The information providing herein is not to be relied upon in substitution for the recipient s own exercise of independent judgment with regard to the operations, financial condition and prospects of the Company. Neither this presentation nor any copy of it shall be taken, transmitted into, disclosed, diffused, send, published or distributed in the United States, Canada, Australia or Japan. The distribution of this presentation in other jurisdictions may also be restricted by law and persons into whose possession this presentation comes should inform themselves about and observe any such restrictions. In particular, any offer that might result from the transaction herein escribed will not be made, directly or indirectly, in the United States of America, or by use of mails, or by any means or instrumentality (including, without limitation, facsimile transmission, telephone and internet) of interstate or foreign commerce of, or any facilities of any national securities exchange of, the United States, Canada, Australia or Japan. The securities of the Company have not been and, should there be an offering, will not be registered under the U.S. Securities Act of 1933, as amended (the Securities Act) and, subject to certain exceptions, may not be offered or sold in the United States. The securities of the Company have not been and, should there be an offering, will not be registered under the applicable securities laws of any state or jurisdiction of Canada or Japan and, subject to certain exceptions, may not be offered or sold within Canada or Japan or to or for the benefit of any national, resident or citizen of Canada or Japan. THIS PRESENTATION DOES NOT CONSTITUTE OR FORM PART OF ANY OFFER FOR SALE OR SOLICITATION OF ANY OFFER TO BUY ANY SECURITIES IN THE UNITED STATES OR IN ANY OTHER JURISDICTION, NOR SHALL IT OR ANY PART OF IT FORM THE BASIS OF OR BE RELIED ON IN CONNECTION WITH ANY CONTRACT OR COMMITMENT TO SELL OR PURCHASE SHARES. ANY DECISION TO SELL OR PURCHASE SHARES IN ANY OFFERING SHOULD BE MADE SOLELY ON THE BASIS OF PUBLICLY AVAILABLE INFORMATION. This presentation may include forwardlooking statements. These forwardlooking statements involve known and unknown risks, uncertainties and other factors, which may cause such actual results, performance or achievements, or industry results, to be materially different from those expressed or implied by these forward-looking statements. These forward-looking statements are based on numerous assumptions regarding the present and future business strategies of the Company and the environment in which they expect to operate in the future. Forward-looking statements speak only as of the date of this presentation and the Company expressly disclaim any obligation or undertaking to release any update of, or revisions to, any forward-looking statements in this presentation, any change in their expectations or any change in events, conditions or circumstances on which these forward-looking statements are based. In reviewing this presentation, the recipient is agreeing to, and accepting, the foregoing restrictions and limitations. ı 2 ı


3 Contents Strategy Positioning Offices Shopping Centers Logistics Subsidiaries Capital Structure Appendix Governance Portfolio in detail
4 MERLIN today Overview LARGEST AND MOST DIVERSIFIED SPANISH REIT Fast facts 1,157 ASSETS (1) 10.1 bn GAV (2) m GRI (3) 3,159 k sqm GLA OWNED (4) 92.3% OCCUPANCY RATE (4) 5.1% GROSS YIELD 7.1 years WAULT (4) 16.1% 19.9% Portfolio breakdown 6.3% 21.9% 8.3% 22.4% 7.5% by GAV (2) 2.6% by GRI (3) 48.3% 46.8% Offices Shopping Centers Other (5) High Street retail Logistics Capital structure > 5.0 bn MARKET CAP 5.3 bn / EPRA NAV PER SHARE 45.6% LTV (6) 6.6 years AV. MATURITY (7) 2.2% AV. INTEREST RATE (7) BBB STANDARD & POOR S Baa2 MOODY S (1) 1,157 fully owned assets and 53 assets managed under equity method (2) GAV: appraised value as of December capex + acquisitions at cost - disposals. GAV of land under development included in its respective category (offices and logistics) (3) Annualized gross/net rents calculated as passing gross/net rent as of March 31, multiplied by 12. GRI and net rents include fully consolidated assets (4) Calculated for income producing consolidated assets (5) Includes 3 hotels, non-core yielding assets and non-core land (6) 1Q17 reported net financial debt divided by GAV (7) Proforma figures as at 31/03/2017 after May 2017 bond issuance and potential debt repayments ı 4 ı

5 STRATEGY
6 Strategy Strategy pillars A CLEARLY DEFINED STRATEGY INSPIRED BY THE BEST U.S. REIT PRACTICES Office Shopping Centers 40 % 20 % Breadth of prime space Madrid, Barcelona and Lisbon Core & Core Plus Spain & Portugal Urban or Dominant National scale Best governance practices Investment grade capital structure Logistics National footprint One-stop shop solution for 3PL Dividend policy: 80% of AFFO One of the most cost efficient REIT s High Street Retail 20 % 20 % High triple net cash flow Inflation multiplier ı 6 ı

7 POSITIONING


8 Positioning Fast facts #1 REIT IN OFFICE, HIGH STREET RETAIL AND LOGISTICS + #2 REIT IN SHOPPING CENTERS FULLY CONSOLIDATED (1) #1 Office Flexibility to offer multitenant or headquarter buildings Capacity to adapt to the needs of the tenant Existing 138 ASSETS 1,255 K SQM 4.6 BN GAV 218 M GRI WIP 2 ASSETS 54 K SQM 0.2 BN GAV 15 M GRI (3) MINORITY STAKES (2) #2 Shopping Centers Mainly urban footprint in high GDP/ capita areas in Spain Reference landlord for top retailers Critical mass with retail brands 17 ASSETS 455 K SQM 1.6 BN GAV 93 M GRI TRES AGUAS 50% 1 ASSET 67 K SQM 10 M GRI #1 Logistics One-stop-shop solution for logistics operators wishing to operate across Spain Big footprint to match the rapid development of 3PL activity Existing 37 ASSETS 870 K SQM 0.5 BN GAV 38 M GRI WIP 10 ASSETS 368 K SQM 0.1 BN GAV 17 M GRI (3) ZAL PORT 32% 42 ASSETS 416 K SQM 24 M GRI (4) #1 High Street retail Excellent conditions of BBVA lease agreement: triple net lease with 1.5x HICP annual uplift Optimization of retail space in office buildings 930 ASSETS 460 K SQM 2.2 BN GAV 103 M GRII (1) Not including other, land for future development (Adequa) and non-core land (2) Data for Minority Stakes is reported for 100% of the subsidiary (3) Total expected gross rents (4) Gross annual rent as of December 31st 2016, deducting ground lease expenses ı 8 ı
9 FY Positioning 16 Financial Results GAV summary Gross yield 4.8% 5.7% 4.7% 7.3% 5.1% 9,717 10,052 4,572 GAV (1) ( million) Offices Shopping centers 1,614 High Street Retail 2,203 Logistics 529 Other (2) 798 TOTAL Minority stakes 334 TOTAL with minority stakes /sqm AG 3,644 3,546 4, Source: Company (1) GAV: appraised value as of December capex + acquisitions at cost - disposals (2) Other includes logistics WIP, office WIP, hotels, land for development, non-core land and miscellaneous ı 9 ı
10 Positioning Occupancy and WAULT OCCUPANCY IMPROVEMENT POTENTIAL AFTER MVC Occupancy and WAULT per asset type (1) 88.6% 90.1% 100.0% % 92.3% MERLIN av. Occupancy MERLIN av. WAULT Offices Shopping centers High street retail Logistics Source: Company (1) WAULT by rents means the weighted average unexpired lease term, calculated as of 31 March 2017 ı 10 ı
11 Positioning MVC occupancy performance since acquisition SIGNIFICANT HIKE IN MVC OCCUPPANCY OFFICES SHOPPING CENTERS (1) 84.7% 86.9% 84.1% 86.2% 87.8% 77.9% At acquisition 31/12/ /03/2017 At acquisition (1) 31/12/ /03/2017 Source: Company (1) Excluding Opcion shopping center ı 11 ı

12 Positioning Maturity profile BALANCED MATURITY PROFILE Combined lease maturity profile (%GRI) (1) % 5.0% 1.2% 0.2% 17% 0.1% % 3.4% 1.4% 1.5% 11% 0.4% % 2.7% 1.2% 0.1% 0.6% 13% % 2.1% 1.2% 0.6% 9% > % 15.3% 8.5% 8.7% 1.2% 50% Office Shopping Centers Logistics High Street retail Other (1) Maturity profile as from 31/12/2016 ı 12 ı

13 Positioning Tenant base DIVERSIFIED SOUND TENANT BASE Top-20 tenants 19.4 % GRI 26.5 % GRI 20 % GRI Triple net cash flow Compulsory term until 2039 Annual uplift of 1.5x HICP Deflation protected ı 13 ı
14 Positioning Trading update Q GOOD PERFORMANCE AND PROSPECTS ACROSS THE BOARD Rent LfL YoY (1) Release spread (2) sqm contracted #contracts Occupancy QoQ (bps) Office +2.8% +3.6% 178, Shopping Centres +4.9% +9.7% 30, High street retail +0.9% n.m Logistics +3.7% +8.0% 67, Other +5.7% n.m TOTAL +2.6% +102 (1) EPRA standard porfolio in operation for the 1Q16 and for the 1Q17 (2) Change in rent in renewals and renegotiations that have taken place in 1Q17 (all portfolio) ı 14 ı
15 Positioning Dividend distribution evolution DPS GUIDANCE REPRESENTS +10% GROWTH YOY 2017 VS 2016 Calculated on the basis of 80% of AFFO Payment in two instalments All cash Minimun guidance 0.40 FY 2017 distribution management guidance MINIMUM 0.44 (2) m m 0.04 Ahead of guidance ( 20m) m , E per share Interim Final/complementary (1) Source: Company (1) Following approval by AGM of FY accounts (2) Guidance given reflects the hotels disposal ( 0.07 per share FFO) and maintenance capex ( 0.03 per share) ı 15 ı
16 OFFICES
17 Offices Overview PRIME SPACES IN BOTH CBD AND NBA OFFERING A WIDE VARIETY OF SOLUTIONS TO CLIENTS Fast facts Reversion in MVC assets # ASSETS GLA (sqm) 1,255 k 54 k GAV ( M) GRI ( M) (1) Existing 218 GROSS YIELD 4.8% OCCUPANCY 89% WIP 4, K MAD (76%) 249K BCN (19%) 48 K LISBON (4%) Breakdown By geography By location By product By GAV (2) By GAV (2) By GAV Madrid 80% Barcelona 16% Lisbon 3% Other Spain 1% Top 10 tenants NBA 54% Prime + CBD 35% Periphery 11% Multitenant 63% Single tenant 37% 35% GRI Value drivers Breadth of prime space in Madrid, Barcelona and Lisbon Reversion in MVC assets Capex program Selective development (1) Annualized gross rental income calculated as passing gross rents as of March 31, multiplied by 12 (2) Including acquisitions and disposals post 1Q17 ı 17 ı
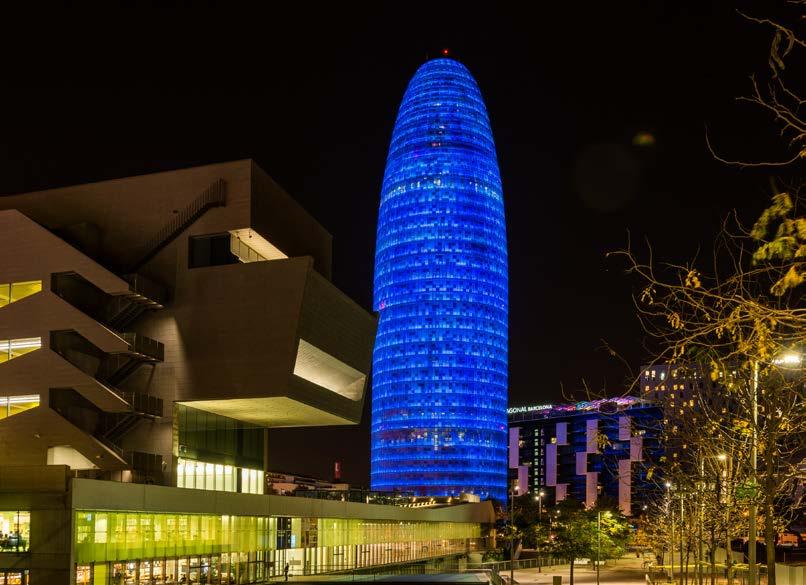
 Originally designed by Jean Nouvel, ground level plus 34 floors, plus an auditorium GLA 37,614 sqm ERV 10.3m ERV YoC 6.")

18 Offices WIP Torre Glòries One of the most iconic buildings in Barcelona Located in the prime area of Diagonal junction with Plaza de les Glòries Originally designed by Jean Nouvel, ground level plus 34 floors, plus an auditorium GLA 37,614 sqm ERV 10.3m ERV YoC 6.5% Acquisition 142m Investment 15m Delivery Mar-18 GLA 16,639 sqm Torre Chamartín LEED Platinum tower, located in the junction between A-1 and M-30 AAA specifications, led by arquitect Miguel Oriol ERV 4.3m ERV YoC 6.2% Acquisition 31.0m Investment 38.0m Delivery Mar-18 ı 18 ı
 Delivery Pre-let")


19 Offices Refurbishments Scope Budget % executed GLA (sqm) Delivery Pre-let Avda. Europa Full refurb 6.6m 85% 12,605 Sep % Puerta de las Naciones Full refurb 5.0m 80% 10,619 Dec % Eucalipto 33 Lobby and common areas 3.4m 10% 7,185 Oct-17 Initial phase Balmes Full refurb 2.8m 0% 6,187 Jun % ı 19 ı

20 SHOPPING CENTERS
21 Shopping Centers Overview URBAN AND DOMINANT ASSETS OFFERING NATIONAL SCALE IN HIGH GDP/CAPITA AREAS Fast facts Reversion in MVC assets Fully Consol. # ASSETS 17 1 GLA (sqm) 455 k 67 k GAV ( M) 1,614 GROSS YIELD 5.7% Tres Aguas (1) GRI ( M) OCCUPANCY 90% ANNUAL FOOTFALL 100 m pax Breakdown By geography By type By size (2) Madrid 21% Galicia 19% Catalonia 17% Valencia 13% Top 10 tenants By GAV By GAV By GAV Andalucía 7% Murcia 4% Lisbon 1% Other Spain 18% Urban 63% Dominant 19% Secondary 18% Very large 19% Large 44% Medium 28% Small 9% 28% GRI Value drivers Dominant and urban Capex Program Integration with e-commerce (1) 100% of Tres Aguas of which MERLIN owns 50% (2) Annualized gross rental icome calculated as passing gross rent as of March 31, multiplied by 12 ı 21 ı


22 Shopping Centers Capex program Marineda A Coruña El Saler Valencia Thader Murcia Arturo Soria Madrid Creation of an sports area with an extension of 3,402 of GLA 88% of the GLA pre-let Capex: 1.6 m 3,100 sqm GLA extension, including 450 sqm of new terraces overlooking Ciudad de las Artes complex Full refurbishment of façade plus improvement of accesses General improvement of common areas Capex: 13.1 m Works to accommodate a themed park by Nickelodeon (Parques Reunidos) in a brand new concept General refurbishment of common areas Capex: 8.9 m Creation of iconic entrances and improvement of external façades Improvement of exterior terraces and foodcourt experience Refurbishment of interior design (floors, lights, signage) Capex: 2.8 m Larios Málaga Full refurbishment of complex, including floors, façades, parking, lighting and elevators Capex: 9.9 m ı 22 ı
23 LOGISTICS
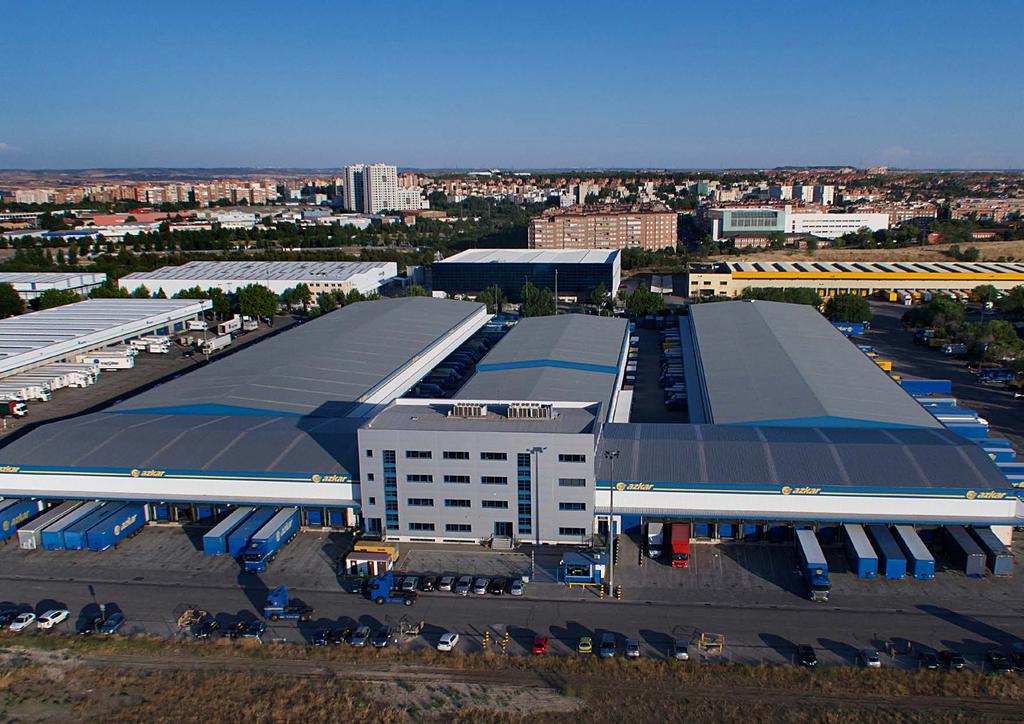
24 Logistics Overview NATIONAL FOOTPRINT IN MAIN LOGISTICS HUBS Fast facts Reversion in MVC assets Existing WIP ZAL Port (1) # ASSETS Breakdown By geography By reach By tenant type GLA (Sqm) 870 k 368 k 416 k GAV ( m) By GAV By GAV By GAV GRI ( m) (2) GROSS YIELD 7.3% OCCUPANCY 97% 96.7% Madrid 52% Barcelona 26% Sevilla 8% Basque Country 7% Other Spain 7% National 39% Regional 31% Ports 26% Production Related 4% 3PL multi-client 47% 3PL mono-client 34% End user 19% LAND FOR ADDITIONAL BUILDABILITY (Sqm) 1,376 k c. 400 k Top 10 tenants 54% GRI Value drivers National footprint to offer one stop shop solutions Location and access in main logistics hubs Turn-key and development program (1) Figures reported for 100% of ZAL Port (2) Annualized gross rental icome calculated as passing gross rent as of March 31, multiplied by 12 ı 24 ı
25 Logistics WIP HIGH RETURNS ACHIEVED IN A PROGRAM THAT WILL INCREASE FOOTPRINT BY 70% GLA COSTS FUNDING RENT Logistics WIP Projects # Total (sqm) Pre-let (sqm) % pre-let Land ( m) Building ( m) Total ( m) Already invested ( m) 2017 ( m) 2018 ( m) ERV ( m) ERV Yield Cabanillas (Nave E) 1 49, % Meco II 1 59, % Pinto I 1 11,098 11, % % Pinto II 1 59,017 59, % % Sevilla ZAL I 1 5,400 5, % % Azuqueca II 1 98, % Gavilanes 2 39, % San Fernando I 1 11, % San Fernando II 1 34, % Total Logistic WIP Projects ,161 75, % % +17 m of additional annual rents 9.1% Yield on cost +368 k sqm of additional footprint 21% pre-let ı 25 ı
 11,488 WIP Name GLA (sqm) 4 Madrid")
26 Logistics Location and access in main hubs (Madrid) Stock Name GLA (sqm) 1 Madrid - Coslada 28,490 2 Madrid - Coslada Complex 36,234 3 Madrid - Meco I 35, Guadalajara - Azuqueca I Guadalajara - Alovera Guadalajara - Cabanillas I Guadalajara - Cabanillas II 27,995 38,763 70, , Madrid - Getafe 16, Madrid - Getafe (Los Olivos) 11,488 WIP Name GLA (sqm) 4 Madrid - Meco II 59, Guadalajara - Azuqueca II Guadalajara - Cabanillas II Madrid - Getafe (Gavilanes) 98,000 49,790 39, Madrid - Pinto 70, San Fernando II 34, San Fernando I 11,165 ı 26 ı

27 Logistics Location and access in main hubs (Barcelona) Stock Name GLA (sqm) 1 Barcelona - ZAL Port 415,907 2 Barcelona - PLZF 131,003 3 Barcelona - Lliça del Vall 14,911 4 Barcelona - Sant Esteve 16,812 5 Barcelona - Granada Penedés 16,758 6 Barcelona - Castellbisbal 21,508 ı 27 ı

28 SUBSIDIARIES
 and Madrid representing the largest location by")
 56.3 Gross Yield 3.2% GAV ( m) 1,738.3 Net debt ( m) 361.5 NAV ( m) 1,376.8 Ownership Other 16.2% 44.1% 33.")
29 Subsidiaries Testa Residencial CREATING THE NATIONAL LEADER PRIOR TO MONETIZATION Description Key Metrics National leader in the attractive rented residential market in Spain Mostly comprising free housing (69%) and Madrid representing the largest location by units (46%) Managed by personnel assigned from Testa Residencial and Gesfontesta under MERLIN s supervision # Units 7,992 Free 5,940 Protected 2,052 GRI ( m) 56.3 Gross Yield 3.2% GAV ( m) 1,738.3 Net debt ( m) NAV ( m) 1,376.8 Ownership Other 16.2% 44.1% 33.7% 3.9% 2.1% ı 29 ı

 24 m 24 m Occupancy (%) 96.7% 95.")
30 Subsidiaries CILSA Description Key Metrics ZAL Port manages the logistics area of the Port of Barcelona. Conveniently located in Barcelona s primest logistics area, enjoys direct access to railway and port services and only 4 km away from El Prat airport. ZAL Port is divided into 2 main logistics areas (ZAL Prat and ZAL Barcelona) which together comprise over 416k sqm of built warehouses, 400k sqm of land for potential development and more than 400k sqm of leasable land. 31/12/ /12/2015 GRI (post canon) 24 m 24 m Occupancy (%) 96.7% 95.6% PLZF Top tenants Ownership ZAL BCN 32.0% 63.0% 5.0% El Prat Airport ZAL Prat Port of Barcelona ı 30 ı

31 CAPITAL STRUCTURE
32 Capital Structure Debt schedule and metrics 1Q 2017 AVERAGE MATURITY INCREASES TO 6.6 YEARS AND COST REDUCES TO 2.2% 1,160 Secured loans Unsecured loans Unsecured bonds , Q-4Q >2026 BBB Baa2 Net debt LTV Average interest rate (spot) Average maturity Unsecured debt/total debt Policy <50% >50% 31/03/17 Proforma (1) 4,575.1 m 45.6% 2.2% 6.6 years 76.1% 31/03/17 4,570.1 m 45.6% 2.3% 6.0 years 75.6% 31/12/16 4,471.1 m 45.5% 2.3% 6.2 years 75.6% Fixed rate debt >60% 99.2% 88.7% 88.7% Source: Company Note: Debt schedule includes reported debt as at 31/03/2017 less unsecured debt repayment ( 200m in April 2017) (1) Debt proforma includes debt at 31/03/2017, less unsecured debt repayment ( 200m), plus bond issuance ( 600m in May 2017) and proforma debt repayments ı 32 ı
33 APPENDIX

34 GOVERNANCE
35 Governance BoD composition BoD / Audit &Control / Remuneration & Nomination BOARD REDUCED TO 13 MEMBERS: 8 INDEPENDENT / 3 PROPIETARY / 2 EXECUTIVE Mr. Javier García-Carranza Non-Executive Chairman Mrs. Francisca Ortega Propietary Director Mr. José Ferrís Propietary Director Mr. Ismael Clemente CEO & Executive Vice-Chairman Mr. Miguel Ollero Executive Director Mrs. Pilar Cavero Independent Director Mr. Juan María Aguirre Independent Director Mrs. María Luisa Jordá Independent Director Chairman A&C Committee Mrs. Ana García Fau Independent Director Next year target: 11 members Mr. John Gómez Hall Independent Director Mr. Donald Johnston Independent Director Chairman A&R Committee Mr. Alfredo Fernández Independent Director Mr. Fernando Ortiz Independent Director Mrs. Mónica Martín de Vidales Secretary Mr. Ildefonso Polo del Mármol Vice-Secretary Appointments and Remuneration Committee Audit and Control Committee Independent Directors ı 35 ı
36 Governance Remuneration policy New Plan INVESTOR ALIGNED, LONG - TERM ORIENTATION AND INCORPORATION OF BEST PRACTICES Overheads reduction as from 2018 onwards OVERHEADS - HIGHER OF: onwards GRI 6% 5.75% 5.5% NAV 0.6% 0.575% 0.55% TOTAL OVERHEADS - RUNNING COSTS = BONUS POOL (1) Long - term incentive plan ( LTIP ) long-term oriented 3 years performance period LTIP linked to Shareprice (1/3) EPRA NAV (2/3) LTIP Caps, both globally and individually for Executive Directors Other best practices provisions Clawback + malus Non - compete Severance regime: 2x (fixed + STIP) Policy to own MERLIN shares: 3x fixed salary (1) Ultimate authority over the size and distribution of the STIP is the Nominations and Remunerations Committee and BoD ı 36 ı
37 Governance Remuneration policy LTIP LONGER-TERM ORIENTATION (3 YEARS) AND GLOBAL + EXECUTIVE DIRECTORS CAPS Pillars Plan for period only 3-year measurement period Metrics: 1/3 based on Shareprice TSR + 2/3 based on EPRA NAV TSR Hurdles on both Metrics Caps 1 ST HURDLE 2 ND HURDLE 31/12/16 31/12/19 TSR Rate 24% 31/12/16 31/12/19 TSR Rate 36% Absolute global Caps (for 3 year period): On Shareprice TSR: 37.5m On EPRA NAV TSR: 75.0m TOTAL: 112.5m Executive Directors Cap: 625% of fixed salary INCENTIVE (6 million shares, 1.26% fully diluted) 6% of TSR 9% of TSR ( 1.9 bn of return to shareholders generated) Maximum number of shares for Executive Directors: 2 million TSR = (Share Price or EPRA NAV per share End of Period) minus (Share Price or EPRA NAV per share Beginning of Period) plus (dividends per share in the period) TSR Rate = TSR divided by Share Price or EPRA NAV per share Beginning of Period ı 37 ı
38 Governance Remuneration policy Potential maximum dilution GLOBAL CAP REPRESENTS 1.26% OF POTENTIAL MAXIMUM DILUTION IN 3 YEARS, WHICH EQUALS 0.42% ANNUALIZED DILUTION TOTAL POTENTIAL MAXIMUM ANNUAL DILUTION IS ONE OF THE LOWEST IN EUROPE 1.02% 0.97% 1.86% 1.14% 0.42% LTIP 0.42% LTIP 0.6% Overheads & Salaries 0.55% Overheads & Salaries MERLIN Today MERLIN 2020 Spanish peers average European peers average Source: Company ı 38 ı

39 PORTFOLIO IN DETAIL

40 Portfolio in detail Office - Madrid ı 40 ı


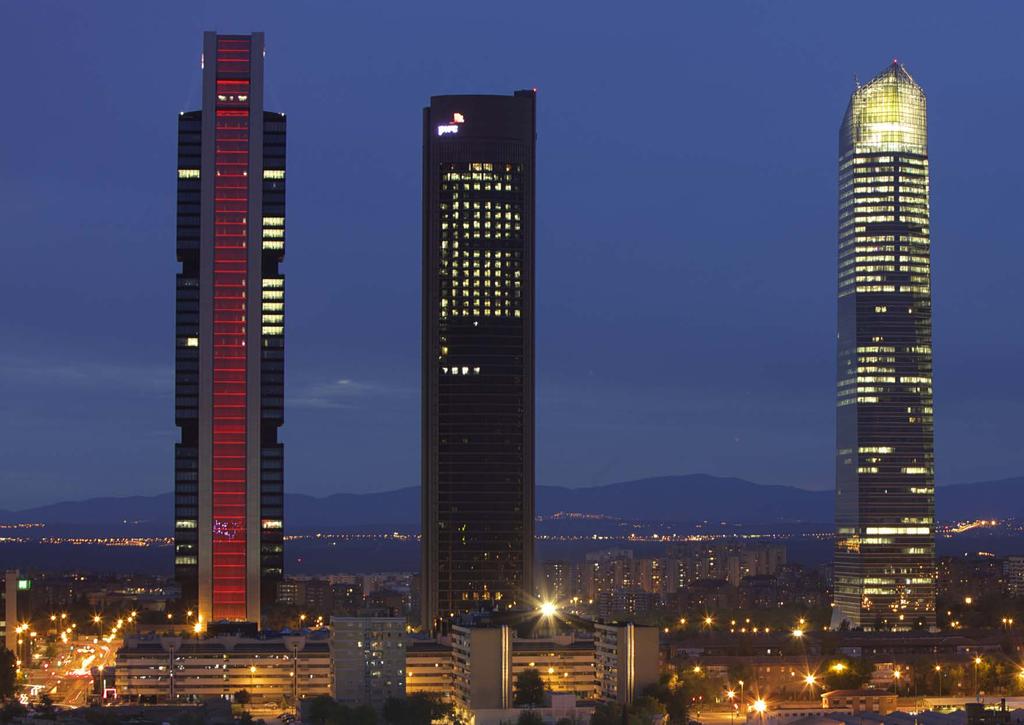
41 Portfolio in detail Office - Madrid prime and CBD Castellana, 280 Eucalipto, 25 Plaza Castilla Castellana, 278 M-30 Ventas bullring Cuzco Bernabeu Stadium Eucalipto, 33 Lima Nuevos Ministerios Azca Avda. America Castellana, 259 Castellana, 93 Ppe. Vergara, 187 Gregorio Marañón Maria de Molina Emilio Castelar Príncipe de Vergara Bravo Murillo Pza. Trias Bertran, 7 Castellana, José Abascal Serrano Paseo de la Castellana Colón Calle Alcalá Retiro P. Valdivia, 10 Puerta de Alcalá J.M. Churruca Cibeles Alfonso XI, 6 Bank of Spain Madrid Town Hall V. Rodríguez, 7 Parliament Alcalá, 40 Princesa, 3 Princesa, 5 Gran Vía ı 41 ı
 1.")


 5.")


42 Portfolio in detail Office - Madrid (I) 1. Torre Castellana Castellana Castellana 278 Location: CBD GLA: 21,390 sqm Location: CBD GLA: 16,918 sqm Location: CBD GLA: 14,468 sqm 4. Castellana 93 (Cadagua) 5. Sollube 6. Castellana Location: CBD GLA: 11,651 sqm Location: CBD GLA: 31,576 sqm Location: CBD GLA: 15,254 sqm 7. Príncipe de Vergara Alfonso XI 6 9. Pedro de Valdivia 10 Location: CBD GLA: 10,732 sqm Location: CBD GLA: 9,945 sqm Location: CBD GLA: 6,721 sqm 10. Churruca 11. Alcalá Princesa 3 Location: CBD GLA: 16,979 sqm Location: CBD GLA: 9,315 sqm Location: CBD GLA: 17,810 sqm ı 42 ı
 13.")


43 Portfolio in detail Office - Madrid (II) 13. Princesa Ventura Rodríguez Juan Esplandiú Location: CBD GLA: 5,788 sqm Location: CBD GLA: 10,071 sqm Location: CBD GLA: 28,008 sqm 16. Eucalipto Eucalipto Ulises 16 Location: CBD GLA: 7,185 sqm Location: CBD GLA: 7,368 sqm GLA: 9,575 sqm 19. Josefa Valcárcel Arturo Soria Manoteras 18 GLA: 19,893 sqm GLA: 6,615 sqm GLA: 7,515 sqm 22. Fuente de la Mora Santiago de Compostela Costa Brava 2-4 GLA: 4,482 sqm GLA: 13,130 sqm Location: Periphery GLA: 16,000 sqm ı 43 ı

")


44 Portfolio in detail Office - Madrid (III) 25. Isla Chamartin (WIP) 26. Aquamarina 27. Via Norte GLA: 16,639 sqm GLA: 10,856 sqm GLA: 37,224 sqm 28. María de Portugal 9-13 GLA: 17,191 sqm 29. María de Portugal 1,1 GLA: 5,749 sqm 30. María de Portugal 1,2 GLA: 5,749 sqm 31. María de Portugal 1,3 GLA: 5,641 sqm 32. Las Tablas GLA: 27,073 sqm 33. Padres Dominicos 7 GLA: 6,176 sqm 34. El Encinar GLA: 3,623 sqm 35. Miniparc Alcobendas I GLA: 9,195 sqm 36. Miniparc Alcobendas II GLA: 3,347 sqm ı 44 ı
")


45 Portfolio in detail Office - Madrid (IV) 37. Av. de Bruselas Av. de Bruselas Av. de Bruselas 33 GLA: 9,164 sqm GLA: 8,895 sqm GLA: 33,718 sqm 40. Av. de Europa 41. Francisco Delgado 9 (Vegacinco) 42. Alvento Location: Periphery GLA: 25,210 sqm Location: Periphery GLA: 9,896 sqm GLA: 32,928 sqm 43. Cristalia 44. Trianón 45. Ribera del Loira GLA: 11,707 sqm GLA: 18,400 sqm GLA: 39,150 sqm 46. Ribera del Loira Partenón Partenón GLA: 54,960 sqm GLA: 19,609 sqm GLA: 18,343 sqm ı 45 ı
 49. Av.")


 58.")
46 Portfolio in detail Office - Madrid (V) 49. Av. de Aragón Ática 1, 2, 3, 4, 5, Ática XIX Location: Periphery GLA: 3,890 sqm Location: Periphery GLA: 7,080 sqm, 5,644 sqm, 5,746 sqm, 4,936 sqm, 9,526 sqm, 3,790 sqm Location: Periphery GLA: 15,441 sqm 52. Cerro Gamos El Plantío 54. Conpenhague 4-8 Location: Periphery GLA: 35,498 sqm Location: Periphery GLA: 7,068 sqm Location: Periphery GLA: 5,972 sqm 55. Alvia 56. Euronova 57. Adequa Location: Periphery GLA: 23,567 sqm Location: Periphery GLA: 32,665 sqm GLA: 120,814 sqm (1) 58. Arturo Soria 128 GLA: 3,206 sqm ı 46 ı (1) GLA includes WIP projects in Adequa complex. If excluded, GLA would be 75,928 sqm

47 Portfolio in detail Office - Barcelona ı 47 ı


48 Portfolio in detail Office - Barcelona prime and CBD Ronda de Dalt B-20 Barrio de Gracia Sagrada Familia Pza. Glories Torre Glories Diagonal, 199 Diagonal Mar Balmes, Diagonal, 514 Diagonal, 458 Avenida Diagonal Vilanova Parc 22@ Parc Ciutadella Port Olimpic Pza F. Macia Paseo de Gracia Rambla de Cataluña Pza. Cataluña Catedral Barrio Gótico Barceloneta Pza. Mª Cristina Diagonal, 605 Gran Via de Las Cortes Catalanas Ronda Litoral B-10 Port Barcelona Pza. España Camp Nou Stadium Montjuïc Stadium ı 48 ı
 1.")


49 Portfolio in detail Office - Barcelona (I) 1. Diagonal Diagonal Balmes City: Barcelona Location: CBD GLA: 14,795 sqm City: Barcelona Location: CBD GLA: 9,664 sqm City: Barcelona Location: CBD GLA: 6,188 sqm 4. Diagonal Diagonal Torre Glories City: Barcelona Location: CBD GLA: 4,033 sqm City: Barcelona Location: CBD GLA: 5,934 sqm City: Barcelona Location: CBD GLA: 37,614 sqm 7. Poblenou 22@ Llull 8. Vilanova Gran Vía Cortes 385 City: Barcelona GLA: 31,337 sqm City: Barcelona Location: CBD GLA: 16,494 sqm City: Barcelona Location: CBD GLA: 5,190 sqm 10. Citypark Cornella 11. WTC WTC 8 City: Barcelona Location: Periphery GLA: 12,901 sqm City: Barcelona GLA: 14,461 sqm City: Barcelona GLA: 14,542 sqm ı 49 ı


50 Portfolio in detail Office - Barcelona (II) 13. Muntadas I 14. Muntadas II 15. Sant Cugat I City: Barcelona GLA: 24,380 sqm City: Barcelona GLA: 3,783 sqm City: Barcelona GLA: 15,379 sqm 16. Sant Cugat II 17. PLZFA 18. PLZFB City: Barcelona GLA: 10,008 sqm City: Barcelona GLA: 11,411 sqm City: Barcelona GLA: 10,652 sqm ı 50 ı

51 Portfolio in detail Office - Lisbon ı 51 ı


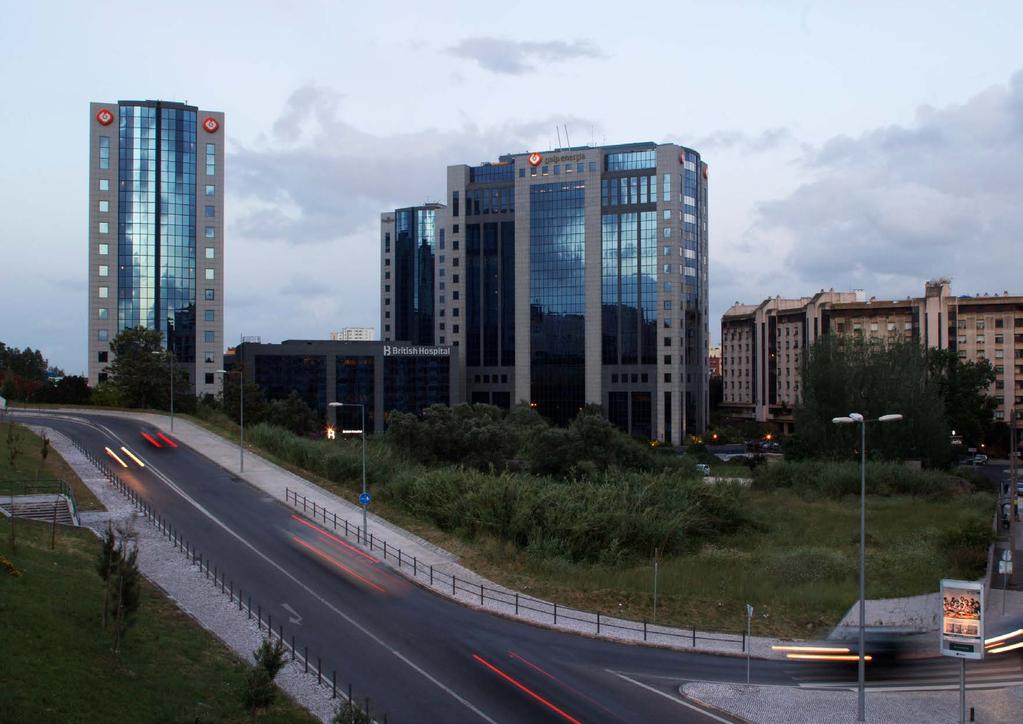
52 Portfolio in detail Office - Lisbon 1. Monumental 2. Torre Lisboa 3. Lisboa Expo City: Lisbon Location: CBD GLA: 16,892 sqm City: Lisbon GLA: 13,715 sqm City: Lisbon GLA: 6,740 sqm 4. Central Office City: Lisbon GLA: 10,310 sqm ı 52 ı

53 Portfolio in detail Shopping centers ı 53 ı
 1.")


 GLA: 10,007 sqm GLA:")


54 Portfolio in detail Shopping centers (I) 1. Marineda 2. Arturo Soria 3. Centro Oeste City: A Coruña GLA: 176,000 sqm MRL GLA: 100,187 sqm GLA: 6,959 sqm MRL GLA: 5,974 sqm GLA: 33,000 sqm MRL GLA: 10,876 sqm 4. Tres Aguas 5. Nassica 6. Opción GLA: 65,890 sqm (1) GLA: 10,007 sqm GLA: 37,165 sqm 7. Artea 8. Las Arenas 9. Vilamarina City: Bilbao GLA: 24,323 sqm City: Barcelona GLA: 31,918 sqm City: Barcelona GLA: 32,224 sqm 10. La Fira 11. Porto Pi 12. El Saler City: Reus GLA: 29,013 sqm City: Mallorca GLA: 58,779 sqm MRL GLA: 26,559 sqm City: Valencia GLA: 22,967 sqm (1) MERLIN owns 50% ı 54 ı
 13.")


55 Portfolio in detail Shopping centers (II) 13. Factory Bonaire + Medianas 14. La Vital 15. Thader City: Valencia GLA: 27,466 sqm MRL GLA: 21,504 sqm City: Gandía GLA: 20,853 sqm City: Murcia GLA: 48,646 sqm 16. Larios 17. Monumental City: Malaga GLA: 45,076 sqm City: Lisboa GLA: 5,495 sqm ı 55 ı
56 Portfolio in detail Logistics - Spain ı 56 ı

57 Portfolio in detail Logistics - Madrid ı 57 ı
 1.")


")
58 Portfolio in detail Logistics - Madrid (I) 1. Madrid Coslada 2. Madrid Coslada Complex 3. Madrid Meco I GLA: 28,490 sqm GLA: 36,234 sqm GLA: 35,285 sqm 4. Madrid Meco II 5. Guadalajara Azuqueca I 6. Guadalajara Azuqueca II City: Guadalajara Barcelona City: Guadalajara GLA: 59,891 sqm GLA: 27,995 sqm GLA: 98,000 sqm Azuqueca Plot Madrid 7. Guadalajara Alovera City: Guadalajara GLA: 38,763 sqm 8. Guadalajara Cabanillas I City: Guadalajara GLA: 70,134 sqm 9. Guadalajara Cabanillas II City: Guadalajara GLA: 202,103 sqm 10. Madrid-Getafe GLA: 16,242 sqm 11. Madrid-Getafe (Los Olivos) GLA: 11,488 sqm 12. Madrid Getafe (Gavilanes) GLA: 39,576 sqm ı 58 ı
 13.")


59 Portfolio in detail Logistics - Madrid (II) 13. Madrid Pinto 14. San Fernando - I 15. San Fernando - II GLA: 70,115 sqm GLA: 11,165 sqm GLA: 34,224 sqm ı 59 ı

60 Portfolio in detail Logistics - Barcelona ı 60 ı


61 Portfolio in detail Logistics - Barcelona 1. Barcelona - ZAL Port 2. Barcelona PLZF 3. Barcelona Lliça del Vall City: Barcelona GLA: 415,907 sqm City: Barcelona GLA: 131,003 sqm City: Barcelona GLA: 14,911 sqm 4. Barcelona Sant Esteve City: Barcelona GLA: 16,812 sqm 5. Barcelona Granada Penedés City: Barcelona GLA: 16,758 sqm 6. Barcelona Castellbisbal City: Barcelona GLA: 21,508 sqm ı 61 ı


62 Portfolio in detail Logistics - Rest of Spain 1. Zaragoza Plaza 2. Zaragoza Pedrola 3. Valencia Almussafes City: Zaragoza GLA: 20,764 sqm City: Zaragoza GLA: 21,579 sqm City: Valencia GLA: 26,612 sqm 4. Vitoria - Jundiz 5. Sevilla - ZAL Sevilla 6. Lisbon - Lisbon Land City: Vitoria GLA: 72,717 sqm City: Sevilla GLA: 109,724 sqm City: Lisbon GLA: 642,540 sqm (buildable) ı 62 ı

63 Portfolio in detail High Street Retail Branches Supermarkets Plaza de los Cubos Fnac Callao Torre Madrid ı 63 ı
64 Paseo de la Castellana, Madrid
COMPANY OVERVIEW NOVEMBER 2018
 COMPANY OVERVIEW NOVEMBER 2018 DISCLAIMER This presentation has been prepared by MERLÍN Properties, SOCIMI, S.A. (the Company) for informational use only. The information contained in this presentation
FY17 RESULTS per share (+14% YoY) Dividends of the period 21.6% (+18.0% YoY) EPRA NAV per share increase m Assets revaluation (1)
 Dividends of the period 21.6% (+18.0% YoY) EPRA NAV per share increase m Assets revaluation (1)") FY17 RESULTS Trading Update AT A GLANCE In 2017 MERLIN Properties achieved excellent results in cash flow generation and portfolio value pushing shareholder return to a very high level TOTAL SHAREHOLDER
FY17 RESULTS Trading Update AT A GLANCE In 2017 MERLIN Properties achieved excellent results in cash flow generation and portfolio value pushing shareholder return to a very high level TOTAL SHAREHOLDER
3M17 RESULTS. +4.6% FFO per share YoY % NAV per share YoY. +2.6% Rents like-for-like (3) YoY. +3.6% Office release spread
 YoY. +3.6% Office release spread") 3M17 RESULTS Trading Update CONSOLIDATED PERFORMANCE +4.6% FFO per share YoY +14.1% NAV per share YoY Excellent set of results showing value creation across all metrics FFO per share of 0.16 (+4.6% YoY)
3M17 RESULTS Trading Update CONSOLIDATED PERFORMANCE +4.6% FFO per share YoY +14.1% NAV per share YoY Excellent set of results showing value creation across all metrics FFO per share of 0.16 (+4.6% YoY)
6M17 RESULTS. +5.7% FFO per share YoY % EPS YoY % EPRA NAV YoY +2.6% +3.4% +5.5% +16.3% All bps Occupancy vs 31/12/16
 6M17 RESULTS Trading Update CONSOLIDATED PERFORMANCE +5.7% FFO per share YoY +37.2% EPS YoY +12.2% EPRA NAV YoY Excellent set of results showing robust generation of cash flow FFO per share of 0.32 (+5.7%
9M17 RESULTS. +4.1% FFO per share YoY % EPS YoY % NAV YoY. +2.8% Rents like-for-like (3) YoY. +3.3% +4.1% +13.5% All
 YoY. +3.3% +4.1% +13.5% All") 9M17 RESULTS Trading Update CONSOLIDATED PERFORMANCE +4.1% FFO per share YoY +28.2% EPS YoY +12.3% NAV YoY Value created to shareholders across all metrics FFO per share of 0.47 (+4.1% YoY) and NAV per
9M17 RESULTS Trading Update CONSOLIDATED PERFORMANCE +4.1% FFO per share YoY +28.2% EPS YoY +12.3% NAV YoY Value created to shareholders across all metrics FFO per share of 0.47 (+4.1% YoY) and NAV per
NOVEMBER 2016 MERLIN PROPERTIES COMPANY OVERVIEW
 NOVEMBER 2016 MERLIN PROPERTIES COMPANY OVERVIEW DISCLAIMER This presentation has been prepared by MERLÍN Properties, SOCIMI, S.A. (the Company) for informational use only. The information contained in
MERLIN INTEGRATES METROVACESA
 INTEGRATES METROVACESA 21 JUNE 2016 Larger, Broader, Stronger Disclaimer This presentation has been prepared by MERLÍN Properties, SOCIMI, S.A. (the Company) for informational use only. The information
INTERIM FINANCIAL STATEMENTS. for the period ended on March,
 INTERIM FINANCIAL STATEMENTS for the period ended on March, 31 2015 INDEX 1. Key aspects 5 2. Consolidated profit & loss account 9 3. Consolidated balance sheet 11 4. EPRA metrics 14 5. Significant events
Colonial Investor Day PERFORMANCE Mr. Carlos Krohmer Chief Corporate Development Officer. Madrid 17/10/18
 Colonial Investor Day PERFORMANCE Mr. Carlos Krohmer Chief Corporate Development Officer Madrid 17/10/18 Disclaimer By accepting this presentation and/or by attending this presentation, you will be taken
METROVACESA Property Business
 METROVACESA Property Business Madrid, 25 th June 2014 Jésus Vicente Executive Manager Portfolio & Subsidiaries Metrovacesa Property Business Main figures GAV Dec - 12: 3,164 m (44% total Group) Land &
Colonial Investor Day ACCELERATING URBAN TRANSFORMATION Mr. Juan Manuel Ortega Colonial Chief Investment Officer. Madrid 17/10/18
 Colonial Investor Day ACCELERATING URBAN TRANSFORMATION Mr. Juan Manuel Ortega Colonial Chief Investment Officer Madrid 17/10/18 Disclaimer By accepting this presentation and/or by attending this presentation,
General Shareholders Meeting 28 th June 2018
 General Shareholders Meeting 28 th June 2018 1 1. Business Highlights More than 870m invested since 2013 in Spain Currently 12 Real Estate assets owned with an acquisition value of 763m 215,189 sq m of
INVESTOR PRESENTATION. September 2011
 INVESTOR PRESENTATION September 2011 Disclaimer This document does not constitute or form part of and should not be construed as, an offer to sell or issue or the solicitation of an offer to buy or acquire
General Shareholders Meeting 26th June 2017
 General Shareholders Meeting 26th June 2017 1 1. Business Highlights More than 760m invested since 2013 in Spain Currently 9 Real Estate assets owned with an acquisition value of 650m* 181,509 sq m of
January - September 2011 results
 January - September 2011 results 14 November 2011 Highlights 9M 2011 RESULTS Commercial Property business continues showing a recurrent income giving the company stability and solidity, representing 95%
9M 2018 Results. 13 th November 2018
 9M 2018 Results 13 th November 2018 AGENDA 01 02 03 04 9M 2018 Highlights 9M 2018 Financial Results Business Performance Closing Remarks 2 01 9M 2018 Highlights 3 Lar España maintains its path of strong
ATRIUM Q RESULTS ANALYST AND INVESTOR CALL. 18 May 2016
 ATRIUM Q1 2016 RESULTS ANALYST AND INVESTOR CALL 18 May 2016 KEY EVENTS IN 2016 YTD OPERATIONAL PERFORMANCE Core Markets¹: NRI increased 1.2% to 36.3m; LFL NRI remained stable at 31.4m Russia continues
H RESULTS 10 AUGUST 2018 TLG IMMOBILIEN AG H RESULTS
 TLG IMMOBILIEN AG H1 2018 RESULTS DISCLAIMER This presentation includes statements, estimates, opinions and projections with respect to anticipated future performance of TLG IMMOBILIEN ("Forward-Looking
Q RESULTS 15 MAY 2018 TLG IMMOBILIEN AG Q RESULTS
 TLG IMMOBILIEN AG Q 208 RESULTS DISCLAIMER This presentation includes statements, estimates, opinions and projections with respect to anticipated future performance of TLG IMMOBILIEN ("Forward-Looking
Merlin Properties SOCIMI S.A. December Property Portfolio Valuation as at 31/12/ Instructions and Terms of Reference..
 Merlin Properties SOCIMI S.A. December 2015 Short Report Property Portfolio Valuation as at 31/12/2015 Contents 1. Instructions and Terms of Reference.. 2 2. Valuation Advice...6 3. General Assumptions
NATIONAL SECURITIES MARKET COMMISSION
 NATIONAL SECURITIES MARKET COMMISSION In compliance with the reporting requirements under Article 82 of Law 24/1988, of 28 July, on the Securities Market, Lar España Real Estate SOCIMI, S.A. (hereinafter,
05 Portfolio Portfolio location and description
 05 Portfolio 5.2. Portfolio location and description 58 4 15 12 1 7 2 14 10 19 17 16 25 24 22 21 3 18 26 20 13 8 23 6 9 5 11 Lar España Real Estate SOCIMI, S.A. 59 shopping centres 1 Megapark (Bilbao)
Opportunities and Hurdles for Investors in Light Industrial Properties
 Opportunities and Hurdles for Investors in Light Industrial Properties Experiences from the German Market Tom de Witte CFRO Geneba Properties NV Sommerconferenz Darmstadt, 7 July 2016 15.07.16 Contents
CITYCON CAPITAL MARKETS DAY 16 MAY 2017, ISO OMENA COO, JURN HOEKSEMA
 OPERATIONAL IMPROVEMENT CITYCON CAPITAL MARKETS DAY 16 MAY 2017, ISO OMENA COO, JURN HOEKSEMA LOCAL EMPOWERMENT AND ACCOUNTABILITY No country-based organisations Centralize: What is possible to support
This document does not constitute an offer to sell or an invitation or solicitation of an offer to subscribe for or purchase any securities, and
 This document has been prepared by Atrium (the Company ). This document is not to be reproduced nor distributed, in whole or in part, by any person other than the Company. The Company takes no responsibility
CPN Retail Growth Leasehold REIT
 CPN Retail Growth Leasehold REIT Investor Presentation Opportunity Day 28 February 2018 Importance Notice The information contained in this presentation is for information purposes only and does not constitute
MANAGING HIGH VALUE ADDED PROCESSES GLOBALLY. MID TERM FINANCIAL REPORT SEPTEMBER 30 th 2017
 1 MANAGING HIGH VALUE ADDED PROCESSES GLOBALLY MID TERM FINANCIAL REPORT SEPTEMBER 30 th 2017 DISCLAIMER 2 This document has been prepared by CIE Automotive, S.A. ("CIE Automotive"), and is for information
Macquarie Mexican REIT
 Macquarie Mexican REIT Fourth Quarter 2012 Results Presentation February 26, 2013 4Q12 Results Agenda 1. Overview Nick O Neil 2. Highlights & Portfolio Performance Jaime Lara 3. Financials Jaime Lara 2
MANAGING HIGH VALUE ADDED PROCESSES GLOBALLY. MID TERM FINANCIAL REPORT JUNE 30 th 2017
 1 MANAGING HIGH VALUE ADDED PROCESSES GLOBALLY MID TERM FINANCIAL REPORT JUNE 30 th 2017 DISCLAIMER 2 This document has been prepared by CIE Automotive, S.A. ("CIE Automotive"), and is for information
Corporate. Presentation March 2017
 Corporate www.larespana.com Presentation March 2017 Index 01 02 03 04 05 06 Company Description Portfolio Retail Strategy Non-Retail Strategy Financial Results Closing Remarks 3 01 Company Description
Corporate Presentation June
 Corporate Presentation June 2017 www.larespana.com Index 01 02 03 04 05 06 Company Description Portfolio Retail Strategy Non-Retail Strategy Financial Results Closing Remarks 3 01 Company Description The
Presentation for REITs Symposium 2016
 Presentation for REITs Symposium 2016 4 June 2016 Important Notice This presentation shall be read in conjunction with OUE Commercial REIT s Financial Results announcement for 1Q 2016 dated 10 May 2016.
Ying Li International Real Estate Limited 1Q2015 Financial Results 15 May 2015
 New Beijing Centre. Tongzhou Beijing Artist s Impression Ying Li International Real Estate Limited 1Q2015 Financial Results 15 May 2015 Ying Li International Financial Centre, Chonqging Disclaimer This
DREAM GLOBAL ANNOUNCES FOURTH QUARTER RESULTS, 24% ANNUAL NET ASSET VALUE GROWTH AND OVER 6% FOURTH QUARTER COMPARATIVE NOI GROWTH
 DREAM GLOBAL ANNOUNCES FOURTH QUARTER RESULTS, 24% ANNUAL NET ASSET VALUE GROWTH AND OVER 6% FOURTH QUARTER COMPARATIVE NOI GROWTH TORONTO, FEBRUARY 20, 2019 DREAM GLOBAL REIT (TSX:DRG.UN, FRA:DRG) (or
Institutional Presentation 2Q FY2017
 Institutional Presentation 2Q FY2017 IRSA Commercial Properties (IRCP) at a Glance The leading commercial real estate player in Argentina Largest owner and operator of premium malls and office buildings
16 offices in Spain & Portugal
 16 offices in Spain & Portugal Confidence, Innovation and Reliability Services comprehensive, tailored, flexible and rigorous service that allows clients access to innovative solutions to help them maximize
Institutional Presentation 3Q FY2017
 Institutional Presentation 3Q FY2017 IRSA Commercial Properties (IRCP) at a Glance The leading commercial real estate player in Argentina Largest owner and operator of premium malls and office buildings
EDGEFRONT REALTY CORP. MANAGEMENT S DISCUSSION AND ANALYSIS For the three-month period ended March 31, 2013
 EDGEFRONT REALTY CORP. MANAGEMENT S DISCUSSION AND ANALYSIS For the three-month period ended March 31, 2013 May 30, 2013 MANAGEMENT S DISCUSSION AND ANALYSIS The following management s discussion and analysis
O KEY GROUP TRADING UPDATE Q3 AND 9M November, 2018
 O KEY GROUP TRADING UPDATE Q3 AND 9M 2018 13 November, 2018 Disclaimer 2 By attending the meeting where this presentation is made, or by reading the presentation slides, you agree to be bound by the following
CENTURY PROPERTIES GROUP, INC. Analysts Presentation April 20, 2017
 CENTURY PROPERTIES GROUP, INC. Analysts Presentation April 20, 2017 IMPORTANT NOTICE AND DISCLAIMER These materials have been prepared by Century Properties Group, Inc. (together with its subsidiaries,
Front Yard Residential Corporation Announces Transformative Acquisition and Reports Second Quarter 2018 Results
 Front Yard Residential Corporation Announces Transformative Acquisition and Reports Second Quarter 2018 Results August 9, 2018 CHRISTIANSTED, U.S. Virgin Islands, Aug. 09, 2018 (GLOBE NEWSWIRE) -- Front
OUE Commercial REIT s Portfolio To Exceed S$3.0 Billion With Proposed Acquisition Of Indirect Interest In One Raffles Place
 PRESS RELEASE For Immediate Release OUE Commercial REIT s Portfolio To Exceed S$3.0 Billion With Proposed Acquisition Of Indirect Interest In One Raffles Place 10 June 2015 OUE Commercial REIT Management
HALF-YEARLY REPORT H1 2016
 HALF-YEARLY REPORT H1 2016 2 Contents 1 2 3 EXECUTIVE SUMMARY p. 4 CONSOLIDATED FINANCIAL STATEMENTS p. 30 EPRA INFORMATION p. 44 1.1 Highlights H1 2016 p. 6 1.2 Main Events p. 8 1.3 Portfolio at 30 June
AUDIOCAST PRESENTATION H1/2018
 AUDIOCAST PRESENTATION H1/2018 IRREPLACEABLE AND MULTI-FUNCTIONAL ASSETS IN GROWING CATCHMENTS 2 WE CONTINUE OUR TRANSFORMATION JOURNEY 2011 H1/2018 GOAL 2022 41 # OF SHOPPING # OF SHOPPING 78 30 CENTRES
仁恒置地集团 YANLORD LAND GROUP LIMITED. 4Q and FY 2017 Results Presentation
 仁恒置地集团 YANLORD LAND GROUP LIMITED 4Q and FY 2017 Results Presentation Yanlord 4Qand FY 2017Business Review Yanlord 4Q and FY 2017 Business Review Averagesellingprice( ASP )rosesignificantlyin4q2017tormb66,234/sqmfromrmb25,739/sqm
1Q Results May
 1/18 First Quarter Results January-March 2018 14 May 2018 1cierre del tercer trimestre del ejercicio 2017, el Grupo Colonial ha obtenido un resultado neto At the close of the first quarter of 2018, the
Epra Key Performance Measures. Best Practices-Recommendations
 90 09 Information Epra Key Performance Measures. Best Practices-Recommendations The Reporting & Accounting Committee of (European Public Real Estate Association 1 ) updated in December 2014 a Best Practices
仁恒置地集团 YANLORD LAND GROUP LIMITED. 2Q and 1H 2013 Results Presentation
 仁恒置地集团 YANLORD LAND GROUP LIMITED 2Q and 1H 2013 Results Presentation 1 Presentation Content I. Key Financial Highlights II. Business and Operation Overview III. Outlook 2 Yanlord 2Q 2013 Business Review
Index. Executive Summary p.4. EPRA Information. Share Price Performance. Consolidated Financial Statements. Events after the reporting period p.
 Index 1 3 4 Executive Summary p.4 EPRA Information p.58 Share Price Performance p.68 1.1 Highlights Q1 2018 p.6 1.2 Main Events p.8 1.3 Portfolio at 31 March 2018 p.12 1.4 Key Indicators p.22 1.5 Business
Y2017 Final Results. 16 March 2018
 Y2017 Final Results 16 March 2018 DISCLAIMER The information in this presentation is for personal, non-commercial reference and general information purposes only and should not be relied upon for investment
Analyst Presentation 12 February 2018
 Analyst Presentation 12 February 2018 Disclaimer This presentation is not an offer or an invitation to sell or exchange securities, or a recommendation to subscribe, buy or sell ANF Immobilier securities.
Acquisition of Metropolitan Plaza 8 Huangsha Road Guangzhou April 2017
 Acquisition of Metropolitan Plaza 8 Huangsha Road Guangzhou April 2017 Metropolitan Plaza 8 Huangsha Road Property Particulars Location 8 Huangsha Road, Liwan District, Guangzhou Opening 2012 No. of Floors
Soaring Demand Drives US Industrial Market to New Heights
 Soaring Demand Drives US Industrial Market to New Heights Capitas (DIFC) Limited I June Issue: 2017 THIS ISSUE COVERS: The Amazon Factor a seismic shift in the way people shop Industrial real estate hitting
Front Yard Residential Corporation Reports Third Quarter 2018 Results
 Front Yard Residential Corporation Reports Third Quarter 2018 Results November 7, 2018 CHRISTIANSTED, U.S. Virgin Islands, Nov. 07, 2018 (GLOBE NEWSWIRE) -- Front Yard Residential Corporation ( Front Yard
May 10, 2016 Halifax, Nova Scotia KILLAM APARTMENT REIT ANNOUNCES 20% INCREASE IN FFO PER UNIT IN Q1 2016
 May 10, 2016 Halifax, Nova Scotia KILLAM APARTMENT REIT ANNOUNCES 20% INCREASE IN FFO PER UNIT IN Q1 2016 Killam Apartment REIT (TSX: KMP.UN) ("Killam") is pleased to report its Q1 2016 results, including
ATRIUM COMPANY PRESENTATION
 ATRIUM COMPANY PRESENTATION THE LEADING OWNER & MANAGER OF CENTRAL EASTERN EUROPEAN SHOPPING CENTRES May 2017 / Based on 2016 full-year results ATRIUM LEADING OWNER & MANAGER OF CEE SHOPPING CENTRES Strong
FOR SALE OFFERED AT $3,780,000 INDUSTRIAL 940 S. VAIL AVE. MONTEBELLO, CA INTERNATIONAL REAL ESTATE SINCE 1908
 FOR SALE OFFERED AT $3,780,000 INDUSTRIAL 940 S. VAIL AVE. MONTEBELLO, CA SINCE 1908 O F F E R I N G M E M O R A N D U M OFFERING MEMORANDUM THIS IS AN OFFERING MEMORANDUM intended for buyers interested
INTRODUCTION AND HIGHLIGHTS FINANCIAL REVIEW BUSINESS REVIEW
 COVER 1 AGENDA INTRODUCTION AND HIGHLIGHTS FINANCIAL REVIEW BUSINESS REVIEW Highlights Financial Review Business Review http://www.crland.com.hk/ CR Land Results 2016 2 INTRODUCTION AND HIGHLIGHTS Highlights
FRASERS LOGISTICS & INDUSTRIAL TRUST PROPOSED DIVESTMENT OF 80 HARTLEY STREET IN THE STATE OF NEW SOUTH WALES, AUSTRALIA
 SGX-ST ANNOUNCEMENT For immediate release FRASERS LOGISTICS & INDUSTRIAL TRUST (a real estate investment trust constituted on 30 November 2015 under the laws of the Republic of Singapore) PROPOSED DIVESTMENT
Attached for release to the market is a Canberra Update booklet that was provided today as part of an Analyst and Investor tour of Canberra.
 23 June 2010 MIRVAC GROUP CANBERRA Attached for release to the market is a Canberra Update booklet that was provided today as part of an Analyst and Investor tour of Canberra. For further information please
All Ratings Affirmed In U.K. RMBS Transaction First Flexible No. 6 Following Review
 All Ratings Affirmed In U.K. RMBS Transaction First Flexible No. 6 Following Review Surveillance Credit Analyst: Simonetta Colombara, Milan (39) 02-72111-264; simonetta.colombara@standardandpoors.com OVERVIEW
PRESS RELEASE HISPANIA ACQUIRES 199 DWELLINGS IN MADRID FOR AN AMOUNT OF 29.9 MILLION EUROS
 PRESS RELEASE HISPANIA ACQUIRES 199 DWELLINGS IN MADRID FOR AN AMOUNT OF 29.9 MILLION EUROS With this transaction, Hispania has already invested 292.7 million, 54.9% of the net proceeds raised in the IPO
Portfolio. 6.1 Portfolio location and description. GAV 1.5 billion euros
 162 06 Portfolio 6.1 Portfolio location and description 6 14 15 14 1 14 11 2 4 13 14 14 17 5 21 18 19 28 20 16 25 27 22 23 8 14 26 12 24 14 9 3 10 7 GAV 1.5 billion euros Lar España Real Estate SOCIMI,
FOR IMMEDIATE RELEASE AUGUST 2, 2018 ARTIS REAL ESTATE INVESTMENT TRUST RELEASES SECOND QUARTER RESULTS
 FOR IMMEDIATE RELEASE AUGUST 2, 2018 ARTIS REAL ESTATE INVESTMENT TRUST RELEASES SECOND QUARTER RESULTS Today Artis Real Estate Investment Trust ( Artis or the "REIT") issued its financial results and
Interim Results for the six months ended 30 June 2012
 Interim Results for the six months ended 30 June 2012 Disclaimer This document has been prepared by ARA Asset Management (Prosperity) Limited, in its capacity as the manager ( REIT Manager ) of Prosperity
2018 Q3: TENANTS FIRST Putting the needs of our tenants at the centre of everything we do. 26 October 2018
 2018 Q3: TENANTS FIRST Putting the needs of our tenants at the centre of everything we do 26 October 2018 CONTENT 1 HIGHLIGHTS AND KEY FIGURES 2 NEW NAME 3 MARKET OVERVIEW 4 GENERAL COMPANY OVERVIEW 7
Acquisition of Wilkie Edge. Extraordinary General Meeting 23 November 2007
 Acquisition of Wilkie Edge Extraordinary General Meeting 23 November 2007 Important Notice THIS PRESENTATION IS AVAILABLE ONLY TO PERSONS WHO ARE NON-U.S. PERSONS, PERSONS WITH ADDRESSES OUTSIDE THE U.S.
White Paper on Adjusted Cashflow From Operations (ACFO) for IFRS. February, 2018
 for IFRS. February, 2018") White Paper on Adjusted Cashflow From Operations (ACFO) for IFRS February, 2018 Copyright REALPAC is the owner of all copyright in this publication. All rights reserved. No part of this document may be
White Paper on Adjusted Cashflow From Operations (ACFO) for IFRS February, 2018 Copyright REALPAC is the owner of all copyright in this publication. All rights reserved. No part of this document may be
Interim statement from the Board of Directors for the first quarter of 2015
 Regulated information - under embargo until 05/05/2015, 8 a.m. Antwerp, 5 May 2015 Interim statement from the Board of Directors Acquisition of a modern logistics site of approximately 52.000 m² in a prime
AUDIOCAST PRESENTATION Q1/2018
 19.4.2018 AUDIOCAST PRESENTATION Q1/2018 HIGHLIGHTS Q1/2018 EPRA EARNINGS PER SHARE EUR 0.041 -Divestments in 2017 and weaker currencies impacted EPRA EPS -Efficient cost management with administrative
Interim report presentation
 Interim report presentation 10 November, 2017 Anders Nissen, CEO Liia Nõu, CFO Forward-looking statements This presentation contains forwardlooking statements. Such statements are subject to risks and
NATIONAL SECURITIES MARKET COMMISSION
 NATIONAL SECURITIES MARKET COMMISSION In compliance with the reporting requirements under article 82 of Law 24/1988 of 28 July on the Securities Market, Lar España Real Estate SOCIMI, S.A. ( Lar España
Frasers Commercial Trust 3 rd Annual General Meeting. 17 January 2012
 Frasers Commercial Trust 3 rd Annual General Meeting 17 January 2012 Important notice Certain statements in this Presentation constitute forward-looking statements, including forward-looking financial
Great Elm Capital Group, Inc. An Introduction to the Fort Myers Transaction & GEC s Real Estate Strategy
 Great Elm Capital Group, Inc. An Introduction to the Fort Myers Transaction & GEC s Real Estate Strategy March 6, 2018 2018 Great Elm Capital Group, Inc. Disclaimer Statements in this presentation that
VOCENTO. English version
 PORTFOLIO VOCENTO English version Aguirre Newman has been appointed to exclusively lead the management and the heritage optimization of Vocento Group s Real Estate portfolio The portfolio is composed by
Leading the way, guided by knowledge.
 Property Management Leading the way, guided by knowledge. About Vistra Ranked among the top four corporate service providers globally, Vistra is a versatile group of professionals, providing a uniquely
Institutional presentation
 Institutional presentation IQ FY 2019 1 IRCP at a glance Business description Largest owner and operator of premium shopping malls and one of the largest owners of office buildings in Argentina ~429,000
NRE: Creating Value for Shareholders. March 13, 2018
 NRE: Creating Value for Shareholders March 13, 2018 Forward Looking Statement This presentation may contain certain forward-looking statements within the meaning of the Private Securities Litigation Reform
Suburb Profile Report. Paddington, 2021 NSW
 Suburb Profile Report Paddington, 2021 NSW October 2018 About Sound Property Group Sound Property Group is a property investment and education company specialised in sourcing strategic real estate opportunities,
About Vistra. Leading the way, guided by knowledge.
 Property Management About Vistra Ranked among the top four corporate service providers globally, Vistra is a versatile group of professionals, providing a uniquely broad range of services and solutions.
Institutional Presentation 2Q FY2017
 Institutional Presentation 2Q FY2017 1 IRSA Commercial Properties + Other diversified assets 94.61% 29.91% HOTELS LANDBANK INTERNATIONAL SHOPPING Malls OFFICE Buildings VP 49% 68.3% 49% 414,000 sqm of
ENTRY INTO LIMITED LIABILITY PARTNERSHIP TO ACQUIRE 3 TUAS SOUTH AVE 4
 (Constituted in the Republic of Singapore pursuant to a trust deed dated 31 March 2008 (as amended)) ENTRY INTO LIMITED LIABILITY PARTNERSHIP TO ACQUIRE 3 TUAS SOUTH AVE 4 1. INTRODUCTION Further to the
Definitions. CPI is a lease in which base rent is adjusted based on changes in a consumer price index.
 Annualized Rental Income is rental revenue under our leases on Operating Properties on a straight-line basis, which includes the effect of rent escalations and any tenant concessions, such as free rent,
AZRIELI GROUP. Conference Call Presentation. Financial Statements March 31, 2016
 AZRIELI GROUP Conference Call Presentation Financial Statements March 31, 2016 Disclaimer The information included in this presentation is a summary only and does not exhaust all of the information on
Institutional Presentation IIIQ FY 2018
 Institutional Presentation IIIQ FY 2018 www.irsa.com.ar IRSA: Leading Real Estate Company in Argentina Largest Real Estate Company in Argentina with opportunistic investments abroad 63.8% 86.34% HOTELS
FIRESTONE RENTON Triple Net Lease Opportunity
 Capital Markets Investment Properties FIRESTONE RENTON Triple Net Lease Opportunity 17808 108th Avenue SE Renton, Washington FirestoneRenton.com EXCLUSIVELY MARKETED BY Dino A. Christophilis Senior Vice
DEMIRE Deutsche Mittelstand Real Estate AG Conference Call 1H 2018 Results
 DEMIRE Deutsche Mittelstand Real Estate AG Conference Call 1H 2018 Results 16 Disclaimer This document is for informational purposes only. This document is not intended to form the basis of any investment
Interim report presentation
 Interim report presentation 13 July, 2017 Anders Nissen, CEO Liia Nõu, CFO Forward-looking statements This presentation contains forwardlooking statements. Such statements are subject to risks and uncertainties
Sponda Financial Results Q4 and FY February 2017
 Sponda Financial Results Q4 and FY 2016 3 February 2017 1. 2. 3. 4. Highlights for the Period Kari Inkinen Portfolio Development Pia Arrhenius Financials Niklas Nylander Business Environment and Business
2017 FULL YEAR 16 FEBRUARY 2018
 FULL YEAR RESULTS 16 FEBRUARY 2018 : Delivering in line with strategy 1.1 billion invested Asset acquisitions 610m Development capex 414m Land acquisitions 92m 525 million disposals Asset sales 432m Land
BAHRAIN DOMICILED REAL ESTATE INVESTMENT TRUSTS (B-REITs) MODULE
 MODULE") : BAHRAIN DOMICILED REAL ESTATE INVESTMENT TRUSTS (B-REITs) MODULE MODULE: BRT (Bahrain Domiciled Real Estate Investment Trusts) Table of Contents BRT-A BRT-B BRT-1 BRT-2 BRT-3 BRT-4 Date Last Changed
: BAHRAIN DOMICILED REAL ESTATE INVESTMENT TRUSTS (B-REITs) MODULE MODULE: BRT (Bahrain Domiciled Real Estate Investment Trusts) Table of Contents BRT-A BRT-B BRT-1 BRT-2 BRT-3 BRT-4 Date Last Changed
Institutional Presentation 3Q FY2017
 Institutional Presentation 3Q FY2017 1 IRSA Commercial Properties + Other diversified assets 94.61% 29.91% HOTELS LANDBANK INTERNATIONAL SHOPPING Malls OFFICE Buildings VP 28.7% 68.3% 49% ~417,000 sqm
Flexibility meets affordability
 Flexibility meets affordability NOW LEASING Hendra Distribution Centre Introducing Hendra Distribution Centre Hendra Distribution Centre is an 83,000sqm industrial estate, which includes 19 warehouses
Achieved record annual revenues of $110.0 million for 2018, representing an increase of 5.8%
 Clipper Realty Inc. Announces Fourth Quarter and Full-Year 2018 Results Reports Record Annual Revenues, Record Annual Income from Operations and Record Quarterly and Annual Adjusted Funds from Operations
NBG PANGAEA REIC April 2017
 NBG PANGAEA REIC April 2017 Disclaimer This presentation has been prepared by NBG PANGAEA Real Estate Investment Company (former MIG Real Estate REIC or the Company) solely for information purposes and
w w w. b a l m e s c o m
 www.balmes141.com A BEAUTIFULLY RENOVATED BUILDING SITUATED IN AN IDEAL LOCATION IN THE HEART OF EIXAMPLE IN THE CENTRE OF BARCELONA www.balmes141.com A GREAT INVESTMENT AND RENTAL OPPORTUNITY Situated
Macquarie Mexican REIT First Quarter 2014 Supplementary Financial Information
 Macquarie Mexican REIT First Quarter 2014 Supplementary Financial Information Consolidated Income Statement Mar 31, 2013 Mar 31, 2014 Lease Rental Income 383.0 511.7 Tenant Recoveries 22.8 16.9 Other Income
Proposed acquisitions of CGGVeritas Hub and Rutherford & Science Hub
 Proposed acquisitions of CGGVeritas Hub and Rutherford & Science Hub 24 January 2008 Content The Properties Rutherford & Science Hub CGGVeritas Hub Impact on A-REIT Pro forma Financial Effect Portfolio
2014 Operating and Financial Highlights
 FINANCIAL HIGHLIGHTS > 2014 Operating and Financial Highlights Operating Results Executed 203 leasing transactions representing approximately 2.8 million square feet, the highest gross leasing volume in
WALGREENS 1051 OAK STREET NORTH AURORA, IL Dan Stewart, CCIM Managing Director
 WALGREENS 1051 OAK STREET NORTH AURORA, IL 60542 Dan Stewart, CCIM Managing Director 734.662.5097 dan.stewart@svn.com Kevin Lynch, CCIM Managing Director 847.921.6300 kevin.lynch@svn.com SVN STEWART COMMERCIAL