Retail. 4 th QUARTER REPORT 2010
|
|
|
- Jennifer Dixon
- 5 years ago
- Views:
Transcription


1 Retail 4 th QUARTER REPORT 2010


2 At A Glance Vacancy rates remain stable - Overall vacancy rates showed a slight increase during the quarter to 13.09%. This is a 0.10% rise from 3rd quarter 2010 and a raise from a year ago at 13.02%, 4th quarter Anchorless Strip product type is showing the highest vacancy rates at 19.63%. Rents fall again - As Landlords are faced with a Tenant market, they are seeing many retailers renegotiating for lower rents and asking for more concessions as their leases come up for renewal. Negotiations like these and more up-front incentives help stabilize and even lower the overall average lease rates. Currently, the Las Vegas market is showing annual averages lease rates at $1.60 per square feet (psf ). This is a drop from last quarter at $1.63 psf and higher of a drop from a year ago when rates where at $1.85 psf. Unknown Outlook for Las Vegas - The DETR reported that since June (2010), the unemployment rate has hovered in the range of 14.2 to 14.4%. Although the Las Vegas market is stabilizing, unemployment rates remain the highest in the country and it will still take many years before the Las Vegas economy fully recovers. Retail Market Indicators Vacancy 13.09% Lease Rates (FSG) Change since Current 4Q09 4Q10 $1.60 NNN Net Absorption* 183,627 Construction N/A *The arrows are trend indicators over the specified time period and do not represent a positive or negative value. (e.g., absorption could be negative, but still represent a positive specified trend over a period.) National and State Employment and Unemployment Overview The worst of the 2007 recession is said to be over and Nevada is said to be showing signs of stabilizing according state officials. The Department of Employment, Training and Rehabilitation (DETR) reported that since June (2010), the unemployment rate has hovered in the range of 14.2 to 14.4%. Although the Las Vegas market is stabilizing, unemployment rates remain the highest in the country at 14.9%, this is rise from last quarters 14.7%. Nevada s unemployment rate also showed a rise from last quarter s 14.4% to 14.5%. According to DETR, at 14.5%, an 2
3 estimated 193,500 Nevadans are unemployed and out looking for work. Hiring in retail, added 1,300 jobs, professional and business services, added 900 jobs, and education and health services, added 500, grew at the end of the year. While manufacturing, a loss of 400 jobs and construction, a loss of 1500 jobs, is still struggling. The Center for Business and Economic Research at UNLV reported that they expect little change in future job growth through the first half of The national unemployment rate is currently 9.4%, a drop from 9.6% we witnessed last quarter. This unemployment rate is equal to roughly 14.5 million unemployed workers that are now drawing unemployment insurance benefits. In November, 21 states recorded unemployment rate increases, however 28 states posted jobless rates significantly lower than the National rate. The highest regional jobless rates were in the Western part of the country, while the Northeast recorded the lowest rates. Nevada continued to show the highest unemployment rates in the nation. The states with the next highest rates were Michigan and California at 12.4 % each and Florida at 12%. North Dakota reported the lowest jobless rate, 3.8 percent, followed by South Dakota and Nebraska, 4.5 and 4.6 percent, respectively. 100,000 80,000 60,000 40,000 20,000 Q308 $40,000,000,000 $30,000,000,000 $20,000,000,000 $10,000,000, Q Retail: Retail Employment vs Vacancy Rate (%) Q109 Q209 Q309 Q409 Q110 Q210 Retail: Clark County Taxable Sales and Vacancy Rate (%) Q Q % 16% 14% 12% 10% 8% 6% 4% 2% 0% 14.0% 12.0% 10.0% 8.0% 6.0% 4.0% 2.0% 0.0% 15% 13% 11% 9% 7% 5% 3% 1% -1% ECONOMIC INDICATORS National F GDP Growth -2.6% 2.8% 2.8% CPI Growth -0.3% 1.6% 1.5% Consumer Spending Growth -1.2% 1.7% 2.7% Rental Sales -6.3% 5.9% 5.0% Regional 1Q07 2Q07 3Q07 4Q07 1Q08 2Q08 3Q08 4Q08 1Q09 2Q09 3Q09 4Q09 1Q10 2Q10 3Q10 4Q10 Household Income $54,299 $59,038 $65,000 Population 1,952,000 1,956,900 1,964,700 Unemployment 12.10% 14.7% 14.9% Source: Moody s Economy.com Las Vegas 14.9% Nevada % US 9.4% Unemployment rates 4Q10 40,000,000,000 35,000,000,000 30,000,000,000 25,000,000,000 20,000,000,000 15,000,000,000 10,000,000,000 5,000,000,000 0 Las Vegas Retail Market Vacancy Clark County Taxable Retail Sales Overall Vacancy Rates Retail: Clark County Taxable Sales and Inventory Clark County Taxable Retail Sales Base By end of the quarter vacancies finally showed some stabilization from the long four year run of rising vacancy rates. The Las Vegas retail market has approximately 7.27 million square feet of vacant product, which equates to a 13.09% vacancy factor. Aboveaverage vacancies were noted in the Henderson (23.92%), North Las Vegas (18.38%), and East (15.22%) submarkets. By product Inventory (in millions) 3

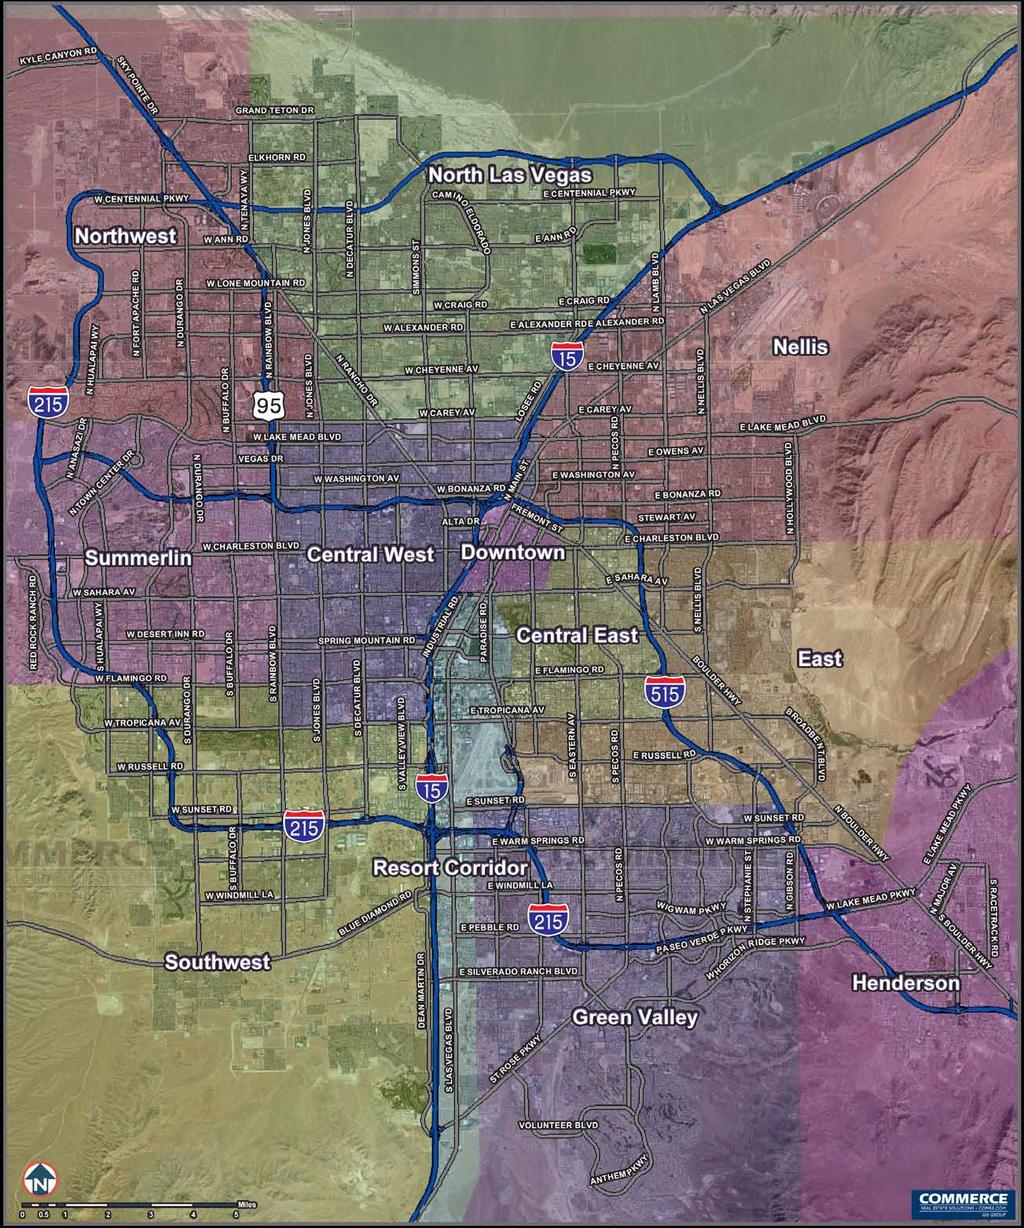
4 type Strip Centers (19.63%) and Neighborhood Centers (12.86%) retail buildings posted the highest vacancies at the end of the quarter. Nellis at 10.09% and Central West at 10.02% posted the lowest vacancy rates. Net absorption, the measure of space leased from one reporting period to the next, for the 4th quarter showed a positive number again, at 183,627 sf. The Green Valley submarket showed the greatest amount of positive absorption with over 46,577 sf. In fact nine out of the ten submarkets all showed positive absorption. The retailers that have pulled through the recession have enjoyed the wide array of occupancy choices. The old time saying location, location, location really means something right now to the retailers that can make the move to a more premier location as space opens up and rental rates are lowered and become more affordable. 2,000,000 1,000,000 - (1,000,000) (2,000,000) (3,000,000) (4,000,000) 60,000,000 55,000,000 50,000,000 Q4 06 Q1 07 Q2 07 Retail: Quarterly Absorption (SF) Q3 07 Q4 07 Q1 08 Q2 08 Q308 Q408 Q109 Q209 Q309 Q409 Retail: Inventory (SF) and Vacancy Rate (%) Q110 Q210 Q310 Q % 14.0% 12.0% 10.0% 15% 14% 13% 12% 11% 10% 9% 8% 7% 6% 5% 4% 3% 2% 1% 0% Q4 06 Q1 07 Q2 07 Q3 07 Q4 07 Q1 08 Retail: Quarterly Vacancy Q208 Q308 Q408 Q109 Q209 Q309 Q409 Q110 Q210 Q310 Q410 45,000,000 40,000,000 35,000,000 30,000,000 Q4 06 Q1 07 Q2 07 Q3 07 Q4 07 Q1 08 Q2 08 Q308 Quarterly Inventory Q408 Q109 Q209 Overall Vacancy Rates Q309 Q409 Q110 Q210 Q310 Q % 6.0% 4.0% 2.0% 0.0% 4


 Average asking rents witness another decline to $1.")
5 Retail Space Vacancy Rates Summerlin, 10.74% Central East, 14.07% Northwest submarket at $1.76 sf/fsg from $1.87 sf/fsg. The remaining submarkets had slight changes in rates showing that asking lease rates are also starting to become stable. Southwest, 13.22% Northwest, 10.24% Central West, 10.02% East, 15.22% Note: The average asking rates do not take in consideration free rent & rental concession $3.00 Retail: Quarterly Asking Lease Rates North Las Vegas, 18.38% Nellis, 10.09% Henderson, 23.92% Green Valley, 11.03% $2.50 $2.00 $1.50 $1.00 Retail Vacancy Rates by Product Type $0.50 Q4 07 Q1 08 Q208 Q308 Q408 Q109 Q209 Q309 Q409 Q110 Q210 Q310 Q % 20.00% $2.50 Retail: Yearly Rental Rates $ % $ % $ % $ % Q209 Q309 Q409 Q110 Q210 Q310 Q410 Community Centers Neighborhood Centers Anchorless Strip $ Pricing (Average Asking Rents) Average asking rents witness another decline to $1.60 per sf/mo NNN during 4th quarter This is the lowest asking lease rate that we have seen since 2004 when the rate was $1.62 per sf/mo NNN. The low rental rates could be playing a role in the new leasing momentum that we are starting to witness and helping retailers into spaces they could not afford before. Elevated tenant improvement allowances and free rent concessions are also impacting returns for landlords and ultimately lenders. We expect this trend to continue throughout most of 2011 as inventory levels remain elevated. The submarkets were divided with half of the market showing asking rental rates decline and the other half showing asking rental rates increases. The highest declines in asking rental rates were in the Green Valley submarket at $1.46 sf/fsg from $1.57 sf/fsg, Henderson submarket at $1.92 sf/fsg from $1.97 sf/fsg and 30.00% 25.00% 20.00% 15.00% 10.00% 5.00% 0.00% Central East $1.52 Central West $1.28 Retail: Vacancy (%) and Ave. Lease Rates $1.43 East Green Valley $1.46 Henderson $1.92 New Supply (Completions) and Market Demand Developers have halted many projects resulting in no new construction completions during 4th quarter. With the continued hesitation of developers to build product, due to scarce construction financing and weak rents, we also don t expect much of the planned $1.47 Nellis North Las Vegas $1.62 Northwest $1.76 Southwest $1.70 $1.88 Summerlin $2.50 $2.00 $1.50 $1.00 $0.50 $0.00 5

6 product to come online any time soon. Future new supply levels will continue to shrink as market corrections are underway. It may take another five years for the housing market to become stable, credit to start flowing and employment to become active again before any rise in construction numbers. For a smart recovery, the retail market needs to solve the imbalance of supply and demand by allowing existing vacant space to be absorbed and wait out this business cycle before any major growth should happen. that the Health Care reform bill will be making. Square Feet Las Vegas Retail Overview YTD 9,000,000 8,000,000 7,000, % 6,000,000 5,000,000 4,000, % 3,000, % 3.71% 2,000, % 13.09% 18.00% 16.00% 14.00% 12.00% 10.00% 8.00% 6.00% 4.00% Vacancy 1,000, % Outlook 0 Year Ave Lease Rate $1.75 $1.92 $2.04 $2.15 $1.85 $ % Base * Sf Millions The end of the year numbers really showed a marketing that is stabilizing. Vacancy is not rising and lease rates are not falling as fast as we had witnesses at the beginning of Although we still expect to see a slow recovery, since more than 50 big box retailers closed up shop since 2007, we are hoping that consumer confidence remains positive. Consumers are also more watchful of their spending habits and are looking for values. So we are hopeful that discount retailer s such as, Ross, Wal-Mart, TJMax, Burlington Coat Factory, Hobby Lobby, and Safeway s, to name a few, will take charge and help lease up some of the vacant big box space and start to really turn the retail market around in the next three to four years. In addition to these national players we are also seeing a trend in regional chains and Hispanic grocers starting to expand in the market. Another trend that is to be watch for in the coming years is the trend of turning vacant retail space into medical uses. With Retail locations offering ideal parking, good visibility and signage, and shopping centers now at a much more affordable rate, it could be a great option for medical office users. The medical profession is expected to see large growth as a result from the expected changes RULES FOR MARKET REVIEW Only existing properties, for lease >=10,000 square feet are included in the market reviews Type Built Vacant Inventory Vacancy Note: Due to reclassifications of, and adjustments to, data between reporting periods, the commercial market data for the latest quarter may not necessarily be comparable to a previously reported quarter. Regional Mall Enclosed Mall Regional Center >= 350,000 Sf Community Center...>= 100,000 And <= 349,999 Sf Neighborhood Center...>= 50,000 And <= 99,999 Sf Anchorless Strip <= 49,999 Sf Freestanding...Freestanding 6
7 Commerce Real Estate Solutions Las Vegas Retail Market Report Q Inventory Vacancy Demand & Supply Pricing No. of Existing Under Const. Planned Vacancy Net Gross New Asking Rent (NNN) Bldgs. SF SF SF SF Rate Absorption Spaced Supply Low High Weighted Avg. Central East Community Centers 20 3,485, , % $0.50 $3.00 $1.55 Freestanding 5 204, % Neighborhood Centers 6 492, , % (165) 1,035 - $0.90 $3.75 $1.68 Anchorless Strip 41 1,526, , % 5,775 8,447 - $0.50 $3.00 $1.34 Total 72 5,709, , % 5,610 9,482 - $0.50 $3.75 $1.52 Central West Community Centers 28 4,580, , % 8,859 8,859 - $0.65 $3.25 $1.35 Freestanding 6 512, , % $0.65 $1.60 $1.42 Neighborhood Centers 16 1,241, , % 2,957 2,957 - $0.60 $2.50 $1.28 Anchorless Strip 42 1,479, , % 32,486 33,602 - $0.50 $2.50 $1.07 Total 92 7,813, , % 44,302 45,418 - $0.50 $3.25 $1.28 East Community Centers 16 2,532, , % 32,957 32,957 - $0.49 $3.50 $1.50 Freestanding 3 113, % Neighborhood Centers 2 181, , % $1.50 $1.50 $1.50 Anchorless Strip , , % 12,221 12,221 - $0.50 $2.00 $1.30 Total 33 3,230, , % 45,178 45,178 - $0.49 $3.50 $1.43 Green Valley Community Centers 33 7,442, , % 20,915 21,695 - $0.35 $4.00 $1.80 Freestanding 3 263, , % $1.00 $1.00 $1.00 Neighborhood Centers 22 2,055, , % 20,727 20,727 - $0.50 $2.50 $1.57 Anchorless Strip , , % 4,935 4,935 - $0.75 $3.00 $1.48 Total 86 10,611, ,170, % 46,577 47,357 - $0.35 $4.00 $1.46 Henderson Community Centers 10 1,954, , % 14,600 14,600 - $0.50 $4.00 $1.63 Freestanding Neighborhood Centers 3 295, , % $2.00 $2.50 $2.25 Anchorless Strip 7 347, , % 1,603 1,603 - $0.50 $3.50 $1.89 Total 20 2,597, , % 16,203 16,203 - $0.50 $4.00 $1.92 Nellis Community Centers 8 1,235, , % 4,431 4,431 - $0.85 $2.55 $1.41 Freestanding 2 100, % Neighborhood Centers , , % $0.50 $3.25 $1.60 Anchorless Strip , , % $0.70 $3.50 $1.40 Total 37 2,770, , % 4,431 4,431 - $0.50 $3.50 $1.47 North Las Vegas Community Centers 25 4,917, , % $0.50 $3.75 $1.98 Freestanding Neighborhood Centers 16 1,444, , % 5,486 5,486 - $0.65 $2.75 $1.61 Anchorless Strip , , % $0.49 $3.50 $1.26 Total 56 6,877, ,264, % 5,990 5,990 - $0.49 $3.75 $1.62 Northwest Community Centers 17 3,451, , % 1,200 1,200 - $0.81 $3.15 $1.84 Freestanding Neighborhood Centers , , % 2,521 2,521 - $0.95 $3.25 $1.87 Anchorless Strip , , % 10,367 10,367 - $0.90 $3.25 $1.57 Total 48 4,518, , % 14,088 14,088 - $0.81 $3.25 $1.76 Southwest Community Centers 15 4,217, , % 1,200 1,200 - $0.95 $3.50 $1.90 Freestanding Neighborhood Centers , , % $1.00 $2.55 $1.58 Anchorless Strip 45 1,645, , % $0.50 $4.25 $1.63 Total 70 6,825, , % 2,040 2,040 - $0.50 $4.25 $1.70 Summerlin Community Centers 18 3,595, , % (792) - - $0.75 $3.50 $2.12 Freestanding % Neighborhood Centers 8 532, , % $0.80 $3.00 $1.83 Anchorless Strip , , % $1.00 $3.00 $1.68 Total 45 4,639, , % (792) - - $0.75 $3.50 $1.88 Las Vegas Total Community Centers ,413, ,511, % 83,370 84,942 - $0.35 $4.00 $1.71 Freestanding 19 1,194, , % $0.65 $1.60 $1.21 Neighborhood Centers 112 8,817, ,133, % 31,526 32,726 - $0.50 $3.75 $1.68 Anchorless Strip 238 8,170, ,603, % 68,731 72,519 - $0.49 $4.25 $1.46 Total ,595, ,276, % 183, ,187 - $0.35 $4.25 $1.60 7
8 8

9 Commerce full service commercial real estate solutions Commerce Real Estate Solutions has been among the top commercial real estate brokerage firms in the Intermountain West for over 30 years. From our headquarters in Salt Lake City and offices in Provo/Orem, Clearfield and St. George, Utah, Las Vegas, Nevada and Seattle and Bellevue Washington we offer a full range of brokerage services, valuation and consulting, client representation and property/facility management. Our alliance with Cushman & Wakefield extends our reach worldwide. Meeting your real estate objectives is our number one goal at Commerce Real Estate Solutions. Whether you re looking to lease, own, develop or sell commercial properties, we have the team of professionals to get it done for you. Our seasoned agents are recognized both regionally and nationally for their first-rate performance; and because of their success, they tend to stay with our company longer. The average tenure of Commerce agents is one of the longest in the industry. Cushman & Wakefield is the world s largest privately-held commercial real estate services firm. That means you re getting an experienced agent when you do business with us. You re also gaining access to our Information Services Group, which includes our Geographic Information System (GIS), the industry standard-bearer in mapping, Graphic Design and Marketing, and Research. At Commerce we have a complete understanding of the real estate market. Our comprehensive database allows our agents to feel, track and analyze every movement in the industry and to see opportunities as soon as they arise. Combine this with the global resources of Cushman & Wakefield and you get the most innovative and progressive real estate brokerage in the Intermountain West: Commerce Real Estate Solutions. Doing business in a brisk and nuanced marketplace is complex and difficult. We can help. Our experience, knowledge, innovative thinking, networking infrastructure and unmatched service make Commerce the clear choice for your commercial real estate needs. Cushman & Wakefield Cushman & Wakefield is the world s largest privately-held commercial real estate services firm. Founded in 1917, it has 231 offices in 58 countries and 15,000 employees. The firm represents a diverse customer base ranging from small businesses to Fortune 500 companies. It offers a complete range of services within four primary disciplines: Transaction Services, including tenant and landlord representation in office, industrial and retail real estate; Capital Markets, including property sales, investment management, valuation services, investment banking, debt and equity financing; Client Solutions, including integrated real estate strategies for large corporations and property owners, and Consulting Services, including business and real estate consulting. A recognized leader in global real estate research, the firm publishes a broad array of proprietary reports available on its online Knowledge Center at 9


10 Las Vegas retail Team Robin Civish, CCIM Liz Clare, CCIM Dan Hubbard Todd Manning Michael McDay Jacqueline Young 10
 allows our clients a unique opportunity to visualize where their property is located.")
11 GIS / Mapping Department The GIS / Mapping services group provides our agents and clients with the most current information available. Using GIS (Geographic Information Services) allows our clients a unique opportunity to visualize where their property is located. Additional market information includes: Daily traffic count information Local drive times Demographic information Population growth Major tenants in the region and trade areas medical office, industrial and retail properties. In addition to tracking local properties, the research team prepares quality market reports and research economic and demographic trends. Working in tandem with the other office specialty support groups such as mapping, graphic design and marketing, the Research team strives to provide timely and quality information to enable Commerce professionals to better serve their clients. Marketing Department The graphic design department at Commerce Real Estate Solutions employs eight full time department is to provide our agents with whatever materials necessary to successfully market their projects. This resource allows us to vividly show the retail prospect why they need to be located in a certain segment of town. This department uses the latest in Adobe design programs, and is integrated with our mapping and research departments. Web: Commerce Real Estate Solutions was at the forefront in the use of the World Wide Web by commercial real estate firms and has maintained a web site for over ten years. All Some clients that have benefited from our mapping / GIS technology are; Wal-Mart, JoAnn s, Carmax, Toys-R-Us, Discount Tire, Lowe s Home Improvement, Shoe Carnival, Chase Bank, Staples, PacifiCorp, GSA, Intel, Fidelity Investments, Social Security Administration, Salt Lake City School District and JP Morgan Bank. Commerce Real Estate Solutions is a regional real estate firm with international ties, dedicated first and foremost to our clients. With the industry s premier professionals, and industry leading technology, our mission is to exceed our clients expectations through service excellence. Research Department The Commerce Real Estate Solutions Research team is charged with tracking the Utah, Nevada and Seattle commercial real estate markets and providing current market information. With access to industry databases and prime real estate tools, the research team is well-equipped to support the information needs of the local offices. The Las Vegas researcher tracks leasing activity for 182 million square feet of office, graphic designers. Each of our designers has a number of years of experience. Chris Valentin, the design director, has been with Commerce Real Estate Solutions for over fourteen years, and along with Matt Liapis, who has taught graphic design and mapping at the University of Utah. Our Las Vegas office consists a team of two well trained and professional designers with a combined 12 plus years of experience. The founding principal behind the design of our commercial properties are listed and searchable by use, size, price, and location. In addition to commercial properties, our Web site has agent profiles, information about Commerce Real Estate Solutions offices throughout the intermountain west, a company history, and links to valuable information including a link to the Cushman and Wakefield Web site. The Web site also has downloadable copies of all our Market Reviews dating back to
12 Commerce Real Estate Solutions 3800 Howard Hughes Parkway, Suite 1200 Las Vegas, NV (T) (F) , Commerce Real Estate Solutions. Disclaimer: The above information is given with the obligation that all negotiations relating to the purchase, renting, or leasing of the property described above shall be conducted through Commerce Real Estate Solutions. No warranty or representation, express or implied, is made as to the accuracy of the information contained herein, and same is submitted subject to errors, omissions, change of price, rental or other encumbrances, withdrawal without notice, and to any special listing conditions imposed by the seller. Prospective buyers should conduct their own due diligence. Some aerial photography by DigitalGlobe or Aerials Express.
Office Stays Positive
 Q2 2014 OFFICE LAS VEGAS NEVADA RESEARCH & FORECAST REPORT Office Stays Positive While it may not always be pretty, Southern Nevada s office market continues to improve. Net absorption increased in the
Time for Retail to Take Stock
 Q1 2013 RETAIL LAS VEGAS NEVADA RESEARCH & FORECAST REPORT Time for Retail to Take Stock It is heartening to say, after five years of a bad economy, that the first quarter of 2013 s 119,649 square feet
Market Research. Market Indicators
 colliers international LAS VEGAS, NV Market Research OFFICE Third Quarter 2009 Market Indicators Net Absorption Construction Rental Rate Q3-09 Q4-2009 Projected Clark County Economic Data Jul-09 Jul-08
RESEARCH & FORECAST REPORT
 Q2 2012 OFFICE LAS VEGAS NEVADA RESEARCH & FORECAST REPORT Recovery Without Job Growth? Despite office employment still trending downwards, Southern Nevada s office market posted positive net absorption
Las Vegas Valley Executive Summary
 ARROYO MARKET SQUARE Las Vegas Valley Executive Summary Retail Market 4th Quarter 2013 THE DISTRICT AT GREEN VALLEY RANCH January 23, 2014 Re: Commercial Real Estate Survey: 4th Quarter, 2013 Dear Reader,
Market Research. OFFICE First Quarter 2010
 colliers international LAS VEGAS, NV Market Research OFFICE First Quarter 2010 Market Indicators Net Absorption Construction Rental Rate Q1-10 Q2-2010 Projected Clark County Economic Data Jan-10 Jan-09
Medical Takes a Sick Quarter
 Research & Forecast Report LAS VEGAS MEDICAL OFFICE Q3 2015 Medical Takes a Sick Quarter > > After two quarters of growth, the medical real estate sector stalled in the third quarter of 2015 > > Asking
RESEARCH & FORECAST REPORT
 Q3 2012 OFFICE LAS VEGAS NEVADA RESEARCH & FORECAST REPORT Office Forges Ahead Southern Nevada s office market continued to post positive net absorption in the third quarter of 2012, despite weak employment
Good Year, Poor Quarter
 Q4 2013 RETAIL LAS VEGAS NEVADA RESEARCH & FORECAST REPORT Good Year, Poor Quarter After nine quarters of positive net absorption, Southern Nevada s retail market fell into negative net absorption territory
Office Market Continues to Improve
 Research & Forecast Report LAS VEGAS OFFICE Q3 2016 Office Market Continues to Improve > > Southern Nevada s office market is improving at a steady rate > > Net absorption has been positive in twelve of
Market Research. Market Indicators
 colliers international LAS VEGAS, NV Market Research OFFICE Second Quarter 2009 Market Indicators Net Absorption Construction Rental Rate Q2-09 Q3-2009 Projected Clark County Economic Data UNEMPLOYMENT
HISTORICAL VACANCY VS RENTS $1.75 2Q10 2Q11 2Q12 2Q13 2Q14
 www.colliers.com/greaterlosangeles RETAIL GREATER LOS ANGELES BASIN MARKET REPORT Vacancy Decreases and Net Absorption Increases From Previous Quarter MARKET INDICATORS - VACANCY 6. NET ABSORPTION 732,000
First Quarter Industrial Market Report 2017
 First Quarter Industrial Market Report 2017 03 04 04 04 05 06 08 09 10 11 13 Executive Summary National Economy Local Economy Oklahoma City Industrial Market Leasing Net Absorption and Inventory Rental
INDUSTRIAL QUICK STATS SUMMARY & OUTLOOK MARKET TRENDS VACANCY & NET ABSORPTION ECONOMIC STATS
 PHOENIX, ARIZONA INDUSTRIAL THIRD QUARTER 217 QUICK STATS Direct Vacancy 8.7% Overall Vacancy 9.% Lease Rate NNN $.54 Gross Absorption Under Construction MARKET TRENDS Current Quarter 5,991,128 SF 4,751,494
Indianapolis MARKETBEAT. Office Q Economy. Market Overview INDIANAPOLIS OFFICE
 INDIANAPOLIS OFFICE Economic Indicators Market Indicators (Direct, All Classes) Direct Net Absorption/Direct Asking Rent 4-QTR TRAILING AVERAGE Direct Vacancy Q3 17 Q3 18 MSA Employment 1.05M 1.07M MSA
Indianapolis MARKETBEAT. Office Q Economy. Market Overview INDIANAPOLIS OFFICE
 INDIANAPOLIS OFFICE Economic Indicators Q2 17 Q2 18 MSA Employment 1.1M 1.1M MSA Unemployment 3.3% 3.0% U.S. Unemployment 4.3% 3. Market Indicators (Direct, All Classes) Q2 17 Q2 18 Total Market Vacancy
Market Research. Industrial Review. Industrial Third Quarter Market Indicators
 colliers international LAS VEGAS, NV Market Research Industrial Third Quarter 2009 Market Indicators Vacancy Net Absorption Construction Rental Rate Q3-09 Q4-2009 Projected Clark County Economic Data Jul-09
Soft Land Market in 2017
 Research & Forecast Report LAND Q4 217 Soft Land Market in 217 > > Land sales in 217 fell behind 216 > > A lack of large sales at Apex brought the average price per square foot up > > Strong development
MARKET WATCH SOUTHERN CALIFORNIA & PHOENIX
 SOUTHERN CALIFORNIA & PHOENIX COMMERCIAL REAL ESTATE MARKET FOURTH QUARTER 217 MARKET WATCH SOUTHERN CALIFORNIA & PHOENIX 1.888.659.DAUM WWW.DAUMCOMMERCIAL.COM D/AQ Corp. # 1129558 DAUM TABLE OF CONTENTS
Los Angeles Basin Retail Market Continues To Witness Decreasing Vacancy Rates
 RETAIL GREATER LOS ANGELES BASIN MARKET REPORT Continues To Witness Decreasing Vacancy Rates MARKET INDICATORS - VACANCY 6.0% NET ABSORPTION 1,605,200 CONSTRUCTION 2,111,970 RENTAL RATE $2.03 P NNN UNEMPLOYMENT
Offices at Gateway Salt Lake City, Utah
 Offices at Gateway Salt Lake City, Utah The Offices at Gateway are located in the downtown Salt Lake City submarket and incorporated within The Gateway Mall. This mixed-use development provides abundant
CHICAGO CBD OFFICE INVESTMENT PROPERTIES GROUP
 CHICAGO CBD OFFICE INVESTMENT PROPERTIES GROUP SECOND QUARTER NEWSLETTER 216 HOT TOPICS Capital markets remain a focus with 14 assets either under contract or sold totaling $2.6 billion, which includes
Los Angeles Basin Retail Market Witnessed A Slight Increase In Vacancy Rates
 RETAIL GREATER LOS ANGELES BASIN MARKET REPORT Witnessed A Slight Increase In Vacancy Rates MARKET INDICATORS - VACANCY 6.2% NET ABSORPTION -551,200 CONSTRUCTION 1,946,000 RENTAL RATE $1.96 P NNN UNEMPLOYMENT
HISTORICAL VACANCY VS RENTS. Downtown Los Angeles Office Market Q Q RENTS VACANCY $31 2Q10 2Q11 2Q12 2Q13 2Q14
 www.colliers.com/losangeles OFFICE LOS ANGELES MARKET REPORT Rate Decrease Below 20% As Market Activity Remains Flat MARKET OVERVIEW MARKET INDICATORS - VACANCY 19.5% The Downtown Los Angeles market in
Second Quarter Retail Market Report 2017
 Second Quarter Retail Market Report 2017 03 04 04 04 04 05 06 07 08 10 Executive Summary National Economy Local Economy Oklahoma City Retail Market Leasing Net Absorption and Inventory Rental and Vacancy
Los Angeles Basin Retail Market Continues To Witness Decreasing Vacancy Rates
 RETAIL GREATER LOS ANGELES BASIN MARKET REPORT Continues To Witness Decreasing Vacancy Rates MARKET INDICATORS - VACANCY 6. NET ABSORPTION 588,800 CONSTRUCTION 3,312,470 RENTAL RATE $2.04 P NNN UNEMPLOYMENT
Salt Lake County YEAR-END 2010 MARKET REVIEW
 trends Market Indicators During the second half of there was a continued softening of asking lease rates reflecting the general weakness of the retail leasing market. Most notable was the significant drop
Orange County Industrial Continues Positive Momentum
 INDUSTRIAL ORANGE COUNTY MARKET REPORT Orange County Industrial Continues Positive Momentum MARKET INDICATORS - VACANCY 2.9% AVAILABILTY 5.2% NET ABSORPTION 394,960 SF CONSTRUCTION 676,700 SF RENTAL RATE
3 RD QUARTER 2015 RICHMOND RETAIL MARKET REPORT FORECAST 5.7% VACANCY 509,220 SF UNDER CONSTRUCTION 370,165 SF NET ABSORPTION
 3 RD QUARTER 2015 RICHMOND RETAIL MARKET REPORT FORECAST As 2015 winds down, the vacancy rates are approaching an all time low. Retail inventory is down causing an increase in construction with national
Second Quarter Industrial Market Report 2017
 Second Quarter Industrial Market Report 2017 03 04 04 04 05 06 08 09 10 11 13 Executive Summary National Economy Local Economy Oklahoma City Industrial Market Leasing Net Absorption and Inventory Rental
Low Vacancy Stimulates New Developments
 Research & Forecast Report LAS VEGAS MULTIFAMILY Q3 2015 Low Vacancy Stimulates New Developments > > Multifamily vacancy dipped below 5 percent in the third quarter of 2015 ELECTRIC Meter Hookups NEW HOME
OFFICE QUICK STATS SUMMARY & OUTLOOK MARKET TRENDS VACANCY & NET ABSORPTION ECONOMIC STATS
 INLAND EMPIRE OFFICE THIRD QUARTER 217 QUICK STATS Direct Vacancy 11.4% Overall Vacancy 11.7% Lease Rate FSG $1.83 Gross Absorption Under Construction MARKET TRENDS Current Quarter 529,634 SF 45,24 SF
>> Greater Los Angeles Retail Continues to Witness Declining Vacancy
 Research & Forecast Report GREATER LOS ANGELES RETAIL Accelerating success. >> Greater Los Angeles Retail Continues to Witness Declining Vacancy Greater Los Angeles Retail Market The Los Angeles Basin
Gran Park at the Avenues
 FOR SALE Gran Park at the Avenues ±10.4 Net AC 3 Parcels Jacksonville, FL 32256 Premier Development Opportunity! Call for Pricing! THREE PARCELS FOR BULK PURCHASE For more information, please contact:
>> Greater Los Angeles Retail Starts 2017 At A Slow Pace
 Research & Forecast Report GREATER LOS ANGELES RETAIL Q1 2017 Accelerating success. >> Greater Los Angeles Retail Starts 2017 At A Slow Pace Greater Los Angeles Retail Market The Los Angeles Basin retail
San Fernando Valley and Ventura County Witness Declining Vacancy
 OFFICE SAN FERNANDO & VENTURA MARKET REPORT San Fernando Valley and Ventura County Witness Declining MARKET OVERVIEW The San Fernando Valley and Ventura County office market saw total vacancy decrease
The Market Is Energized By Increased Development In Hollywood
 OFFICE CENTRAL LOS ANGELES MARKET REPORT The Market Is Energized By Increased Development In Hollywood MARKET OVERVIEW MARKET INDICATORS - VACANCY 20.5% NET ABSORPTION 24,100 CONSTRUCTION 574,000 RENTAL
OFFICE QUICK STATS SUMMARY & OUTLOOK MARKET TRENDS VACANCY & NET ABSORPTION ECONOMIC STATS
 LOS ANGELES SAN GABRIEL VALLEY OFFICE SECOND QUARTER 218 QUICK STATS Direct Vacancy 11.1% Overall Vacancy 11.4% Lease Rate FSG $2.32 Gross Absorption Under Construction MARKET TRENDS Current Quarter 345,68
Office Market Activity Report
 Q2 2010 Office Market Activity Report Salt Lake County Second Quarter 2010 Office Market Overview - Q2 2010 Change since: Current Q1 10 Q4 09 Direct Office Vacancy 15.97% Sublease Vacancy 1.49% Average
3 RD QUARTER 2016 RICHMOND RETAIL MARKET REPORT FORECAST 5.3% VACANCY 349,524 SF UNDER CONSTRUCTION (137,905) SF NET ABSORPTION
 SF NET ABSORPTION") 3 RD QUARTER 2016 RICHMOND RETAIL MARKET REPORT FORECAST All signs indicate a stabilized market that continues to support well-located new development. The majority of absorption in the 3rd quarter was
3 RD QUARTER 2016 RICHMOND RETAIL MARKET REPORT FORECAST All signs indicate a stabilized market that continues to support well-located new development. The majority of absorption in the 3rd quarter was
OFFICE QUICK STATS SUMMARY & OUTLOOK MARKET TRENDS VACANCY & NET ABSORPTION ECONOMIC STATS
 ORANGE COUNTY OFFICE THIRD QUARTER 217 QUICK STATS Direct Vacancy 12.1% Overall Vacancy 12.9% Lease Rate FSG $2.61 Gross Absorption Under Construction MARKET TRENDS Current Quarter 2,479,293 SF 379, SF
Office Market Remained Steady in Q4
 Research & Forecast Report Long Island OFFICE MARKET Q4 2015 Office Market Remained Steady in Q4 Rose Liu Research & Financial Analyst Long Island Takeaways Class A & B Continuing the momentum, the Long
MARKETBEAT INDUSTRIAL SNAPSHOT
 9.1 4.9 7.3 4.5 7. 1.3 8.1 1.3 1.7.3 msf MARKETBEAT INDUSTRIAL SNAPSHOT LAS VEGAS, NV A Cushman & Wakefield Alliance Research Publication Q1 215 ECONOMIC OVERVIEW The U.S. economy continued to add jobs
Denver s Retail Sector Keeps Rolling 500, , , , , , , , ,000 50,000. Square Feet
 Research & Forecast Report METRO DENVER RETAIL Q4 2017 s Retail Sector Keeps Rolling Market Overview Net absorption finished the second half of 2017 with strong positive numbers from s Central and Northwest
Stronger Office Market Looking Into Future
 Research & Forecast Report Long Island OFFICE MARKET Q2 2015 Stronger Office Market Looking Into Future Rose Liu Research & Financial Analyst Long Island Takeaways Class A & B Long Island economic and
FACT SHEET April - June 2011 EMPLOYMENT
 LAS VEGAS VALLEY FACT SHEET April - June EMPLOYMENT June Employment by Industry Goods Producing Natural Resources & Mining Construction Manufacturing 6,74,8 3 39,6 8,5 Trade, Transportation & Utilities
OFFICE QUICK STATS SUMMARY & OUTLOOK MARKET TRENDS VACANCY & NET ABSORPTION ECONOMIC STATS
 VENTURA COUNTY OFFICE THIRD QUARTER 217 QUICK STATS Direct Vacancy 13.9% Overall Vacancy 14.3% Lease Rate FSG $2.25 Gross Absorption Under Construction MARKET TRENDS Current Quarter 34,43 SF 18,112 SF
ECONOMIC CURRENTS. Vol. 4, Issue 3. THE Introduction SOUTH FLORIDA ECONOMIC QUARTERLY
 ECONOMIC CURRENTS THE Introduction SOUTH FLORIDA ECONOMIC QUARTERLY Vol. 4, Issue 3 Economic Currents provides an overview of the South Florida regional economy. The report presents current employment,
INDUSTRIAL QUICK STATS SUMMARY & OUTLOOK MARKET TRENDS VACANCY & NET ABSORPTION ECONOMIC STATS
 VENTURA COUNTY INDUSTRIAL FOURTH QUARTER 217 QUICK STATS Direct Vacancy 2.1% Overall Vacancy 2.4% Lease Rate NNN $.7 Gross Absorption Under Construction MARKET TRENDS Current Quarter 1,332,957 SF 774,362
Land Sales Lighter in Third Quarter
 Research & Forecast Report LAND Q3 216 Land Sales Lighter in Third Quarter > > While land sales are up in 216 overall, they decreased in the third quarter Economic Indicators > > Apex continues to dominate
Shrinking Supply Continues To Push Rates
 Research & Forecast Report STOCKTON SAN JOAQUIN COUNTY OFFICE Q1 2017 Shrinking Supply Continues To Push Rates > Office inventory: 8,221,819 > Vacancy: 10.5 percent > Net absorption: 49,103 year-to-date
San Fernando Valley & Ventura County Industrial Market $0.48 1Q11 1Q12 1Q13 1Q14 1Q15
 industrial SAN FERNANDO VALLEY & VENTURA COUNTY market report Rents Continue To Rise As Vacancy Rate Continues To Decrease Market overview MARKET indicators - VACANCY 2.9% AVAILABILITY 5.2% NET ABSORPTION
Positive Net Absorption Recorded For The Ninth Consecutive Quarter
 OFFICE SAN FERNANDO & VENTURA MARKET REPORT Positive Net Absorption Recorded For The Ninth Consecutive Quarter MARKET OVERVIEW MARKET INDICATORS - VACANCY 15.2% NET ABSORPTION 116,700 CONSTRUCTION 120,933
OFFICE QUICK STATS SUMMARY & OUTLOOK MARKET TRENDS VACANCY & NET ABSORPTION ECONOMIC STATS
 LOS ANGELES NORTH OFFICE FOURTH QUARTER 217 QUICK STATS Direct Vacancy 11.8% Overall Vacancy 12.5% Lease Rate FSG $2.75 Gross Absorption Under Construction MARKET TRENDS Current Quarter 1,6,941 SF 89,158
Homestretch: Office Market Set to Finish Strong
 Research & Forecast Report RENO OFFICE Q3 2016 Homestretch: Office Market Set to Finish Strong >> Vacancy drops significantly the largest drop quarter over quarter in 2016 >> Rental rates are not increasing
MarketREVIEW INSIGHT TRENDS PERSPECTIVE. Adams County, PA 2nd Quarter 2015
 MarketREVIEW INSIGHT TRENDS PERSPECTIVE Adams County, PA 2nd Quarter 2015 RESEARCH & MAPPING TABLE OF CONTENTS RETAIL MARKET REVIEW Adams County Retail Vacancy Remains Low 3 Dear Reader, This report provides
South Bay Experiences Slow and Steady Market Activity
 OFFICE SOUTH BAY MARKET REPORT South Bay Experiences Slow and Steady Market Activity MARKET OVERVIEW MARKET INDICATORS - VACANCY 21.4% NET ABSORPTION -68,500 CONSTRUCTION 210,000 RENTAL RATE $2.08 FSG
Leasing cools, but deal flow consistent
 MARKETVIEW Downtown Manhattan Office, Q3 216 Leasing cools, but deal flow consistent Leasing Activity.85 MSF Net Absorption (.12) MSF Availability Rate 11.7 Vacancy Rate 9.3 Average Asking Rent $57.5 PSF
Negative Absorption And Sharp Rise In Total Vacancy to Begin 2014
 OFFICE TRI-CITIES MARKET REPORT Negative Absorption And Sharp Rise In Total to Begin 214 MARKET OVERVIEW MARKET INDICATORS - VACANCY 19.4% NET ABSORPTION -154,9 CONSTRUCTION 155, RENTAL RATE $2.63 P UNEMPLOYMENT
The Industrial Market Cooled Off in Q1
 Research & Forecast Report Long Island industrial MARKET Q1 2016 The Industrial Market Cooled Off in Q1 Rose Liu Director of Finance & Research Long Island Takeaways > > Long Island industrial market slowed
Orange County Office Market Continues to Tighten As Vacancy Decreases
 OFFICE ORANGE COUNTY MARKET REPORT Continues to Tighten As Decreases MARKET OVERVIEW MARKET INDICATORS - VACANCY 13.5% NET ABSORPTION 101,500 CONSTRUCTION 497,387 RENTAL RATE $2.21 P FSG UNEMPLOYMENT 4.2%
Industrial Market Report
 Industrial Market Report Greater Phoenix Q4 2012 CONTACT NAI HORIZON 602.955.4000 2944 N 44TH STREET, SUITE 200, PHOENIX, AZ 85018 WWW.NAIHORIZON.COM Building Momentum for a Positive 2013 The Phoenix Industrial
>> Greater Los Angeles Retail Starts 2016 On a Positive Note
 Research & Forecast Report GREATER LOS ANGELES RETAIL Accelerating success. >> Greater Los Angeles Retail Starts 2016 On a Positive Note Greater Los Angeles Retail Market The Los Angeles Basin retail market
Orange County Office Market Continues to Tighten Causing Rental Rates to Increase
 OFFICE ORANGE COUNTY MARKET REPORT Continues to Tighten Causing Rental Rates to Increase MARKET OVERVIEW MARKET INDICATORS - VACANCY 12.6% NET ABSORPTION 688,800 CONSTRUCTION 497,387 RENTAL RATE $2.26
INDUSTRIAL QUICK STATS SUMMARY & OUTLOOK MARKET TRENDS VACANCY & NET ABSORPTION ECONOMIC STATS
 ORANGE COUNTY INDUSTRIAL FOURTH QUARTER 217 QUICK STATS Direct Vacancy 2.3% Overall Vacancy 2.7% Lease Rate NNN $.91 Gross Absorption Under Construction MARKET TRENDS Current Quarter 4,283,991 SF 963,138
Miami-Dade County Retail Market Report 4Q Real Capital Partners Real Estate Services. *Data Source CoStar Miami-Dade County Retail Market Report
 Miami-Dade County Retail Market Report 4Q 216 Real Capital Partners Real Estate Services *Data Source CoStar 4Q 216 Miami-Dade County s Vacancy Decreases to 4.% Net Absorption Positive 1,155,8 SF in the
>> Negative Net Absorption Despite Completions
 Research & Forecast Report MID-COUNTIES INDUSTRIAL Accelerating success. >> Negative Net Absorption Despite Completions Key Takeaways > This quarter, 542,000 square feet of industrial space finished construction,
INDUSTRIAL QUICK STATS SUMMARY & OUTLOOK MARKET TRENDS VACANCY & NET ABSORPTION ECONOMIC STATS. Current Quarter. Direct Vacancy 2.
 ORANGE COUNTY INDUSTRIAL SECOND QUARTER 218 QUICK STATS Direct Vacancy 2.2% Overall Vacancy 2.5% Lease Rate NNN $.95 Gross Absorption Under Construction MARKET TRENDS Current Quarter 2,956,71 SF 1,367,18
Slow start for Denver s Retail Sector 500, , , , , , , , ,000 50,000. Square Feet
 Research & Forecast Report METRO DENVER RETAIL Q1 2018 Slow start for Denver s Retail Sector Market Overview After recording net absorption of more than 546,000 square feet during the previous quarter,
Orange County Office Market Continues A Positive Stride Into 2016
 OFFICE ORANGE COUNTY MARKET REPORT Continues A Positive Stride Into 2016 MARKET OVERVIEW MARKET INDICATORS - VACANCY 12.8% NET ABSORPTION 143,900 CONSTRUCTION 594,300 RENTAL RATE $2.31 P FSG UNEMPLOYMENT
Columbus MARKETBEAT. Office Q2 2017
 COLUMBUS OFFICE Economic Indicators Market Indicators Q2 16 Q2 17 Unemployment 4.0% 3.9% Ohio Unemployment 5.0% 5.0% U.S. Unemployment 4.9% 4.4% Q2 16 Q2 17 Overall Vacancy 13.3% 13.4% 212K -80K Construction
Negative Absorption Recorded For The First Time In Past Nine Quarters
 OFFICE SAN FERNANDO & VENTURA MARKET REPORT Negative Absorption Recorded For The First Time In Past Nine Quarters MARKET OVERVIEW MARKET INDICATORS - VACANCY 15.6% NET ABSORPTION -124,000 CONSTRUCTION
Strong Marketwide Leasing Activity Points To A Strong Finish for Tri-Cities
 OFFICE TRI-CITIES MARKET REPORT Strong Marketwide Leasing Activity Points To A Strong Finish for Tri-Cities MARKET OVERVIEW MARKET INDICATORS - VACANCY 14.9% NET ABSORPTION 254,6 CONSTRUCTION 113,8 RENTAL
Market Overview TAMPA BAY OFFICE THIRD QUARTER
 Market Overview TAMPA BAY OFFICE THIRD QUARTER 29 COLLIERS ARNOLD TAMPA BAY Insights on the Market OFFICE THIRD QUARTER 29 MARKET INDICATORS TAMPA BAY INVENTORY 8,58,612 Sq. Ft. Q3 Q4* OVERALL VACANCY
Monthly Market Snapshot
 SEPTEMBER 2018 Vacancy continues to fall. Nearing the end of the third quarter, the vacancy rate dropped 10 basis points to 6.4%, compared to this time last month at 6.5%. Occupancy of the 1.1 million
Chicago s industrial market thrives during the second quarter.
 Economic Overview CHICAGO INDUSTRIAL MARKET MONITOR SECOND QUARTER 2015 Chicago s industrial market thrives during the second quarter. Demand across the Chicago industrial market remains high sending absorption
>> Greater Los Angeles Retail Ends 2016 With Mixed Results
 Research & Forecast Report GREATER LOS ANGELES RETAIL Q4 2016 Accelerating success. >> Greater Los Angeles Retail Ends 2016 With Mixed Results Greater Los Angeles Retail Market The Los Angeles Basin retail
OFFICE QUICK STATS SUMMARY & OUTLOOK MARKET TRENDS VACANCY & NET ABSORPTION ECONOMIC STATS
 LOS ANGELES CENTAL/SOUTHEAST OFFICE THIRD QUARTER 218 QUICK STATS Direct Vacancy 14.7% Overall Vacancy 15.2% Lease Rate FSG $3.16 Gross Absorption Under Construction MARKET TRENDS Change from Last Quarter
Robert Kuzman CA Lic
 OFFERING MEMORANDUM 20236 US Highway 18 North, Apple Valley, CA 92307 Exclusively Offered By: NET LEASE INVESTMENT SERVICES Kevin Held kevin.held@cushwake.com +1 858 546 5428 CA Lic. 01240358 Chuck Klein
Research. New product, high rents CLEVELAND 1Q16 INDUSTRIAL MARKET. Current Conditions
 New product, high rents The Greater Cleveland industrial market absorbed 556,046 square feet in the first quarter of 2016, the 14th consecutive quarter of positive tenancy gains for the market. The positive
INDUSTRIAL QUICK STATS SUMMARY & OUTLOOK MARKET TRENDS VACANCY & NET ABSORPTION ECONOMIC STATS. Current Quarter. Direct Vacancy 2.
 LOS ANGELES NORTH INDUSTRIAL THIRD QUARTER 218 QUICK STATS Direct Vacancy 2.3% Overall Vacancy 2.6% Lease Rate NNN $1.1 Gross Absorption Under Construction MARKET TRENDS Current Quarter 1,632,564 SF 595,199
NATIONAL ASSOCIATION of REALTORS RESEARCH DIVISION. Prepared for Florida REALTORS
 NATIONAL ASSOCIATION of REALTORS RESEARCH DIVISION Prepared for Florida REALTORS NATIONAL ASSOCIATION OF REALTORS RESEARCH DIVISION Page 1 Page 3 Page 4 Page 6 Page 7 Page 8 Page 9 Page 10 Page 11 Page
Soaring Demand Drives US Industrial Market to New Heights
 Soaring Demand Drives US Industrial Market to New Heights Capitas (DIFC) Limited I June Issue: 2017 THIS ISSUE COVERS: The Amazon Factor a seismic shift in the way people shop Industrial real estate hitting
TAMI-sector resurgence drives improved quarterly leasing
 Midtown South Manhattan Office, Q3 217 TAMI-sector resurgence drives improved quarterly leasing Leasing Activity 1.14 MSF Net Absorption.9 MSF Availability Rate 1.8% Vacancy Rate 6.9% Average Asking Rent
San Fernando Valley & Ventura County End 2015 On A Positive Note
 OFFICE SAN FERNANDO & MARKET REPORT San Fernando Valley & Ventura County End 2015 On A Positive Note MARKET OVERVIEW MARKET INDICATORS - VACANCY 15.4% NET ABSORPTION 74,400 CONSTRUCTION 120,933 RENTAL
Chicago s industrial market thrives during the third quarter.
 CHICAGO INDUSTRIAL MARKET MONITOR THIRD QUARTER 2015 Chicago s industrial market thrives during the third quarter. Demand across the Chicago industrial market remains high sending absorption up and vacancy
The Improvement of the Industrial Market
 Research & Forecast Report Long Island industrial MARKET Q2 2015 The Improvement of the Industrial Market Rose Liu Research & Financial Analyst Long Island Takeaways The overall economy on Long Island
>> Greater Los Angeles Retail Continues to Witness Declining Vacancy
 Research & Forecast Report GREATER LOS ANGELES RETAIL Accelerating success. >> Greater Los Angeles Retail Continues to Witness Declining Vacancy Greater Los Angeles Retail Market The Los Angeles Basin
MARKET SUMMARY MICHIGAN, METRO DETROIT AREA SECOND QUARTER 2016 P LAN T E M OR AN CRES A. pmcresa.com
 SECOND QUARTER 2016 MICHIGAN, METRO DETROIT AREA MARKET SUMMARY P LAN T E M OR AN CRES A 26300 NORTHWESTERN HIGHWAY SOUTHFIELD, MI 48076 248.223.3500 pmcresa.com Connect with us for more information: Subscribe
Boulder, CO 2nd Quarter 2015 OFFICE. Market Trends COMMERCIAL REAL ESTATE INFORMATION
 Boulder, CO 2nd Quarter 2015 OFFICE Market Trends COMMERCIAL REAL ESTATE INFORMATION Table of Contents/Methodology of Tracked Set Table of Contents/Methodology of Tracked Set 2 Boulder Office Market Map
CONTENTS. Executive Summary 1. Southern Nevada Economic Situation 2 Household Sector 5 Tourism & Hospitality Industry
 CONTENTS Executive Summary 1 Southern Nevada Economic Situation 2 Household Sector 5 Tourism & Hospitality Industry Residential Trends 7 Existing Home Sales 11 Property Management Market 12 Foreclosure
ECONOMIC CURRENTS. Vol. 5 Issue 2 SOUTH FLORIDA ECONOMIC QUARTERLY. Key Findings, 2 nd Quarter, 2015
 ECONOMIC CURRENTS THE Introduction SOUTH FLORIDA ECONOMIC QUARTERLY Economic Currents provides an overview of the South Florida regional economy. The report presents current employment, economic and real
INDUSTRIAL QUICK STATS SUMMARY & OUTLOOK MARKET TRENDS VACANCY & NET ABSORPTION ECONOMIC STATS
 INLAND EMPIRE INDUSTRIAL FOURTH QUARTER 217 QUICK STATS Direct Vacancy 5.1% Overall Vacancy 5.3% Lease Rate NNN $.57 Gross Absorption Under Construction MARKET TRENDS Current Quarter 9,23,744 SF 16,31,563
>> Vacancy Falls To Lowest Rate Ever
 Research & Forecast Report San Gabriel VALLEY INDUSTRIAL Accelerating success. >> Vacancy Falls To Lowest Rate Ever Key Takeaways Market Indicators Relative to prior period Forecast Construction Rental
>> 2016 Off to A Good Start for Tri-Cities
 Research & Forecast Report TRI-CITIES OFFICE Q1 216 Accelerating success. >> 216 Off to A Good Start for Tri-Cities Key Takeaways > The Tri-Cities office market saw vacancy decline for the seventh consecutive
MARKET SUMMARY MICHIGAN, METRO DETROIT AREA FOURTH QUARTER 2016 P LAN T E M OR AN CRES A. pmcresa.com
 FOURTH QUARTER 2016 MICHIGAN, METRO DETROIT AREA MARKET SUMMARY P LAN T E M OR AN CRES A 26300 NORTHWESTERN HIGHWAY SOUTHFIELD, MI 48076 248.223.3500 pmcresa.com Connect with us for more information: Subscribe
Slow Start to the Year as Hollywood Awaits Construction Deliveries
 office CENTRAL LOS ANGELES market report Slow Start to the Year as Hollywood Awaits Construction Deliveries Market overview MARKET indicators - VACANCY 19.1% NET ABSORPTION 24,300 CONSTRUCTION 1,242,600
>> Orange County Vacancy Continues to Decline
 Research & Forecast Report ORANGE COUNTY OFFICE Accelerating success. >> Orange County Continues to Decline Key Takeaways > The South County submarket led the Orange County market in overall net absorption
No Where To Grow. ALBUQUERQUE, NM Q Retail. Research & Forecast Report. Key Takeaways. Market Indicators Relative to prior period
 Research & Forecast Report ALBUQUERQUE, NM Q2 20 Retail No Where To Grow Key Takeaways > > Supply of anchor spaces becoming scarce > > Renovations help to alleviate lack of new projects > > New projects
Miami-Dade County Retail Market Report 3Q Real Capital Partners Real Estate Services. *Data Source CoStar Miami-Dade County Retail Market Report
 Miami-Dade County Retail Market Report 3Q 216 Real Capital Partners Real Estate Services *Data Source CoStar Miami-Dade County Retail Market Report 3Q 216 Miami-Dade County Retail Market Report Overview