Real Estate Update. Loren Gonella. Coldwell Banker Gonella Realty. Presented by:
|
|
|
- Angela Lamb
- 5 years ago
- Views:
Transcription

1 Real Estate Update Presented by: Loren Gonella Coldwell Banker Gonella Realty


2 OVERVIEW
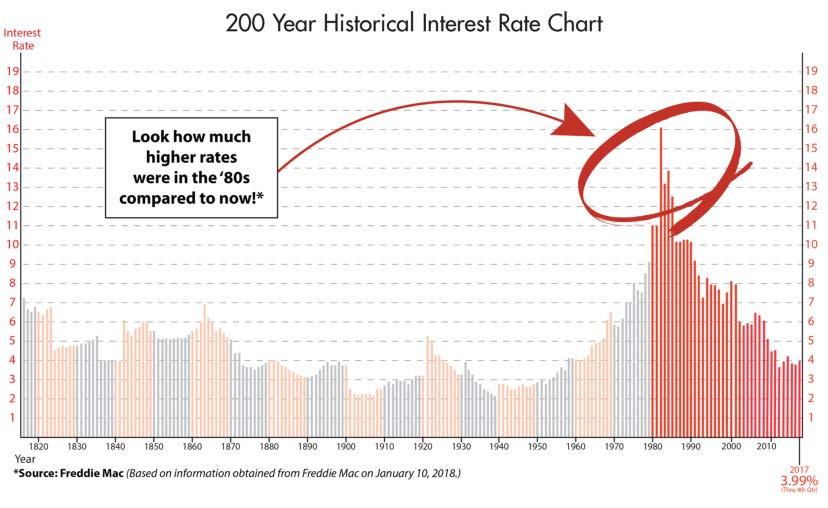
3 Mortgage Rates & Housing Finance
4 Mortgage Rates* 30 Year FHA 4.375% 30 Year Conventional 4.5% 15 Year Conventional 4.125% * All Figures as of 04/16/2018

5
6 National Housing Market
 Median Price (percentage change) 5.")

 561,000 12% $307,800 4.")
7 Existing-Homes Sales Volume (in millons) (percentage change) Median Price (percentage change) % $233, % % $247, % % $259, % New-Home Sales Volume (percentage change) Median Price (percentage change) 561,000 12% $307, % 614, % $315, % 700,000 14% $323, %
8 Housing Supply at the National Level National Mos. Supply Single-family Mos. Supply Condo/Co-ops Mos. Supply
9 California Housing Market Outlook
10 August 2017: $565,330, +2.9% MTM, +7.2% YTY $700,000 P: May-07 $600,000 Aug-16: $527,490 Aug -17: $565,330 $500,000 $400,000 $300,000 T: Feb-09 $245,230-59% from peak $200,000 $100,000 $- SERIES: Median Price of Existing Single Family Homes SOURCE: CALIFORNIA ASSOCIATION OF REALTORS

11 August 2017 Sales: 427,630 Units, 700, % YTD, +1.3% YTY 600, , , , , ,000 - Aug-16: 422,190 Aug-17: 427,630 SERIES: Sales of Existing Single Family Homes SOURCE: CALIFORNIA ASSOCIATION OF REALTORS *Sales are seasonally adjusted and annualized

12 Housing Affordability In CA: 29% Q2: % able to purchase median-priced home SERIES: Housing Affordability Index of Traditional Buyers SOURCE: CALIFORNIA ASSOCIATION OF REALTORS
13 Central Valley Data
14 Central Valley: Peak v. Current Price Region Peak Month Peak Price Aug-17 %Chg Fr Peak Madera County Feb-08 $275,000 $263, % California May-07 $594,530 $565, % San Benito County May-05 $671,190 $600, % Sacramento County Aug-05 $394,450 $348, % Placer County Aug-05 $527,990 $462, % Kings County Mar-06 $268,050 $225, % Tulare County Dec-05 $269,710 $224, % San Joaquin County Jun-06 $426,830 $355, % Fresno County Jun-06 $313,500 $259, % Stanislaus County Sep-05 $370,100 $294, % Kern County Jun-06 $299,920 $235, % Merced County Oct-05 $344,610 $250, % Glenn County Feb-07 $312,500 $225, % SERIES: Median Price of Existing Detached Homes SOURCE: CALIFORNIA ASSOCIATION OF REALTORS
15 Bay Area: Peak v. Current Price Region Peak Month Peak Price Aug-17 %Chg Fr Peak San Francisco May-07 $972,010 $1,380, % San Mateo Oct-07 $1,020,000 $1,375, % Santa Clara Oct-07 $865,000 $1,150, % Alameda May-07 $709,420 $867, % Marin Jun-07 $1,149,390 $1,207, % Sonoma Jan-06 $650,330 $625, % California May-07 $594,530 $565, % Contra Costa May-07 $698,420 $627, % Napa Jun-07 $729,170 $654, % Solano Jun-07 $492,800 $410, % SERIES: Median Price of Existing Detached Homes SOURCE: CALIFORNIA ASSOCIATION OF REALTORS
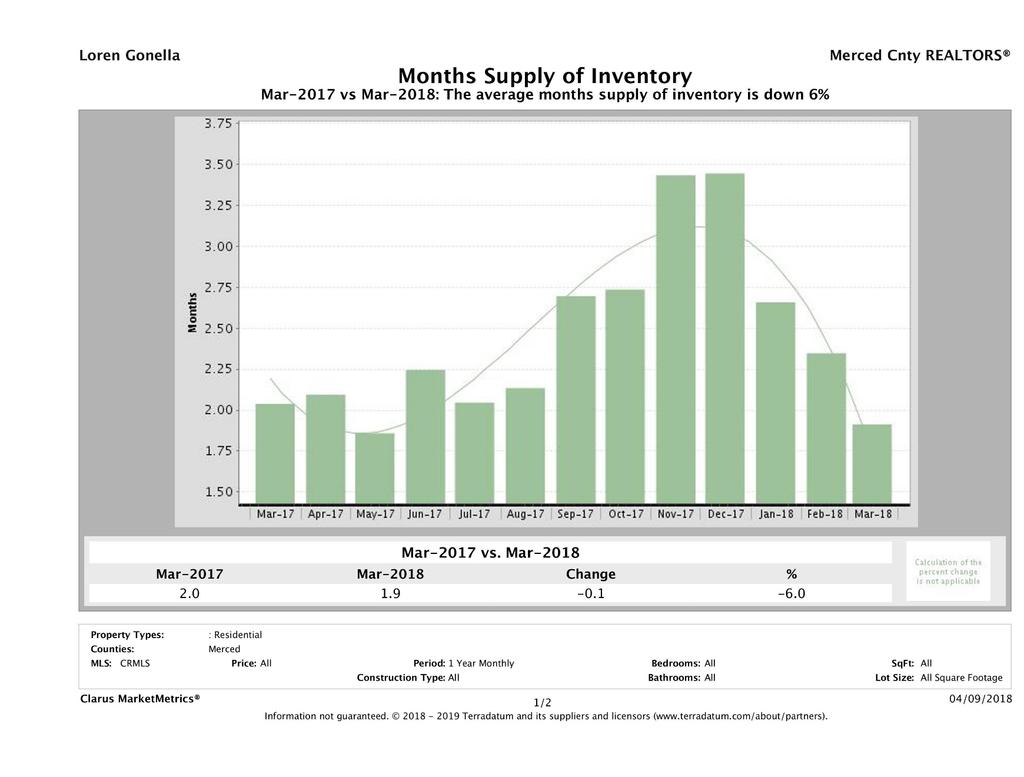
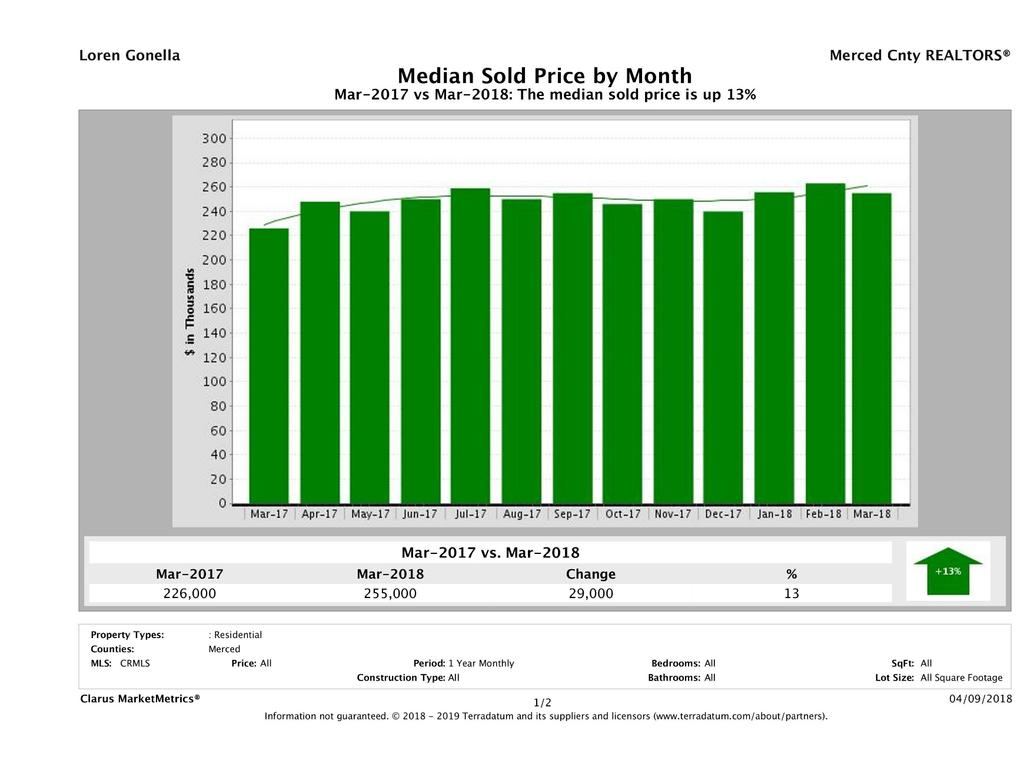
16 Local Market Information
17
18
19
20 Inventory Issues
 Jan-05 Sep-05 May-06 Jan-07 Sep-07 May-08 Jan-09 Sep-09 May-10 Jan-11 Sep-11 May-12 Jan-13 Sep-13 May-14 Jan-15 Sep-15 May-16")

21 August 2017: 2.9 Months; August 2016: 3.4 Months CA Unsold Inventory Index (Months) Jan-05 Sep-05 May-06 Jan-07 Sep-07 May-08 Jan-09 Sep-09 May-10 Jan-11 Sep-11 May-12 Jan-13 Sep-13 May-14 Jan-15 Sep-15 May-16 Jan-17 15% 10% 5% 0% -5% -10% -15% -20% Active listing declining for last 26 months Year-over-Year % Chg -11.9% Jan-15 Mar-15 May-15 Jul-15 Sep-15 Nov-15 Jan-16 Mar-16 May-16 Jul-16 Sep-16 Nov-16 Jan-17 Mar-17 May-17 Jul-17 Note: Unsold Inventory Index represents the number of months it would take to sell the remaining inventory for the month in question. The remaining inventory for the month is defined as the number of properties that were Active, Pending, and Contingent (when available) and divide the sum by the number of Sold properties for the month in question. SERIES: Unsold Inventory Index of Existing Single Family Homes SOURCE: CALIFORNIA ASSOCIATION OF REALTORS

22 August 2017 Active Listing 10% 0% 1.9% -10% -20% -30% -40% -29.0% -17.1% -11.2% -7.6% -7.8% -10.0% -11.5% SERIES: Active Listings of Existing Single Family Homes SOURCE: CALIFORNIA ASSOCIATION OF REALTORS

 and divide the sum by the number of Sold properties for the month in question.")
23 9.0 Bay Area So CA Central Valley Note: Unsold Inventory Index represents the number of months it would take to sell the remaining inventory for the month in question. The remaining inventory for the month is defined as the number of properties that were Active, Pending, and Contingent (when available) and divide the sum by the number of Sold properties for the month in question. SERIES: Unsold Inventory Index of Existing Single Family Homes SOURCE: CALIFORNIA ASSOCIATION OF REALTORS
24 More Single Family Units Now Rentals 8,000,000 7,000,000 6,000,000 5,000,000 4,000,000 3,000,000 2,000,000 1,000,000 0 Potentially between 400,000 and 700,000 SF Rentals that Used to be Owner-Occupied 6,919,164 SF Owners 6,527, ,940,607 SF Renters SOURCE: U.S. Census Bureau, Annual Social and Economic Supplement (ASEC) to the Current Population Survey (CPS) Downloaded from the National Bureau of Economic Research (NBER) 2,674,808
25
26 Median Age: 45 31% Age % Age % Age % 72 and older SERIES: 2017 Housing Market Survey SOURCE: CALIFORNIA ASSOCIATION OF REALTORS


27 Median Age: 57 11% Age % Age % Age % 72 and older SERIES: 2017 Housing Market Survey SOURCE: CALIFORNIA ASSOCIATION OF REALTORS
28 60% % of Sales Above Asking Price 50% 40% 30% 32% 33% 20% Long Run Average = 20% 10% 0% SERIES: 2017 Housing Market Survey SOURCE: CALIFORNIA ASSOCIATION OF REALTORS


29 80% 70% 60% 50% 40% 30% 20% 10% 0% % with Multiple Offers # of Multiple offers (Average) 60% 52% SERIES: 2017 Housing Market Survey SOURCE: CALIFORNIA ASSOCIATION OF REALTORS
30 First-time Buyers Repeat Buyers All Buyers % with Multiple Offer 68.8% 55.5% 60.4% % of Sales Above Asking Price 41% 28.8% 32.9% Days on Market SERIES: 2016 Housing Market Survey SOURCE: CALIFORNIA ASSOCIATION OF REALTORS

31 35% % of All Cash Sales 30% 25% 20% 22% 15% 10% One-fifth of buyers paid with all cash The share of all cash buyers is virtually unchanged in the last 4 years 5% 0% SERIES: 2017 Housing Market Survey SOURCE: CALIFORNIA ASSOCIATION OF REALTORS


32 % to Total Sales 30% 25% Vacation/Second Home Vs. 20% 4.1% 15% Flip Rent 10% 5% 0% 13.8% : 30% 2015: 26% 2016: 20% 2017: 24% 2014: 70% 2015: 74% 2016: 80% 2017: 76% SERIES: 2017 Housing Market Survey SOURCE: CALIFORNIA ASSOCIATION OF REALTORS

33 Years Owned Home Before Selling 11 Long-Time Homeowners are not moving as in the past because: Capital gains hit Low property taxes Low rate on current mortgage Where can I afford to go? Remodel and stay SERIES: 2017 Housing Market Survey SOURCE: CALIFORNIA ASSOCIATION OF REALTORS

34 Senior homeowners can transfer their Pro.13 tax base to a home of any price, anywhere in the state, any number of times.

35 What do you think will happen for the CA market in 2018? 80% 70% 60% 50% 40% 30% 20% 10% 0% 64% 29% 7% SERIES: 2017 EXPO FUN SURVEY SOURCE: C.A.R. Up 45% 42% 39% 30% 24% 19% 64% 33% 3% Home prices Home Sales Inventory Mortgage interest rates 72% 21% 8% Affordability
36 New Construction
 Student Life Facilities 1,700 Student Residential bed 1,500")
37 UC MERCED 2020 PROJECT 1.2 million square feet project will delivered in phases between 2018 and 2020 Academic and Research Space (Wet, Dry and Computational Labs) Student Life Facilities 1,700 Student Residential bed 1,500 Parking Spaces NCAA-II Competition Pool Conference Center Wellness Center Competition Recreation Field Early Childhood Education Center Expansion Dining Facility LEED Gold, 1.2 million gross square foot project will be delivered in phases between 2018 and 202 and includes: NCAA-II competition pool The mixed-use, LEED Gold, 1.2 million gross square foot project will be delivered in phases between 2018 and 2020 Conference and includes: Center Wellness Center Competition Recreation Field Early Childhood Education Center Expansion Dining Facility
38 Financial Impact of UC Merced 2020 Project Student SpendingCurrent Student Monthly Spending $1,309 a month x 7,967 students = $10,428,803 a month x 9 months = $10,428,803 a month $93,859,227 a year After Expansion- Student Monthly Spending $1,309 a month x 10,000 students= $13,090,000 a month x 9 months = $13,090,000 a month $117,810,000 a year Current Payroll- Payroll After Expansion- Rough Estimates of Faculty Payroll Annually $15.4 million per month $20 million per month


39 New SFR by Year City of Merced City of Atwater Merced County- Unincorporated City of Merced City of Atwater Merced County- Unincorporated


40 New SFR Permits- 4 city comparison Merced Merced Atwater Fresno Modesto Stockton County City
41 Lennar Homes Bonadelle Homes Stonefield Home Wathen Yosemite Grove Legacy Homes K. Hovananian Homes RM Covington Homes Stone Creek Ramson Piro Las Casas
42 City of Merced- Recent Development Projects Stanton Optical CVS (Relocation) Aces & Kings Cheesesteaks ASIP Coffe Roasters T-mobile (W. 16 th St.) Rapid Express Car Wash Rockin Jump Trampoline Park D Bride The Mattress Store Agave Mexican Store Love Express (Merced Mall) Popeye s Louisiana Kitchen Bobcat Diner
43 Opening in 2018 The Chocolate Dipper (Merced Theatre) Arco AM/PM ( Parsons & Childs Ave) Kentucky Fried Chicken (Parsons & Childs Ave) Marriot TownPlace Suites UCM Downtown Campus Center El Capitan hotel Renovation project Kick-off Prime Shine Car Wash Merced Mall Renovation & Expansion (Entitlement kick-off) Gateway Retail Center (Groundbreaking) More projects are underway, but are at the planning stages.


44 In the Near Future Merced Mall Renovations & Expansion Planning to expand by 90,000 sq. ft. 21,000 sq. ft. of retail and restaurants Theatre 3,000 sq. ft. New Downtown Investments -El Capitan Hotel Broke ground Jan. 31, 2018 Finish product- 110 room Boutique Hotel, 39 rooms are existing, remaining are new. Also includes a café, restaurant and meeting space. -Mainzer Theatre Construction will begin when El Capitan is almost finished. This will be more of a face lift and when finished you will have a theatre, restaurant, and a live performance classroom for activities.
45 Rental Market

46 Residential Rental Market 2017 Rents have continued to increase and the inventory has decreased. For example: 4bd/2ba, 2,000 sq. ft. North Merced home is $1,300-$1,400 a mth We believe inventory will be tight. There are more apartments available than single family homes. UC Merced students in previous years would move out, now they rent year around. Rental Units to be constructed in fiscal year Rental Units to be constructed in fiscal year Currently we are on target for this year.

47 2017 Conti. North Merced- SFR 3bd sq. ft., $1,200-$1,350 4bd- 2,100 sq. ft., $1,400-$1,500 Monthly Rent of $1,500 a month at 4.25% for 30 years would give you a loan of $304,015.
48 Commercial Market
49 NSJV per-capita income has been falling behind since the 1980 s. The 3-county region had per-capita income 10% above the U.S. average in the 1970 s, similar to the Bay Area. Per-capita income is now 15% below the U.S. average.
50 SHOPPING CENTERS 2017 Not a lot to talk about Ross, TJ Maxx, and Marshals tend to be doing okay other companies like Labels for Less are having a hard time. Not a lot of new retail uses, some examples coming from Northern California Sportmans Warehouse and 5 Below which is similar to a Dollar Store. Amazon is killing retailers, in order to survive retailers have to do online and in store sales. Target is putting in a pickup area where you can pick up online orders in their stores. Good retailers will survive, good shopping centers will survive. In the Valley retailers are not taking any chances, the project has to make money from day one, retailers going in on their own terms, in the bay area they may take risk if they have been trying to get in there for a long time Gateway Project Downtown Merced Wathen Project
51 18 biggest bankruptcies of the 'retail apocalypse' of Toys R Us 2. Charming Charlie 3. Styles for Less 4. Aerosoles 5. Vitamin World 6. Perfumania 7. Gymboree 8. Alfred Angelo Bridal 9. The Limited 10. True Religion 11. Rue Payless 13. Radio Shack 14. Gander Mountain 15. Gordmans 16. Hhgregg 17. BCBG 18. Wet Seal

52 Office Space Office Sales Office rents were flat. Inventory decreased many spaces were leased. Medical Office space is practically nonexistent. There is plenty of general office space. Rents for North Merced $1.25-$1.50 a foot. Medical Space $1.50-$1.60 Downtown retail number of space leased up last year. UC Merced will help fill downtown.

53 Industrial Space 2017 We leased up a lot of space. We are running out of product. 6-7 years ago we had 1.5 million free sq. ft. to lease, today less than 300K sq. ft. Do to lack of available space we have increased rents. Cannabis shops are looking for space causing rents to increase.
54 Agricultural Properties 2017 Commodity Prices have softened Still good demand for farm ground Water and water sources are the main concern. Low Inventory More demand than supply Market peaked in the 1 st qtr. Of Going forward more of the same. Commodity prices remain softened San Joaquin Valley s good water may contain value. Almond prices 30-35K a acre Almonds with good production have two sources of water Row crop land for example: Sweet Potatoes K a acre if they have good sources of water
55 Summary Info
56 SUMMARY Residential Prices are continuing to increase, however at a slower pace. New Construction continues to increase, units continue to increase. Rental market- rents are increasing, inventory is tight. Shopping Centers & Retail stayed about the same as last year, new Gateway project coming online this year. Office Space Demand is increasing, rents are starting to firm a little. Industrial Inventory is low, rents are increasing. Agriculture: commodity prices have softened, prices are holding, water is the key.
57
California Housing Market Update. Monthly Sales and Price Statistics October 2018
 California Housing Market Update Monthly Sales and Price Statistics October 2018 Sales Had the 2 nd Largest Drop in the Last 6 Months California, October 2018 Sales: 397,060 Units, -3.7% YTD, -7.9% YTY
California Housing Market Update. Monthly Sales and Price Statistics November 2018
 California Housing Market Update Monthly Sales and Price Statistics November 2018 Home Sales: Largest Decline Since 2014 California, November 2018 Sales: 381,400 Units, -4.6% YTD, -13.4% YTY 700,000 600,000
California Housing Market Update. Monthly Sales and Price Statistics August 2018
 California Housing Market Update Monthly Sales and Price Statistics August 2018 Sales Declined for the 4 th Consecutive Month California, August 2018 Sales: 399,600 Units, -2.1% YTD, -6.6% YTY 700,000
California Housing Market Update. Monthly Sales and Price Statistics December 2018
 California Housing Market Update Monthly Sales and Price Statistics December 2018 Sales Reached the Lowest Level since Jan 2015 California, December 2018 Sales: 372,260 Units, -5.2% YTD, -11.6% YTY 700,000
California Housing Market Update. Monthly Sales and Price Statistics September 2018
 California Housing Market Update Monthly Sales and Price Statistics September 2018 Sales Had the Largest Decline since March 2014 California, September 2018 Sales: 382,550 Units, -3.3% YTD, -12.4% YTY
Economic and Housing Market Outlook ( ) October 31, Contra Costa AOR
 October 31, Contra Costa AOR") Economic and Housing Market Outlook (2012 2013) Contra Costa AOR October 31, 2012 Oscar Wei Senior Research Analyst California Association of REALTORS Overview US and California Economies California Housing
Economic and Housing Market Outlook (2012 2013) Contra Costa AOR October 31, 2012 Oscar Wei Senior Research Analyst California Association of REALTORS Overview US and California Economies California Housing
California Housing Market Update. Monthly Sales and Price Statistics May 2018
 California Housing Market Update Monthly Sales and Price Statistics May 2018 Sales Lost Momentum as Mortgage Rates Continued to Climb California, May 2018 Sales: 409,270 Units, +0.3% YTD, -4.6% YTY 700,000
California Housing Market Update. Monthly Sales and Price Statistics January 2018
 California Housing Market Update Monthly Sales and Price Statistics January 2018 Sales Started with a Slight Decrease California, Jan. 2018 Sales: 388,800 Units, -2.9% YTD, -2.9% YTY 700,000 600,000 500,000
Leslie Appleton-Young Chief Economist & Vice President
 Leslie Appleton-Young Chief Economist & Vice President 2017 Forecast Report Card 2016 Actual 2017 Forecast 2017 Projected SFH Resales (000s) 416.7 413.0 421.9 % Change 1.8% 1.4% 1.3% Median Price ($000s)
2019 Housing Market Forecast. Palos Verdes Peninsula AOR January 8, 2019 Jordan G. Levine Senior Economist
 2019 Housing Market Forecast Palos Verdes Peninsula AOR January 8, 2019 Jordan G. Levine Senior Economist Overview Good News: Economic fundamentals solid Homeownership still the dream Rates might not go
2018 Housing Market Outlook. Central Coast Realty Group Business Symposium February 22, 2018 Oscar Wei Senior Economist
 2018 Housing Market Outlook Central Coast Realty Group Business Symposium February 22, 2018 Oscar Wei Senior Economist Overview Economic Update California Housing Market Outlook Regional Housing Market
CALIFORNIA ECONOMIC & MARKET OUTLOOK. October 29,2014 Contra Costa Association of REALTORS Leslie Appleton Young, Chief Economist
 2014 2015 CALIFORNIA ECONOMIC & MARKET OUTLOOK October 29,2014 Contra Costa Association of REALTORS Leslie Appleton Young, Chief Economist OVERVIEW Economic Outlook California Housing Market Outlook Housing
Orange County AOR October 21, 2016 Leslie Appleton-Young Chief Economist & Vice President
 Orange County AOR October 21, 2016 Leslie Appleton-Young Chief Economist & Vice President lesliea@car.org Cadence of Accountability How did I do with last year s forecast? 2016 Story US economic and job
Contra Costa AOR October 26, 2016 Leslie Appleton-Young Chief Economist & Vice President
 Contra Costa AOR October 26, 2016 Leslie Appleton-Young Chief Economist & Vice President lesliea@car.org Cadence of Accountability How did I do with last year s forecast? 2016 Story US economic and job
CALIFORNIA ECONOMIC & MARKET OUTLOOK. October 29,2014 SILVAR Leslie Appleton-Young, Chief Economist
 2014-2015 CALIFORNIA ECONOMIC & MARKET OUTLOOK October 29,2014 SILVAR Leslie Appleton-Young, Chief Economist OVERVIEW Economic Outlook California Housing Market Outlook Housing Affordability Regional Market
2016 ECONOMIC AND HOUSING MARKET FORECAST
 2016 ECONOMIC AND HOUSING MARKET FORECAST April 06, 2016 San Francisco Association of REALTORS Oscar Wei, Senior Economist of C.A.R. OVERVIEW Economic Outlook California Housing Market Outlook Regional
Housing Affordability in California
 Housing Affordability in California Households with a High Housing Cost Burden: 2013 Definition: Estimated percentage of households that spend 30% or more of household income on housing costs. The U.S.
Santa Cruz County AOR Seascape Golf Club October 7, 2016 Leslie Appleton-Young Chief Economist & Vice President
 Santa Cruz County AOR Seascape Golf Club October 7, 2016 Leslie Appleton-Young Chief Economist & Vice President 12 Free Hours of Online CE Courses! 2016 C.A.R. Member Benefit Delivered 580,000+ Hours Take
CALIFORNIA FORECLOSURE ACTIVITY MIXED
 CALIFORNIA FORECLOSURE ACTIVITY MIXED Foreclosure delays may be behind current peak in foreclosure activity Discovery Bay, CA, September 16, 2008 ForeclosureRadar (www.foreclosureradar.com), the only website
Santa Clara County Real Estate Market Overview Dynamics
 Santa Clara County Real Estate Market Overview Dynamics Data from sources deemed reliable, but may contain errors and subject to revision. All numbers should be considered approximate. Jan-90 Sep-90 May-91
November 1, 2016 Sacramento AOR Membership Meeting Oscar Wei, Senior Economist of C.A.R.
 November 1, 2016 Sacramento AOR Membership Meeting Oscar Wei, Senior Economist of C.A.R. Overview Economic Outlook California Housing Market Outlook Regional Housing Market Outlook 2017 Forecast Economic
Realty Executives Santa Clarita November 17, 2016 Leslie Appleton-Young Chief Economist & Vice President
 Realty Executives Santa Clarita November 17, 2016 Leslie Appleton-Young Chief Economist & Vice President lesliea@car.org Nobody had it priced in and the uncertainty Is absolutely enormous Every Wall Street
Real gross domestic product California vs. United States
 Real gross domestic product California vs. United States Percent change, year ago 6 4 U.S. California 2 0-2 -4-6 2001 2002 2003 2004 2005 2006 2007 2008 2009 2010 2011 Source: Bureau of Economic Analysis.
Monthly Indicators + 7.3% + 6.6% + 8.3% Single-Family Market Overview Condo Market Overview New Listings Pending Sales.
 Monthly Indicators 2018 The three most prominent national market trends for residential real estate are the ongoing lack of abundant inventory, the steadily upward movement of home prices and year-over-year
2019 Economic & Market Forecast. REImagine October 11, 2018 Leslie Appleton-Young SVP & Chief Economist
 2019 Economic & Market Forecast REImagine October 11, 2018 Leslie Appleton-Young SVP & Chief Economist 2008 The CA Housing Market Recovery 100% 90% 80% 70% 60% 50% 40% 30% 20% 10% 0% Equity Sales Short
2013 Housing Market Forecast. SILVAR: Los Gatos/Saratoga District October 10, 2012 Leslie Appleton-Young, Vice President & Chief Economist
 2013 Housing Market Forecast SILVAR: Los Gatos/Saratoga District October 10, 2012 Leslie Appleton-Young, Vice President & Chief Economist What we saw from the roof.. C.A.R. NAR THE ECONOMY Recent Housing
Monthly Indicators % % %
 Monthly Indicators 2016 Percent changes calculated using year-over-year comparisons. New Listings were down 27.6 percent for single family homes and 41.8 percent for townhouse-condo properties. Pending
MARKET OUTLOOK FOR SAN MATEO
 MARKET OUTLOOK FOR SAN MATEO Jonathan Smoke Chief Economist August 2, 2016 NATIONAL TRENDS 2 JOB CREATION REBOUNDED IN JUNE 229,000 jobs created by month in 2015; 172,000 average this year Employment and
California Economic Policy: Lawns and Water Demand in California
 California Economic Policy: Lawns and Water Demand in California Data Box and Appendix Ellen Hanak Matt Davis July 2006 Data Box: Using County Assessor Data to Measure Trends in Single Family Lot Sizes
Monthly Indicators % + 9.7% %
 Monthly Indicators 2016 Percent changes calculated using year-over-year comparisons. New Listings were up 11.1 percent for single family homes and down 30.8 percent for townhouse-condo properties. Pending
$ FACTS ABOUT CALIFORNIA: WAGE HOUSING MOST EXPENSIVE AREAS WAGE RANKING
 STATE #3 * RANKING In California, the Fair Market Rent () for a two-bedroom apartment is $1,699. In order this level of and utilities without paying more than 30% of income on housing a household must
Monthly Indicators % % - 9.2%
 Monthly Indicators 2016 New Listings were down 1.4 percent for single family/duplex homes and 25.0 percent for townhouse-condo properties. Pending Sales increased 58.3 percent for single family/duplex
Monthly Indicators % % - 3.5%
 Monthly Indicators 2017 New Listings were up 6.3 percent for the category but decreased 33.1 percent for the category. Pending Sales increased 5.0 percent for but decreased 1.3 percent for. The Median
2018 Real Estate Forecast Breakfast. Real Estate Market Update
 2018 Real Estate Forecast Breakfast Central Oregon Association of REALTORS Real Estate Market Update Paul C. Bishop, PhD, CBE Vice President, Research NATIONAL ASSOCIATION OF REALTORS February 22, 2018
INVESTORS PURCHASE RECORD NUMBER OF FORECLOSURES AT AUCTION
 INVESTORS PURCHASE RECORD NUMBER OF FORECLOSURES AT AUCTION April Foreclosure Notices Drop from March Record Levels Discovery Bay, CA, May 12, 2009 ForeclosureRadar (www.foreclosureradar.com), the only
SFR Condo Residential Lot Sales Inventory Sales Inventory Sales Inventory. Month YTD Month Month YTD Month Month YTD Month
 Grand Strand Market Report 2017 capped off a great year for the Grand Strand as full year SFR sales volume and median sales price were up 9.8% and 4.3%, respectively. Condo sales activity increased 3.0%
Greater Las Vegas Snapshot by Sale Type
 9.% Closed Sales Trend by Type December Closings by Type 8.% 7.% 6.% 8% Short Sales 1% 5.% 4.% 3.% Traditional Equity 82% 2.% 1.%.% Greater Las Vegas Snapshot by Sale Type - SFR Only Available List Price
THE OUTLOOK FOR HOUSING IN ILLINOIS
 THE OUTLOOK FOR HOUSING IN ILLINOIS Jonathan Smoke Chief Economist January 25, 2017 NATIONAL TRENDS 2 2000.01 2000.05 2000.09 2001.01 2001.05 2001.09 2002.01 2002.05 2002.09 2003.01 2003.05 2003.09 2004.01
2017 RESIDENTIAL REAL ESTATE MARKET REPORT
 2017 RESIDENTIAL REAL ESTATE MARKET REPORT Published January 26, 2018 Our market reports have been focused on the effects of low inventory on our housing market and for good reason. December 2017 marked
2018 Housing Market Outlook. California Desert Association of REALTORS October 19, 2017 Jordan G. Levine Economist
 2018 Housing Market Outlook California Desert Association of REALTORS October 19, 2017 Jordan G. Levine Economist jordanl@car.org Overview Post-Election Outlook Starting 2017 with a bang! Lots of uncertainty
Monthly Indicators + 4.8% - 3.5% %
 Monthly Indicators 2015 New Listings were up 45.0 percent for single family/duplex homes but decreased 44.1 percent for townhouse-condo properties. Pending Sales increased 14.3 percent for single family/duplex
San Francisco Bay Area to Santa Clara & San Benito Counties Housing and Economic Outlook
 San Francisco Bay Area to 019 Santa Clara & San Benito Counties Housing and Economic Outlook Bay Area Economic Forecast Summary Presented by Pacific Union International, Inc. and John Burns Real Estate
MONTGOMERY COUNTY JANUARY 2019 MARKET IN A MINUTE A SUMMARY OF MARKET CONDITIONS FOR DECEMBER & 4TH QUARTER 2018
 STATPAK MONTGOMERY COUNTY JANUARY 2019 McEnearney.com MARKET IN A MINUTE A SUMMARY OF MARKET CONDITIONS FOR DECEMBER & 4TH QUARTER 2018 Contract activity in December 2018 was down 10.1% from December 2017
Oakland Chamber of Commerce 2015 Economic Development Summit The Oakland Advantage. Garrick Brown. Commercial Market Overview
 Oakland Chamber of Commerce 2015 Economic Development Summit The Oakland Advantage Garrick Brown Commercial Market Overview Oakland Convention Center Oakland, CA March 20, 2015 Vice President, Research
MLS of Greater Cincinnati - Charts for the Month: November 2017
 MLS of Greater Cincinnati - Charts for the Month: November 2017 The following charts provide an overview of what has occurred in the MLS over the past month. Each chart provides a historical trend. The
Investment without Displacement: Neighborhood Stabilization
 Investment without Displacement: Neighborhood Stabilization MIRIAM ZUK, PH.D. UC BERKELEY ANNA CASH PAIGE DOW JUSTINE MARCUS Bay Area on the Rise $100,000 Per Capita GDP (Current US $) $90,000 $80,000
San Francisco Bay Area to Napa County Housing and Economic Outlook
 San Francisco Bay Area to 019 Napa County Housing and Economic Outlook Bay Area Economic Forecast Summary Presented by Pacific Union International, Inc. and John Burns Real Estate Consulting, LLC On Nov.
2019 Economic & Market Forecast. Santa Clara County Association of Realtors November 16, 2018 Leslie Appleton-Young SVP & Chief Economist
 2019 Economic & Market Forecast Santa Clara County Association of Realtors November 16, 2018 Leslie Appleton-Young SVP & Chief Economist Value of Strategic Thinking: You will be surprised by the future,
FALLON CHURCHILL COUNTY, NEVADA RESIDENTIAL REAL ESTATE TRACKING REPORT
 FALLON CHURCHILL COUNTY, NEVADA RESIDENTIAL REAL ESTATE TRACKING REPORT 1st QUARTER 2016 BOB GETTO, C.R.S. & S.F.R. Nevada real estate broker, Lic # 16039 Council of Residential Specialists certified,
BONDREPORT QTR BONDREPORT QTR BONDNEWYORK.COM
 BONDREPORT QTR 4 2017 WELCOME TO THE 19 TH EDITION OF THE BOND REPORT It has been quite the year on many fronts, and by all indications, 2017 has no intention of going quietly. The market has continued
FALLON CHURCHILL COUNTY, NEVADA RESIDENTIAL REAL ESTATE TRACKING REPORT
 FALLON CHURCHILL COUNTY, NEVADA RESIDENTIAL REAL ESTATE TRACKING REPORT 3rd QUARTER 15 BOB GETTO, C.R.S. & S.F.R. Nevada real estate broker, Lic # 16039 Council of Residential Specialists certified, National
Investment without Displacement: Increasing the Affordable Housing Supply
 Investment without Displacement: Increasing the Affordable Housing Supply MIRIAM ZUK, PH.D. UC BERKELEY ANNA CASH PAIGE DOW JUSTINE MARCUS Bay Area on the Rise $100,000 Bay Area Gross DomesDc Product (GDP)
REGIONAL. Rental Housing in San Joaquin County
 Lodi 12 EBERHARDT SCHOOL OF BUSINESS Business Forecasting Center in partnership with San Joaquin Council of Governments 99 26 5 205 Tracy 4 Lathrop Stockton 120 Manteca Ripon Escalon REGIONAL analyst april
MARKET IN A MINUTE A SUMMARY OF MARKET CONDITIONS FOR SEPTEMBER & 3rd QUARTER 2017
 STATPAK LOUDOUN COUNTY OCTOBER 2017 McEnearney.com MARKET IN A MINUTE A SUMMARY OF MARKET CONDITIONS FOR SEPTEMBER & 3rd QUARTER 2017 Contract activity in September 2017 was up just 0.6% from September
Western Economic Developments
 IN THIS ISSUE F E D E R A L R E S E R V E B A N K O F S A N F R A N C I S C O Western Economic Developments Office market slumps, housing demand remains strong in District Figure, panel B: Commercial office
MONTGOMERY COUNTY APRIL 2018
 STATPAK MONTGOMERY COUNTY APRIL 2018 McEnearney.com MARKET IN A MINUTE A SUMMARY OF MARKET CONDITIONS FOR MARCH 2018 Contract activity in March 2018 was down 6.0% from March 2017, and there were decreases
657 S Belvoir South Euclid, OH Mark Khuri
 657 S Belvoir South Euclid, OH 44121 Overview Property Type: Multi-Family Size: 6,612 sq ft Sale Price: $499,000 # of Units: 8 Year Built: 1972 # of Stories: 2 Construction: Brick Parking Type: Covered
San Francisco Bay Area to Marin, San Francisco, and San Mateo Counties Housing and Economic Outlook
 San Francisco Bay Area to 019 Marin, San Francisco, and San Mateo Counties Housing and Economic Outlook Bay Area Economic Forecast Summary Presented by Pacific Union International, Inc. and John Burns
STATPAK MARKET IN A MINUTE A SUMMARY OF MARKET CONDITIONS FOR FEBRUARY McEnearney.com CONTRACTS URGENCY INDEX INVENTORY INTEREST RATES
 STATPAK LOUDOUN COUNTY MARCH 2018 McEnearney.com MARKET IN A MINUTE A SUMMARY OF MARKET CONDITIONS FOR FEBRUARY 2018 Contract activity in February 2018 was almost unchanged, up just 0.2% from February
July 2012 was $162,256. ($153,956). was $314,607. was $172,488. ($164,426). Kansas City Region Average Sales Price - Existing Homes
. was $314,607. was $172,488. ($164,426). Kansas City Region Average Sales Price - Existing Homes") July 212 Kansas City Regional Real Estate Market Report Average Sales Price The average exis ng home sale price in July 212 was $162,256. 25 Kansas City Region Average Sales Price - Existing Homes July
July 212 Kansas City Regional Real Estate Market Report Average Sales Price The average exis ng home sale price in July 212 was $162,256. 25 Kansas City Region Average Sales Price - Existing Homes July
Monthly Market Watch for the Prescott Quad City Area. Provided by Keller Williams Check Realty Statistics from August 2012 Prescott MLS
 August 2012 Monthly Market Watch for the Prescott Quad City Area Provided by Keller Williams Check Realty Statistics from August 2012 Prescott MLS Report Overview: This report includes MLS data for the
843 N Yosemite Street Stockton, California 95210
 OFFERING MEMORANDUM Yosemite Court Apartments 16-Unit Multifamily Investment Opportunity 843 N Yosemite Street Stockton, California 95210 INVESTMENT CONTACTS: Colton Toste Associate +1 209 752 0296 colton@naibenchmark.com
ECONOMIC CURRENTS. Vol. 3, Issue 1. THE SOUTH FLORIDA ECONOMIC QUARTERLY Introduction
 ECONOMIC CURRENTS THE SOUTH FLORIDA ECONOMIC QUARTERLY Introduction Economic Currents provides an overview of the South Florida regional economy. The report contains current employment, economic and real
Anna Maria Luxury Real Estate March 2018 Newsletter
 Anna Maria Luxury Real Estate March 218 Newsletter Two months into 218 looks to be another good start for the year. February 28, 21 Y.T.D. Anna Maria Island property sales were; 58(Single Family Homes
LUXURY MARKET REPORT. - January
 LUXURY MARKET REPORT - January 2018 - www.luxuryhomemarketing.com THIS IS YOUR LUXURY MARKET REPORT MAP OF LUXURY RESIDENTIAL MARKETS Welcome to the Luxury Market Report, your guide to luxury real estate
Offering Memorandum :
 Investment Opportunity Multi Tenant Leased Downtown Merced 1729-1735 Canal Street, Merced, CA 95340 Offering Memorandum : Commercial Brokerage P: (800)277-5732 E: info@mercedyosemite.com CA BRE License
MARKET IN A MINUTE A SUMMARY OF MARKET CONDITIONS FOR MARCH & 1st QUARTER 2016
 STATPAK ` WASHINGTON, DC APRIL 2016 MARKET IN A MINUTE A SUMMARY OF MARKET CONDITIONS FOR MARCH & 1st QUARTER 2016 Contract activity in March 2016 was up 12.6% from March of 2015, and there were increases
1200 Premier Drive, Suite 140 Chattanooga, TN Each office is independently owned and operated.
 THIS MONTH IN REAL ESTATE K im aulston R REALTOR 1200 Premier Drive, Suite 140 Chattanooga, TN 37421 Each office is independently owned and operated. Cell: 423-316-4022 Office: 423-664-1600 Email: kcraulston@gmail.com
M onthly arket. July Table of Contents. Monthly Highlights
 Table of Contents Market Inventory...2 www.gaar.com Monthly Highlights The median sale price of single-family, detached homes climbed to $190,000 in July 2014, the highest level since August 2008. Market
Puerto Rico Housing Finance Authority Housing Stimulus Programs
 Puerto Rico Housing Finance Authority Housing Stimulus Programs March 31, 2012 (Final with US Data) Total sales assisted by PRHFA stimulus from $240MM Fund Assignment As of March 31, 2012 Silent Second
SINGLE HOUSING FORECAST
 SINGLE HOUSING FORECAST Harper Lee Collins RE/MAX Heritage WHERE IS THE NATIONAL MARKET NOW? National Association of Realtors: November 2011 November 2012 Total Sales: Up 14.5% Median Price: Up 10.1% Pending
NORTHERN VIRGINIA NOVEMBER 2017
 STATPAK NORTHERN VIRGINIA NOVEMBER 2017 McEnearney.com MARKET IN A MINUTE A SUMMARY OF MARKET CONDITIONS FOR OCTOBER 2017 Contract activity in October 2017 was up 3.8% from October 2016, and there were
Phoenix, Central and Northern Arizona
 Phoenix, Central and Northern Arizona End of Year Housing Report 1-8-354-5664 LongRealty.com 217 End of Year Housing Report SALES & INVENTORY Housing market trends For the overall real estate market in
STATPAK MARKET IN A MINUTE A SUMMARY OF MARKET CONDITIONS FOR OCTOBER McEnearney.com CONTRACTS URGENCY INDEX INVENTORY INTEREST RATES
 STATPAK LOUDOUN COUNTY NOVEMBER 2018 McEnearney.com MARKET IN A MINUTE A SUMMARY OF MARKET CONDITIONS FOR OCTOBER 2018 Contract activity in October 2018 was down 7.6% from last October and was down in
Coachella Valley Median Detached Home Price Jan Jan 2017
 The Desert Housing Report Median Price $450,000 Coachella Valley Median Detached Home Price Jan 2002 - Jan 2017 $400,000 $350,000 $300,000 $250,000 $335,000 $340,000 $200,000 $150,000 CV Detached Median
August 2015 Washington, DC Market Trends Report Limited supply, high demand continue pushing prices to record highs
 FOR IMMEDIATE RELEASE Contact: Bobette Banks 301-590-8764 Director of Communications Greater Capital Area Association of REALTORS bbanks@gcaar.com August 2015 Washington, DC Market Trends Report Limited
The Market Watch Monthly Housing Report. Coachella Valley Median Detached Home Price Dec Dec 2016
 The Market Watch Monthly Housing Report Median Price $450,000 Coachella Valley Median Detached Home Price Dec 2002 - Dec 2016 $400,000 $350,000 $300,000 $339,930 $340,000 $250,000 $200,000 $150,000 CV
NORTHERN VIRGINIA MARCH 2017
 STATPAK NORTHERN VIRGINIA MARCH 2017 McEnearney.com MARKET IN A MINUTE A SUMMARY OF MARKET CONDITIONS FOR FEBRUARY 2017 Contract activity in February 2017 was up 4.0% from February 2016, and there were
Ventura County. Economic Profile. November 2008
 Ventura County Economic Profile November 2008 The copyright laws of the United States (Title 17 U.S. Code) forbid the unauthorized reproduction of this report by any means, including facsimile or computerized
The Greater Reno-Tahoe Real Estate Report
 February, 2018February, 2018 February, 2018 Issue The Greater Reno-Tahoe Real Estate Report Housing Market Trends for: Reno, Sparks, Carson City, Carson Valley, Lake Tahoe, Dayton, and Fernley A FREE monthly
MONTGOMERY COUNTY MAY 2018
 STATPAK MONTGOMERY COUNTY MAY 2018 McEnearney.com MARKET IN A MINUTE A SUMMARY OF MARKET CONDITIONS FOR APRIL 2018 Contract activity in April 2018 was up just 0.9% from, but there were increases in four
REAL ESTATE AND THE ECONOMIC OUTLOOK THROUGH 2013:
 1 1 REAL ESTATE AND THE ECONOMIC OUTLOOK THROUGH 2013: Coping With A Different Kind Of Housing Recovery A Presentation To The Commercial Real Estate Education Summit Monrovia, California July 13, 2012
Tri-Cities Insider September 2015
 Tri-Cities Insider Your Current Real Estate Market 1 Go to: http://grouponetricities.com click on this logo to view market info each month. 2 3 Yearly Comparisons- Real Trends July/June 2015 Housing Market
2013 San Diego Economic Outlook. 29 th Annual Economic Roundtable Marney Cox Chief Economist San Diego Association of Governments January 25, 2013
 213 San Diego Economic Outlook 29 th Annual Economic Roundtable Marney Cox Chief Economist San Diego Association of Governments January 25, 213 US The Problem Slow Economic Growth Gross Domestic Product
LUXURY MARKET REPORT. - February
 LUXURY MARKET REPORT - February 2018 - www.luxuryhomeing.com THIS IS YOUR LUXURY MARKET REPORT MAP OF LUXURY RESIDENTIAL MARKETS Welcome to the Luxury Report, your guide to luxury real estate market data
LUXURY MARKET REPORT. - March
 LUXURY MARKET REPORT - March 2018 - www.luxuryhomemarketing.com THIS IS YOUR LUXURY MARKET REPORT MAP OF LUXURY RESIDENTIAL MARKETS Welcome to the Luxury Market Report, your guide to luxury real estate
Jackson County Residental Market Trends. February Pending Sales New Listings
 Jackson County Residental Market Trends February 2017 Pending Sales..2 New Listings..3 Overall activity trends are not a measure of pricing or value for individual properties. Small Sampling sizes can
PRINCE GEORGE S COUNTY JULY 2018
 STATPAK PRINCE GEORGE S COUNTY JULY 2018 McEnearney.com MARKET IN A MINUTE A SUMMARY OF MARKET CONDITIONS FOR JUNE & FIRST HALF 2018 Contract activity in June 2018 was up 16.4% from June 2017, and through
STATPAK MARKET IN A MINUTE A SUMMARY OF MARKET CONDITIONS FOR AUGUST McEnearney.com CONTRACTS URGENCY INDEX INVENTORY INTEREST RATES
 STATPAK WASHINGTON, DC SEPTEMBER 2017 McEnearney.com MARKET IN A MINUTE A SUMMARY OF MARKET CONDITIONS FOR AUGUST 2017 Contract activity in August 2017 was up 4.9% from August 2016, and there were increases
LUXURY MARKET REPORT. - March
 LUXURY MARKET REPORT - March 2018 - www.luxuryhomeing.com THIS IS YOUR LUXURY MARKET REPORT MAP OF LUXURY RESIDENTIAL MARKETS Welcome to the Luxury Report, your guide to luxury real estate market data
Josephine County Residental Market Trends. January Pending Sales New Listings
 Josephine County Residental Market Trends January 217 Pending Sales..2 New Listings..3 Overall activity trends are not a measure of pricing or value for individual properties. Small Sampling sizes can
STATPAK MARKET IN A MINUTE A SUMMARY OF MARKET CONDITIONS FOR MAY McEnearney.com CONTRACTS URGENCY INDEX INVENTORY INTEREST RATES AFFORDABILITY
 STATPAK WASHINGTON, DC JUNE 2017 McEnearney.com MARKET IN A MINUTE A SUMMARY OF MARKET CONDITIONS FOR MAY 2017 Contract activity in May 2017 was up 2.9% from May 2016, and there were increases for the
BONDREPORT QTR BONDNEWYORK.COM
 BONDREPORT QTR 4 2018 BONDREPORT QTR 4 2018 WELCOME TO THE 23RD EDITION OF THE BOND REPORT Looking back on 2018, the year can perhaps best be described as a consistent movement towards corrections. After
STATPAK MARKET IN A MINUTE A SUMMARY OF MARKET CONDITIONS FOR JUNE & FIRST HALF McEnearney.com CONTRACTS URGENCY INDEX INVENTORY INTEREST RATES
 STATPAK LOUDOUN COUNTY JULY 2018 McEnearney.com MARKET IN A MINUTE A SUMMARY OF MARKET CONDITIONS FOR JUNE & FIRST HALF 2018 Contract activity in June 2018 was up 5.1% from June 2017. Through the first
Housing Price Forecasts. Illinois and Chicago PMSA, December 2015
 Housing Price Forecasts Illinois and Chicago PMSA, December 2015 Presented To Illinois Association of Realtors From R E A L Regional Economics Applications Laboratory, Institute of Government and Public
Provided by Keller Williams Realty Professional Partners Statistics from September 2010 MLS
 Monthly Market Watch for Maricopa County An overview of what is happening in the Maricopa County real estate market (using September 2010 statistics) Report overview: This report includes MLS data for
Coachella Valley Median Detached Home Price April April 2017
 The Desert Housing Report Median Price $450,000 $400,000 Coachella Valley Median Detached Home Price April 2002 - $349,000 $389,000 $350,000 $300,000 $250,000 $200,000 $150,000 CV Detached Median Price
United States Housing, 2012
 United States Department of Agriculture United States Housing, 2012 Delton Alderman ABSTRACT Provides current and historical information on housing market in the United States. Information includes trends
Jackson County Residental Market Trends. November Pending Sales New Listings
 Jackson County Residental Market Trends November 2017 Pending Sales..2 New Listings..3 Overall activity trends are not a measure of pricing or value for individual properties. Small Sampling sizes can