68-C: Financial Ratios for CCRCs: 2015 Update Presenters:
|
|
|
- Chastity Perry
- 5 years ago
- Views:
Transcription

1

2 November 2, 2015 І 3:30 5:00 pm 68-C: Financial Ratios for CCRCs: 2015 Update Presenters: Michael Kelly Managing Director Ziegler Karen Christiansen Executive Vice President & CFO ACTS Retirement-Life Communities Michael Flynn Chief Financial Officer Friendship Senior Options Mark Ross Partner, Health Care Baker Tilly Virchow Krause 2
3 Objectives Review current financial trends affecting the CCRC market. Learn to use the financial ratios to inform strategic planning efforts and communicate performance information to stakeholders. Study the findings and future implications of the 2015 Ratio Trends and Analysis report for CCRCs. Discuss ways that CCRC providers can measure and identify areas to improve operating performance. 3
4 Outline Section 1 Section 2 Section 3 Section 4 - Financial Trends Affecting the CCRC Market - The Strategy within Financial Ratios: An ACTS Perspective - Financial Perspective of a Mature Community vs. a Start-Up Community - How to Measure, Identify and Improve Questions & Answers 4


5 Jeffrey Boland Reinsel Kuntz Lesher, LLP Dave Bond CCRC Actuaries, LLC Amy Castleberry Ziegler Karen Christiansen Michael Connell Asbury Communities, Inc. Samuel Derieux** The Hermitage at Cedarfield Michael Flynn* Friendship Senior Options Thomas Gibbons The Huntington National Bank Amy Hayman Cain Brothers & Company Geary Milliken Carroll Lutheran Village Timothy Myers Ingleside Andrew Nesi Herbert J. Sims J. Wickliffe Peterson Senior Resource Group, LLC Mark Ross Baker Tilly Virchow Krause, LLP * FAP Chair ** Person Served This session is presented by members of the CARF Financial Advisory Panel This session is presented by the ACTS Retirement-Life Communities, Inc. CARF-CCAC Financial Advisory Panel

6 Availability of 2015 Financial Ratios & Trend Analysis CARF accredited CCRCs receive complimentary copies by mail automatically as a value-add to their accreditation bookstore.carf.org for online ordering Visit CARF at booth 502 for more information about the ratios or the publication
7 Section 1 Financial Trends Affecting the CCRC Market MICHAEL KELLY Managing Director Ziegler
8 Overview Senior Living Success: Key Drivers Baseline Operations Net Proceeds from Entrance Fees Senior Living Financial Strength Contributions Capital Structure Treasury Management 8
9 2015 marks 23rd publication Three types of ratios: Profitability Liquidity 2015 CARF Publication Financial Ratios & Trend Analysis Capital Structure Single-sites (137) and multi-sites (27) Predominantly non-profit (2 for-profits) CARF, Ziegler, and Baker Tilly are the Publication Partners Source: Financial Ratios & Trend Analysis of CARF-Accredited Continuing Care Retirement Communities,
10 Where Do You Focus? Profitability (Operating) Ratios Net Operating Margin Ratio Core operations: resident revenue resident expense. Excludes non-resident revenues and excludes interest/dividend income, interest expense, depreciation, taxes, amortization, contributions and entry fee amortization. CORE SERVICES Net Operating Margin Ratio-Adjusted Add net entry fees received. Operating Ratio Differs from NOM only in that it includes interest income, interest expense and net assets released for operations. Like NOM --- cash-based. Operating Margin Includes the impact of non-cash operating items such as earned entry fees and depreciation Total Excess Margin Builds on the Operating Margin Ratio but adds impact of realized investment gains or losses, contributions and other non-operating revenues/gains. ALL RESOURCES 10

11 Net Operating Margin Ratio (NOM) NET OPERATING MARGIN In 2014, median increased for multisite providers to 6.15%, but the single-site provider median decreased to 4.72% Decrease in NOM held across all quartiles for single-sites Despite recent flattening/dip, longterm trend remains positive since the early 2000s Source: Financial Ratios & Trend Analysis of CARF-Accredited Continuing Care Retirement Communities,
 NET OPERATING MARGIN-ADJ NOM-A highlights importance of cash flow from entrance fees, compared to NOM, where net entrance fee receipts are excluded Creditors, regulators, rating")
12 Net Operating Margin-Adj. Ratio (NOM-A) NET OPERATING MARGIN-ADJ NOM-A highlights importance of cash flow from entrance fees, compared to NOM, where net entrance fee receipts are excluded Creditors, regulators, rating agencies, etc. recognize importance of entrance fees in offsetting healthcare risk, operating costs NOM-A continues to improve for the 2014 fiscal year for single-sites; multi-site organizations decreased slightly Both organization types achieved a median NOM-A of just over 22%-- the highest level since publication began in 1996 Source: Financial Ratios & Trend Analysis of CARF-Accredited Continuing Care Retirement Communities,
, and single sites down from 3.24% to 2.")
13 Total Excess Margin (TEM) TOTAL EXCESS MARGIN TEM measures bottom line GAAP profitability Includes non-cash items such as amortization of entrance fees, depreciation and non-operating sources of revenues Multi-sites were down from last year (1.59% compared to 2.39%), and single sites down from 3.24% to 2.07% The timing of the adoption of Accounting Standards Update may be the contributing factor for the decreases Source: Financial Ratios & Trend Analysis of CARF-Accredited Continuing Care Retirement Communities,

14 Days Cash on Hand (DCOH) DAYS CASH ON HAND DCOH is the chief measure of organizational liquidity The single-site DCOH median decreased to 317 days; the multi-site median dipped to 272 days The 25 th quartile was lower for both, while the 75 th quartiles improved The DCOH median remains in the +/- 300 day range of the past 10 years for both provider types Source: Financial Ratios & Trend Analysis of CARF-Accredited Continuing Care Retirement Communities,


15 Unrestricted Cash & Investments to Long-Term Debt UNRESTRICTED CASH & INVESTMENTS TO LONG-TERM DEBT Measures an organization s position in cash and marketable securities in relation to its long-term debt Average cash balances decreased roughly 3%-5% for fiscal year 2014; possibly due to expense increases Median Cash to Debt weakened for multi-site and single-site providers, most likely driven by increased debt Source: Financial Ratios & Trend Analysis of CARF-Accredited Continuing Care Retirement Communities,
, while single-sites improved (2.")
16 Debt Service Coverage Ratio (DSC) DEBT SERVICE COVERAGE DSC ratio is generally considered to be the most important ratio for evaluating an organization s financial viability Reflects ability to fund debt service with cash flow from net cash revenues and net entrance fees DSC was down from last year for multi-sites (2.74x), while single-sites improved (2.62x) Average net entrance fees increased 12% - 15% Source: Financial Ratios & Trend Analysis of CARF-Accredited Continuing Care Retirement Communities,
17 (Ratio) Debt Service Coverage Ratio Revenue Only DEBT SERVICE COVERAGE-REVENUE 50th PERCENTILE Measures an organization s ability to meet debt service obligations without net entrance fee turnover Results are substantially impacted by pricing policies and contract types Improvement for single- and multisite organizations at all quartiles in FY 2014 Single-Site Multi-Site Top quartile is consistently well above 1.0x for both provider types Source: Financial Ratios & Trend Analysis of CARF-Accredited Continuing Care Retirement Communities,

18 Capital Expenditure as a Percentage of Depreciation CAPITAL EXPENDITURE AS A % OF DEPRECIATION Sixth year of data collection, trend is improving Both Multi-sites and single-sites improved from last year Important for organizations to show commitment to reinvest in physical plant at least to level of annual depreciation Source: Financial Ratios & Trend Analysis of CARF-Accredited Continuing Care Retirement Communities,

19 Average Age of Facility Ratio (AGE) AVERAGE AGE OF FACILITY AGE measures an organization s commitment to maintaining its physical plant AGE suggests the capital investment isn t sufficient to counter the aging of physical plants Many providers have embarked upon master planning, but there s a significant gap between project planning and opening Source: Financial Ratios & Trend Analysis of CARF-Accredited Continuing Care Retirement Communities,
20 Section 2 The Strategy within Financial Ratios An ACTS Perspective KAREN CHRISTIANSEN Executive Vice President & CFO ACTS Retirement-Life Communities
21 NON-PROFIT Multi-Site Senior Living Organization Profile 2015 LZ 150: ACTS Retirement-Life Communities, Inc. LZ 150 #: 3 Headquarters Location: Pennsylvania, West Point Year Founded: 1971 Total Units (as of 12/31/14): 7,993 5,652 ILUs 904 ALUs 1,437 NCBs 1 st Community opened in nd Community opened in rd Community opened in 1977 Classification: Primary: National Secondary: Across States Total # of Communities: 23 # of CCRCs: 23 # of Accredited Organizations: 22 Affordable Housing: N/A Debt Rating: Yes Fitch: A- S&P: BBB+ Practices: While past growth was primarily through new campus development, current growth has been through acquisition and/or expansion. Non-denominational background has led to acquisitions of others without religious ties. Most recent acquisition was in 2010: Peninsula United Methodist Homes and Heron Point of Chestertown. Managed Housing: N/A Source: 2015 LeadingAge Ziegler 150 Publication (data as of 12/31/14) 21

22 ORGANIZATIONAL OVERVIEW Total Assets $1.264B Annual Operating Revenue $390.0M Regional Clusters Northeast Mid-Atlantic Mid-South Southeast # of Residents 8,569 # of Employees (ft & pt) 5,856 22
 ACTS Signature Community Services, Inc. ACTS Mission Foundation ACTS Retirement-Life Communities, Inc.")
23 Organizational Structure ACTS Retirement Services, Inc. (Parent Company) OBLIGATED GROUP ACTS Management Services, Inc. (Manager) ACTS Signature Community Services, Inc. ACTS Mission Foundation ACTS Retirement-Life Communities, Inc. ACTS Acquisition Company, LLC 21 communities Park Pointe Village Heron Point of Chestertown 23
24 The Strategy within Financial Ratios Select which ratios are most important Combination of ratios that provide a comprehensive overview of financial performance and strategies Select appropriate benchmarks Influence of contract type Variations in calculations Sample size Establish targets / ranges Review and update regularly Vary based on corporate structure Format financial statements Easily calculate ratios 24
25 BEFORE Financial Statement Presentation Unclassified Balance Sheet No separation of current/non-current assets & liabilities More easily identify cash & reserves and debt 25
26 Financial Statement Presentation AFTER Unclassified Balance Sheet No separation of current/non-current assets & liabilities More easily identify cash & reserves and debt 26
27 Financial Statement Presentation Customized Operating Statement Subtotals for cash revenue & expenses Subtotal for Operating Income (company operating indicator) & Net Operating Income (GAAP operating indicator) ACTS Performance Indicator GAAP Performance Indicator 27
28 28 Where Do You Focus? Profitability (Operating) Ratios Net Operating Margin Ratio Core operations: resident revenue resident expense. Excludes non-resident revenues and excludes interest/dividend income, interest expense, depreciation, taxes, amortization, contributions and entry fee amortization. CORE SERVICES Net Operating Margin Ratio-Adjusted Add net entry fees received. Operating Ratio Differs from NOM only in that it includes interest income, interest expense and net assets released for operations. Like NOM --- cash-based. Operating Margin Includes the impact of non-cash operating items such as earned entry fees and depreciation Total Excess Margin Builds on the Operating Margin Ratio but adds impact of realized investment gains or losses, contributions and other non-operating revenues/gains. ALL RESOURCES
29 Net Operating Margin Ratio (NOM) ACTS Obligated Group -0.52% CARF-CCAC Median 6.15% CARF-CCAC Median (Type A Multi-Site Providers) -0.62% Not a Key Financial Indicator Excludes significant part of Resident Revenue Entrance Fee Amortization and/or Proceeds 98.4% of residents on a Type A Lifecare Contract (nonrefundable after 50 month amortization period) 29
30 Use Operating Ratio to measure reliance on Entrance Fees and relationship of cash revenue to cash expenses (in millions) Cash Revenue Cash Expenses Operating Surplus Operating Ratio 112.8% 101.4% 97.1% 97.2% Resident contract revision: 5% of entrance fee is considered a non-refundable processing/administrative fee Recorded as cash revenue with remaining 95% of entrance fee recorded as deferred revenue 30
31 Operating Ratio Key Financial Indicator Long-term objective stated in strategic plan Community specific targets Allows Operations to manage offsets in revenue and expenses Calculation excludes interest expense Entrance fee proceeds used to cover debt service Evaluated with debt service coverage Operating Surplus (Cash revenue cash expenses) + Net resale entrance fees / MADS ACTS Obligated Group 97.2% CARF-CCAC Median 98.1% CARF-CCAC Median (Type A Multi-Site Providers) 104.7% LZ100 (Top 25) 89.6% 31
32 Debt Service Coverage Key Financial Indicator Annual test of covenant compliance Calculation follows definition in debt indentures Based on MADS Effects of Multiple Resident Contract Types: Timing of refunds of refundable entrance fees may cause fluctuations in debt service coverage ratio Consider in negotiating covenant compliance ACTS Obligated Group 2.8x ACTS Obligated Group (Ratio Pro) 2.9x CARF-CCAC Median 2.7x ACTS Affiliate Yr. 1 Yr. 2 Yr. 3 DSC 2.7x 1.4x 2.2x ILU Occup. Gross EFEEs 95% 97% 95% 6.3M 4.5M $6.6 EFEE Refunds 1.6M 2.2M 2.0M 32
33 Days Cash on Hand (DCOH) Key Financial Indicator Calculation includes state MLRs Maintain target in combination with other key financial indicators Debt service coverage Debt to assets Average age of facility Respond to changing environment & expectations Target increased from 250 to 275 (will continue to increase) ACTS Obligated Group 267 CARF-CCAC Median 272 Resident education on the importance of funding UC&R Two financial town halls held at each community on an annual basis 33
34 Average Age of Facility Ratio (AGE) Tier II Financial Indicator Annual ordinary capital investment matches or exceeds 100% of depreciation Making up for reductions during recession Major renovations and expansions are not included in ordinary capital Ratio influenced by: New development projects Asset disposals ACTS Obligated Group 11.2 CARF-CCAC Median 12.9 Capital Expenditures as a % of Depreciation 157% Recent year focus on infrastructure, repositioning, privacy and amenities True average age is 31.5 years 34

35 Financial Structure and Governing Objectives Operating ratio of less than 100% Conservative leverage to approximate 40% of assets and provide for debt service coverage of 3.0x Maintain DCOH to average Invest in ordinary capital expenditures at a level equal to annual depreciation Expand and reposition existing communities Continue growth objectives Maintain investment grade ratings Operating Ratio ACTS Obligated Group Multi-site Benchmark 97.2% 98.1% LTD/TA 41% 43% DSC 2.8x 2.7x DCOH Avg. Age of Facility
36 Section 3 Financial Perspective of a Mature Community vs. a Start-Up Community MICHAEL FLYNN Chief Financial Officer Friendship Senior Options
37 Friendship Senior Options History Opened Friendship Village of Schaumburg in 1977 First in Illinois to be accredited by CCAC in 1987 Expand nursing home from 190 to 250 beds in 1997 Add 28 garden homes in 2002 Restructured organization in 2005 Expand commons areas and add 170 independent living units Open second community, GreenFields of Geneva in 2012 GreenFields receives CARF-CCAC Accreditation in

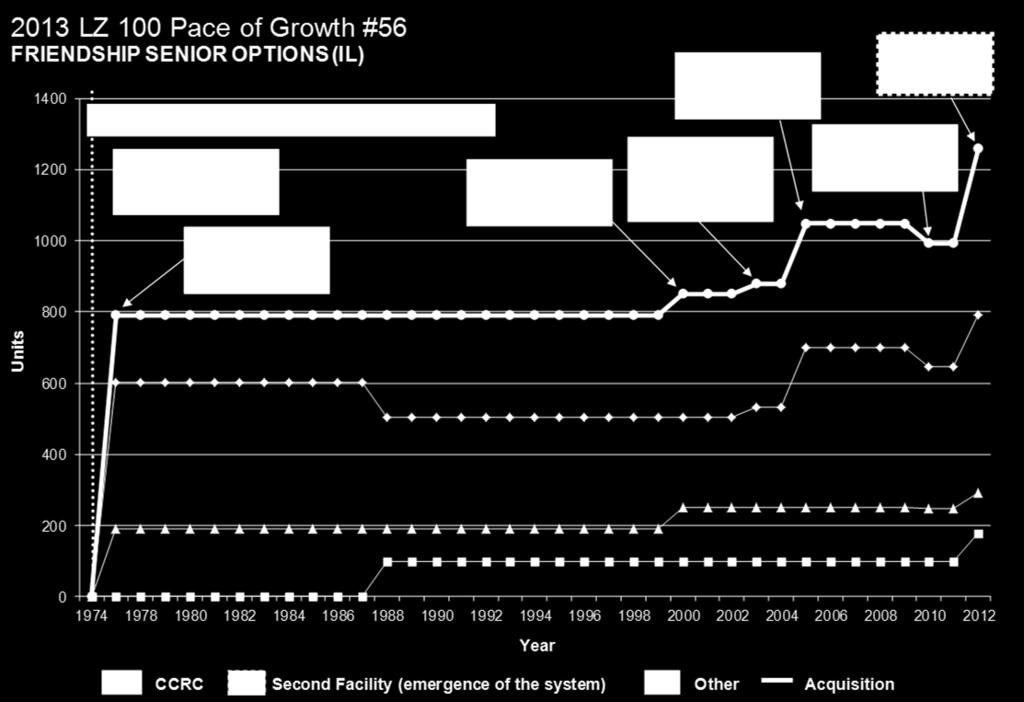
38 Pace of Growth 38
39 Organizational Structure Friendship Senior Options Friendship Village of Schaumburg GreenFields of Geneva Friendship Senior Service Foundation Friendship Village Neighborhood Services 39


40 Friendship Village GreenFields 40

41 Sources of Revenue 41
42 Census Friendship Village GreenFields Total Organization Capacity Occupied % Occupied Capacity Occupied % Occupied Capacity Occupied % Occupied Independent Living % % % Assisted Living % % % Healthcare % % % Total % % % 42
43 Operating Expenses By Community Actual Results Through 8/31/2015 FVS GF Expense Source % of Total Expense Source % of Total Salaries and benefits 39.28% Interest 28.06% Depreciation and amortization 14.59% Salaries and benefits 27.47% Supplies and other 12.77% Depreciation and amortization 15.33% Interest 10.93% Supplies and other 11.19% Professional fees 7.31% Professional fees 7.56% Dietary 5.71% Dietary 3.96% Utilities and telephone 3.71% Utilities and telephone 2.39% Repairs and maintenance 2.84% Repairs and maintenance 1.68% Insurance 1.38% Real estate taxes 1.39% Real estate taxes 0.90% Insurance 0.97% Provision for bad debts 0.57% Provision for bad debts Total Expenses % Total Expenses % 43
44 FVS Operating Performance % % 80.00% 60.00% 40.00% Operating Margin Ratio Operating Ratio Total Excess Margin Ratio Net Operating Margin Net Operating Margin - Adjusted 20.00% 0.00% % 3/31/2013 3/31/2014 3/31/2015 3/31/2016 3/31/2017 3/31/2018 Operating Margin Ratio % % -6.02% -7.64% -5.99% -4.37% Operating Ratio % % 99.14% % 98.95% 97.41% Total Excess Margin Ratio -8.72% % -6.82% -7.82% -6.16% -4.54% Net Operating Margin 11.17% 8.02% 10.61% 11.69% 12.72% 13.74% Net Operating Margin - Adjusted 19.94% 21.75% 23.49% 21.48% 22.34% 23.17% 44
45 FVS Days Cash On Hand Days Cash on Hand Ratio CARF 50th percentile CARF 25th percentile
46 FVS Debt Service Coverage Ratio Debt Service Coverage Ratio CARF 50th percentile CARF 25th percentile
47 FVS Average Age of Facility Average Age of Facility CARF 50th percentile CARF 25th percentile

48 Observations Use CARF benchmarks as a tool to compare your community to others Focus on trending in a positive direction Target specific ratios that have the greatest impact For new communities, operating performance may provide greater value than ratios 48
49 Section 4 How to Measure, Identify, and Improve MARK ROSS Partner and National Firm Leader Healthcare Practice Baker Tilly Virchow Krause, LLP
50 Positioning Your Senior Living Organization Financial Stability Operational Efficiency Quality 50
51 Benchmarking
52 Create a culture of continuous quality improvement Tell a story Benefits of Using Benchmarks Identify strengths / weaknesses; outliers, or low hanging fruit Provide high level direction for Management; identify small problems before they become big ones Dashboard reports; trend analysis over multiple periods 52
53 Challenges of Using Benchmarks Comparisons among organizations may be distorted by unique attributes of each organization Contract type (A, B, C, etc.) Unit complement Payer mix Number of operating locations Capital structure Significant operational changes (e.g., expansions, divestitures, etc.) Financial reporting treatment 53
54 Challenges of Using Benchmarks Access to quality published information Variances may be explained away too easily There is a story behind every number Viewed as purely economic initiative 54
55 Similar operations within one s organization (for multi-site providers) Historical information for your organization CARF Financial Ratios & Trend Analysis Rating agencies Benchmarks Where are they? State of Senior Housing 55
56 Medicare / Medicaid cost reports, MedPAC data, etc. LeadingAge State Associations Peer group surveys Benchmarks Where are they? Proprietary benchmarks (accountants, actuaries, investment bankers, etc.) 56
57 Occupancy and rates in all levels of care; payer mix Benevolent care OPERATING BENCHMARKS Medicare Part A margin and average length of stay Medicare Part B revenue per non-skilled day Provision for bad debts as a % of net resident service revenue (excluding amortization of entrance fees) 57
58 OPERATING BENCHMARKS Nursing / Assisted living hours per resident day and by position (RN, LPN, CNA) Therapy productivity / profitability Dietary costs per meal and resident day Housekeeping and maintenance costs per square foot, average occupied unit, and resident day Administrative costs per average occupied unit and resident day 58
59 OPERATING BENCHMARKS Departmental labor costs per hour (and/or FTE) General and administrative expenses as a % of total operating expenses Taxes and benefits as a % of salaries and wages Fund development expenses as a % of contributions received 59
60 Operations Assessment Process
61 Operations Assessment Process Every assessment is unique and is tailored to the specific needs and objectives of the organization; can be done internally or externally First step in the process is to gain an understanding of. Purpose of the assessment Areas of concern / potential focus Objectives / Expected outcomes 61
62 Operations Assessment Process Utilize this understanding to customize an approach that will achieve the organization s objectives and expected outcomes Assemble a specific team of professionals that possess the experience required for each component of the assessment 62
63 Operations Assessment Process Review general corporate information Articles of incorporation, by-laws, etc. Corporate structure Organization chart Strategic plan Resident agreements Internal control related documentation, accounting processes, etc. 63
64 Operations Assessment Process Review prior years audited financial statements and current year budget Calculate relevant financial ratios; benchmark against CARF and rating agencies Calculate EBIDA margins by level of care and compare to benchmarks 64
65 Operations Assessment Process Obtain in-depth understanding of operations through analyzing, in detail, revenues and expenses for 2-3 year period Analyze census, payer mix, and rates Calculate cost per resident day, average occupied unit, square foot, etc.; benchmark against various data points 65
66 Operations Assessment Process Summarize payroll taxes and benefits Therapy profitability analysis Account analysis on certain revenue and expense related accounts 66
67 Operations Assessment Process Interview personnel in various departments across organization.generally results in multiple qualitative observations Review staffing patterns in all departments; calculate nursing hours per resident day in SNF and AL Reconcile staffing patterns (and related hours) to actual hours paid per payroll reports 67
68 Operations Assessment Process Analyze overtime costs across all departments Analyze non-productive labor costs Evaluate and assess non-personnel related expenses Evaluate and assess all outsourced services 68
69 GOAL. Operations Assessment Process To identify quantitative and qualitative opportunities for improvement 69
70 Summary
71 Achieving sufficient operating margin is applicable to all types of organizations No margin, no mission Focus on your organization s own financial and operational results; use benchmarking as a tool, but remember benchmarking has its limitations Focus on key financial (quantitative) and non-financial qualitative) drivers and metrics 71
72 If you are going to invest in an operations assessment, your entire team needs to be open to challenging the current state. buy in to the process and committed to properly addressing recommendations Set goals that are appropriate for your organization What gets measured is what gets improved 72
73 Questions & Answers
Benchmarking Your CCRC
 Benchmarking Your CCRC Presented by: Moore Stephens Lovelace, P.A. Objectives Provide information on how ratios can provide insight into financial statements Give information about key ratios and what
Tenant: Law Firm 4 NAICS: Primary Industry: Offices of lawyers
 Tenant: Law Firm 4 NAICS: 541110 Primary Industry: Offices of lawyers Date: 05.25.17 Table of Contents Law Firm 4 132 Main Street TABLE OF CONTENTS TIL Score Executive Summary Tenant Score Information
Perry Farm Development Co.
 (a not-for-profit corporation) Consolidated Financial Report December 31, 2010 Contents Report Letter 1 Consolidated Financial Statements Balance Sheet 2 Statement of Operations 3 Statement of Changes
Bay Area Charter Foundation, LLC (Florida) Revenue Bonds, Series 2011
 Revenue Bonds, Series 2011") Bay Area Charter Foundation, LLC (Florida) Revenue Bonds, Series 2011 Review of Financial Results for the Six Months Ended December 31, 2012 February 20, 2013 12:00 PM EDT Contained herein is certain financial
Bay Area Charter Foundation, LLC (Florida) Revenue Bonds, Series 2011 Review of Financial Results for the Six Months Ended December 31, 2012 February 20, 2013 12:00 PM EDT Contained herein is certain financial
CPE regulations require online participants to take part in online questions
 KPMG s CFO Financial Forum Webcast FASB/IASB Revised Lease Accounting Exposure Drafts A Detailed Look Part III: Lessor Accounting June 25, 2013 Administrative CPE regulations require online participants
I. PROPOSED RATES (Room and Board) These rates have been reviewed by staff and supported by the Association of Residence Halls.
 These rates have been reviewed by staff and supported by the Association of Residence Halls.") KANSAS STATE UNIVERSITY HOUSING AND FOOD SERVICE RATES I. PROPOSED RATES (Room and Board) These rates have been reviewed by staff and supported by the Association of Residence Halls. Regular Semester Room
KANSAS STATE UNIVERSITY HOUSING AND FOOD SERVICE RATES I. PROPOSED RATES (Room and Board) These rates have been reviewed by staff and supported by the Association of Residence Halls. Regular Semester Room
ISC: UNRESTRICTED AC Attachment. Attainable Homes Acquisition and Development Cycle Audit
 Attainable Homes Acquisition and Development Cycle Audit April 6, 2016 THIS PAGE LEFT INTENTIONALLY BLANK ISC: UNRESTRICTED Table of Contents Executive Summary... 5 1.0 Background... 6 2.0 Audit Objectives,
CONSOLIDATED STATEMENT OF INCOME
 CONSOLIDATED STATEMENT OF INCOME (unaudited, data converted from the Euro to the US Dollar (for information concerning this restatement, see Note 11 to these Consolidated Financial Statements)) 1 st quarter
An Interactive Feasibility Tool
 INSTRUCTION GUIDE Affordable Assisted Living and Community Based Care: An Interactive Feasibility Tool Developed for: The Coming Home Program In partnership with the Robert Wood Johnson Foundation NCB
Massachusetts Housing Investment Corporation Accounting, Audit & Tax Workshop For the Year Ended December 31, 2016
 Massachusetts Housing Investment Corporation Accounting, Audit & Tax Workshop For the Year Ended December 31, 2016 Presented By: Karen Kent, CPA, Partner, Kevin P. Martin & Associates, P.C. Kenneth Lund,
THE ART OF BUSINESS VALUATION
 BUSINESS VALUATIONS GROWING THE ART OF BUSINESS VALUATION Douglas A. Michel, CPA/ABV, CVA & Alex E. Kummer, CPA, CVA, Clark Schaefer Hackett THE VALUE OF YOUR BUSINESS Steve Lumley, LGI CFO BUY SELL AGREEMENTS
CONSOLIDATED STATEMENT OF INCOME
 CONSOLIDATED STATEMENT OF INCOME 1 st quarter (a) 2017 4 th quarter Sales 41,183 42,275 32,841 Excise taxes (5,090) (5,408) (5,319) Revenues from sales 36,093 36,867 27,522 Purchases, net of inventory
Front Yard Residential Corporation Announces Transformative Acquisition and Reports Second Quarter 2018 Results
 Front Yard Residential Corporation Announces Transformative Acquisition and Reports Second Quarter 2018 Results August 9, 2018 CHRISTIANSTED, U.S. Virgin Islands, Aug. 09, 2018 (GLOBE NEWSWIRE) -- Front
TULSA DEVELOPMENT AUTHORITY (A Component Unit of the City of Tulsa, Oklahoma) FINANCIAL REPORTS June 30, 2018 and 2017
 FINANCIAL REPORTS June 30, 2018 and 2017") FINANCIAL REPORTS June 30, 2018 and 2017 Index Page Independent Auditor s Report 1 Management s Discussion and Analysis 3 Basic Financial Statements: Statements of Net Position 9 Statements of Revenues,
FINANCIAL REPORTS June 30, 2018 and 2017 Index Page Independent Auditor s Report 1 Management s Discussion and Analysis 3 Basic Financial Statements: Statements of Net Position 9 Statements of Revenues,
HOME Investment Partnership Program Project Development Funds. Application
 City of Spartanburg Neighborhood Services 145 West Broad Street Spartanburg, South Carolina 29306 HOME Investment Partnership Program Project Development Funds Application Applicant Name: Project Name:
REAL PROPERTY DEVELOPMENT & MANAGEMENT
 REAL PROPERTY DEVELOPMENT & MANAGEMENT The Real Property Development and Management (RPDM) group plans, secures and manages Metropolitan s real property assets, proactively seeking to enhance revenue while
Genesis Reports 2017 Third Quarter Results
 Genesis Reports 2017 Third Quarter Results For Immediate Release CALGARY, November 9, 2017 Genesis Land Development Corp. (TSX: GDC) (the Corporation or Genesis ) reported its financial and operating results
Investor Presentation. First Quarter 2015
 Investor Presentation First Quarter 2015 1 CAUTIONARY STATEMENTS Today s session and our answers to questions contain statements that constitute forward-looking statements about expected future events
FINANCIAL MANAGEMENT FOR LAND TRUSTS. Gathering Waters Wisconsin Land Trust Conference Onalaska, WI March
 Onalaska, WI March 8 2018 1 Dana Chabot CPA dana@chabotcpa.com Presenter Dana Chabot is a CPA who has provided financial management services to land trusts and other nonprofit organizations throughout
Massachusetts Housing Investment Corporation Accounting, Audit & Tax Workshop For the Year Ended December 31, 2014
 Massachusetts Housing Investment Corporation Accounting, Audit & Tax Workshop For the Year Ended December 31, 2014 Presented By: Karen Kent, CPA, Partner, Kevin P. Martin & Associates, P.C. Kenneth Lund,
ANALYTICS & MANAGEMENT OF MIXED INCOME PROPERTY
 MIXED INCOME PROPERTY CFO FORUM NEIGHBORWORKS AMERICA TRAINING INSTITUTE KANSAS CITY, MISSOURI Presented by Len Tatem (Tatem Consulting LLC) & John Kelley (CNAHS/HRI Cambridge, MA) DEFINING MIXED-INCOME
Front Yard Residential Corporation Reports Third Quarter 2018 Results
 Front Yard Residential Corporation Reports Third Quarter 2018 Results November 7, 2018 CHRISTIANSTED, U.S. Virgin Islands, Nov. 07, 2018 (GLOBE NEWSWIRE) -- Front Yard Residential Corporation ( Front Yard
HABITAT FOR HUMANITY OF GREATER NEW HAVEN, INC. AND SUBSIDIARY Consolidated Financial Statements December 31, 2009
 HABITAT FOR HUMANITY OF GREATER NEW HAVEN, INC. AND SUBSIDIARY Consolidated Financial Statements December 31, 2009 HABITAT FOR HUMANITY OF GREATER NEW HAVEN, INC. AND SUBSIDIARY CONSOLIDATED FINANCIAL
ASSESSOR. Mission. Program Summaries by Function
 Mission The Assessor is responsible for discovering, inventorying and valuing all taxable property in the County, including residential, commercial, industrial and undeveloped properties, as well as personal
Gateway NACM Credit Conference Presented by: Curtis Litchfield, CCE September 20, 2018
 Gateway NACM Credit Conference Presented by: Curtis Litchfield, CCE September 20, 2018 Who Receives and Analyzes Financial Statements? Why do you request them? What information are you trying to determine?
Sunrise Stratford, LP
 Sunrise Stratford, LP Financial Statements as of and for the Years Ended December 31, 2017 and 2016, Other Financial Information, and Independent Auditors Reports TABLE OF CONTENTS INDEPENDENT AUDITORS
2016 Financial Supplement February 2017
 Safe Harbor Statement Forward-Looking Statements - Certain statements in this presentation regarding anticipated financial outcomes including Rayonier s earnings guidance, if any, business and market conditions,
Understanding the Economics & Financing Structures of Moderately Priced Life Plan Communities
 Understanding the Economics & Financing Structures of Moderately Priced Life Plan Communities 2 Today s Presenters Wayne Olson, Executive Vice President, Volunteers of America National Services Steve Kuhns,
2014 Operating and Financial Highlights
 FINANCIAL HIGHLIGHTS > 2014 Operating and Financial Highlights Operating Results Executed 203 leasing transactions representing approximately 2.8 million square feet, the highest gross leasing volume in
WP Glimcher Reports Second Quarter 2016 Results
 NEWS RELEASE WP Glimcher Reports Second Quarter 2016 Results COLUMBUS, OH August 3, 2016 WP Glimcher Inc. (NYSE: WPG) today reported financial and operating results for the second quarter ended June 30,
Four (4) Factors in Investment Definition: Investment
 Factors in Investment Definition: Investment") Introductions Your name Where you work Your job responsibilities How long you have been in the industry What you hope to get from this class Chapter 1: Investments Agenda 2 Investments Adding Value to
Introductions Your name Where you work Your job responsibilities How long you have been in the industry What you hope to get from this class Chapter 1: Investments Agenda 2 Investments Adding Value to
Cost Segregation Instructor Teaching Schedule (3-Hour)
") Time Topic Pages Student Objectives 8:30-8:35 Course introduction Page 2 What is cost segregation? Objective of cost segregation: to increase cash flow Benefit of cost segregation Learning objectives Page
Time Topic Pages Student Objectives 8:30-8:35 Course introduction Page 2 What is cost segregation? Objective of cost segregation: to increase cash flow Benefit of cost segregation Learning objectives Page
JEA s Future Opportunities and Considerations
 JEA s Future Opportunities and Considerations Michael Mace, Managing Director February 14, 2018 PFM Orlando, FL Charlotte, NC pfm.com PFM 1 Discussion Topics - Introduction - Scope of the Report - Utility
GASB 87: Leases. Hosted By: Ben Lindekugel, Executive Director Association of Washington Public Hospital Districts
 GASB 87: Leases Hosted By: Ben Lindekugel, Executive Director Association of Washington Public Hospital Districts November 6, 2018 Presented By Tom Dingus, CPA, Partner Dingus, Zarecor & Associates PLLC
Senior Housing Properties Trust Announces Fourth Quarter and Year End 2017 Results
 Senior Housing Properties Trust NEWS RELEASE Senior Housing Properties Trust Announces Fourth Quarter and Year End 2017 Results 2/27/2018 NEWTON, Mass.--(BUSINESS WIRE)-- Senior Housing Properties Trust
Definitions. CPI is a lease in which base rent is adjusted based on changes in a consumer price index.
 Annualized Rental Income is rental revenue under our leases on Operating Properties on a straight-line basis, which includes the effect of rent escalations and any tenant concessions, such as free rent,
I ROC 2017 Financial Administrators Section Conference
 I ROC 2017 Financial Administrators Section Conference September 9, 2017 kpmg.ca Presenters Chris Cornell KPMG Partner, Financial Services Steven Sharma KPMG Partner, Financial Services 2 IIROC 2017 Financial
FY General Revenue Forecast Presentation
 FY 2015-2019 General Revenue Forecast Presentation Steven A. Solomon Director of Finance February 18, 2014 Overview Current Economic Outlook National State Local FY 2014 2nd Quarter Revenue Update Five
Lease Accounting and Loan Covenants: What is the Impact?
 Lease Accounting and Loan Covenants: What is the Impact? Monday June 26, 2017 9:15 AM 10:30 AM Presented by: Charlie Shannon Partner Moss Adams LLP 8750 N. Central Expressway, Suite 300 Dallas, TX 75231
$450,000 $63,425 $33, % PURCHASE PRICE NET OPERATING INCOME ANNUAL CASH FLOW CAP RATE
 Executive Summary Key Property Metrics $450,000 $63,425 $33,431 14.1% PURCHASE PRICE NET OPERATING INCOME ANNUAL CASH FLOW CAP RATE $60,000 $50,000 $40,000 $30,000 Annual Cash Flow Maintenance & Repairs,
County of Sonoma Agenda Item Summary Report
 Revision No. 20170501-1 County of Sonoma Agenda Item Summary Report Agenda Item Number: 33 (This Section for use by Clerk of the Board Only.) Clerk of the Board 575 Administration Drive Santa Rosa, CA
SITE CENTERS NOVEMBER 2018
 SITE CENTERS NOVEMBER 2018 JOINT VENTURE WITH CHINESE INSTITUTIONAL INVESTORS $607MM JOINT VENTURE ALLOWS SITE CENTERS TO ACCELERATE OPPORTUNISTIC INVESTING AND FURTHER IMPROVE THE BALANCE SHEET Dividend
White Paper on Adjusted Cashflow From Operations (ACFO) for IFRS. February, 2018
 for IFRS. February, 2018") White Paper on Adjusted Cashflow From Operations (ACFO) for IFRS February, 2018 Copyright REALPAC is the owner of all copyright in this publication. All rights reserved. No part of this document may be
White Paper on Adjusted Cashflow From Operations (ACFO) for IFRS February, 2018 Copyright REALPAC is the owner of all copyright in this publication. All rights reserved. No part of this document may be
PROPOSED CHANGES TO LEASE ACCOUNTING
 PROPOSED CHANGES TO LEASE ACCOUNTING Reference Guide Lessee Perspective Based on Revised Exposure Draft Issued May 16, 2013 FOR INTERNAL USE ONLY BACKGROUND 1. WHAT IS BEING PROPOSED? a. Generally, all
Demystifying Rental Underwriting. August 15, 2017
 Demystifying Rental Underwriting August 15, 2017 Welcome & Introductions Delivered by Steve Lathom, TDA Consulting www.tdainc.org slathom@tdainc.org 517-203-4130 Session Objectives Regulatory issues driving
AN ECONOMIC, FISCAL AND CAPITAL ASSET IMPACT ANALYSIS OF THIRTEEN PROPOSED NEW DEVELOPMENTS ON THE TOWN OF DENTON, MARYLAND.
 AN ECONOMIC, FISCAL AND CAPITAL ASSET IMPACT ANALYSIS OF THIRTEEN PROPOSED NEW DEVELOPMENTS ON THE TOWN OF DENTON, MARYLAND Prepared for The Denton Town Council Denton, Maryland by Dean D. Bellas, Ph.D.
Accounting for Tangible Capital Assets
 Accounting for Tangible Capital Assets Date Approved by Board: 2011.11.17 Resolution No.: 11-113 2016.05.19 16-048 Lead Role: CFO Replaces: N/A Last Review Date: N/A Next Review Date: 2019.05.19 Policy
INDEPENDENT AUDITORS REPORT 1. Balance Sheets 2. Statements of Operations 3. Statements of Changes in Partners Capital 4. Statements of Cash Flows 5
 Sunrise Carlisle, LP Financial Statements as of and for the Years Ended December 31, 2016 and 2015, Other Financial Information, and Independent Auditors Reports TABLE OF CONTENTS INDEPENDENT AUDITORS
CFA Level 1. Financial Reporting and Analysis. Non-current Liabilities
 CFA Level 1 Financial Reporting and Analysis Non-current Liabilities 2011, Associate Professor Ole Sørensen, Ph.d. Side 1 Coupon Bonds Promises two types of payments: periodic interest payments and a lumpsum
Approve Student Housing Rental Rates and Student Housing Parking Permit Rates at UW Bothell
 F 9 Permit Rates at UW Bothell RECOMMENDED ACTION It is the recommendation of the Administration and the Finance and Asset Management Committee that the Board of Regents approve the proposed 2018 19 student
Q Conference Call Presentation. October 31, 2018
 Q3 2018 Conference Call Presentation October 31, 2018 FORWARD LOOKING ADVISORY In talking about our financial and operating performance and in responding to your questions we may make forward-looking statements
Our Objectives. Our Strategy
 2005 Third Quarter Report» Management s Discussion and Analysis Management s Discussion and Analysis This Management s Discussion and Analysis has been dated as at November 3, 2005. All dollar amounts
REPORT TO THE HOUSING AUTHORITY
 REPORT TO THE HOUSING AUTHORITY DATE ISSUED: October 12, 2012 REPORT NO: HAR12-043 ATTENTION: SUBJECT: Chair and Members of the Housing Authority of the City of San Diego For the Agenda of November 27,
Is Your Operating Lease An Asset or Liability? It s Now Both
 MFM Annual Conference Is Your Operating Lease An Asset or Liability? It s Now Both 23 May 2016-1:30 pm 2:20 pm Disclaimer These slides are for educational purposes only and are not intended, and should
Real Estate & REIT Modeling: Quiz Questions Module 1 Accounting, Overview & Key Metrics
 Real Estate & REIT Modeling: Quiz Questions Module 1 Accounting, Overview & Key Metrics 1. How are REITs different from normal companies? a. Unlike normal companies, REITs are not required to pay income
A Window Into the World of Condo Investors
 April 06, 2018 A Window Into the World of Condo by Shaun Hildebrand and Benjamin Tal (CIBC*) If you want to understand the GTA housing market, you have to get into the heads of condo investors. While the
Detailed competency map: Knowledge requirements. (AAT examination)
") Detailed competency map: Knowledge requirements (AAT examination) Fields of competency The items listed are shown with an indicator of the minimum acceptable level of competency, based on a three-point
Detailed competency map: Knowledge requirements (AAT examination) Fields of competency The items listed are shown with an indicator of the minimum acceptable level of competency, based on a three-point
INVESTOR PRESENTATION MAY 2013
 INVESTOR PRESENTATION MAY 2013 Forward-Looking Statements This presentation includes forward-looking statements. These statements are subject to a number of risks, uncertainties and other factors that
Leases: Overview of the new guidance
 Leases: Overview of the new guidance Prepared by: Richard Stuart, Partner, National Professional Standards Group, RSM US LLP richard.stuart@rsmus.com, +1 203 905 5027 March 2, 2016 Introduction On February
Presentation of Key Findings and Recommendations to the Broward County Commission. Assessment Report and Recommendations: Young At Art Museum
 Presentation of Key Findings and Recommendations to the Broward County Commission Assessment Report and Recommendations: Young At Art Museum 1 Broward County contracted the consultant to assess and develop
HABITAT FOR HUMANITY KANSAS CITY, INC. FINANCIAL STATEMENTS
 HABITAT FOR HUMANITY KANSAS CITY, INC. FINANCIAL STATEMENTS Year Ended December 31, 2015 Mayer Hoffman McCann P.C. An Independent CPA Firm 700 West 47th Street, Suite 1100 Kansas City, MO 64112 Main: 816.945.5600
Public Storage Reports Results for the Quarter Ended March 31, 2017
 News Release Public Storage 701 Western Avenue Glendale, CA 91201-2349 www.publicstorage.com For Release Immediately Date April 26, 2017 Contact Clemente Teng (818) 244-8080, Ext. 1141 Public Storage Reports
Debt Service Coverage
 Atheton Baptist Homes FYE 12/31/2016 Annual Reporting Requirements Debt Service Coverage Funds Available for Debt Service Operating income $264,363 Add: fees, net of refunds 3,053,057 Interest expense,
Current Developments. FASB, AICPA and SEC. Jim Brendel, CPA, CFE March 1, 2013
 Current Developments FASB, AICPA and SEC Jim Brendel, CPA, CFE March 1, 2013 Agenda FASB Developments Selected Projects and Initiatives Revenue Recognition Leases Impairment of Intangible Assets Other
A New Lease on Life: The GASB s New Accounting for Leases
 Tuesday, May 23, 2017 2:00 3:15PM A New Lease on Life: The GASB s New Accounting for Leases MODERATOR Frances Lee Deputy Chief Financial Officer San Francisco Public Utilities Commission SPEAKERS Stephen
Sector Scorecard. Proposed indicators for measuring efficiency within the sector have been developed for the following areas:
 Registered Providers Working Group on Efficiency Sector Scorecard Proposed indicators for measuring efficiency within the sector have been developed for the following areas: A. Business Health B. Development
LeaseCalcs: The Great Wall
 LeaseCalcs: The Great Wall Marc A. Maiona June 22, 2016 The Great Wall: Companies reporting under IFRS are about to hit the wall due to new lease accounting standards. Every company that reports under
ASSESSOR. Mission. Program Summaries by Function
 Mission The Assessor is responsible for discovering, inventorying and valuing all taxable property in the County, including residential, commercial, industrial and undeveloped properties, as well as personal
Assessing Affordable Housing Need A Practical Toolkit. Jenni Easton, AICP Nick Fedorek
 Assessing Affordable Housing Need A Practical Toolkit Jenni Easton, AICP Nick Fedorek Research questions: What should communities know about their housing markets? What can various types of analysis tell
FOR IMMEDIATE RELEASE CONTACT: John Bucksbaum 312/ General Growth Properties, Inc. Reports Operating Results for the Third Quarter 2005
 News Release General Growth Properties, Inc. 110 North Wacker Drive Chicago, IL 60606 (312) 960-5000 FAX (312) 960-5475 FOR IMMEDIATE RELEASE CONTACT: John Bucksbaum 312/960-5005 Bernie Freibaum 312/960-5252
Sekisui House, Ltd. Second Quarter of FY2017 (February 1, 2017 through July 31, 2017) Summary of Consolidated Financial Results. Management Direction
 Summary of Consolidated Financial Results. Management Direction") Sekisui House, Ltd. Second Quarter of (February 1, 2017 through July 31, 2017) Summary of Consolidated Financial 1. Overview 2. Financial Position 3. Segment Information Built to Order Supplied Housing
Sekisui House, Ltd. Second Quarter of (February 1, 2017 through July 31, 2017) Summary of Consolidated Financial 1. Overview 2. Financial Position 3. Segment Information Built to Order Supplied Housing
We encourage readers to review our complete legal statement on Disclaimer page.
 Company Research and Analysis Report FISCO Ltd. http://www.fisco.co.jp 伪伪 An emerging real estate investment and development company that is moving to the next growth stage by developing inbound demand
METHODOLOGY GUIDE VALUING LONG-TERM CARE HOMES IN ONTARIO. Valuation Date: January 1, 2016
 METHODOLOGY GUIDE VALUING LONG-TERM CARE HOMES IN ONTARIO Valuation Date: January 1, 2016 AUGUST 2016 August 22, 2016 The Municipal Property Assessment Corporation (MPAC) is responsible for accurately
Massachusetts Housing Investment Corporation Accounting, Audit & Tax Workshop For the Year Ended December 31, 2011
 Massachusetts Housing Investment Corporation Accounting, Audit & Tax Workshop For the Year Ended December 31, 2011 Presented By: Marianne Heard, CPA, MST, Tax Director, Kevin P. Martin & Associates, P.C.
A REPORT FROM THE OFFICE OF INTERNAL AUDIT
 A REPORT FROM THE OFFICE OF INTERNAL AUDIT PRESENTED TO THE CITY COUNCIL CITY OF BOISE, IDAHO AUDIT / TASK: AUDIT CLIENT: REPORT DATE: October 14, 2013 AUDIT GRADE: #13-04, Property Rehabilitation / Loan
GAAP UPDATE DEANA BOWDEN, CPA, MSA WHITE NELSON DIEHL EVANS LLP
 GAAP UPDATE DEANA BOWDEN, CPA, MSA WHITE NELSON DIEHL EVANS LLP TOPICS 2016-02 Topic 842 Leases 2016-14 Topic 958 Not for Profits 2016-18 Topic 230 Cash Flows LEASES Current US Generally Accepted Accounting
December 2014 Brewster Board of Selectmen and Town Administrators Office 2198 Main St Brewster, MA
 Identifying and Overcoming Impediments to Successfully Managing Small, Affordable Housing Properties on Lower Cape Cod December 2014 Brewster Board of Selectmen and Town Administrators Office 2198 Main
SMARTCENTRES REAL ESTATE INVESTMENT TRUST RELEASES SECOND QUARTER RESULTS FOR 2018 AND ANNOUNCES DISTRIBUTION INCREASE
 SMARTCENTRES REAL ESTATE INVESTMENT TRUST RELEASES SECOND QUARTER RESULTS FOR 2018 AND ANNOUNCES DISTRIBUTION INCREASE TORONTO, ONTARIO - (August 9, 2018) SmartCentres Real Estate Investment Trust ("SmartCentres"
Return on Investment Model
 THOMAS JEFFERSON PLANNING DISTRICT COMMISSION Return on Investment Model Last Updated 7/11/2013 The Thomas Jefferson Planning District Commission developed a Return on Investment model that calculates
Financial Statements January 28, 2018 PetSmart Charities of Canada
 Financial Statements January 28, 2018 Table of Contents Independent Auditor s Report... 1 Financial Statements Statement of Financial Position... 2 Statement of Operations and Changes in Fund Balances...
We are pleased to provide all owners with the King s Creek Plantation Owners Association Annual Report.
 April 30, 2016 Dear Owner, We are pleased to provide all owners with the King s Creek Plantation Owners Association Annual Report. The Report includes the following information: 1. The full legal name
Value for Money. Self Assessment Summary 2017
 Value for Money Self Assessment Summary 2017 Executive Summary Wythenshawe Community Housing Group Limited () was established in April 2013 when Parkway Green Housing Trust (PGHT) and Willow Park Housing
GOLDFIELD CORPORATION
 GOLDFIELD CORPORATION The Goldfield Corporation (Goldfield), incorporated in 1906, is engaged in electrical construction, including the placement of fiber optic cable and real estate development. The Company,
Detroit Inclusionary Housing Plan & Market Study Preliminary Inclusionary Housing Feasibility Study Executive Summary August, 2016
 Detroit Inclusionary Housing Plan & Market Study Preliminary Inclusionary Housing Feasibility Study Executive Summary August, 2016 Inclusionary Housing Plan & Market Study Objectives 1 Evaluate the citywide
Department of Human Resources Senior and Disabled Services Division OREGON ADMINISTRATIVE RULES. Chapter 411 Division 067
 Department of Human Resources Senior and Disabled Services Division OREGON ADMINISTRATIVE RULES Chapter 411 Division 067 CONTINUING CARE RETIREMENT COMMUNITY 411-067-0000 Definitions As used in Oregon
Technical Line FASB final guidance
 No. 2016-09 14 April 2016 Technical Line FASB final guidance How the FASB s new leases standard will affect health care entities In this issue: Overview... 1 Key considerations... 3 Scope and scope exceptions...
Impact of lease accounting changes to corporate real estate
 Impact of lease accounting changes to corporate real estate Overview In February 2016, the Financial Accounting Standards Board (FASB) issued its long-awaited revision to lease accounting Accounting Standards
Q Financial Supplement October 2018
 Safe Harbor Statement Forward-Looking Statements - Certain statements in this presentation regarding anticipated financial outcomes including Rayonier s earnings guidance, if any, business and market conditions,
RESI Update 4 th Quarter 2016
 RESI Update 4 th Quarter 2016 Supplemental Investor Information George Ellison, CEO Robin Lowe, CFO 2017 Altisource Residential Corporation. All rights reserved. Forward Looking Statements This presentation
Investor Presentation Second Quarter 2006
 Investor Presentation Second Quarter 2006 2006 Highlights (Six months to June 30, 2006) Revenues up 10.2% from accretive acquisitions Net Operating Income up 10.9% NOI margin increases Stabilized portfolio
26 February 2013 FIRST HALF RESULTS PRESENTATION
 26 February 2013 FIRST HALF RESULTS PRESENTATION Investment highlights Proven track record of consistent earnings growth and meeting targets Strategically located and diverse residential portfolio Urban
Legal and Realty Services 2012 Annual Report
 Legal and Realty Services 2012 Annual Report Table of Contents Introduction 2 Section 1: Key Initiative Summary 4 Section 2: Legal and Realty Services Dashboard and Scorecard 5 Section 3: Data Analysis
Achieved record annual revenues of $110.0 million for 2018, representing an increase of 5.8%
 Clipper Realty Inc. Announces Fourth Quarter and Full-Year 2018 Results Reports Record Annual Revenues, Record Annual Income from Operations and Record Quarterly and Annual Adjusted Funds from Operations
Invesco Real Estate Acquisitions
 Acquisitions With the corporate office centrally located in Dallas, Texas and regional acquisitions offices in New York, San Francisco and Orange County, Invesco is able to effectively source acquisition
Ch.1 Sourcing Analysis.
 Module 3. Value Enhancement Strategies. Ch.1 Sourcing Analysis. Edited by Dr. Seung Hyun Lee (Ph.D., CPM) IEMS Research Center, E-mail : lkangsan@iems.co.kr Make-or-Buy Analysis. Procedures For Make-or-Buy
Basics of Commercial Real Estate Transactions Day Two
 Basics of Commercial Real Estate Transactions Day Two John Rockwell, Partner Energy October 12, 2016 PG&E refers to the Pacific Gas and Electric Company, a subsidiary of PG&E Corporation. 2010 Pacific
Settlement Pattern & Form with service costs analysis Preliminary Report
 Settlement Pattern & Form with service costs analysis Preliminary Report Prepared for Regional Planning Halifax Regional Municipality by Financial Services, HRM May 15, 2004 TABLE OF CONTENTS INTRODUCTION...
NAREIT Presentation June George Ellison, CEO Robin Lowe, CFO. welcome. home Front Yard Residential. All rights reserved.
 NAREIT Presentation June 2018 George Ellison, CEO Robin Lowe, CFO welcome home. 2018 Front Yard Residential. All rights reserved. 1 Forward-looking Statements This presentation contains forward-looking
WHITE PAPER ON FUNDS FROM OPERATIONS
 WHITE PAPER ON FUNDS FROM OPERATIONS FOR IFRS REVISED: SEPTEMBER 2010 Page 1 of 17 I. Introduction and Background TABLE OF CONTENTS II. III. IV. Intended use of FFO FFO Definition Discussion of FFO Definition
Contract-Related Intangible
 Income Tax Insights Valuation of Contract-Related Intangible Assets Robert F. Reilly, CPA The valuation of contract-related intangible assets is often an issue in matters related to income tax, gift tax,