Raising Your Commercial IQ
|
|
|
- Silvia Gordon
- 5 years ago
- Views:
Transcription
1 Raising Your Commercial IQ Real Estate Investment & Lease Analysis January P age Neil Osborne M.B.A. DL. (604) nosborne@investitsoftware.com Investit Software Inc. Toll free North Vancouver BC Canada investit@investitsoftware.com N Osborne Copyright 2012 All rights reserved
2 1 Table of Contents Objectives... 3 Valuing commercial properties... 4 Apparent Cap Rate versus the True Cap Rate... 4 Factors that distort the Cap Rate. Examples... 4 Long Term Real Estate Investment Analysis Introduction... 7 Choosing between two investments... 7 Calculating the Net Cash Flows before Tax... 8 Financial Returns that incorporate the Time Value of Money The Internal Rate of Return (IRR) Relationship between the Internal Rate of Return (IRR) and Compound Interest Why we use the Internal Rate of Return (IRR) Financial Calculators Net Present Value (NPV) Determining the Discount Rate or Desired Return (IRR) Modified Internal Rate of Return (MIRR) The building blocks of Real Estate Investment Analysis Real Estate Investment analysis. Case Study Common real estate investment analysis reports Goal Seeking Appraiser s Approach to Present Value Determining the optimum holding period Summary. The building blocks of investment analysis Cash Flows. Timing and Sign Conventions Timing and Sign Conventions. Summary Cap Rate versus Internal Rate of Return (IRR) Cap Rate and the Internal Rate of Return (IRR) Case Study When does the Cap Rate equal the Internal Rate of Return? Cap Rate versus Internal Rate of Return (IRR). Summary What does the term Return mean? Real Estate Taxation. Overview Capital Gains Tax Depreciation Claims Amortization Recaptured Depreciation Tax Calculating Recaptured Depreciation Properties that may be hard to sell because of tax implications Properties that may be hard to sell because of mortgage restrictions Real Estate Investment Analysis Tips Case Studies Sale Lease Back Analysis Creative Financing Creative Financing. Review and Summary Lease comparison analysis Lease Negotiations. Trade Offs between Landlord & Tenant Analyzing Mutually Exclusive Investments Analyzing Buying versus Renting a home. Case Study Buy versus Lease Analysis. Case Study... 96
3 Buy versus Lease Crossover Graph Hold vs. Sell or Hold & Refinance & Sell Analysis Hold versus Sell Decision Rules Hold Versus Sell Crossover Graph Hold & Refinance Analysis Replacement Reserve Planning The importance of professional engineering inspections Including replacement reserves in investment analysis Replacement Reserve Report Handling Non-recurring Revenue & Expenses Appendices Information Sources and web sites
4 3 Objectives This Video assumes that those attending understand the basics of commercial real estate or have participated in the Video How to Value Income Properties The overall objective of the Video is to provide an understanding of how to carry out in-depth real estate analysis investment and lease analysis and how to apply investment analysis techniques to different types or real estate decisions to help you list, sell or lease real estate during these challenging times. Topics 1. The significant weaknesses in using Cap Rates to make real estate investment decisions compared to the discounted cash flow approach. Examples illustrating the weakness of the Cap Rate approach to establishing value 2. Time value of money concepts. The Internal Rate of Return (IRR) and Net Present Value financial measures 3. Real estate investment and discounted cash flow analysis 4. Risk assessment Case Studies 1. Sale Leaseback analysis 2. Creative financing 3. Lease Comparison Analysis 4. Lease negotiations 5. Buy versus Lease analysis 6. Hold versus Sell analysis 7. Replacement Reserve Planning NOTE: USA versus Canadian calculations The examples provided in the manual are for the USA where the default mortgage setting for the Compounding Period is monthly. For Canada the entries are the same except for mortgages where the Compounding Period is semiannually and the tax inputs and calculations are different The differences between the USA & Canadian tax calculations will be briefly explained.


5 Valuing commercial properties Introduction Using the sale price and the Net Operating Income to calculate the Cap Rate can result in an incorrect Cap Rate because of factors that you were not aware of that influenced the price. Apparent Cap Rate versus the True Cap Rate The Cap Rate is just the tip of the iceberg 4 Factors that distort the Cap Rate. Examples The impact of urgent major repairs on the Sale Price Sale Price: $3,200,000 Net Operating Income: $275,000 per year Apparent Cap Rate = $275,000 x100 = 8.59% $3,200,000 BUT the buyer deducted $425,000 because the roof had to be replaced, the elevator upgraded Sale Price based on Normal building = $3,200,000 + $425,000 = $3,625,000 True Cap Rate = $275,000 x100 = 7.59% $3,625,000 True Cap Rate is 7.59% Apparent Cap Rate of 8.59% A 12.00% difference

6 5 Impact of the timing of lease renewal on cash flows and the property value Question: What is the difference in value between Property A and Property B? The rentable area is 20,000 Sq. Ft Present Value Property A at 13.00% is $3,514,593 Present Value Property B at 13.00% is $2,960,062 NPV at a 13% Discount Rate Property A: $3,514,593 NPV at a 13% Discount Rate Property B: 2,960,062 Difference $ 554,531 (16%)
7 6 Cap Rates. Summary Using a Cap Rate to determine the value of an income property is a very simplistic approach fraught with difficulties. A more realistic approach is Discounted Cash Flow Analysis which projects the cash flow over time and takes into account the Time Value of Money Comparing Case A with Case B above was an example of Discounted Cash Flow Analysis and the use of Net Present Value

8 7 Long Term Real Estate Investment Analysis Introduction Projects the cash flows over time and takes onto account The Time Value of Money Called Discounted Cash Flow Analysis. I m going to borrow $10,000 from you and offer you the following two repayment plans. The annual payment is at the end of each year. Which would you prefer as the lender Plan A or Plan B? Which would you prefer? Plan Why: You have intuitively applied Discounted Cash Flow Analysis and taken into account the Time Value of Money Always balance Risk and Reward Which is more Risky? Plan A or B Choosing between two investments You have a choice to invest in either Property A and B. Each property will generate the following net cash flows. Which one would provide you with the best overall financial return?
9 8 Calculating the Net Cash Flows before Tax Analysis Time Period In the example above the Analysis Period or the Holding Period is 12 years. The property will be sold at the end of the Analysis Period. Acquisition (Net Cash Flow) The purchase is made at Time Period Zero and the Net Cash Flow is: Purchase Price Less: Mortgage Equity (Net Cash Flow. Time Period zero) Note that the Net Cash Flow or Equity which is the cash invested is shown as a negative. For Property A it is minus $1,000,000 because this is an outflow of cash. In contrast, revenue would be shown as a positive number because revenue is an inflow of cash.
10 9 Yearly Cash Flows The calculation of the yearly cash flow is: Potential Gross Income Less: Vacancy Loss Effective Gross Income Less: Operating Expenses Net Operating Income Less: Debt Service (Principal & Interest Payments) Cash Flow before tax Cash Flow in the Last Year At the end of the last year of the Analysis Period the building is sold and we calculate the Sale Proceeds as follows: Sale Price Less: Real Estate & legal fees Repayment of the outstanding mortgage balance Sale Proceeds The Net Cash Flow in the last year is: Net Cash Flow = Operating Cash Flow + Sale Proceeds
11 10 Financial Returns that incorporate the Time Value of Money We need tools to calculate the financial returns which take into account the Time Value of Money in order to: 1. Calculate the financial return on the money invested. Is the financial return acceptable given the degree of risk and the financial returns available from other investment opportunities of similar risk? 2. Compare alternate investment opportunities. The financial tools used are the: Internal Rate of Return (IRR) Net Present Value (NPV) Modified Internal Rate of Return (MIRR). Also called the Financial Management Rate of Return (FMRR) The Internal Rate of Return (IRR) The IRR is the annual compounding return on investment Why is it called the Internal Rate of Return (IRR)? Because of the Reinvestment Assumption If the IRR is 13% this assumes that: a) Excess funds are reinvested at 13% E.g. In Year 4 if the cash flow is +$30,000 it will in reinvested at 13% b) If there is an operating loss, funds are borrowed at 13% E.g. In Year 6 if there is a negative cash flow of -$30,000 it will be borrowed at 13% The reinvestment assumption can cause the Internal Rate of Return (IRR) to be overstated
12 11 Think Compound Interest An Investor has $300,000 to invest. They can: a) invest $300,000 in a building and achieve an Internal Rate of Return (IRR) of 9.00% b) loan $300,000 as a second mortgage at an Interest Rate of 9.00% From a financial perspective the financial returns are the same. Both provide a 9.00% interest rate on the money invested. Always balance Risk and Rewards Which is more risky? Buying a building with a down payment of $300,000 Loan $300,000 as second mortgage Investing versus Lending Invest in Real Estate Second Mortgage Conservative lender Return is unknown Could lose or make money Return is known The interest rate Cash flow and return is uncertain Based on assumptions and projections Payment of principal and interest is known More things can go wrong E.g. Major tenant moves out Building develops toxic mold Very little can go wrong Higher risk Requires a higher return Potential for a large capital gain Less risky than real estate investing

13 12 Relationship between the Internal Rate of Return (IRR) and Compound Interest If you invest $400,000 and get back the following cash flow per year at the end of each year, what is your annual return? Because there is a uniform annual cash flow, any mortgage calculator can calculate the annual compound interest rate for the above cash flow. Present Value: <400,000> Future value: 0 Payment: $160,000 per year. Payment: At end of year. Compounding Frequency: Annual Calculate the Interest Rate Answer: Interest Rate is 9.70% If you put the cash flow into a calculator that has an IRR and NPV function The Internal Rate of Return (IRR) will be 9.70% which is the same as the interest rate of 9.70%. Why we use the Internal Rate of Return (IRR) If you invest $400,000 and get back the following cash flow per year at the end of each year. What is your annual return? A standard mortgage calculator can t calculate the annual interest rate because there is an uneven cash flow. You need a financial calculator with IRR and NPV features.


14 13 Financial Calculators The easiest Financial Calculator to use is the Texas Instrument BAII Plus and BAII Plus Professional. Another popular calculator is the HP-10B but it is a more difficult calculator to use, particularly in Canada where mortgages are compounded semi-annually. Net Present Value (NPV) The value today of the cash flow when taking into account the Time Value of Money Net Present Value of the cash flow is calculated using the Investor s Desired Return, Discount Rate or Opportunity Cost If the Net Present Value is positive: The return is greater than the Investor s desired return or discount rate If the Net Present Value is negative: The return is less than the Investor s desired return or discount rate The Net Present Value (NPV) tells you how much you can pay for the property to get your desired return. Following are the results of the analysis of an apartment building The Net Present Value at 13.00% is <$352,044> In order to achieve a return of 13.00% the purchase price has to be reduced by $352,044 If the priced is dropped by $352,044 the Internal Rate of Return (IRR) will be exactly 13.00%
15 14 Determining the Discount Rate or Desired Return (IRR) We try to find published information of returns with similar risk Government Bond Rate. Not useful because of the very low risk A useful comparison is the second mortgage rate for the property under consideration Example: The second mortgage rate is 8.50% Investor s viewpoint. If I can t get an Internal Rate of Return (IRR) higher than 8.50% then I d be better off being a second mortgage lender For most real estate investments we need to add 1.00% to 5.00% depending on the risk to the second mortgage rate to take into account the additional risks of buying a property compared to being a conservative second mortgage lender. Discount Rate or Desired Return. 9.00% up to 15.00% or higher depending on risk. A typical figure for a medium risk investment is around 13.00% IRR before tax Exception. Prime rental apartments with very low Cap Rates (4.00% to 5.00%) because of the low vacancy risk and potential for strong capital appreciation For a Cap Rate of 4.50% the IRR is around 6.50% Note: You cannot easily compare a Cap Rate with an Internal Rate of Return (IRR) To compare the Cap Rate with the Internal Rate of Return IRR) you need to you need to carry out a cash flow analysis on a specific property.
 is 13.32% Positive cash flows will be reinvested at 13.32% Negative cash flows or losses will be borrowed at 13.")
16 15 Modified Internal Rate of Return (MIRR) The Internal Rate of Return (IRR) reinvestment assumption may cause an overstatement of the Internal Rate of Return (IRR). As an example: Internal Rate of Return (IRR) is 13.32% Positive cash flows will be reinvested at 13.32% Negative cash flows or losses will be borrowed at 13.32% An alternate to the Internal Rate of Return (IRR) is the Modified Internal Rate of Return (MIRR) The Modified Internal Rate of Return (MIRR) uses a short term: Financing Rate. Example 7.50% Reinvestment Rate. Example 1.50% Example. The financial results of a rental apartment building cash flow analysis Internal Rate of Return (Before Tax): 13.32% Modified Internal Rate of Return (MIRR): 11.45% Short Term Financing Rate (Before Tax): 7.50% Short Term Borrowing Rate (Before Tax): 1.50%


17 16 The building blocks of Real Estate Investment Analysis The best way to analyze long term real estate investments is to develop the Net Cash Flow. Cap Rates are far too simplistic for properly evaluating a real estate investment. The end result is the Net Cash Flow Report. The financial measures we use are the Internal Rate of Return (IRR), Net Present value (NPV) and Modified Internal Rate of Return (MIRR)
18 17 Real Estate Investment analysis. Case Study Mixed Use Building One Bedroom Units: 20 Two bedroom Units: 9 Retail space: 5,000 Sq. Ft Parking: 40 spaces Analysis Period: 10 years Investment (Asking Price) $3,000,000 (Land: $1,000,000 Building: $2,000,000) Financing Option A. Conventional first mortgage with 60% Loan to Value Ratio First Mortgage: $1,800,000 Interest 6.00% 25 Amortization: 25 years Loan to Value Ratio: 60% Equity: $1,200,000 (40%) Option B. Seller provides a second mortgage for 5 years To reduce the buyer s equity from 40% to 25% the seller provides a second mortgage of $450,000 for five years. First Mortgage: $1,800,000, Interest Rate: 6.00%, 25 Amortization for 5 years Loan to Value Ratio: 60% Second mortgage: $450,000 interest only mortgage at 8.00% for 5 years Equity: $750,000 (25%) At the end of the first 5 years: 1. The outstanding balance of the first mortgage and the second mortgage of $450,000 is paid off. 2. A new first mortgage is placed on the property beginning of Year 6 January using a 1.25 Debt Service Coverage Ratio for $2,500,000 at 6% interest, 25 year amortization.
19 18 Revenues & Expense Projections REVENUE Number First Year Increase per Yr. Vacancy One Bedroom Units 20 Units $900 per mos. 3% per year compounding Two bedroom Units 9 Units $1,100 per mos. 4% per year compounding Laundry 29 Units $15 per mos. 5% per year compounding Retail Space 5,000 Sq. Ft Base Rent $15 per Sq. Ft per yr for 3 years then $16.39 for 5 years then $19.47 per Sq. Ft per yr. Additional Rent (TIM s) $3.00 per Sq. Ft per year increasing at 3.50% compounding per year Parking 40 spaces $45 per month 5% per year compounding 3% 3% 3% Zero Zero EXPENSES Property Taxes - $90,000 per Yr. 5% for next two years then 4% per year compounding Insurance - $45,000 per Yr. 5% per year compounding Maintenance. Rental Units 29 Units $400 per Yr. 4% per year compounding Maintenance. Retail Space - $700 per mos. 3% per year compounding Resident Caretaker - $3,000 per mos. 4% per year compounding Property Manager - 4% of Effective Gross Income Other Expenses - 3% of Potential Gross Income Sale at the end of the 10 year Analysis Period Sale Price. Based on a 7.00% Cap Rate using the Net Operating Income for the year following the sale Real Estate Fees: 4.00% of the Sale Price Selling Expenses: $6,000 Legal Fees: $5,000 Questions 1. How much to pay for the property to get a 13% return (Internal Rate of Return) before tax? 2. How does the return (Internal Rate of Return) change if the seller carries a second mortgage for $450,000 interest only loan at 8% for five years? The property will be refinanced at the end of the fifth year using a Debt Service Coverage Ratio (DSCR) of How much money does the investor receive when the property is refinanced at the end of the first five years?
20 19 Common real estate investment analysis reports Option A. Conventional first mortgage with 60% Loan to Value Ratio Net Cash Flow Report (Money Tree Diagram) Provides a broad overview of the investment over the ten year period. Question 1. How much to pay for the property to get a 13% return (Internal Rate of Return) before tax? Answer: $3,000,000 81,854 (NPV at 13%) = $2,918,146

21 20 Purchase Price versus the Desired Return Example: If we wanted a 13% Return (IRR) the most we can pay for the property is just under $3,000,000 Goal Seeking How much to pay for the property to get the desired return of 13%?.
22 21 Overall Operating Cash Flow Report Show all the inflows and outflows and the financial results over the analysis period of ten years.
23 22 Operating Cash Flow Report Shows the before and after tax cash flows from operations over the analysis period of ten years. Income & Expense Statement
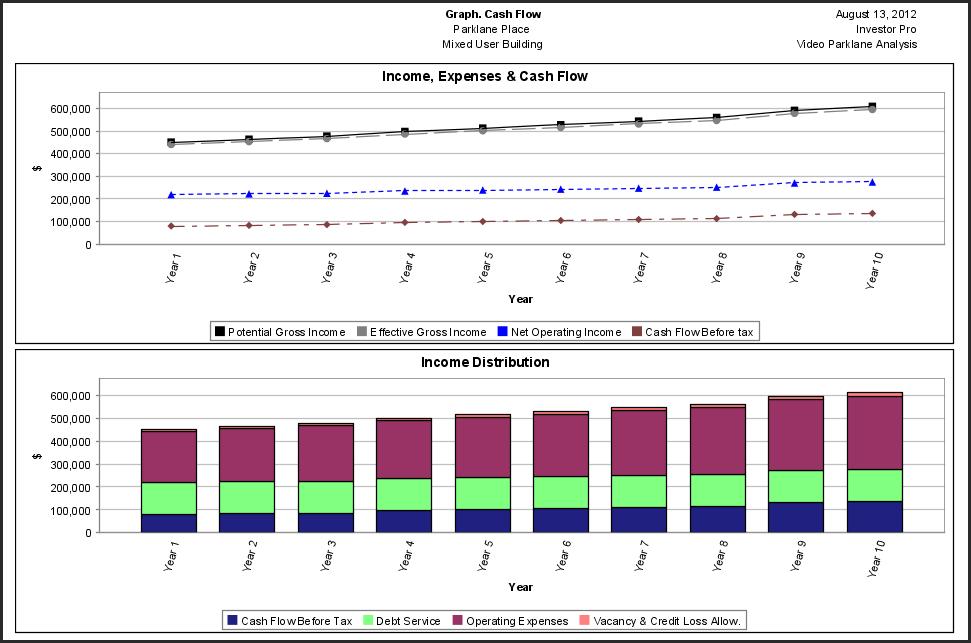
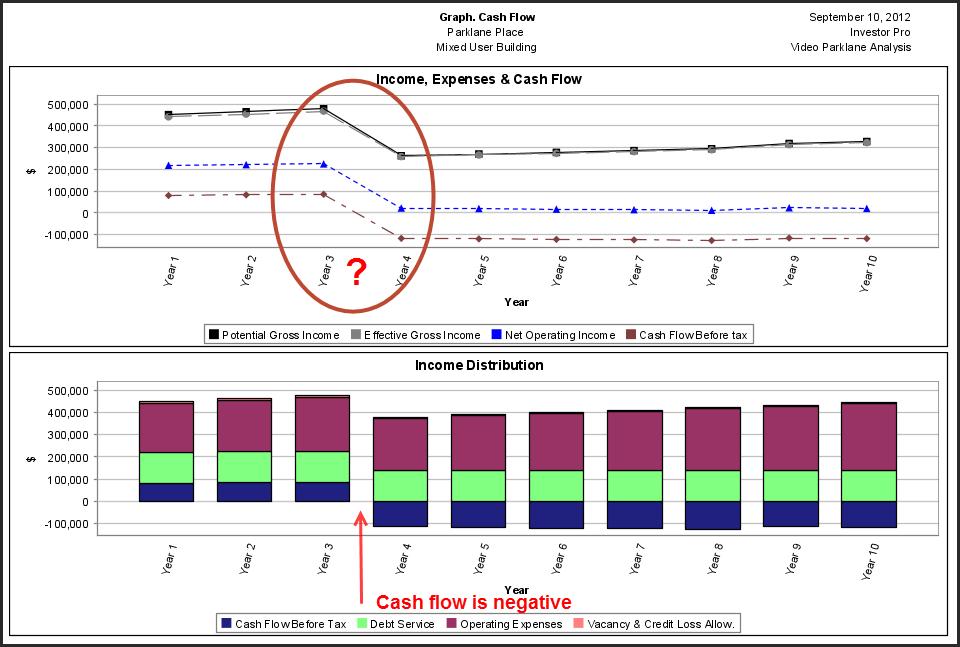
24 Cash Flow Projection Graph 23
25 24 Cash Flow from Sale Shows the cash flow from sale (before and after tax) when the property is sold in ten year time. Sometimes called the Reversionary Value
26 Financial Measures. Financing Potential & Risk Assessment 25
27 26 Appraiser s Approach to Present Value Appraisers like to examine: How much of the Present Value is generated by: 1. Net Operating Income 2. Capital Appreciation and sales proceeds (Called the Reversionary Value) This analysis is done without financing and before tax. This approach can identify if there is too much reliance on Capital Appreciation instead of the Net Operating Income in determining the value
28 Revenue & Expense Projections 27
29 28 Determining the optimum holding period Assumes the building is sold at the end of each year. In this example, the maximum Internal Rate of Return (IRR) is 15.56% before suggesting the best time to sell the building is at the end of year 3
30 29 Investment Analysis. Option B. Seller provides a second mortgage for 5 years To reduce the buyer s equity from 40% to 25% the seller provides a second mortgage of $450,000 for five years. First Mortgage: $1,800,000, Interest Rate: 6.00%, 25 Amortization for 5 years Loan to Value Ratio: 60% Second mortgage: $450,000 interest only mortgage at 8.00% for 5 years Equity: $750,000 (25%) At the end of the first 5 years: 3. The outstanding balance of the first mortgage and the second mortgage of $450,000 is paid off. 4. A new first mortgage is placed on the property beginning of Year 6 January using a 1.25 Debt Service Coverage Ratio for $2,500,000 at 6% interest, 25 year amortization. Question: How does the return (Internal Rate of Return) change if the seller carries a second mortgage for $450,000 interest only loan at 8% for five years? The property will be refinanced at the end of the fifth year using a Debt Service Coverage Ratio (DSCR) of 1.25
31 30 Net Cash Flow Report Option B with Seller Financing Financial Impact with Seller s second mortgage
32 31 Comparison Report What happens when the building is refinanced in 5 years? Create a new first mortgage $2,500,000 Pay off OSB First Mortgage 1,608,777 Pay off OSB Second Mortgage 450,000 New owner gets $ 431,223 When the new mortgage is put in place at the end of the first five years the funds will be used to pay off the outstanding balance of the existing first mortgage of $1,608,777 and the second mortgage of $450,000 with the investor receiving cash of $431,223.
33 32 Summary from the Buyer s and Seller s perspective It is helpful to summarize the advantages and disadvantages from the buyer s and seller s perspective Summary from the buyer s perspective The challenge For the buyer to get a 13% IRR before tax the price has to drop from $3,000,000 by $81,854 to $2,918,146. The challenge is that the buyer has to come up with 40% equity which is a lot of money. This will make it hard to put the deal together. The good news The analysis indicates that there is plenty of room to have the seller provide a second mortgage for five years. The solution Explore a second mortgage with the seller $450,000 Interest only at 8.00% for five years Refinance the first mortgage at the end of 5 years Financial impact of the buyer The seller s second mortgage increases the return (IRR) from 12.04% to 15.27% Reduces the buyer s equity from 40% to 25% Refinancing at the end of five years the buyer (investor) receives $431,223 cash Risk Default or Breakeven Point goes for 80% to 88% which is a little high Debt Service Ratio goes from 1.58 to 1.25 Carrying the seller s second mortgage increases the risk but the investment is relatively safe with a 1.25 Debt Service Ratio. Summary from the seller s perspective Agreeing to the second mortgage arrangement makes the property much easier to sell There are many more buyers if the equity is 25% compared to 40% equity Recommendations 1. Check that the current first mortgage allows a second mortgage to be placed on the property 2. Find out if the first mortgage can be paid off in five years time 3. Consult with an accountant to establish the tax consequences of selling the property and carrying a second mortgage 4. If cleared by your legal and tax advisors offer the second mortgage but consider increasing the price above $3,000,000 because the second mortgage increases the buyer s return from 12.04% to 15.20% and the buyer s desired return is 13%

34 33 Recap We started by asking the following questions: 1. How much to pay for the property to get the investor s desired return of 13% before tax? 2. Is there potential for increasing the financing now or in the future? 3. How risky is the investment? 4. What is the financial impact on having the seller carry a second mortgage at 8.00% for five years? We then carried out real estate investment analysis to answer these questions and developed recommendations from the buyer s and seller s perspective. Summary. The building blocks of investment analysis
35 34 Cash Flows. Timing and Sign Conventions Introduction When carrying out discounted cash flow analysis and calculating the Internal Rate of Return (IRR) and the Net Present Value (NPV) we follow the industry standard timing and sign convention. The reason we use a timing convention is because we are discounting the cash flow back to time period zero or the beginning of the first year to calculate the Internal Rate of Return and Net Present value Time period zero. This is when the initial investment is made. The beginning of the first year Cash flows. Occur at either the beginning or end of the year even if they occur during the year Examples: Investments are assumed to be made at the beginning the year Revenues occur at the end of the year Sign convention. The best way to decide whether a cash flow is Positive or Negative is from the investor s viewpoint and their bank account. Money coming into the investor s bank account is positive such as: Rent and other revenues, sale of the building at the end of the analysis period Creation of a mortgage Money going out of the investor s bank account is negative such as: Initial investment and future capital expenditures Expenses, principal and interest payments. Repayment of a mortgage Investment and Future Capital Expenditures We can analyze an investment using either Before or After tax analysis. Before Tax Analysis. The investment or purchase price can be a single number. E.g. $3,000,000 After Tax Analysis. In order to set up the depreciation we break the purchase into Land and Improvements. Land is not depreciable but the improvements are. Land $ 1,000,000 Non depreciable Improvements 2,000,000 Depreciable asset Purchase Price $ 3,000,000 Investments and Future Capital Expenditures. Timing and sign convention Timing Sign Convention Purchase (Investment) Beginning of year Negative +$3,000,000 (Outflow) Future capital expenditures Roof replacement. Year 6 Beginning of year Negative <$250,000 per mos.> (Outflow) Example. If the roof was replaced in August of Year six for <$250,000> the expenditure is assumed to be made at the beginning of year 6 (or the end of year 5) for discounting purposes
36 35 Financing & Refinancing Creation of a mortgage For discounting purposes, the creation of a mortgage is assumed to occur at the beginning of the year even if the funds were received during the year. If the mortgage was arranged when the property was purchased the funds are assumed to be received at the beginning of the year which is time period zero. Strange as it may seem, funds flowing from the creation of a mortgage are Positive because they are a cash inflow from the investor s perspective. Repayment of a mortgage A mortgage may be repaid at any time during the analysis or holding period>. The outstanding mortgage balances at the end of the Analysis Period are always repaid when the property is sold. For discounting purposes, the repayment of a mortgage is assumed to occur at the end of the year even if the mortgage was repaid much earlier in the year. Principal and Interest Payments Generally paid monthly but are assumed to be paid at the end of the year when discounting the cash flows to calculate the Internal Rate of Return (IRR) and Net Present Value (NPV) Principal and interest payments are negative because they are a cash outflow. Financing. Timing and sign convention summary Timing Sign Convention Creation of the mortgage Beginning of year Positive <$1,800,000> (Outflow) Repayment of the mortgage End of year Negative <$1,374,333> (Outflow) Payments of Principal & Interest End of year Negative <$11,597 per mos.> (Outflow)
37 36 Revenues, Expenses & Vacancy Allowances In developing the cash flows we project the revenues, vacancies and expenses out over the analysis or holding period plus one year. As an example, if the analysis period was 10 years we would project the revenues, vacancies and expenses over 11 years even though the property is being sold at the end of the tenth year. The reason we project one year past the analysis period is that we want to develop the Net Operating Income for the year following the sale. Investors and appraisers, while interested in past performance, are most focused on future incomes and expenses. The traditional way to calculate the sale price the end of the analysis period is to use the Net Operating Income for the year following the sale and the appropriate Cap Rate. Timing Revenues and expenses are assumed to occur at the end of the year even though the rents may be received monthly. Most expenses are paid monthly. Some expenses such as property taxes and insurance may be paid yearly. As an example, if the rent is $12,000 per month and received at the beginning of the month, the rent for the year is $144,000 and is assumed to be received at the end of the year when discounting to calculate the Internal Rate of Return (IRR) and Net Present Value (NPV) Sign Convention Revenues are cash inflows and are positive. Expenses are cash outflows and are negative Revenues & Expenses. Timing and sign convention summary Timing Sign Convention Revenues. Rent Year 1 End of year Positive +$46,000 (Inflow) Expenses. Property Taxes End of year Negative <26,000> (Outflow)
38 37 Sale and Selling Expenses At the end of the analysis period the property is assumed to be sold. There are a variety of ways to calculate the value of the property at the end of the analysis period but the most common method is to use the Net Operating Income for the year following the sale and a Cap Rate. We also have to estimate the real estate and legal fees and associated closing costs Timing The sale proceeds is assumed to occur at the end of the last year of the analysis period when discounting to calculate the Internal Rate of Return (IRR) and Net Present Value (NPV) If the analysis period was 10 years the sale is assumed to occur at the end of the tenth year. Selling expenses such as real estate and legal fees and associated closing costs are assumed to have occurred at the end of the analysis period for discounting purposes. Sign Convention The Sale Price is a positive number because the cash received from the sale is a cash inflow. Selling expenses such as real estate and legal fees and other closing costs are negative because they are expenses or cash outflows. Sale and Selling Expenses. Timing and sign convention summary Timing Sign Convention Sale of the building End of year Positive +$3,612,335 (Inflow) Closing costs RE & legal fees End of year Negative <$11,000> (Outflow)
39 38 Timing and Sign Conventions. Summary This table summarizes the traditional timing and sign conventions used in real estate investment analysis when carrying out discounted cash flow analysis and calculating the Internal Rate of Return (IRR) and Net Present Value (NPV). Timing Sign Convention Purchase Time period zero Negative <$3,000,000> (Outflow) Beginning of year 1 Future capital expenditures Roof replacement. Year 6 Beginning of year Negative <$250,000 per mos.> (Outflow) Creation of the mortgage Beginning of year Positive +$1,800,000 (Inflow) Repayment of the mortgage End of year Negative <$1,374,333> (Outflow) Payments of Principal & Interest End of year Negative <$11,597 per mos.> (Outflow) Revenues. Rent Unit A End of year Positive +$46,000 (Inflow) Expenses. Utilities End of year Negative Utilities <$26,000> (Outflow) Sale of the building End of year Positive +$3,612,335 (Inflow) Closing Costs Selling & legal fees End of year Negative <$11,000> (Outflow)
40 39 Cap Rate versus Internal Rate of Return (IRR) This table compares the difference between the Cap Rate and the Internal Rate of Return (IRR) in determining the value of an income property. Only considers one year Cap Rate Discounted Cash Flow Analysis & IRR Considers many years Property is never sold Net Operating Income is constant Year 1 $120,000 Yr ,000 forever Ignores future capital expenditures Year 6. Replacing the roof for Excludes financing Simple and quick Rule of Thumb Ignores the impact of taxes How realistic? Property is sold at end of Analysis Period Income & Expenses change every year Includes future capital expenditures Includes financing and refinancing Comprehensive analysis Can be used for before & after tax analysis More realistic. Much better assessment of the financial performance of the investment
41 40 Cap Rate vs. the Internal Rate of Return (IRR) The Cap Rate and the IRR are two completely different financial measures or returns. They cannot be compared. It s like comparing apples and oranges Let s look at a very simple analysis using the Cap Rate method and the Discounted Cash Flow Analysis approach using the Internal Rate of Return (IRR). Case Study. Property Type. Income property Analysis Period: 5 years Asking Price: $1,000,000 Income & Expense Statement Revenue $125,000 (After vacancy allowance) increasing at 2.5% per year compounding Expenses (40%) 50,000 Net Operating Income 75,000 Financing Loan Amount: $600,000 Loan to Value Ratio is 60% Interest Rate: 6.00% Amortization Period: 25 years Sale Price: The sale price at the end of the five years is based on the Net Operating income in year 6 using a 7.50% Cap Rate Cap Rate Approach Cap Rate = Net Operating Income x 100 = 75,000 x 100 = 7.50% Price 1,000,000
42 41 Discounted Cash Flow Analysis approach. Net Cash Flow Report Results The Cap Rate is 7.50% and the Internal Rate of Return is 15.08% which is closer to the true financial return. The Internal Rate of Return (IRR) takes into account: 1. Financial leverage which generally increases the return but increase the risk 2. That rents increase each year 3. That the property is sold at the end of the Analysis Period 4. Take into account the Time Value of Money The Cap Rate ignores these important factors and assumes the following: 1. Net Operating Income is constant and goes on for ever Yr. 1 $75,000 Yr. 2 $75,000 etc. 2. The property is never sold 3. Ignores the time value of money

43 42 Cap Rate and the Internal Rate of Return (IRR) Case Study Following is an analysis carried out to show the relationship between the Cap Rate on purchase and the Internal Rate of Return for a specific property using the following assumptions: The analysis looked at holding the property for ten years then selling. The sale price in ten years time was calculated the Net Operating Income (NOI) in the 11 th year using the Cap Rate on purchase. As an example, if the Cap Rate on purchase was 5.00%, the Cap Rate used to determine the sale price at the end of ten years was 5.00%. Rental Apartment Building Analysis Period: 10 years Value in 10 year time is based on the NOI in the 11 th year using the purchase Cap Rate Rents. Increase at 3.00% per Yr compounding Expenses. 43% Operating Expense Ratio Debt Service Ratio maintained at 1.25 Cap Rate & IRR Analysis. Results. Cap Rate versus the Internal Rate of Return Example. If the Cap Rate on Purchase was 6.00% the Internal Rate of Return (IRR) is 10.29%
 The only way to connect a Cap Rate and the Internal Rate of Return is by analyzing a")
44 43 Relation between the Cap Rate and the Internal Rate of Return (IRR) Vancouver Downtown office market Source: Altus Group. In Depth report June 2011 Conclusion: Relationship between the Cap Rate & the Internal Rate of Return (IRR) The only way to connect a Cap Rate and the Internal Rate of Return is by analyzing a specific income property. We can however make the following observations: 1. The Internal Rate of Return is generally higher than the Cap Rate under normal circumstances 2. For a typical Cap Rate of 7% to 8% the Internal Rate of Return before tax will be around 12% to 14% 3. The lower the Cap Rate the lower the Internal Rate of Return (IRR) but also the lower the risk 4. A good rule of thumb for the investor s Desired Return (IRR) or Discount Rate is 12% to 14% before tax for Cap Rates around 7.5% Caution These are very general observation and may not always apply. There are many factors that influence the Internal Rate of Return and the investment risk such as: 1. The financial leverage. Increasing the financings lowers the equity and increase the Internal rate of return but increases the risk which the example shows. 2. The quality of the tenants. The poorer the quality of the tenant the higher the risk of defaulting on the rent or moving out prematurely 3. Whether a major tenant will renew their lease when it expires 4. Future major expenditures such as replacing the roof, a boiler or the HVAC system All of these will influence the Internal Rate of Return and the relationship with the Cap Rate
45 44 When does the Cap Rate equal the Internal Rate of Return? The Cap Rate and the Internal Rate of Return are nearly the same when: 1. The income is constant and goes on for many years. At least 75 years 2. There is no residual value such as the sale of the property or asset Case Study A farmer has leased a section of his farm to a wind farm operator for $100,000 for 40 years. An investor is interested in buying the remaining income stream for $1,200,000. There is 25 remaining on the lease. Question: What is the Cap Rate and the Internal Rate of Return? Cap Rate = $100,000 x 100 = 8.33% $1,200,000 Internal Rate of Return Investment <$1,200,000 Annual Cash Flow $100,000 per year for 25 years Internal Rate of Return: 6.678% The following table shows the Internal Rate of Return for different numbers of years Number of Years At $100,000 per year Internal Rate of Return Cap Rate % Difference % 8.33% 25% % 8.33% 14% % 8.33% 4.89% % 8.33% 1.93% % 8.33% 0.22% % 8.33% 0.00% Conclusion For the Cap Rate and the Internal Rate of Return to be the same requires: 1. A constant annual income. The example uses $100,000 per year 2. There is no residual or reversionary value at the end of the time period 3. Long the time period. Fifty years
46 45 Cap Rate versus Internal Rate of Return (IRR). Summary The Cap Rate is a very simplistic, quick approach to valuing an income property and is based on the following assumptions: 1. The Net Operating Income is constant and goes on forever 2. The property is never sold The Cap Rate approach ignores the time value of money and that cash flows change over time. In contrast, the discounted cash flow approach which generates the Internal Rate of Return (IRR) takes into account the changing cash flows resulting from buying, financing, operating and selling the property over the ownership period. The discounted cash flow analysis is a much more comprehensive and rigorous approach than the Cap Rate and is the best approach for analyzing complex real estate investments. Relationship between the Cap Rate and the Internal Rate of Return (IRR) The only way to connect the Cap Rate and the Internal Rate of Return (IRR) is to explore the relationship between the Cap Rate and the Internal Rate of Return (IRR) is by carrying out discounted cash flow analysis on a specific property and then varying the purchase Cap Rate to see the impact on the Internal Rate of Return (IRR) Some general observations: 1. The Internal Rate of Return is generally higher than the Cap Rate 2. The lower the Cap Rate the lower the Internal Rate of Return (IRR) but also the lower the risk 3. On a typical investment where the Cap Rate is around 7.5% the Internal Rate of Return (IRR) is around 12% to 14% When does the Cap Rate equal the Internal Rate of Return (IRR)? The Cap Rate and the Internal Rate of Return (IRR) are the same if the following conditions exist: 1. A constant annual income. Example $100,000 per year for 50 years 2. There is no residual or reversionary value at the end of the time period 3. Long the time period is involved. A minimum of 50 years
47 46 What does the term Return mean? There are various terms used to describe a Return on investment If an investor asks what is the: Return? Yield? Return on Investment? ROI? Bottom line?.you need to ask the investor to define what they mean by: Return, Yield, Return on Investment, ROI or the Bottom Line The following are all financial returns on investment: Cap Rate =Net Operating Income x 100 Price Return on Equity. Also called Cash on Cash the Equity Dividend Rate = (Net Operating Income Debt Service) x 100 Equity Internal Rate of Return (IRR) Modified Internal Rate of Return (MIRR) Also called the Financial Management Rate of Return or FMRR Investor s Discount Rate. The discount rate is equivalent to the Internal Rate of Return Sometimes investors develop their own method of calculating a financial return which works for them. As an example, an investor has developed her own method for calculating the Return on Investment and uses the following formulae: Return on Investment (ROI) = Avg. yearly cash flow + (Sale Price Purchase Price)/No. of Yrs Initial Equity

48 47 Real Estate Taxation. Overview The table shows the different kinds of real estate taxes and the difference between the USA and Canadian calculations. Both countries have: Taxes on yearly operating profits Mortgage interest is a deductible expense Allow the depreciation of the improves but not the land Capital gain tax Recaptured depreciation tax which occurs if too much depreciation has been claimed The major difference is how the taxes are calculated.
49 48 Capital Gains Tax A capital gain is the difference between what you paid for an investment and what received when you sold that investment. You have a capital gain when you sell, or are considered to have sold, a capital property for more than the total of its cost basis and the outlays and expenses incurred to sell the property. Cost Basis The Cost Basis is: 1. Purchase price plus acquisition costs such a legal and appraisal fees, transfer costs etc. 2. Plus Capital Expenditures such as replacing the roof, elevator, HVAC system etc. Amount Realized or Proceeds of Sale on Disposition The Sale Price less selling expenses such as legal, real estate fee, advertising costs etc. Capital Gain Capital Gain = Amount Realized on Sale Cost Basis Capital Gains Tax USA Generally 15% but different rates apply to low income earners Canada. 50% of the gain is added to individual or corporate income and taxed at the investor s marginal tax rate
50 49 Depreciation Claims Assets, such as real estate improvements have a useful life longer than one year and are expensed over time thoroughly yearly depreciation claims. The impact of the yearly depreciation claim is to increase the after tax cash flow because depreciation is a non cash expense. Each year the investor claims depreciation following the rules established by the tax department on the capital assets to reduce the taxable income as shown below and claims the depreciation as an operating expense. Land cannot be depreciated for tax purposes. Note: In Canada depreciation for tax purposes is called Capital Cost Allowance or CCA Amortization Refers to spreading an intangible asset's cost over that asset's useful life. For example, the cost of acquiring a lease by the landlord such as the leasing fee or cash payments to the tenant for leasehold improvements would likely be amortized over the term of the lease depending on the applicable tax rules. Example: To acquire a lease with a five year term the landlord pays the leasing agent $40,000 and gives the tenant $80,000 cash for leasehold improvements. The total cost of acquiring the lease is $120,000 which would be amortized over the 5 year term at $120,000/5 at $24,000 per year. From the tenant s perspective the $80,000 cash inducement is treated as income.
51 50 Recaptured Depreciation Tax When the property is sold, if the value of the improvement on sale is greater than the Depreciated Balance there will be recaptured depreciation tax. Allocation of the purchase price between and improvements When the property is sold, the buyer and seller will negotiate the allocation of the sale price between: Land Improvements The Seller wants the value of the improvements to be low to minimize or avoid depreciation tax The buyer wants the value of the improvement to be high in order to maximize the yearly depreciation claims claim and minimize yearly income taxes Recaptured depreciation on sale. USA Example Capital Gain: Gain is taxed at 15.00% Recaptured Depreciation: Taxed at 25.00%
52 51 Recaptured depreciation on sale. Canadian Example Capital Gain: 50% of the Gain is added to income & taxed at the Investor s marginal tax rate Recaptured Depreciation: Added to income and taxed at the Investor s marginal tax rate
53 52 Calculating Recaptured Depreciation The following table shows how the recaptured depreciation tax depends on the allocation of the purchase price between the Land and the Improvements. Recaptured depreciation tax can range from zero to a full recapture where all the depreciation claimed over the period of ownership is subject to recaptured depreciation tax. No recaptured depreciation tax If the value of the improvements on sale is equal to (which means the improvements have been perfectly depreciated) or less than the undepreciated balance or adjusted basis the recaptured depreciation tax is zero. Full recapture A full recapture occurs when the value of the improvements on sale is greater than on acquisition which means the improvements have appreciated not depreciated in value. In this case all the depreciation claimed is subject to recaptured depreciation tax Note that recaptured depreciation cannot be more than the depreciation claimed. Partial recapture Occurs when the value of the improvements on sale is less than on acquisition but greater than the undepreciated balance or adjusted cost basis. The difference between the value of the improvement on sales and the undepreciated value or adjusted cost basis is subject to recaptured depreciation tax Capital Gain. Appreciation is taxed as a capital gain. The increase in value of $1,000,000 is the purchase price of $3,000,000 minus the acquisition cost of $2,000,000 is taxed as a capital gain
54 53 Properties that may be hard to sell because of tax implications Characteristics: 1. Owned for a long period of time 2. Gone up a lot in value 3. Heavily depreciated and there is a large mortgage on the property. When the owner sells: Large Capital Gain. USA 15% of the gain is added to income Canada 50% of the gain is taxed at the marginal tax rate Large Recaptured Depreciation Tax. USA. Recaptured Depreciation is taxed at 25% Canada. Recaptured Depreciation is added to income and taxed at the marginal tax rate Large real estate fee and closing costs..and a large mortgage to pay off The result. There is little money left from the sale Seller Financing. Tax issues Be careful about having the owner carrying financing without first checking with a tax accountant. If the proceeds from the sale, after paying off the mortgage is small, there may not be enough money for the seller to pay the Capital Gains Tax and Recaptured Depreciation Tax as well as the real estate and legal fees.
55 Properties that may be hard to sell because of mortgage restrictions Sometimes the mortgages registered on the property have restrictions that make it difficult to sell the property such as: 1. The mortgage cannot be paid off until the end of the term 2. The mortgage can be paid off but the penalty is very high making it difficult to pay off the mortgage 3. The first mortgage may not allow a second mortgage to be placed on the property preventing the seller from offering a second mortgage to reduce the equity needed by the buyer Example A seller and a buyer have agreed upon a price of $4,850,000 for a prime mixed use building but unfortunately the mortgage makes it difficult to complete the deal. The details of the existing first mortgage are: Loan Amount $2,750,000 Outstanding Balance: $2,319,000 Interest Rate: 6.50% Monthly Payment: $17,000 Prepayment Period: The mortgage can t be paid off for another 4 years Restriction: A second mortgage cannot be placed on the property The buyer can arrange a new first mortgage for 4.50% for $3,500,000 with a Loan to Value Ratio of 72% Issues facing the buyer are: 54 Prepayment Equity Interest Rate Future Rate Leverage Return (IRR) Can t pay off the first mortgage for 4 years 48% or $2,531,000 versus 28% or $1,350,000 for the new mortgage 6.50% versus 4.50% current market interest rate Will the interest rate be higher than 4.50% in 4 years time? The higher equity reduces the financial leverage Unless the price is dropped significantly the IRR will be much lower 2 nd Mortgage Not allowed. Can t set up a 2 nd mortgage with the seller Unless the seller is willing to drop the price significantly the first mortgage restrictions will prevent the sale of the property.
56 55 Real Estate Investment Analysis Tips Following are some tips to consider before starting an analysis. Analysis Tips 1. Think about how you are going to think 2. Decide on the type of type of real estate analysis? 3. Make the following decisions before starting the analysis Monthly or yearly analysis? The Analysis Period? Before or after tax analysis? 4. Start with the questions you want answered 5. Gather the information before starting the analysis 6. Keep the initial analysis simple to go through the process. Then refine. 7. Develop ways to double check your results 1. Think about how you are going to think Before jumping into the analysis think about what you are analyzing and how you are going to go about the analysis. Most of the time this is obvious such as straight forward investment analysis. As a consultant I was asked to help solve the following project. The investor was purchasing a mixed use building for $4,850,000 and had arranged a first mortgage of $3,500,000, 4.50% interest, 25 year amortization to finance the acquisition. During the closing process he found out to his surprise that the current first mortgage with a balance of $2,319,000, 6.50% interest, $17,000 monthly payment, couldn t be paid off for another four years. In addition the mortgage specified that a second mortgage couldn t be placed on the property preventing the seller from offering a second mortgage. Existing First Mortgage Seller s New mortgage Loan Amount OSB $2,319,000 $3,500,000 Interest Rate 6.50% for 4 years 4.50% Monthly Payment Equity Required $17,000 $19, Yr. Amortization $2,531,000 (52%) $1,350,000 (28%)
57 56 Summary Agreed Price $4,850,000 New mortgage Prepayment $3,500,000 (72% LTV) 4.50% 25 year amortization Can t pay off the first mortgage for 4 years 2 nd Mortgage Not allowed. Can t set up a 2 nd mortgage with the seller Existing Mortgage OSB $2,319,000 Interest Rate 6.50% Monthly Payment $17,000 Equity 52% or $2,531,000 versus 28% or $1,350,000 Interest Rates 6.50% for the existing mortgage versus 4.50% current market rate Future Rate Estimated interest rate in 4 years time is 6.00% The Investor s Questions How much does the price have to be reduced to offset the financial impact of assuming the unfavorable existing first mortgage? With a lower price what equity is required? Important Assumption It was felt that when the current mortgage expired in four years time it would be replaced with a new mortgage for $3,500,000. It was estimated at this time that the mortgage rates will have moved from today s rate of 4.50% to 6.00% in four years time. Approach The following approach was used to determine the reduction in price to offset the costs to the purchaser caused by the inability to put a new first mortgage on the property for $3,500,000, 4.50% interest, 25 year amortization. A) What is the return (IRR) over a ten year period if the investor buys the building using the New financing and the seller pays off the existing mortgage? B) What is the return (IRR) if the buyer assumes the unfavorable first mortgages and replaces it with a new mortgage for $3,500,000 at the beginning of year 5? C) How much would you have to pay for the property to get the same Internal Rate of Return if the buyer assumes the existing unfavorable first mortgage and refinances at the beginning of year 5 for $3,500,000, 6.00% interest, 25 year amortization
 Using the agreed price of $4,850,000 what is the return (IRR) if the buyer assumes the unfavorable first mortgages and replaces it with a new mortgage for $3,500,000 at the")
58 57 Results A) What is the return (IRR) over a ten year period if the investor buys the building using the New financing and the seller pays off the existing unfavorable first mortgage? Answer 11.41% before tax B) Using the agreed price of $4,850,000 what is the return (IRR) if the buyer assumes the unfavorable first mortgages and replaces it with a new mortgage for $3,500,000 at the beginning of year 5? Answer 8.23% before tax
59 C) What is the purchase price that provides an 11.41% return (IRR) if the buyer assumes the unfavorable first mortgages and replaces it with a new mortgage for $3,500,000 at the beginning of year 5? Answer $4,410, Buying the property for $4,410,994 assuming the unfavorable first mortgage and refinancing at the end of four years provides the same return (IRR) as buying the property for $4,850,000 and replacing the existing unfavorable first mortgage which is 11.41%
60 59 Summary and Conclusions Price Equity Return (IRR) Put the new mortgage on the property for $3,500,000, 4.50%, 25 years amortization. $4,850,000 28% $1,350, % Assume the unfavorable first mortgage refinance at end of 4 years Assume the unfavorable first mortgage refinance at end of 4 years $4,850,000 52% $2,531,000 $4,410,000 47% $2,091, % 11.41% Observations and Comments from the case study 1. For unique financial problem Think about how you are going to think before you start analyzing more complex or unique investments and situations like the above example Then test using a simple example. Add the complexity later. 2. The importance of understanding how to use discounted cash flow analysis 3. Shows how to use investment analysis to structure difficult deal
61 60 2. Decide on the type of real estate analysis? Real estate investment or discounted cash flow can be applied to many types of real estate analysis. The starting point in analyzing real estate is to decide on the type of analysis. a) Investment Analysis This applies to the purchase or valuation of income properties such as buying an income property and holding it for say ten years and then selling. Investment analysis helps answers questions such as: How much should I pay for the property to get my desired return? What is the property worth? Should I buy property A or B? As a realtor should I try and sell the property? Is it overpriced and unlikely to sell? b) Buy versus Lease Analysis I m tired of paying the monthly rent. Would I be better off to buy a property or rent? Because of the tax implications buy versus lease analysis should be done after tax c) Hold versus Sell Analysis or Hold & Refinance & Sell I ve owned this property for a number of years, would I be better off to keep or sell the property and invest the after tax proceeds in another investment? Because of the tax implications buy versus sell analysis should be done after tax. For free videos and a manual on Hold versus Sell analysis please visit and select the Learning Center tab. d) Cash Flow Forecasting & Budgeting Cash flow forecasting and budgeting is different than investment analysis because the investor owns the building, doesn t plan to sell and want to develop the cash flows for budgeting and decision making. e) Lease analysis from a landlord or tenant perspective Lease analysis is used by landlords and tenant to compare different lease proposals and help in lease negotiations. f) Land Lease Analysis g) Development Analysis Development analysis is used to determine how much to pay for the land based on the developer s desired profit and is covered in the video Development Analysis and the Valuation of land To learn more about development analysis please see our Video Development Analysis and Valuing Land which can be purchased on our web site or by calling toll free
62 61 3. Make the following decisions before starting the analysis a) Monthly or yearly analysis? b) The Analysis Period? c) Before or after tax analysis a) Monthly or Yearly Analysis? Yearly analysis is suitable for analyzing rental apartment buildings. For commercial buildings with leases the analysis should be carried out on a monthly basis because leases can expire or be renewed during the year. Monthly analysis can take into account seasonal variations such as snow removal during winter or variation in income for seasonal based investments such as marinas, short term summer rentals etc. b) The Analysis Period? Five years using yearly projections is an acceptable analysis for apartment rental properties. For commercial properties the recommendation is a minimum of ten years using monthly projections in order to take into account the impact of lease renewals or bumps or steps in the lease as well re-renting vacant space, the funding of tenant inducements by the landlord such as leasehold improvements, free rent periods and other tenant inducements. Tip: Always build you largest analysis period first. As an example if you are interest in analyzing a building over 5 years and 10 years build the 10 year projections first, then all you have to do is change the Analysis Period from 10 years to 5 years. If you build the five year model first and then want to extend the analysis to 10 years you have to project all the expenses and revenues and extend the mortgages from 5 years to 10 years c) Before or after tax analysis? Real estate analysis is generally performed before tax because the tax position of the investor is not known. There are two types of investment analysis that should always be done after tax because tax plays a major role in the decision. They are: Buy versus Lease Analysis Hold versus Sell Analysis
63 62 4. Start with the questions you want answered The starting point is deciding what questions you want answered such as: What return (IRR) am I looking for given the risk? How much should I pay for property to get my desired return? What s the value of the property? Should I buy property A or property B As a realtor, does this investment make economic sense? Should I take a listing? Ask what if questions and sensitivity analysis What if the seller carries a second mortgage? What if the major tenant doesn t renew their lease? What if interest rates go from 6.00% to 7.00%? 5. Gather the information before starting the analysis Before staring the analysis gather all the information you need. There is a check list available in the appendices and the end of the manual. 6. Keep the initial analysis simple then refine For more complex or unique analysis keep the initial inputs simple and test the results to see if you are using the right approach. If the results are acceptable, then increase to complexity of the analysis. 7. Develop ways to double check you analysis It is very easy to make a mistake when carrying out real estate analysis such as forgetting to sell the property at the end of the analysis or incorrectly entering the financing or missing key expense items. As we go through the case studies in the video I ll point out ways to check the inputs and how to determine if the results are realistic.
64 63 Case Studies 1. Sale Leaseback analysis 2. Exploring creative financing 3. Lease Comparison Analysis 4. Lease negotiations 5. Buy versus Lease analysis 6. Hold versus Sell analysis 7. Replacement Reserve Planning
 is 12.00% before tax based on a five year analysis.")
65 64 Sale Lease Back Analysis From a CoStar newsletter. CoStar has a very good, free weekly new letter. An investment company is looking at a Sale Lease Back of an office building. Their Desired Return (IRR) is 12.00% before tax based on a five year analysis. You have been asked to evaluate the investment and make a presentation and recommendations to the Investment committee Project Information Asking Price The Sale Lease Back owner is asking $5,100,000 and the acquisition costs are $20,000 Revenue..has a twist The owner will lease back at above market rents for 18 months at $22.50 per Sq. Ft per Yr. Then vacate. Rentable Area: 22,358 Sq. Ft Usable Area: 19,500 Gross Up Factor: 14.66% Analysis Period: 10 years Investor Investor Desired Return (IRR): 12.00% before tax Modified Internal Rate of Return (MIRR) Short Term Financing Rate: 7.50% before tax Short Term Reinvestment Rate: 2.50% before tax Before tax analysis. Nonprofit organization
66 65 Investment Investment: $5,120,000 including acquisition costs of $20,000 Leasehold Improvements. Year 2 Sept $200,000 Expenses Expenses paid by the landlord $7.00 per Sq. Ft per year increasing at 3.00% per year compounding Leasing fee: Year 2 Sept $75,000 (Exclude from the NOI) Revenues Sale Lease Back Tenant Base Rent: $22.50 per Sq. Ft per Yr. for 18 months Recoverable Expenses (TIM s): $6.25 per Sq. Ft per Yr. for 18 months New Tenant Lease commences Year 2 October and runs until the end of the analysis period. Base Rent and rent increases at the end of each term Term 1. $18.00 per Sq. Ft per Yr. for three years Free Rent: Two months in the first year Term 2.Five years. The rent for Term 2 equals Term 1 rent increased by 2.50% compounding for three years Term 3. Rent equals Term 2 rent increased by 3.00% compounding for five years Recoverable Expenses: $7.00 per Sq. Ft per Yr. increasing at 3.00% per year compounding Financing First mortgage: $3,000,000 Interest Rate: 7.00% Amortization Period: 25 years Sale Sale Price: Based on a 7.00% Cap Rate using the Net Operating Income for the year following the sale which is year 11 Selling Expenses: 2.00% of Sale Price. Real Estate Fee. 3.50% of Sale Price
67 66 Questions to be answered A) General 1. Based on the above information, what is the Return (IRR) before tax? 2. How much should the investor pay to get the Desired Return (IRR) of 12.00% before tax? 3. Based on the price that provides the 12.00% IRR before tax, how much a year does the initial investment have to increase and is this realistic? 4. Can the financing be increased? If so, how does it affect the financial returns (IRR)? 5. The appraiser s approach. How much of the Present Value is generated by: a) Net Operating Income b) Sales proceeds (Reversionary value) B) Risk Assessment Risk Assessment Ratios Debt Coverage Ratio: Shows how much the cash flow exceeds the mortgage payments Default Ratio (Breakeven Point): What % of the building has to be rented to breakeven? Yearly Operating Cash Flow report c) Financing Potential Financing Ratios Debt Coverage Ratio: Generally around 1.25 but depends on the lender and the risk Loan to Value Ratio: 75% Default Ratio (Breakeven Point) If less than 85% may be an opportunity to increase the first mortgage Presentation What should the presentation package to the Investment committee include?
68 67 The Analysis What is the Return (IRR) before tax based on the asking price of $5,100,000? Answer: The Internal Rate of Return (IRR) is 10.98% The most insightful report is the Net Cash Flow Report. It provides an overall financial view of the investment.
69 68 Relationship between the Desired Return (IRR) and the Purchase Price Shows how much to pay for the property to achieve the desired return (IRR). As an example, if the desired return was 12.00% before tax, the purchase price is approximately $4,950,000.
 Based on the investment of $5,120,000 how much does the property have to increase in value per year compounding to achieve a 12.00% return and is this realistic?")
70 69 Using Goal Seeking to answer the following questions: a) How much should the investor pay to get a Desired Return (IRR) of 12% before tax? b) Based on the investment of $5,120,000 how much does the property have to increase in value per year compounding to achieve a 12.00% return and is this realistic? Answers a) Purchase Price $4,952,437 (including acquisition costs) provides a Return (IRR) of 12.00% before tax. Asking price is $5,100,000 b) Increase in Value per Year is 3.996% compounding using the Purchase Price of $5,120,000 May be too optimistic over a ten year period
71 70 The appraisal approach to value How much of the Present Value is generated by: a) Net Operating Income c) Sales Proceeds (Reversionary value) Are the results realistic? Note: Excludes financing which generally increases the Internal Rate of Return
72 Risk Assessment & Financing Potential 71
73 72 Operating Cash Flow Report Show the cash flow from operations Overall Cash Flow Report Shows all the cash inflows and outflows
74 73 Income & Expense Statement Income & Expense projection graph
75 74 Presentation Package What should be included in the presentation package to the investment committee? Keep it brief. Don t include too many reports. Focus on the highlights Include reports that are easy to follow without technical financial knowledge Cover Page with building photograph Table of Contents Executive Summary (One page to two pages) Overview of the investment opportunity Critical assumptions Analysis period Lease up period after the 18 months Lease rate at the end of the 18 month Lease projections. Terms, renewal rates Recoverable expenses Leasehold improvement costs Leasing fees Financing How the sale price at the end of the ten years is calculated Results Purchase price to achieve a 12% Return (IRR): $4,952,437 Annual increase in value to achieve the desired return: 3.996% based on the asking price which may be too optimistic Risk assessment. Moderate Financing: First mortgage could be increased Recommendation & conclusions Purchase price: $4,952,437 Consider increasing the financing Reports (limit the number of reports) Net Cash Flow Operating Cash Flow Income & Expense Statement Graph. Purchase Price versus Desired Return (IRR) Detailed reports can be provided later if requested TIP. Use Snagit screen capture program
76 75 Creative Financing Creative financing between the seller and the buyer can be used to create a sale, which may not be possible based on the seller s price and conventional financing. One approach is to develop and review the operating cash flow before tax and then structure seller financing based on the available cash flow before tax. This is best illustrated with an example. Investment. Shopping Center with leases and % Rents Analysis Period: 9 years Purchase Price: $12,000,000 based on 6.17% Cap Rate Conventional First Mortgage $7,500,000, 25 year amortization, interest rate 6.00% Debt Service Ratio: 1.28 Equity required by the buyer: $4,500,000 (37%) Result: Internal Rate of Return (Before Tax): 12.57% Steps for exploring creative financing 1. Carry out a conventional analysis 2. Examine the Operating Cash Flow before tax 3. Decide on a possible financial arrangement 4. Run the analysis with the revised financial structure 5. Examine the results Creative Financing Options There are many creative financing options including: Goals Interest only mortgage No payment of principle & interest until the end of the term Graduated payment mortgage Variable rate mortgage 1. To get the equity down from 37% to 25% 2. Increase the returns to the Investor 3. Facilitate the sale through creative seller financing

77 76 Examine the Operating Cash Flow before Tax Decide on a possible financial arrangement We will test the following financial arrangement: Change the term of the first mortgage from 10 years to 5 years and pay off the first mortgage at the end of 5 years Create seller financing as follows: $1,480,000 second mortgage, Interest Rate: 9.00%, Term: 5 years Fixed payment: Year 1 $6,000 per month or $72,000 per year Year 2 $9,000 per month or $108,000 per year Year 3 $11,000 per month or $132,000 per year Year 4 $13,000 per month or $156,000 per year Year 5 $15,000 per month or $180,000 per year Year 6 January. Refinance with a conventional first mortgage Loan Amount: $10,000,000 Interest Rate: 6.50% 25 year amortization Debt Service Coverage Ratio: 1.25 Use the refinancing of $10,000,000 to pay off: First Mortgage: $6,744,907 Seller Financing: $1,532,403 Investor pockets $1,722,691 Results using creative financing Investor s equity changes from $4,500,000 (37.50%) to $3,020,000 (25.00%) The Investor s Internal Rate of Return (IRR) changes from 12.57% to 15.03% before tax which is a 19.57% increase. Investor pockets $1,722,690 when the property is refinanced for $10,000,000 at the start of year 6
78 Cash Flow with the Seller s second mortgage 77
79 78 Net Cash Flow Report with the Seller s second mortgage What happens when the building is refinanced at the end of 5 years? New first mortgage $ 10,000,000 Used to pay off the: First mortgage 6,744,907 Seller s second mortgage 1,532,403 To the Investor $ 1,722,690 The investor receives $1,722,690 cash.
80 79 Mortgage Schedules. Outstanding balances at end of 5 years Cash Flow Comparison Report
81 80 Creative Financing. Review and Summary The following framework or steps can be used to explore creative financing options. Seller 1. Decide on the goals of the creative financing To get the equity reduced from 43% to 25% Hopefully increase the financial return to the buyer Help put the deal together 2. Check that the first mortgage allows a second mortgage to be placed on the property 3. Carryout real estate investment analysis using the conventional first mortgage and calculate the Internal Rate of Return (IRR) 4. Examine the cash flows before tax. Is there sufficient cash flow to support a second mortgage? 5. Decide on the second mortgage arrangement, the interest rate and when the loan be paid back E.g. After five years. There are many possibilities: Interest only loan Graduated payment mortgage Accrued interest loan. Interest accumulates and is paid with a balloon payment when the mortgage is paid back Etc. Take a guess at what you think might work and look at the results. Are the results acceptable from the buyer s and seller s perspective? This is a trial and error process. 6. When the second mortgage is paid out consider whether to refinance the building and incorporate the refinancing into the analysis 7. Carryout real estate investment analysis using the conventional first mortgage and the second mortgage and calculate the Internal Rate of Return (IRR) 8. Review the cash flow before tax to make sure there is a comfortable cash flow and check the Debt Service Ratio and the Default Ratio and Breakeven Point. Are they acceptable? 9. Compare the buyer s return (Internal Rate of Return) with the conventional mortgage against the creative financing option. Has the Internal Rate of Return (IRR) improved? 10. If the results are not acceptable try another creative financing arrangement. Remember that this is a trial and error process 1. Check that the current first mortgage allows a second mortgage to be placed on the property 2. Consult with an accountant and lawyer to establish the tax consequences and risks of selling the property and carrying a second mortgage
 because there is no investment.")
82 81 Lease comparison analysis When comparing leases you calculate the total costs each year and then use a Discount Rate to calculate the Net Present Value (NPV) and the Net Effective Rent Net Effective Rent at X% = Net Present Value at X% where X% is the Discount Rate No. of Years x Area Note: You cannot calculate the Internal Rate of Return (IRR) because there is no investment. Example: A tenant is considering two different spaces and has established the following annual costs taking in to account the base rent, additional rent, free rent and parking costs. Which is the best proposal from a financial perspective? Using a 10.00% Discount Rate Net Effective Rent at 10% = Net Present Value at 10% where 10% is the Discount Rate No. of Years x Area Which is the best lease arrangement for the tenant? From a Tenant s perspective Space A has the lowest Net Present Value (NPV) and is the best deal from a financial perspective.
83 82 Developing the Leasing Cash Flows. Landlord perspective Following are the typical revenues and expenses that are used in carrying out a lease analysis from the landlord s perspective/ Revenues Base Rent plus rent increases and renewals Percentage Rent. Shopping Centers Rent Caps. Imposes a limit on future rent increases Additional Rent also called Recoverable TIMs (Taxes, Insurance & Maintenance) Recoverable Expense Cap. Tenant pays the recoverable expenses up to the Expense Cap Expense Stop. Landlord pays the recoverable expenses up to the Expense Stop Parking Revenue Other Revenue Operating Expenses Expenses that are paid by the landlord to operate the space such as: Taxes Insurance Maintenance Property Management Miscellaneous Expenses Security Tenant Inducements Free Rent Leasehold Improvements paid by the landlord or Leasehold Improvement Allowances Renovation Costs Moving Allowances Cash Signing Bonus Leasing Expenses Leasing Agents Fee Legal Fees City fees Architectural and engineering fees to obtain occupancy permits and other City permits Financing Considerations Loans by the landlord to the tenant for leasehold improvements Loan obtained by the landlord to fund leasehold improvements Termination Costs The cost of clean-up and restoring the space to re-rent after the tenant moves out
84 83 Case Study. Lease Analysis Landlord perspective The landlord has received a proposal from the tenant to lease suite 306 Rentable Area: 5,900 Sq. Ft Usable Area: 5,200 Sq. Ft Discount Rate: Before Tax 10.00% (Used to calculate the Net Present Value) Leasing Costs Leasehold Improvements: $50,000 Leasing Fee: Year 1 Jan $12,000 Revenue Base Rent $26.00 per Unit of Tenant s Rentable Area per Y. paid monthly. Two terms of 5 years. Increase for the second term base on the first term rate increasing at 3.00% compounding for five years Free Rent: First two months. 100% of Base Rent Recoverable Expenses (TIM's) $9.00 per Unit of Tenant s Rentable Area per Yr. paid monthly for 12 months then increasing at 3.00% compounding per year. Expenses paid by Landlord $9.00 per Sq. Ft per year paid monthly for 12 months. Increasing at 3.00% per year compounding Termination Costs Cost incurred at the end of the lease by the tenant for cleaning up the space. Cleanup and restoration costs: $15,000
85 84 Developing the Leasing Cash Flows. Tenant perspective Following are the typical revenues and expenses that are used in carrying out a lease analysis from the tenants perspective. Rent Base Rent plus rent increases and renewals Percentage Rent. Shopping Centers Rent Caps Additional Rent also called Recoverable TIMs (Taxes, Insurance & Maintenance) Recoverable Expense Cap. Tenant pays the recoverable expenses up to the Expense Cap Expense Stop. Landlord pays the recoverable expenses up to the Expense Stop Parking Revenue Other revenue Additional Rent Expenses that are paid by the tenant to the landlord s as spelled out in the lease for recoverable expenses such as: Taxes Insurance Maintenance Property Management Miscellaneous Expenses Security etc. Tenant Inducements provided by the landlord Free Rent Moving Allowances Cash Signing Bonus etc. Leasing Expenses Leasing Agents Fee (Tenant Rep fees) Leasehold improvements costs paid by the tenant City fees Architectural and engineering fees to obtain occupancy permits and other City permits Location Comparison Tenant may take into account the different cost associated with different locations such as: Moving costs Differences in utility costs such as electrical, gas, oil etc. Financing Considerations Loan obtained by the tenant to fund leasehold improvements Termination Costs The cost of clean-up and restoring the space as required by the lease.
86 85 Case Study. Lease Analysis Tenant perspective Rentable Area: 5,900 Sq. Ft Usable Area: 5,200 Sq. Ft Discount Rate: Before Tax 10.00% Leasehold Improvements paid by the tenant: $75,000 in addition to $50,000 being provided by the landlord Leasing Expenses. Base Rent $26.00 per Unit of Tenant s Rentable Area per Year paid monthly. Two terms of 5 years. Increase for the second term base on the first term rate increasing at 3.00% compounding for five years Free Rent: First two months. 100% of Base Rent Additional Rent (TIM's) $9.00 per Unit of Tenant s Rentable Area per Yr. paid monthly for 12 months then increasing at 3.00% compounding per year Termination Costs Cost incurred by the tenant at the end of the lease for cleaning up the space. $25,000 Net Cash Flow & Net Effective Rent Report Answer. Net Effective Rent at 10% before tax from the tenant s perspective is $24.19 per Sq. Ft per Year
87 86 Lease Negotiations. Trade Offs between Landlord & Tenant In lease analysis the main financial variables that can be manipulated in negotiating a lease are: Base Rent and the timing of future escalations How future rent escalations are calculated Free Rent periods Leasehold improvements funded by the landlord Leasehold improvement loans from the landlord to the tenant Cash payments from the landlord to the tenant for moving costs, cash signing bonus etc. Example of trade offs: Higher starting Base Rent which is offset by: Increasing the leasehold improvements provided by the landlord More free rent periods so that the Net Effective Rent for the tenant stays the same. Primary goals of the landlord 1. High Rent The landlord wants the lease rate (also called the face rate) to be as high as possible because the lease rate is the major factor that determines the value. When an appraiser is valuing the property they will focus on the lease rate and the renewal rates. It s very unlikely the appraiser will take into account leasehold improvement, free rent periods and other tenant inducements when valuing the building because these are general historical costs. 2. Good Tenant Losing a tenant is very costly for the landlord. It may take many months to find a tenant, negotiate the lease and there are many costs involved: Loss of rental income Landlord has to pay the taxes insurance and maintenance that were being recovered from the tenant if the lease was a triple net (nnn) lease Provide costly inducements such as free rent and leasehold improvement allowances Legal fees and real estate leasing fee
88 87 From a Landlord s and a Tenant s perspective which is the best lease proposal? Rentable Area: 10,000 Sq. Ft of industrial space Net Effective Rent Discount Rate: 7.00% before tax Operating Costs: $4.00 per Sq. Ft per Yr. increasing at 3.00% per year compounding Lease Term: 5 years Discount Rate for calculating the Net Effective Rent: 7.00% Which is the best deal for the Landlord Tenant Answer:
89 88 Net Cash Flow and Net Effective Rent Report The four options have the same Net Effective Rent of 6.37%
90 89 Since all four options produce the same Net Present Value and Net Effective Rent, which is the best deal for the Landlord and for the Tenant? Impact on the property value The landlord wants to maintain the highest base rent which is option C to maximize the value of the property. The following table shows the property Value of the different lease proposals based on an 8.00% Cap Rate. Proposal Value A $12.00 per Sq. Ft per Yr. $12 x 10,000 Sq. Ft 8.00% $1,500,000 B Lease hold improvements $50,000 $13 per Sq. Ft per Yr. $13 x 10,000 Sq. Ft 8.00% $1,625,000 C Free rent 6 months spread over 3 years $13.43 $13.43 x 10,000 Sq. Ft 8.00% $1,678,750 D $10.92 per Sq. Ft per Yr. Escalating at 5.00% per Yr. $10.82 x 10,000 Sq. Ft 8.00% $1,352,500 Best option for the landlord Landlord. Option C is the best option for the landlord because it produces the highest value when capitalized at an 8.00% Cap Rate. The landlord wants the lease rate (also called the face rate) to be as high as possible because the lease rate is the major factor that determines the value. When an appraiser is valuing the property they will focus on the lease rate and the renewal rates. It s very unlikely the appraiser will take into account free rent periods and other tenant inducements when valuing the building because these are general historical costs. The landlord may also prefer Option C because it means giving up two months of free rent each year for three years which costs $67,150 rather than having to come up with $50,000 for leasehold improvements. The landlord has to take into account tenant compatibility and the quality of the tenant. Losing a tenant is very costly for the landlord. It may take many months to find a tenant, negotiate the lease and there are many costs involved: Loss of rental income Landlord has to pay the taxes insurance and maintenance that were being recovered from the tenant if the lease was a triple net (nnn) lease Provide costly inducements such as free rent and leasehold improvement allowances Legal fees and real estate leasing fee
91 90 Best option for the tenant From the Tenant s perspective all four options are financially the same because they have the same Net Present Value and Net Effective Rent. The best option may depend on the tenant s situation and preferences. As an example: If they are just starting a business and have no need for leasehold improvements they might choose the option with the lowest starting lease rate which is $10.92 Option C which escalates at 5.00% per year compounding If they need lease hold improvements they may be willing to pay a higher rent. In this case the best choice is Option B which provides $50,000 of leasehold improvements and a lease rate of $13.00 per Sq. Ft per Yr.
92 91 Case Study continued The landlord submits a counter proposal to the tenant. The goal is to increase the base rent and hence the value of the property but keep the Net Effective Rent the same as the tenant s proposal by increasing the free rent and providing a cash bonus for signing the lease to offset the increase in the base rent from $26.00 to $28.00 per Sq. Ft per Yr. 5,900 Sq. Ft Rentable Tenant s Proposal Landlord s Counter Proposal Base Rent $26.00 per Sq. Ft per Yr. (NNN) $28.00 per Sq. Ft per Yr. (NNN) Contract Term Ten years Same Renewal Rate at end of Based on 3% compounding for 5 first five years years Same. Recoverable Expenses 9.00 per Sq. Ft per Yr. increasing paid by the tenant at 3.00% per Yr. compounding Same Free rent First two months Four months Leasehold improvements by landlord $50,000 by landlord Tenant also has to spend $75,000 Cash signing bonus Zero $15,000 CPI Discount Rate for calculating the Net Effective Rent Result Net Effective Rent at 10.00% Expected to increase at 3.00 per year compounding 10.00% before tax First two months for two years $80,000 plus a loan to tenant of $45,000 at 6.00% amortized over 5 years and paid monthly $15.43 per Sq. Ft per Yr. $15.48 per Sq. Ft per Yr. Increase in the property value by increasing the Base Rent The Cap Rate from the sale of comparable properties is 6.50% Increase in value = ($ $26.00) x 5,900 Sq. Ft 6.50% Cap Rate = $181,538 Additional Tenant Inducement Costs. Extra two months of free rent ($28.00/12) x 2 months x 5,900 Sq. Ft. = $27,533 Increase in leasehold improvements from $50,000 to $80,000 = $30,000 Cash Signing Bonus: $15,000 Net Benefit to Landlord Increase in value $181,538 Less: Extra free rent 27,533 Additional leasehold improvements 30,000 Cash Signing Bonus 15,000 Net Benefit to landlord $109,005
93 Landlord s counter proposal to tenant 92
94 93 Lease Comparison Report Compares the Tenant s proposal with the Landlord s counter proposal. The Landlord s counter proposal changes the Net Effective Rent at 10% to $15.43 from $15.48 per Sq. Ft per Yr. This result illustrates how important it is for the Landlord to maintain the base rent as high as possible and offset the higher lease rate by giving the tenant more free rent, increasing the leasehold improvement allowance and providing other inducements such as a cash signing bonus.
95 94 Analyzing Mutually Exclusive Investments Mutually exclusive investments are investments where the investor has several options that are mutually exclusive. They can choose one of the options but not both. Some examples of mutually exclusive investments are: 1. Buy or Lease? 2. Hold or Sell? 3. Personal choice example. I can drive to work or catch a bus but I can t do both Using the Buy versus Lease as an example, mutually exclusive investments are analyzed as follows: 1. Develop the Net cash flow for the Buy option 2. Develop the Net cash flow for the Lease Option 3. Calculate Net Cash Flow Buy Net Cash Flow Lease This is called the Differential or Incremental Cash Flow analysis and is a very important concept Analyzing Buying versus Renting a home. Case Study Purchase Price: $700,000 First Mortgage: $550,000, Interest Rate 4.50%, 25 year amortization Property Taxes: $4,500 per year increasing at 4.50% compounding per year Insurance: $600 per year increasing at 3.00% per year compounding Maintenance $150 per month increasing at 3.00% compounding per year Utilities: Ignored because the utility costs apply to both buying or renting Appreciation: 6.00% per year Analysis Period: 5 years Buyer s Discount Rate (Desired Return): 10% Renting Rent: $2,200 per month increasing at 3.50% per year compounding
: 2.88% Buy versus Rent Analysis using the differential cash flow analysis approach Results Summary")
96 95 What is the return on the investment? What is the financial return if we treat the purchase of the home as an investment rather than a Mutually Exclusive Investment i.e., ignoring the savings in renting? Answer: Internal Rate of Return (IRR): 2.88% Buy versus Rent Analysis using the differential cash flow analysis approach Results Summary
97 96 Buy versus Lease Analysis. Case Study Buy versus Lease Analysis using the Differential Cash Flow approach. Note. Buy versus Lease analysis should always be carried out after tax because of the differences in taxes between buying and leasing. Case Study. Buy versus Lease Analysis An architectural firm is renting 3,000 Sq. Ft. in quality office park development. Their lease will be expiring shortly. The firm has an opportunity to buy the unit they are occupying for $850,000 Question: Should the architectural firm buy their space or renew the lease? Investor s Discount Rate or Desired Return (IRR): 13.00% Before Tax Marginal Tax Rate: 35% Note: The project information and details used to carry out this Buy versus Lease analysis can be seen in Appendix No.1 of this manual. Project Information Cedar Plaza, Rentable Area: 3,000 Sq. Ft Analysis Period: 10 Years INVESTOR INFORMATION Investor s Marginal Tax Rate: 35.00% Discount Rate: Before Tax 13.00% Short Term Rates Before Tax for calculating the Modified Internal Rate of Return (MIRR) Financing Rate: 8.00% Reinvestment Rate: 3.00% INVESTMENT Land $300,000 Building: $550,000 Depreciation Method: Commercial Prop. St. Line BUY (EXPENSES) These are the operating costs associated with owning the building such as property taxes, insurance, maintenance etc. Total Operating Costs: $7.00 per Sq. Ft per Yr. paid monthly for 12 months then increasing at 3.00% compounding per year LEASE (EXPENSES) Cost of leasing instead of buying such as Base Rent, Additional Rent, Parking etc. Base Rent $17.00 per Sq. Ft per Yr. paid monthly. Two terms of 5 years. Increase for the second term based on 3.00% compounding for five years Additional Rent $6.00 per Sq. Ft per Yr. paid monthly for 12 months then increasing at 3.00% compounding per year for the remaining 9 years Parking 12 spaces at $30 per monthly for 12 months then increasing at 3.00% compounding per year for the remaining 9 years FINANCING (BUY) The financing to buy the property: First Mortgage $700,000 Amortization: 20 years, Interest Rate 7.50% SALE INFORMATION Real Estate Commission: 5.00% of the Sale Price Selling Expenses: $7,000 Sale Price based on the original investment increasing at 3.5% compounding per year
98 97 In the above example the Investor s Discount Rate or Desired Return (IRR) is 8.45% after tax Buying compared to Leasing provides an Internal Rate of Return (IRR) of 10.57% after tax. In this example, buying is the better financial option because the Internal Rate of Return of 10.57% after tax is higher than the Desired Return (IRR) of 8.45% after tax.. The Net Present Value can also be used to choose whether to Buy or Lease using the following rules: 1. If the Net Present Value after tax is positive consider buying 2. If the Net Present Value after tax is negative consider selling Applying the Net Present Value rules to the example above: The Net Present Value at 8.45% after tax is +$39,499 which indicates that buying is the best option from a financial perspective.
99 98 Buy versus Lease Graph. Purchase Price & the Desired Return The graph allows you to determine the maximum purchase that can be paid in order to achieve the desired return (IRR) after tax from Buying compared to Leasing As an example, if the Desired Return (IRR) after tax is 8.45% for Buying versus Leasing is then the maximum that should be paid for the property is approximately $890,000. If the purchase price is higher than $890,000 we would be better off leasing.
100 99 Buy versus Lease Crossover Graph Shows the cutoff point between buying and leasing. Up to a Desired Return (IRR) of 10.40% after tax buying should be considered instead of to leasing. As an example, if the buyer can invest their money at 10.40% or more they should consider leasing. If not, they should consider buying.
101 100 More examples of the use of differential cash flow analysis Whenever we are dealing with mutually exclusive investment such as buy versus lease we need to use differential cash flow analysis to choose the best option. Leasing example using differential cash flow analysis A landlord has 150,000 Sq. Ft to lease and has received the following proposals: Tenant A to rent the 150,000 Sq. Ft Tenant B to rent 100,000 Sq. Ft Tenant C to rent 50,000 The mutually exclusive choices are: 1) Rent 150,000 to Tenant A Rent 100,000 Sq. Ft to Tenant B and 50,000 Sq. Ft to Tenant C To decide on the best option; Develop the Net Flow renting to Tenant A Develop the Net Cash Flow renting to Tenant B Develop the Net Cash Flow renting to Tenant B Calculate Net Cash Flow Tenant A Net Cash Flow Tenant B Net Cash Flow Tenant C If the Net Cash Flow is positive the best choice financially is renting to Tenant A If the Net Cash Flow is negative the best choice financially is renting to Tenant B and C
102 101 Hold vs. Sell or Hold & Refinance & Sell Analysis Hold versus sell analysis is another example of mutually exclusive investment analysis. The owner can either hold or sell the property but can t do both. Hold versus Sell Analysis Hold versus Sell is a very unique form of Investment analysis because the Investor already owns and has financed the building. The unique characteristics of Hold versus Sell Analysis are; 1. No initial investment The initial investment was made when the building was purchased a number of years ago. The previous investment results in onward going depreciation claims and affects the after tax cash flows and the Hold v Sell decision 2. No initial Financing on the Analysis Start Date Likely there is an existing mortgage(s) on the property which generates onward going principal and interest. In order to calculate the mortgage interest and principal payments we need to know: The Outstanding Balance of the Mortgage on the Analysis Start Date Remaining Amortization Period or the monthly payment Interest Rate 3. Need to calculate the Sell Now sales proceeds To carry out Hold versus Sell analysis we need to calculate the After Tax Sale Proceeds if the property was sold today.
103 102 Hold versus Sell analysis should always be made after tax Hold versus Sell analysis should always be carried out after tax to take into account the Capital Gain and Recaptured Depreciation Taxes paid on sale. Before and after tax analysis can yield different conclusions. For the example the before tax analysis recommends selling the building and the after tax analysis recommends keeping the property. Hold versus Sell Analysis. The fundamental question: If I take the sales proceeds after paying: 1. off the mortgage 2. real estate fees 3. closing costs 4. income taxes. Capital gain and recaptured depreciation and invest the proceeds in an investment with similar risk, can I get a higher return after tax than keeping the building for say another 10 years? If not, then I should keep the property. That s the essence of Hold versus Sell analysis and decision making Hold versus Sell Calculations Hold versus Sell analysis involves; 1. Developing the Cash Flow After Tax. Hold 2. Developing the Cash Flow After Tax. Sell 3. Calculating (Cash Flow Hold Cash Flow Sell) called the Differential Cash Flow
104 103 Hold versus Sell Case Study PROJECT INFO Property Name: Plaza 500Description: 15,000 Sq. Ft Office Building Total Rentable Area: 15,000 Sq. Ft Usable Area: 12,750 Sq. Ft Analysis Period: 10 Years INVESTOR Marginal Tax Rate: 35.00% Capital Gain Rate: 15.00% Recaptured Deprec. Rate: 25.00% Discount Rate Before Tax: 13.00% Short Term Rates before Tax for calculating the Modified Internal Rate of Return (MIRR) Financing Rate: 7.000% Reinvestment Rate: 2.00% INVESTMENT Investments made prior to the Analysis Start Date In order to calculate the annual depreciation during the Analysis Period we need to enter previous investments in the building or improvements (excluding the land which is not depreciated), the depreciation method and when the investment was made. In this example, the property was acquired 7 years ago and the value assigned to the building (or improvements) was $2,800,000. In order to continue the depreciation claims and reduce taxable income During the analysis period the following information is entered in the Investment Folder Investments made prior to the Analysis Start Date Land. Original Value: $700,000 when acquired 7 years ago. Description: Building Undepreciated Value Value of Asset when acquired 7 years ago: $2,800,000 Depreciation Method: Commercial Prop. St Line Original Recovery Period: 39 years How Long Ago: 7 years 0 months Note: The above information is for a property located in the USA. The information required for a Canadian property is much simpler. All you need is the Undepreciated Balance and the CCA Rate. Please visit select Canada where there are several Hold versus Sell videos for Canadian investments. Investments made after the Analysis Start Date Investments made on or after the Analysis Start Date are entered in the Investment Folder. In this example, the roof is being replaced in year 3 Jan for $200,000 in is depreciated using Commercial Prop. St Line Roof Replacement Amount: $200,000 Year 3 Jan Depreciation Method: Commercial Prop. St Line Investment: New
105 104 SELL NOW information The following information is used to calculate the sales proceeds before and after tax if the property was sold today. Sale Price Today: $4,200,000 Important Note: The sale price would include the current balance in the Replacement Reserve Account of $270,000 which is included in the Sale Price of $4,200,000 Repayment of existing Mortgages: $2,623,720 (This is the outstanding balance of the mortgage) Selling Expenses Real Estate Commissions: 4.50% of Sale Price Selling & Legal Expenses: 1.50% of Sale Price Income Taxes paid on Sale: $500,000 which includes Capital Gain and Recaptured Depreciation tax. This information would come from the owner s accountant. REPLACEMENT RESERVES Mortgage insurance agencies, conventional lenders and lenders following HUD guidelines often require that Replacement Reserves be established and maintained in an interest-bearing account to aid in funding extraordinary maintenance and repair and replacement of capital items such as the roof. Opening Balance: $270,000. (This is the amount in the Replacement Reserve Account on the Analysis Start Date) Interest Rate: 2.50% Amounts added to the Replacement Reserve Account Year 2 Jan: $75,000 Amount withdrawn from the Replacement Reserve Account Roof Replacement: Year 3 Jan: <$200,000> EXPENSES Operating expenses paid for by the investor such as taxes, insurance, maintenance, property management Etc. TIM s $8.00 per Sq. Ft per Yr. for the first 12 months then increasing at 3.00% per Yr. compounding REVENUE Base Rent $20.00 per Sq. Ft per Yr. for the first 12 months then increasing at 3.00% compounding per year Recoverable Expenses $7.25 per Sq. Ft per Yr. paid monthly for the first 12 months then increasing at 3.00% compounding per year. VACANCY No vacancy FINANCING Existing First Mortgage Status: Pre-existing mortgage or financing Type: Standard Mortgage Original Mortgage: $3,000,000, 7.50%, 25 year amortization taken out 7 years ago Current Outstanding Balance: Year 1 January: $2,623,720 (This is the outstanding balance of the existing first mortgage on the Analysis Start Date) Time Period: 18 years Amortization: 18 years (The remaining Amortization Period) Interest Rate: 7.50%
106 105 SALE Real Estate Commissions 5.00% of Sale Price Selling Expenses Selling Expenses: 2.00% of Sale Price Legal Fees: 1.00% of Sale Price Sale Price Base on a Cap Rate of 7.50% using the Income for the year following the Sale i.e., based on the Income & Expenses for Year 11. Hold vs. Sell Net Cash Flow Report After Tax Hold versus Sell Decision Rules Using the Internal Rate of Return (IRR) If I keep the building is the after tax return (IRR) higher than the after tax return from investing the after tax sales proceeds elsewhere? In the above example the Internal Rate of Return from holding the building compared to selling is % after tax. The question is Can I find an investment with similar risk that provides better than a % IRR? after tax. If not, I should keep the building. Using the Net Present Value Approach. Decision Rules Consider Holding if the Net Present Value at the Investor s after tax discount Rate is positive Consider Selling if the Net Present Value at the Investor s after tax discount Rate is negative At the bottom of the Net Cash Flow report is the conclusion: Consider holding because the Net Present Value at 8.45% is positive
107 106 Hold Versus Sell Crossover Graph Shows the cut off point between holding and selling. Up to a Desired Return (IRR) of 14.50% after tax they should hold the property. As an example, if the owner can invest the after tax sales proceeds at 14.50% after tax or more they should consider selling. If not, they should consider keeping the property.
108 107 Hold & Refinance Analysis If the analysis suggests the investor should hold and not sell the building and should consider refinancing the building to release cash. The ability refinance will depend on the loan to value ratio and debt Service Ratio for the current mortgage. If the loan to value ratio is high there may not be room to increase the mortgage.

109 108 Review of the cash flows Operating Cash Flow Cash Flow Graph From years one to five the cash flow is low and probably can t support an increase in the mortgage. Around year 6 there may be potential to refinance and increase the first mortgage
110 109 Replacement Reserve Report The Replacement Reserve report shows the: 1. Interest Rate earned on funds in the account 2. Opening Balance 3. How funds flow in and out of the account on a monthly basis including the interest earned for the month 4. The balance in the account which is returned to the investor at the end of the analysis period when the building is sold
111 110 Replacement Reserve Planning Over time the owners of a building can face substantial costs in maintaining the building such as replacing the roof, upgrading elevators, structural repairs, replacing the boiler and HVAC system etc. As an example, replacing a roof could cost over $250,000 and upgrading a four stop hydraulic elevator could cost between $100,000 and $200,000. The question is Where does the money come from? Prudent owners will have put aside money or have funds available to cover expensive expenditures. One approach is to fund the expenditures by re-mortgaging the property but this option may not always be available and may expose the investor to financial risks if they can t come up with the money for the major repairs. Owners who do not have the funds available to cover future capital expenditures can run into serious financial difficulty and may be forced to sell the property. Replacement Reserves Replacement reserves are funds deposited into an interest bearing bank account on a regular basis to fund; Future Capital Expenditures such as replacing the; Roof and membranes Boiler HVAC System Elevators Carpets Washer & Dryers Windows etc. as well as major structural repairs Lender Requirements. Replacement Reserves Mortgage insurance agencies and lenders and organizations such as HUD in the USA and CMHC in Canada may specify the monthly or yearly contributions to a replacement reserve fund and restrict how funds in the account will be used and limit owners from withdrawing funds from the account. Replacements Reserves may increase the initial investment if the lender or mortgage insurer restricts the withdrawal of funds from the replacement reserve fund. Example Purchase Price $2,000,000 Replacement Reserve Account 300,000 Acquisition cost $2,300,000 When the property is sold the balance remaining in the Replacement Reserve Account is recovered by the seller.

112 111 Future capital expenditures and repairs. Projections As the building ages there are many capital expenditures that need to be made to maintain the building in good working order. These expenditures are non-recurring and are in addition to the regular operating expenses. Replacement schedules are often developed on behalf of the owner by architects, engineers, quantity surveyors or professionals specializing in conducting building assessments. Following is an example of a cash flow projection for a 40 year old 100 unit rental apartment building. The annual capital expenditures range from $202 to $571 per unit per year or from 2.72% to 8.52% of potential gross income. Investors often set up a replacement reserve fund which they contribute to on a regular basis to ensure that funds are available to carry out the needed capital expenditures. As an example, in 2020 $60,000 is needed to replace the asphalt parking area and the total capital expenditures in 2020 is $80,500..
113 112 The importance of professional engineering inspections A building is a complex system which may have hidden, serious problems that are costly for a buyer to fix. Some examples are; Concrete rot Salt corrosion causing deterioration of reinforcing steel and the integrity of the floor slab Failure of post tensioning floor slab systems Conclusion Failure of thin wall copper pipe Before buying a building to have an inspection carried out by architects, professional engineers or consultants to determine: 1. The cost of major repairs and replacements that have to be made shortly after acquiring the property 2. Future capital expenditures, replacements and other nonrecurring costs 3. Carry out replacement reserve planning

114 113 Including replacement reserves in investment analysis The Replacement Reserve Account is similar to a bank account. Care has to be taken with the entries in the Replacement Reserve Account to ensure that the cash flows are correct which requires offsetting entries for capital expenditures or major repairs. This is best illustrated using the example. 1. Annual Contribution to the Replacement Reserve Account The annual amount contributed to the reserve account is $24,000 increasing at 3.00% compounding. 2. Replacement of the Roof for $250,000 Year 3 Jan Paid from the Replacement Reserve Account 3. Replacement of Appliances. 10 sets at <$1,500> per set for a total of <$15,000> Year 4 Jan Paid from the Replacement Reserve Account
115 114 Important Question Why is it necessary to set up the replacement of the roof for $250,000 in both the Replacement Reserve Folder and as an investment? The objective of the Replacement Reserve Account is to build up funds to pay for future replacement of capital items and major repairs. In this example there is an opening balance of $300,000 in the Replacement Reserve Account with funds being added to the account every year. Funds added to the account have the effect of reducing the Internal Rate of Return to the investor. The roof replacement in Year 3 for $250,000 is paid from the Replacement Reserve Account and requires no additional input of cash from the Investor and does not affect the before tax cash flow in year 3 as long as there is an offsetting entry in the Investment folder. From an investment perspective no funds are required from the Investor to pay for the roof repair. It is simply an internal transfer of funds from the Replacement Reserve Account to the Investment folder. This can be seen in the Net Cash Flow report where the <$250,000> Year 3 in the Investment column is offset by the $250,000 reduction in the Replacement Reserve Account. Replacement of the Roof for $250,000 in year 3. Two offsetting entries are required when entering the roof replacement for $250,000 in year 3 as shown in the following report.

116 115 Income & Expense Statement The Income & Expense Statement shows the cost of replacing the appliances below the Net Operating Income which is paid from the Replacement Reserve Account. Note that the replacement of the appliances is not included in the Net Operating Income because it is a non-recurring expense which should always be excluding from the Net Operating Expenses. Please see the explanation below.
Lease-Versus-Buy. By Steven R. Price, CCIM
 Lease-Versus-Buy Cost Analysis By Steven R. Price, CCIM Steven R. Price, CCIM, Benson Price Commercial, Colorado Springs, Colorado, has a national tenant representation and consulting practice. He was
BUSI 331: Real Estate Investment Analysis and Advanced Income Appraisal
 BUSI 331: Real Estate Investment Analysis and Advanced Income Appraisal PURPOSE AND SCOPE The Real Estate Investment Analysis and Advanced Income Appraisal course BUSI 331 is intended to build upon the
Fully Stabilized 24-Unit Property at 11% Cap Rate!
 Fully Stabilized 24-Unit Property at 11% Cap Rate! To Insert a Picture here, click inside this box with your mouse, then click on "INSERT PIC" button on the right and select the picture 24 Units consisting
Retail Acquisition Example
 Property Information Retail Acquisition Example Project Assumptions Acquisition Assumptions Property Name Retail Acquisition Example Project Type Acquisition Location Austin, TX Acquisition Cost $1,800,000
Tenant. Operating Cash Flow Yearly Capital Plaza Office Lease Analysis Tennant. Year 1 Year 2 Year 3 Year 4 Year 5 Year 6 Year 7 Year 8 Year 9 Year 10
 Tenant. Operating Cash Flow Yearly Year 1 Year 2 Year 3 Year 4 Year 5 Year 6 Year 7 Year 8 Year 9 Year 10 CASH FLOW BEFORE TAX Rent 193,150 232,400 232,400 232,400 232,400 260,801 260,801 260,801 260,801
$450,000 $63,425 $39, % PURCHASE PRICE NET OPERATING INCOME ANNUAL CASH FLOW CAP RATE
 Executive Summary Key Property Metrics $450,000 $63,425 $39,143 14.1% PURCHASE PRICE NET OPERATING INCOME ANNUAL CASH FLOW CAP RATE $70,000 $60,000 $50,000 $40,000 $30,000 Annual Cash Flow Repairs, 8%
Raising Your Commercial IQ
 Raising Your Commercial IQ Introduction to the Analysis &Valuation of Income Properties July 2012 Neil Osborne M.B.A. DL. (604) 988-5518 nosborne@investitsoftware.com Investit Software Inc. Toll free 877-878-1828
$450,000 $63,425 $33, % PURCHASE PRICE NET OPERATING INCOME ANNUAL CASH FLOW CAP RATE
 Executive Summary Key Property Metrics $450,000 $63,425 $33,431 14.1% PURCHASE PRICE NET OPERATING INCOME ANNUAL CASH FLOW CAP RATE $60,000 $50,000 $40,000 $30,000 Annual Cash Flow Maintenance & Repairs,
Investit Software Inc. Investor Pro
 Investor Pro Table of Contents Investor Pro...3 Introduction...3 The fastest way to learn Investor Pro...4 Selecting a Template. Which Template should I use?...6 Setting and changing the Starting Date
2) All long-term leases should be capitalized in the accounts by the lessee.
 All long-term leases should be capitalized in the accounts by the lessee.") Chapter 18 Leases 1) The principal attribute of finance leases is that the risks and rewards of asset ownership are deemed to remain with the lessor. LO: 18-02 List the criteria for classification of a
Chapter 18 Leases 1) The principal attribute of finance leases is that the risks and rewards of asset ownership are deemed to remain with the lessor. LO: 18-02 List the criteria for classification of a
REAL ESTATE INVESTMENTS
 REAL ESTATE INVESTMENTS PROBLEM SET 2 1. PROBLEM The leases for space in an office building provide for limitations or stops on the lessor s liability for real estate taxes and operating expenses. Each
Atwater ave Fiscal Year Beginning January 2019
 10-Year After Tax Cash Flow Analysis INITIAL INVESTMENT Purchase Price + Acquisition Costs - 1st Mortgage + Total Loan Fees and Points Initial Investment $949900 $9499 $474950 $4750 $489198 MORTGAGE DATA
Chapter 1 Economics of Net Leases and Sale-Leasebacks
 Chapter 1 Economics of Net Leases and Sale-Leasebacks 1:1 What Is a Net Lease? 1:2 Types of Net Leases 1:2.1 Bond Lease 1:2.2 Absolute Net Lease 1:2.3 Triple Net Lease 1:2.4 Double Net Lease 1:2.5 The
Chapter 18. Investors have different required yields Different risk assessment Different opportunity cost of equity
 Decision Making in Real Estate Centers Around Valuation Chapter 18 Investment Decisions: Ratios We examined the concept of market value in Chapters 7 & 8 As noted, professional RE appraisers are often
BUSI 331. Suggested Answers to Review and Discussion Questions: Lesson 7
 BUSI Suggested Answers to Review and Discussion Questions: Lesson 7. To calculate the net operating income, first determine the gross potential income for Years and 6: Year Calculation Gross Potential
Real Estate & REIT Modeling: Quiz Questions Module 1 Accounting, Overview & Key Metrics
 Real Estate & REIT Modeling: Quiz Questions Module 1 Accounting, Overview & Key Metrics 1. How are REITs different from normal companies? a. Unlike normal companies, REITs are not required to pay income
Deal Analyzer for Rentals
 for Rentals Preview Of What You Will Learn Sections: Introduction... 6 Section 1: Inputs... 10 Section 2: Core Numbers... 13 Section 3: First-Year Operating Projection... 15 Section 4: Five-Year Operating
Project Economics: The Value of Leasing. Russell Banham, Savills
 ICSC European Retail Property School Project Economics: The Value of Leasing Russell Banham, Savills (Investment, Development & Asset Management) Introduction Who I am Russell Banham Over 30 years of experience
Raising Your Commercial IQ video series
 Raising Your Commercial IQ video series Investit Software Inc. 1-877-878-1828 www.investitpro.com Instructor Neil Osborne, our lead instructor and President of Investit Software, has many years of experience
Cost Segregation Instructor Teaching Schedule (3-Hour)
") Time Topic Pages Student Objectives 8:30-8:35 Course introduction Page 2 What is cost segregation? Objective of cost segregation: to increase cash flow Benefit of cost segregation Learning objectives Page
Time Topic Pages Student Objectives 8:30-8:35 Course introduction Page 2 What is cost segregation? Objective of cost segregation: to increase cash flow Benefit of cost segregation Learning objectives Page
Deal Analyzer for Rentals
 Deal Analyzer for Rentals Preview Of What You Will Learn Sections: Introduction... 6 Section 1: Inputs... 10 Section 2: Core Numbers... 13 Section 3: First-Year Operating Projection... 15 Section 4: Five-Year
Corporate Presentation
 October 2018 Corporate Presentation (NYSE: SAFE) Forward-Looking Statements and Other Matters This release may contain forward-looking statements. All statements other than statements of historical fact
Investit Software Inc. LEASE ANALYSIS LANDLORD INDUSTRIAL USA EXAMPLE TENANT RENTING SINGLE SPACE
 LEASE ANALYSIS LANDLORD INDUSTRIAL USA EXAMPLE TENANT RENTING SINGLE SPACE INTRODUCTION This Lease Analysis example analyses an industrial lease from a Landlord s perspective where the tenant is renting
Basics of Commercial Real Estate Transactions Day Two
 Basics of Commercial Real Estate Transactions Day Two John Rockwell, Partner Energy October 12, 2016 PG&E refers to the Pacific Gas and Electric Company, a subsidiary of PG&E Corporation. 2010 Pacific
Advanced M&A and Merger Models Quiz Questions
 Advanced M&A and Merger Models Quiz Questions Transaction Assumptions and Sources & Uses Purchase Price Allocation & Balance Sheet Combination Combining the Income Statement Revenue, Expense, and CapEx
Four (4) Factors in Investment Definition: Investment
 Factors in Investment Definition: Investment") Introductions Your name Where you work Your job responsibilities How long you have been in the industry What you hope to get from this class Chapter 1: Investments Agenda 2 Investments Adding Value to
Introductions Your name Where you work Your job responsibilities How long you have been in the industry What you hope to get from this class Chapter 1: Investments Agenda 2 Investments Adding Value to
1173 Fortune Boulevard, Shiloh, Illinois Office (618) Fax (618)
 Fax (618)") 6,240 Sq. Ft 2 levels 100% Leased to Long Term Tenants 10.22% CAP Rate based on actual Low Operating Expenses New Roof & Remodeled 1 st Floor Located in Copper Bend Sale: $550,000 ($88.14 per Sq. Ft.)
6,240 Sq. Ft 2 levels 100% Leased to Long Term Tenants 10.22% CAP Rate based on actual Low Operating Expenses New Roof & Remodeled 1 st Floor Located in Copper Bend Sale: $550,000 ($88.14 per Sq. Ft.)
Investit Software Inc. LEASE ANALYSIS LANDLORD INDUSTRIAL USA EXAMPLE
 LEASE ANALYSIS LANDLORD INDUSTRIAL USA EXAMPLE INTRODUCTION This Lease Analysis example analyses an industrial lease from a Landlords perspective. The landlord is considering a proposal from Apex Manufacturing
Investit Software Inc. OFFICE BUILDING YEARLY CANADA EXAMPLE
 INTRODUCTION This office example uses features such as Free Rent. OFFICE BUILDING YEARLY CANADA EXAMPLE For simplicity there are only two tenants used in the example. Tenant A. 5,000 Sq. Ft Tenant B. 3,400
Following is an example of an income and expense benchmark worksheet:
 After analyzing income and expense information and establishing typical rents and expenses, apply benchmarks and base standards to the reappraisal area. Following is an example of an income and expense
COMPARISON OF THE LONG-TERM COST OF SHELTER ALLOWANCES AND NON-PROFIT HOUSING
 COMPARISON OF THE LONG-TERM COST OF SHELTER ALLOWANCES AND NON-PROFIT HOUSING Prepared for The Fair Rental Policy Organization of Ontario By Clayton Research Associates Limited October, 1993 EXECUTIVE
Investit Software Inc. LEASE ANALYSIS LANDLORD OFFICE USA EXAMPLE TENANT RENTING SINGLE SPACE
 LEASE ANALYSIS LANDLORD OFFICE USA EXAMPLE TENANT RENTING SINGLE SPACE INTRODUCTION This Lease Analysis example analyses an office lease from a landlord s perspective where the tenant is renting one space
Analysing lessee financial statements and Non-GAAP performance measures
 February 2019 IFRS Foundation The Essentials Issue No. 5 Analysing lessee financial statements and Non-GAAP performance measures Introduction Investors and company managers generally view free cash flow
Raising Your Commercial IQ Webinar series
 Raising Your Commercial IQ Webinar series Investit Software Inc. www.investitpro.com Registration & Payment Call 1-877-878-1828 or e-mail contact information to commercial@investitsoftware.com Register
Sales Associate Course
 Sales Associate Course Chapter Seventeen Real Estate Investments and Business Opportunity Brokerage 1 Investment Analysis Most important consideration: Economic soundness Land use controls Zoning Deed
The Neponset 400 Neponset Avenue Boston, MA 02122
 Location, Location, Location Approx 210,000 per day traffic count jfitzgerald@remax.net Phone: (617) 268-5100 Fax: (617) 268-5160 738 E Broadway Boston, MA 02127 www.baystateliving.com Table of Contents
Power Analy$I$ Maximizing Inve$tment Return$ With Your Computer
 Power Analy$I$ Maximizing Inve$tment Return$ With Your Computer New Version 10.0 Developed by: James F. Little, MBA, CCIM www.1031.com JamesFLittle@MSN.com Introduction New Version 10.0 The following screen
Refurbishment of. Apartments how do you calculate? Refurbishment costs and life expectancy. Refurbishment Costs. Life expectancy
 Refurbishment of Apartments how do you calculate? Alexander Krüger, 2009-04-14 To calculate a refurbishment of an apartment sounds pretty simple you have costs and the advantage of increase in rental income.
Classify and describe basic forms of real estate investments.
 LOS 43.a 2017 CFA Exam SS 15 Classify and describe basic forms of real estate investments. Card 1 of 52 LOS 43.a There are four basic forms of real estate investment; private equity (direct ownership),
The construction loan collapses a series of costs (cash outflows) incurred during the construction process into a single value
 incurred during the construction process into a single value") he construction loan collapses a series of costs (cash outflows) incurred during the construction process into a single value as of a single (future) point in time (the projected completion date of the
he construction loan collapses a series of costs (cash outflows) incurred during the construction process into a single value as of a single (future) point in time (the projected completion date of the
MONITORDAILY SPECIAL REPORT. Lease Accounting Project Update as of May 25, 2011 Prepared by Bill Bosco, Leasing 101
 MONITORDAILY SPECIAL REPORT Lease Accounting Project Update as of May 25, 2011 Prepared by Bill Bosco, Leasing 101 The high volume of comment letters (780+) and numerous outreach meetings had common criticisms
Investit Software Inc. BUY versus LEASE EXAMPLE
 BUY versus LEASE EXAMPLE INTRODUCTION The Buy v Lease example analysis is for an office, industrial or retail property This practice example consists of two Sections; 1. The input information for the project
2016 Level I Tutorials. Income Approach to Value
 2016 Level I Tutorials Income Approach to Value 1 The income approach is based on the principal that the value of an investment property reflects the quality and quantity of the income it is expected to
To make money in short-sale foreclosures you must
 C H A P T E R1 Make Money in Short-Sale Foreclosures To make money in short-sale foreclosures you must first understand foreclosures. Two strategies to make money in foreclosures are quick cash and long-term
LeaseCalcs: How to ruin EBITDA results: Renew your lease.
 LeaseCalcs: How to ruin EBITDA results: Renew your lease. Marc A. Maiona June 20, 2015 Your client just renewed their lease and wrecked EBITDA in the process If You Care About EBITDA, You Shouldn t Renew.
BUSI 330 Suggested Answers to Review and Discussion Questions: Lesson 10
 BUSI 330 Suggested Answers to Review and Discussion Questions: Lesson 10 1. The client should give you a copy of their income and expense statements for the last 3 years showing their rental income by
International Accounting Standard 17 Leases. Objective. Scope. Definitions IAS 17
 International Accounting Standard 17 Leases Objective 1 The objective of this Standard is to prescribe, for lessees and lessors, the appropriate accounting policies and disclosure to apply in relation
CFA Level 1. Financial Reporting and Analysis. Non-current Liabilities
 CFA Level 1 Financial Reporting and Analysis Non-current Liabilities 2011, Associate Professor Ole Sørensen, Ph.d. Side 1 Coupon Bonds Promises two types of payments: periodic interest payments and a lumpsum
Value Fluctuations in a Real Estate Investment Financed with Debt
 Working Draft of New Case Study 4A Value Fluctuations in a Real Estate Investment Financed with Debt (which will be added to AICPA Accounting and Valuation Guide Valuation of Portfolio Company Investments
OFFERING MEMORANDUM FOR INVESTORS LOOKING for a LEGITIMATE 10%+ IRR YIELD
 OFFERING MEMORANDUM FOR INVESTORS LOOKING for a LEGITIMATE 10%+ IRR YIELD Property has years of 100% occupancy with waiting list Av. length of stay about 7 years, some as long as 16, some 2 nd generation
NA Calculations Manual
 NA Calculations Manual ARGUS Developer 8.0 November 2017 ARGUS Software An Altus Group Company 0 2017 ARGUS Software, Inc. NA Calculations Manual for ARGUS Developer 8.0 November 2017 Published by: ARGUS
Sterling Plaza. 21,000 Sq. Ft Retail Center
 CTA Realty Peter Jones 1234 Western Ave, Tuscon, Arizona 352647 USA Bus 324-987-6789 Cell 324-877-8907 www.desertrealestate.com Development Profit SALE PRICE 7.50% Cap Rate & NOI of $ 496,242 $ 6,616,560
Credit Risk. Thinkstock. 42 May 2013 The RMA Journal Copyright 2013 by RMA
 CR Credit Risk Thinkstock 42 May 2013 The RMA Journal Copyright 2013 by RMA Pitfalls in Conventional Earnings-Based DSCR Measures and a Recommended Alternative BY DAVID ANDRUKONIS, CRC FOR LENDERS, a significant
CRE Proforma Development Project Summary of Before Tax Cash Flows by Year
 CRE Proforma Development Project Input Data Marginal Tax Bracket 25.0% Mortgage LTV 75% Developer Cost of Carry 15.0% Depn Recovery Rate 20.0% Amort Term (Years) 30 Going Out Cap Rate 9.0% Capital Gain
10 Tips for Real Estate Investors
 10 Tips for Real Estate Investors FINANCIAL ADVISORS TRUSTWORTHY BY DESIGN SM When you buy a home, people often remind you it could be the biggest investment you will ever make. But should you use that
Oregon State University Extension Service
 -----, E55 6 0-713 Cop. Oregon State University Extension Service Computer Software LEASE-BUY? DESCRIPTION: LEASE-BUY? is a spreadsheet template designed to show the least-cost option when deciding whether
Almost any asset that can be purchased can be leased, from aircraft to zithers. When
 CHAPTER 21 Leasing EXECUTIVE SUMMARY Almost any asset that can be purchased can be leased, from aircraft to zithers. When we take vacations or business trips, renting a car for a few days frequently seems
How to Read a Real Estate Appraisal Report
 How to Read a Real Estate Appraisal Report Much of the private, corporate and public wealth of the world consists of real estate. The magnitude of this fundamental resource creates a need for informed
Housing as an Investment Greater Toronto Area
 Housing as an Investment Greater Toronto Area Completed by: Will Dunning Inc. For: Trinity Diversified North America Limited February 2009 Housing as an Investment Greater Toronto Area Overview We are
What Every Real Estate Investor Needs To Know About Real Estate Analysis But Is Afraid To Ask
 What Every Real Estate Investor Needs To Know About Real Estate Analysis But Is Afraid To Ask By Carter Froelich, CPA Copyright 2011, Property Strategies All rights reserved. Property Strategies is a trademark
Chapter 8. How much would you pay today for... The Income Approach to Appraisal
 How much would you pay today for... Chapter 8 One hundred dollars paid with certainty each year for five years, starting one year from now. Why would you pay less than $500 Valuation Using the Income Approach
MG Architects Kimberley Lane Houston, TX For more information contact: Ryan Hartsell Partner
 For more information contact: Partner rhartsell@oxfordcres.com Phone: (713) 647-6400 2900 Weslayan St., Suite 480 Houston, TX 77027 www.oxfordcres.com Table of Contents Real Estate Investment Details...
ORIGINAL PRONOUNCEMENTS
 Financial Accounting Standards Board ORIGINAL PRONOUNCEMENTS AS AMENDED FASB Technical Bulletin No. 88-1 Issues Relating to Accounting for Leases: Time Pattern of the Physical Use of the Property in an
LKAS 17 Sri Lanka Accounting Standard LKAS 17
 Sri Lanka Accounting Standard LKAS 17 Leases CONTENTS SRI LANKA ACCOUNTING STANDARD LKAS 17 LEASES paragraphs OBJECTIVE 1 SCOPE 2 DEFINITIONS 4 CLASSIFICATION OF LEASES 7 LEASES IN THE FINANCIAL STATEMENTS
Sri Lanka Accounting Standard-LKAS 17. Leases
 Sri Lanka Accounting Standard-LKAS 17 Leases -516- Sri Lanka Accounting Standard-LKAS 17 Leases Sri Lanka Accounting Standard LKAS 17 Leases is set out in paragraphs 1 69. All the paragraphs have equal
William & Mary Law School Scholarship Repository
 College of William & Mary Law School William & Mary Law School Scholarship Repository William & Mary Annual Tax Conference Conferences, Events, and Lectures 1971 Leasing Arrangements Lawrence P. Roesen
In-Depth Capitalization Rate Review
 In-Depth Capitalization Rate Review Leonard J. Patcella, Jr., CMI, MAI President Equity Appraisal Co., Inc. Springhouse, PA jack.equityappraisal@comcast.net David A. Schneider, Esq. Partner Archer & Greiner,
Professional Certification Programs
 Professional Certification Programs Participants in NDC training, including staff members of Housing and Economic Development Networks, State and Local Governments, Community Development Banks and Charitable
Broker. Investment Real Estate. Chapter 15. Copyright Gold Coast Schools 1
 Broker Chapter 15 Investment Real Estate Copyright Gold Coast Schools 1 Learning Objectives Matching an investor with the right property Evaluating the sites and improvements of income properties Determining
SSAP 14 STATEMENT OF STANDARD ACCOUNTING PRACTICE 14 LEASES
 SSAP 14 STATEMENT OF STANDARD ACCOUNTING PRACTICE 14 LEASES (Issued October 1987; revised February 2000) The standards, which have been set in bold italic type, should be read in the context of the background
Investit Software Inc. ANALYZER EXPRESS
 ANALYZER EXPRESS Table of Contents Introduction...3 Project Info Folder...4 Finance Folder...6 Income Folder...8 Expenses Folder...9 Goal Seeking...10 Sample Reports...12 Comparison Report...14 Introduction
Baric Lawndale S. Karlov St Chicago, IL Buildings. 115 Total Units. Rehabbed Buildings with all Separate Mechanicals
 For more information contact: MIC PROPERTIES micproperties@gmail.com 8 Buildings. 115 Total Units Rehabbed Buildings with all Separate Mechanicals Large Units with an Attractive Mix (86-3BR and 29-2BR)
Leasing versus Buying Business Location
 Brief #04.54 Latest Revision: 01/2014 Southern Ohio Chapters Leasing versus Buying Business Location Should you lease business property for your factory, warehouse, store or office, or should you buy it?
Risk Management Insights
 Risk Management Insights Appraisal Review Part II: Income Capitalization Approach George Mann, Managing Director and Chief Appraiser, Collateral Evaluation Services, Inc.and Nikki Griffith, MAI, CCIM,
Chapter 8. How much would you pay today for... The Income Approach to Appraisal
 How much would you pay today for... Chapter 8 One hundred dollars paid with certainty each year for five years, starting one year from now. Why would you pay less than $500 Valuation Using the Income Approach
Upper Lakeshore Mobile Home Park
 For more information contact: Certified Commerical Broker/Owner rroberts@ccim.net $1,295,000 New Asking Price $155,000 PRICE REDUCTION HUGE VALUE ADD PROPERTY MOTIVATED SELLER Phone: 509-248-9400 Fax:
The Value of a Master Lease
 The Value of a Master Lease January 05, 2009 In today's economic climate, commercial real estate owners are finding themselves forced to creatively position their properties to entice buyers or satisfy
FLORIDA BROKER PRELICENSE (FREC II) (V2)
 (V2)") FLORIDA BROKER PRELICENSE (FREC II) (V2) TIME CONTENT OUTLINE LEARNING OBJECTIVES -- After this segment, the Licensing 7 hours 45 mins. License Law and Rules 1 explain the purpose of the license law describe
FLORIDA BROKER PRELICENSE (FREC II) (V2) TIME CONTENT OUTLINE LEARNING OBJECTIVES -- After this segment, the Licensing 7 hours 45 mins. License Law and Rules 1 explain the purpose of the license law describe
Valuation techniques to improve rigour and transparency in commercial valuations
 Valuation techniques to improve rigour and transparency in commercial valuations WHY BOTHER? Rational Accurate Good theory is good practice RECESSION. Over rented properties Vacant Properties Properties
Building Wealth With Real Estate
 Building Wealth With Real Estate - Broker/Property Manager/Loan Officer Goal of My Presentation- Understand These Topics 2 How To Build Wealth And Retire Sooner Types of Income Income Tax Rates Cash Flow
GASB 87 - Leases. South Carolina Association of CPAs Fall Fest November 16, 2018 Mauldin & Jenkins
 November 16, 2018 Mauldin & Jenkins 800-277-0050 www.mjcpa.com GASB 87 - Leases Effective for periods beginning after December 15, 2019 - December 31, 2020 or June 30, 2021 or September 30, 2021 Amends
IFRS 16 LEASES. Page 1 of 21
 IFRS 16 LEASES OBJECTIVE The objective is to ensure that lessees and lessors provide relevant information in a manner that faithfully represents those transactions. This information gives a basis for users
Investment Guide. home loans
 Investment Guide home loans Your investment journey With the right finance solution, a property investment can build your wealth and improve your financial security. There are hundreds of thousands of
GUIDE. The Shields Team of Keller Williams Realty (423)
") GUIDE The Shields Team of Keller Williams Realty (423) 896-1232 www.tricityrealestateforsale.com theshieldsteam@gmail.com Shields Team At The Shields Team, we also love real estate--the land, the homes,
GUIDE The Shields Team of Keller Williams Realty (423) 896-1232 www.tricityrealestateforsale.com theshieldsteam@gmail.com Shields Team At The Shields Team, we also love real estate--the land, the homes,
EN Official Journal of the European Union L 320/373
 29.11.2008 EN Official Journal of the European Union L 320/373 INTERNATIONAL FINANCIAL REPORTING STANDARD 3 Business combinations OBJECTIVE 1 The objective of this IFRS is to specify the financial reporting
The result of your calculations is the Net Operating Income, or monthly cash flow BEFORE any mortgage payments.
 CHEAT SHEET #6 NET OPERATING INCOME (IS YOUR RENTAL REALLY MAKING MONEY?) The Net Operating Income calculation is fairly straightforward. al income minus the expenses to own and operate the property equals
The joint leases project change is coming
 No. 2010-4 18 June 2010 Technical Line Technical guidance on standards and practice issues The joint leases project change is coming What you need to know The proposed changes to the accounting for leases
Accounting for Leases
 Office: Business Services Procedure Contact: Director of Business Services Related Policy or Policies: Noted within procedure statement Revision History Revision Number: Change: Date: 001 Update content
Glendale, California - PS Business Parks, Inc. (AMEX: PSB), reported operating results for the fourth quarter and the year ending December 31, 2001.
, reported operating results for the fourth quarter and the year ending December 31, 2001.") News Release PS Business Parks, Inc. 701 Western Avenue P.O. Box 25050 Glendale, CA 91221-5050 www.psbusinessparks.com For Release: Immediately Date: January 30, 2002 Contact: Mr. Jack Corrigan (818) 244-8080,
News Release PS Business Parks, Inc. 701 Western Avenue P.O. Box 25050 Glendale, CA 91221-5050 www.psbusinessparks.com For Release: Immediately Date: January 30, 2002 Contact: Mr. Jack Corrigan (818) 244-8080,
HOW TO MAKE THE RIGHT LEASING DECISIONS
 HOW TO MAKE THE RIGHT LEASING DECISIONS 9480A HOW TO MAKE THE RIGHT LEASING DECISIONS RICHARD W. LOTT CONTENTS ABOUT THIS COURSE ix HOW TO TAKE THIS COURSE xi 1 LEASING: HISTORY AND TRENDS 1 LESSORS
THE APPRAISAL OF REAL ESTATE 3 RD CANADIAN EDITION BUSI 330
 THE APPRAISAL OF REAL ESTATE 3 RD CANADIAN EDITION BUSI 330 REVIEW NOTES by CHUCK DUNN CHAPTER 20 Copyright 2010 by the Real Estate Division and Chuck Dunn. All rights reserved CHAPTER 20 - THE INCOME
Real Estate Modelling This course can also be presented in-house for your company or via live on-line webinar
 Real Estate Modelling This course can also be presented in-house for your company or via live on-line webinar The Banking and Corporate Finance Training Specialist Course Overview Course Methodology This
Chapter 8. The Income Approach to Appraisal. Two Approaches to Income Valuation. How Does DCF Differ from Direct Cap? Rationale:
 The Income Approach to Appraisal Chapter 8 Valuation Using the Income Approach Rationale: Value of a property is the present value of its anticipated income. Often called income capitalization Capitalize:
SAMPLE ONLY. Property Investment Anaylsis Example. Free Call: INVEST REAL ESTATE FINANCE DEVELOP SUMMARY
 Free Call: 1300 187 894 696 Beaufort St Mt Lawley, W.A. 6050 PO Box 866, Inglewood WA 6032 info@pebgroup.com.au Property Investment Anaylsis Example SUMMARY www.pebgroup.com.au Assumptions Projected results
Financing Capital Expenditures
 Financing Capital Expenditures EVALUATING THE PRIMARY OPTIONS By xxxx xxxxxx Periodic capital expenditures are vital to an organization s ability to maintain and expand operations, build revenue and enhance
Cap Rate Trends, Methodology and Analysis. Dane R. Anderson MAI, CCIM Appraisal & Litigation Services Director
 Cap Rate Trends, Methodology and Analysis Dane R. Anderson MAI, CCIM Appraisal & Litigation Services Director 1 Quickly The Income Approach Basis of the Approach Present worth of future benefits Two Methods:
Applying IFRS. Impairment considerations for the new leasing standard. November 2018
 Applying IFRS Impairment considerations for the new leasing standard November 2018 Contents Overview 3 1. Impairment of right-of-use assets 1.1 When to test for impairment 1.2 Treatment of lease liabilities
So you wanna be a landlord? Tax considerations for rental properties
 May 2018 So you wanna be a landlord? Tax considerations for rental properties Jamie Golombek & Debbie Pearl-Weinberg Tax & Estate Planning, CIBC Financial Planning and Advice Considering becoming a landlord?
4/10/2012. Long-Lived Assets and Depreciation. Overview of Long-lived Assets. Learning Objectives (LO) Learning Objectives (LO)
 Learning Objectives (LO)") Learning Objectives (LO) CHAPTER Long-Lived Assets and Depreciation 8 After studying this chapter, you should be able to 1. Distinguish a company s expenses from expenditures that it should capitalize
Learning Objectives (LO) CHAPTER Long-Lived Assets and Depreciation 8 After studying this chapter, you should be able to 1. Distinguish a company s expenses from expenditures that it should capitalize
Leases. (a) the lease transfers ownership of the asset to the lessee by the end of the lease term.
 the lease transfers ownership of the asset to the lessee by the end of the lease term.") Leases 1.1. Classification of leases A lease is classified as a finance lease if it transfers substantially all the risks and rewards incidental to ownership. A lease is classified as an operating lease
Leases 1.1. Classification of leases A lease is classified as a finance lease if it transfers substantially all the risks and rewards incidental to ownership. A lease is classified as an operating lease