An Analysis of Industrial Infill Development. Marty Busekrus, HFF Ed Harrington, CenterPoint Properties Cathy Thuringer, Trammell Crow
|
|
|
- Corey Rose
- 5 years ago
- Views:
Transcription
1 An Analysis of Industrial Infill Development Marty Busekrus, HFF Ed Harrington, CenterPoint Properties Cathy Thuringer, Trammell Crow

2 Marty Busekrus HFF Director with HFF focusing on the industrial capital markets throughout the Southeastern U.S. Responsible for sourcing industrial opportunities by partnering owners with potential capital sources for joint ventures, debt solutions and/or buyers. Prior to joining HFF, Busekrus was a senior associate in CBRE s Private Capital Group and focused on the dispositions of office and industrial projects throughout Southeast Florida.
3 Give Us Your Feedback for this Session! Session evaluations are available on your chair. Please take a moment at the end of this session to provide your feedback on the content and speakers. Evaluations can be handed in to a NAIOP staff member at the back of the room. Thank you!
4 An Analysis of Industrial Infill Development Marty Busekrus, HFF Ed Harrington, CenterPoint Properties Cathy Thuringer, Trammell Crow

5 Ed Harrington CenterPoint Properties Joined CenterPoint Properties Trust in 1999 and currently oversees the development of logistically located facilities and industrial parks for CenterPoint Properties. Has overseen the development of new industrial business parks and manufacturing and distribution facilities. He has spent more than 18 years developing industrial commercial real estate. In addition, he worked for several years as a civil engineer with local Chicago engineering firms.

6 Cathy Thuringer Trammell Crow Principal with Trammell Crow Company Has comprehensive management responsibility for development projects, commencing with initial site acquisition through ultimate project disposition. Oversees all aspects of industrial developments primarily in central and southern Arizona. Project profiles range from multi-phased business park infrastructure to single and multi-story speculative and build-to-suit office and industrial facilities.
7 DEFINING INFILL INDUSTRIAL
8 Industry veterans define it as Any area that has limited sites for new development without having to tear down existing real estate. A mature industrial submarket with a total developable land inventory comprising less than 10-15% of the existing base, where land assemblages are a typical requirement and redevelopment of existing buildings is common. Submarket representing an extremely dense collection of industrial buildings with very high barriers to entry, while also characterized as being proximate to large population centers. Location that benefits from a dense surrounding population and is well positioned to major thoroughfares. Potential development sites located within a heavily populated area that is fully built out with different asset classes. Caused by restrictive zoning which pushes development out of certain areas with more open land areas.
9 Panelists collective definition Infill Industrial projects are new developments that are situated in built-up, established, mature infrastructure areas constrained by geographical or, political challenges whereby new supply can not be added in a reasonable timeframe to meet increases in demand. Tenants are largely focused on last mile delivery and driven by local population or employment base vs. cost
10 Examples of Infill & Greenfield Markets Northern New Jersey Los Angeles South Florida Chicago (O Hare submarket) Atlanta (inner loop) Inland Empire Orlando Chicago (I-55 corridor) St. Louis Atlanta (outside of 285)
11 WHO ARE THE TENANTS? Types of users for infill space Locational drivers for infill tenants Buildout requirements for infill versus greenfield
12 MAXIMIZING COVERAGE Difference in FAR between infill and greenfield Considerations and challenges for maximizing coverage Potential for two-story industrial
13 CAPITAL MARKETS VIEW Differences in underwriting approach for infill versus greenfield Rental rates / rental rate growth Downtime assumptions Cap rates / overall returns Portfolio diversification as it relates to: Occupancy Rental rates Liquidity Competition
14 QTD QTD 2000 Q1 New Jersey Existing industrial buildings (no flex) over 50,000 SF, built after 2000 Infill Markets Greenfield Markets Brunswick/Piscataway Mercer Central Bergen Monmouth Eastern Morris Morris West/I-80 Hudson Waterfront Morristown Hunterdon Ocean County Meadowlands Orange County Newark Pike County North Bergen Warren NW Frontier Rockland County Rt. 46/23/3-I Somerset Sussex County Union West Essex Long Island SF % # % Avg. Size Infill 68,290,337 80% % 243,026 Greenfield 16,911,802 20% 74 21% 228,538 Total 85,202, Northern NJ/New York Vacancy 35% 30% 25% 20% 15% 10% 5% 0% Infill Greenfield Northern NJ/New York Asking NNN Rates $12.00 $11.00 $10.00 $9.00 $8.00 $7.00 $6.00 $5.00 $4.00 Infill Greenfield
15 QTD 2000 Q1 QTD 2000 Q1 Chicago Chicago Vacancy 30% 25% 20% Existing industrial buildings (no flex) over 50,000 SF, built after 2000 Infill Markets Greenfield Markets North Chicago Indiana North Cook Lake County NW Cook Kenosha O Hare McHenry South Chicago North Kane/I-90 Near SW Suburbs South Suburban North I-55 Joliet West Cook South I-55 North DuPage Central Kane/DuPage West Suburbs I-88 West SF % # % Avg. Size Infill 40,441,386 21% % 171,362 Greenfield 150,354,411 79% % 270,422 Total 190,795, ,904 15% 10% 5% 0% Infill Greenfield Chicago Asking NNN Rates $7.00 $6.50 $6.00 $5.50 $5.00 $4.50 $4.00 $3.50 $3.00 Infill Greenfield
16 QTD 2000 Q1 QTD 2000 Q1 Dallas Dallas Vacancy Existing industrial buildings (no flex) over 50,000 SF, built after 2000 Infill Markets Greenfield Markets DFW Airport East Dallas Great SW/Arlington North Ft. Worth NE Dallas South Dallas NW Dallas South Ft. Worth 5% South Stemmons 0% 35% 30% 25% 20% 15% 10% Infill Greenfield Dallas Asking NNN Rates SF % # % Avg. Size Infill 104,879,475 56% % 241,102 Greenfield 83,047,755 44% % 314,575 Total 187,927, ,852 Infill Greenfield $5.50 $5.00 $4.50 $4.00 $3.50 $3.00
17 QTD 2000 Q1 QTD 2000 Q1 Houston Existing industrial buildings (no flex) over 50,000 SF, built after 2000 Infill Markets Greenfield Markets CBD North Fwy/Tomball Pkwy North Outer Loop N Hardy Toll Rd. NE I-10 Woodland/Conroe NE Inner Loop NE Hwy 321 NW Inner Loop NE Hwy 90 NW Near Hwy 290/Tomball Pkwy South Inner Loop NW Hwy 6 NW Outliers West Outer Loop Southeast Corridor South Hwy 35 SW Corridor Houston Vacancy 40% 35% 30% 25% 20% 15% 10% 5% 0% Infill Greenfield Houston Asking NNN Rates $9.00 $8.00 SF % # % Avg. Size Infill 12,641,573 13% 98 15% 128,996 Greenfield 87,401,875 87% % 160,665 Total 100,043, Infill Greenfield $7.00 $6.00 $5.00 $4.00 $3.00
18 QTD 2000 Q1 QTD 2000 Q1 Southern CA Existing industrial buildings (no flex) over 50,000 SF, built after 2000 Infill Markets Greenfield Markets Carson/Rancho Domingz Antelope Valley Central LA Conejo Valley Commerce Area SCV/Lancaster/Palmdale Eastern SGV Inland Empire East El Segundo Gardena/110 Corridor Long Beach Lower SGV Lynwoo/Paramount Mid-Counties LA Northwest SGV SFV East SFV West Southwest SGV Torrance Upper SGV Ventura County Vernon Inland Empire West Orange County (all) SF % # % Avg. Size Infill 184,914,784 56% % 192,820 Greenfield 143,118,898 44% % 307,122 Total 328,033,682 1, ,199 Southern CA Vacancy Infill Southern CA Asking NNN Rates Infill Greenfield Greenfield 35% 30% 25% 20% 15% 10% 5% 0% $8.00 $7.50 $7.00 $6.50 $6.00 $5.50 $5.00 $4.50 $4.00 $3.50 $3.00
19 QTD 2000 Q1 QTD Phoenix Phoenix Vacancy 60% 50% Existing industrial buildings (no flex) over 50,000 SF, built after 2000 Infill Markets Greenfield Markets Central Phoenix Chandler Airport Grand Ave. Chandler Mesa Chandler N/Gilbert North Airport Deer Valley/Pinnacle Park N Black Canyon Falcon Field/Apache Jct. S Airport N of Roser Glendale S Airport S of Roser Goodyear SC N of Salt River N Glendale SC S of Salt River Pinal County Scottsdale Airpark Scottsdale/Salt River SW N of Buckeye Rd. SW S of Buckeye Road Tempe Tolleson Tempe Northwest Tempe Southwest W Phoenix SF % # % Avg. Size Infill 14,003,592 20% % 116,697 Greenfield 56,721,429 80% % 204,034 Total 70,725, ,701 40% 30% 20% 10% 0% Infill Greenfield Phoenix Asking NNN Rates $7.50 $7.00 $6.50 $6.00 $5.50 $5.00 $4.50 $4.00 $3.50 Infill Greenfield
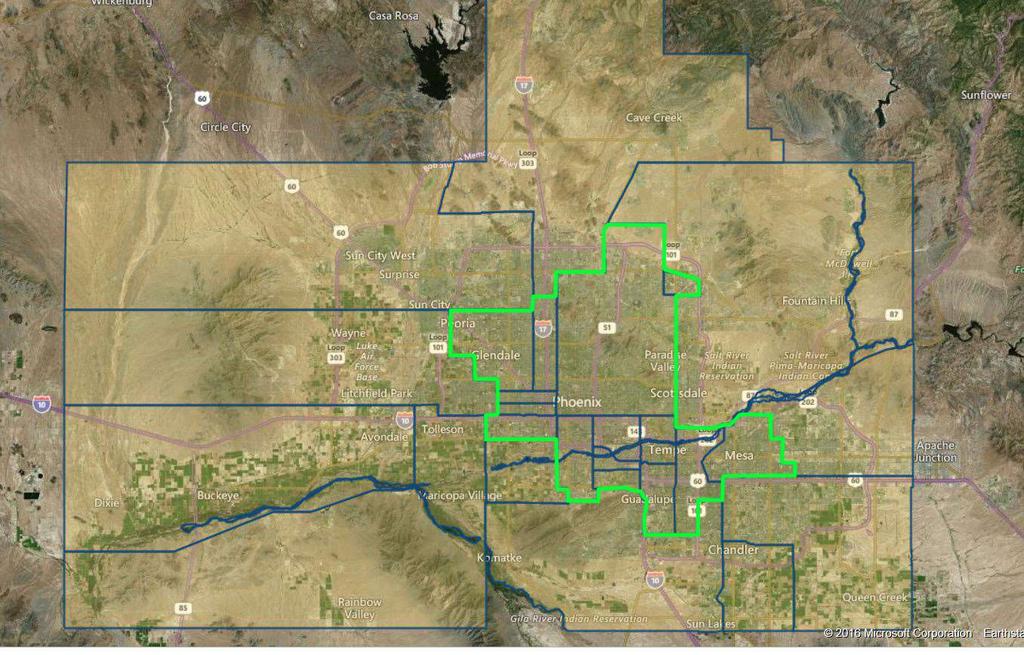
20 Phoenix
21 QTD 2016 Q Q Q Q Q Q Q Q Q Q Q Q Q Q Q Q Q Q Q Q Q Q Q Q Q Q Q Q Q Q Q Q Q Q1 Major Markets Combined All Infield vs. Greenfield Existing Industrial (no flex) buildings built after 2000, over 50,000 SF MAJOR MARKETS VACANCY RATES 30% 25% 20% 15% 10% 5% 0% Infill Vacancy Greenfield Vacancy
22 QUESTIONS?
23 Give Us Your Feedback for this Session! Session evaluations are available on your chair. Please take a moment at the end of this session to provide your feedback on the content and speakers. Evaluations can be handed in to a NAIOP staff member at the back of the room. Thank you!
Industrial Market Closes 2017 on an Upswing
 Research & Forecast Report GREATER PHOENIX INDUSTRIAL Industrial Market Closes on an Upswing Key Takeaways > > The Greater Phoenix industrial market finished off a year of robust tenant demand with a strong
Strong Absorption Drives Down Vacancy to Start 2017
 Research & Forecast Report GREATER PHOENIX INDUSTRIAL 2017 Strong Absorption Drives Down to Start 2017 Key Takeaways >> Industrial vacancy in Greater Phoenix dipped below 10 percent in the first quarter,
MARCH 2019 CITI 2019 GLOBAL PROPERTY CEO CONFERENCE
 MARCH 2019 CITI 2019 GLOBAL PROPERTY CEO CONFERENCE SAFE HARBOR This presentation contains forward-looking statements within the meaning of Section 27A of the Securities Act of 1933, and Section 21E of
Industrial Market Report
 Industrial Market Report Greater Phoenix Q4 2012 CONTACT NAI HORIZON 602.955.4000 2944 N 44TH STREET, SUITE 200, PHOENIX, AZ 85018 WWW.NAIHORIZON.COM Building Momentum for a Positive 2013 The Phoenix Industrial
CoStar Industrial Statistics. F i r s t Q u a r t e r Phoenix Industrial Market
 CoStar Industrial Statistics F i r s t Q u a r t e r 2 0 1 8 First Quarter 2018 Phoenix Table of Contents Table of Contents................................................................. A Methodology......................................................................
Growing Demand for Smaller Industrial Properties
 Growing Demand for Smaller Industrial Properties Moderator: Lew Friedland, Colony Capital Panelists: Rene Circ, CoStar Portfolio Strategy Brian Fiumara, CBRE Andrew Mele, Trammell Crow Company #crec15
The CoStar Industrial Report. F i r s t Q u a r t e r Phoenix Industrial Market
 The CoStar Industrial Report F i r s t Q u a r t e r 2 0 1 6 First Quarter 2016 Phoenix Table of Contents Table of Contents................................................................. A Methodology......................................................................
MARCH 2018 CITI 2018 GLOBAL PROPERTY CEO CONFERENCE
 MARCH 2018 CITI 2018 GLOBAL PROPERTY CEO CONFERENCE SAFE HARBOR This presentation contains forward-looking statements within the meaning of Section 27A of the Securities Act of 1933, and Section 21E of
CoStar Industrial Statistics. T h i r d Q u a r t e r Phoenix Industrial Market
 CoStar Industrial Statistics T h i r d Q u a r t e r 2 0 1 7 Third Quarter 2017 Phoenix Table of Contents Table of Contents................................................................. A Methodology......................................................................
The CoStar Industrial Report
 The CoStar Industrial Report M I D - Y E A R 2 0 0 9 MID-YEAR 2009 PHOENIX Table of Contents Table of Contents.................................................................... A Methodology........................................................................
INDUSTRIAL QUICK STATS SUMMARY & OUTLOOK MARKET TRENDS VACANCY & NET ABSORPTION ECONOMIC STATS
 PHOENIX, ARIZONA INDUSTRIAL THIRD QUARTER 217 QUICK STATS Direct Vacancy 8.7% Overall Vacancy 9.% Lease Rate NNN $.54 Gross Absorption Under Construction MARKET TRENDS Current Quarter 5,991,128 SF 4,751,494
The CoStar Industrial Report. Y e a r - E n d Phoenix Industrial Market
 The CoStar Industrial Report Y e a r - E n d 2 0 1 5 Year-End 2015 Phoenix Table of Contents Table of Contents................................................................. A Methodology......................................................................
MARKET WATCH SOUTHERN CALIFORNIA & PHOENIX
 SOUTHERN CALIFORNIA & PHOENIX COMMERCIAL REAL ESTATE MARKET FOURTH QUARTER 217 MARKET WATCH SOUTHERN CALIFORNIA & PHOENIX 1.888.659.DAUM WWW.DAUMCOMMERCIAL.COM D/AQ Corp. # 1129558 DAUM TABLE OF CONTENTS
INDUSTRIAL QUICK STATS SUMMARY & OUTLOOK MARKET TRENDS VACANCY & NET ABSORPTION ECONOMIC STATS. Current Quarter. Direct Vacancy 2.
 LOS ANGELES NORTH INDUSTRIAL THIRD QUARTER 218 QUICK STATS Direct Vacancy 2.3% Overall Vacancy 2.6% Lease Rate NNN $1.1 Gross Absorption Under Construction MARKET TRENDS Current Quarter 1,632,564 SF 595,199
The CoStar Industrial Report. Y e a r - E n d Phoenix Industrial Market
 The CoStar Industrial Report Y e a r - E n d 2 0 1 4 Year-End 2014 Phoenix Table of Contents Table of Contents................................................................. A Methodology......................................................................
INDUSTRIAL QUICK STATS SUMMARY & OUTLOOK MARKET TRENDS VACANCY & NET ABSORPTION ECONOMIC STATS
 VENTURA COUNTY INDUSTRIAL FOURTH QUARTER 217 QUICK STATS Direct Vacancy 2.1% Overall Vacancy 2.4% Lease Rate NNN $.7 Gross Absorption Under Construction MARKET TRENDS Current Quarter 1,332,957 SF 774,362
INDUSTRIAL QUICK STATS SUMMARY & OUTLOOK MARKET TRENDS VACANCY & NET ABSORPTION ECONOMIC STATS
 ORANGE COUNTY INDUSTRIAL FOURTH QUARTER 217 QUICK STATS Direct Vacancy 2.3% Overall Vacancy 2.7% Lease Rate NNN $.91 Gross Absorption Under Construction MARKET TRENDS Current Quarter 4,283,991 SF 963,138
INDUSTRIAL QUICK STATS SUMMARY & OUTLOOK MARKET TRENDS VACANCY & NET ABSORPTION ECONOMIC STATS. Current Quarter. Direct Vacancy 2.
 ORANGE COUNTY INDUSTRIAL SECOND QUARTER 218 QUICK STATS Direct Vacancy 2.2% Overall Vacancy 2.5% Lease Rate NNN $.95 Gross Absorption Under Construction MARKET TRENDS Current Quarter 2,956,71 SF 1,367,18
Macquarie ProLogis Trust Acquisition of North American industrial portfolio
 Macquarie ProLogis Trust Acquisition of North American industrial portfolio mêçiçöáë=m~êâ=fjonm=aáëíêáäìíáçå=`éåíéê=@ni=oá~äíçi=`~äáñçêåá~ ^éêáä=ommr Overview Macquarie ProLogis Trust (MPR) has acquired
Why Purpose Built Single Family Rentals? January 11, By: Tim Sullivan Meyers Research LLC
 Why Purpose Built Single Family Rentals? January 11, 2018 By: Tim Sullivan Meyers Research LLC Of the 117 Million Units in U.S., 36% are Rented U.S. Homeownership Rate Near a 20-Year Low 28% of Rental
The CoStar Industrial Report
 The CoStar Industrial Report M I D - Y E A R 2 0 1 0 Houston Industrial Market Houston Industrial Market MID-YEAR 2010 HOUSTON Table of Contents Table of Contents....................................................................
Chicago s industrial market thrives during the third quarter.
 CHICAGO INDUSTRIAL MARKET MONITOR THIRD QUARTER 2015 Chicago s industrial market thrives during the third quarter. Demand across the Chicago industrial market remains high sending absorption up and vacancy
Houston s industrial market continues to expand
 Research & Forecast Report HOUSTON INDUSTRIAL Q1 2017 Houston s industrial market continues to expand Lisa Bridges Director of Market Research Houston During the first quarter of 2017, 1.7M SF of Houston
The CoStar Office Report
 The CoStar Office Report T H I R D Q U A R T E R 2 0 1 2 THIRD QUARTER 2012 PHOENIX Table of Contents Table of Contents.................................................................... A Methodology........................................................................
INDUSTRIAL QUICK STATS SUMMARY & OUTLOOK MARKET TRENDS VACANCY & NET ABSORPTION ECONOMIC STATS
 INLAND EMPIRE INDUSTRIAL FOURTH QUARTER 217 QUICK STATS Direct Vacancy 5.1% Overall Vacancy 5.3% Lease Rate NNN $.57 Gross Absorption Under Construction MARKET TRENDS Current Quarter 9,23,744 SF 16,31,563
The CoStar Office Report
 The CoStar Office Report Y E A R - E N D 2 0 0 8 YEAR-END 2008 PHOENIX Table of Contents Table of Contents.................................................................... A Methodology........................................................................
Investor Presentation 2007
 Investor Presentation 2007 1 Forward Looking Statements This presentation contains forward-looking statements within the meaning of the federal securities laws. These statements reflect management s current
OFFICE QUICK STATS SUMMARY & OUTLOOK MARKET TRENDS VACANCY & NET ABSORPTION ECONOMIC STATS
 LOS ANGELES SAN GABRIEL VALLEY OFFICE SECOND QUARTER 218 QUICK STATS Direct Vacancy 11.1% Overall Vacancy 11.4% Lease Rate FSG $2.32 Gross Absorption Under Construction MARKET TRENDS Current Quarter 345,68
OFFICE QUICK STATS SUMMARY & OUTLOOK MARKET TRENDS VACANCY & NET ABSORPTION ECONOMIC STATS
 INLAND EMPIRE OFFICE THIRD QUARTER 217 QUICK STATS Direct Vacancy 11.4% Overall Vacancy 11.7% Lease Rate FSG $1.83 Gross Absorption Under Construction MARKET TRENDS Current Quarter 529,634 SF 45,24 SF
Q PHOENIX INDUSTRIAL REPORT
 Q2 2018 PHOENIX INDUSTRIAL REPORT MARKET FUNDAMENTALS ANNUAL COMPARISON Q2 2018 Q2 2017 VACANCY 6.97% VACANCY 8.95% RENTAL RATES $0.59 RENTAL RATES $0.58 SF UNDER CONSTRUCTION 5.79 M SF UNDER CONSTRUCTION
Americas Office Trends Report
 Americas Office Trends Report Summary The overall U.S. office market picked up the pace in the second quarter of 2016 despite continued global economic and financial market uncertainty. While the Brexit
OFFICE QUICK STATS SUMMARY & OUTLOOK MARKET TRENDS VACANCY & NET ABSORPTION ECONOMIC STATS
 LOS ANGELES CENTAL/SOUTHEAST OFFICE THIRD QUARTER 218 QUICK STATS Direct Vacancy 14.7% Overall Vacancy 15.2% Lease Rate FSG $3.16 Gross Absorption Under Construction MARKET TRENDS Change from Last Quarter
1776 Woodstead Court, Suite 218 The Woodlands, TX cypressbrook.com
 Providing Exceptional Service Through Speed, Skill, and Stewardship 1776 Woodstead Court, Suite 218 The Woodlands, TX 77380 281.364.1777 cypressbrook.com THE COMPANY Cypressbrook Company is a real estate
Chicago s industrial market thrives during the second quarter.
 Economic Overview CHICAGO INDUSTRIAL MARKET MONITOR SECOND QUARTER 2015 Chicago s industrial market thrives during the second quarter. Demand across the Chicago industrial market remains high sending absorption
MARKET REPORT PHOENIX METRO OFFICE
 Q3 2018 MARKET REPORT PHOENIX METRO OFFICE Q3 Phoenix Office Market Overiew Key Takeaways * Compared To Last Quarter Total Vacancy 17.25% Q3 Net Absorption 999,900 SF Absorption/Vacancy 2008-2018 Average
>> Tight Market Condions & Rising Rents
 Research & Forecast Report GREATER L.A. INDUSTRIAL Accelerating success. >> Tight Market Condions & Rising Rents Key Takeaways > The Greater Los Angeles Basin industrial market absorbed 6,025,000 SF of
OFFICE QUICK STATS SUMMARY & OUTLOOK MARKET TRENDS VACANCY & NET ABSORPTION ECONOMIC STATS
 ORANGE COUNTY OFFICE THIRD QUARTER 217 QUICK STATS Direct Vacancy 12.1% Overall Vacancy 12.9% Lease Rate FSG $2.61 Gross Absorption Under Construction MARKET TRENDS Current Quarter 2,479,293 SF 379, SF
Vacancy Inches Higher, Despite Continued Absorption
 Research & Forecast Report GREATER PHOENIX OFFICE 1Q 2017 Vacancy Inches Higher, Despite Continued Absorption Key Takeaways > > Improving conditions in the Greater Phoenix office market took a pause in
OFFICE QUICK STATS SUMMARY & OUTLOOK MARKET TRENDS VACANCY & NET ABSORPTION ECONOMIC STATS
 LOS ANGELES NORTH OFFICE FOURTH QUARTER 217 QUICK STATS Direct Vacancy 11.8% Overall Vacancy 12.5% Lease Rate FSG $2.75 Gross Absorption Under Construction MARKET TRENDS Current Quarter 1,6,941 SF 89,158
Investor Presentation December 2017
 Investor Presentation December 2017 Cautionary Statement This presentation includes statements concerning our expectations, beliefs, plans, objectives, goals, strategies, future events or performance and
Metro Phoenix Retail, Office & Industrial Recovery
 Metro Phoenix Retail, Office & Industrial Recovery By Gary Ringel, CGREA, Director (480) 483-1170 ~ GaryR@hhcpa.com Statistics Indicate Decreased Vacancy Rates, Increased Lease Rates & Positive Absorption
TAMARAC SHOPPING CENTER DENVER, CO A RETAIL OPPORTUNITY IN THE HEART OF DENVER S CENTRAL SUBMARKET
 TAMARAC SHOPPING CENTER DENVER, CO A RETAIL OPPORTUNITY IN THE HEART OF DENVER S CENTRAL SUBMARKET E. HAMPDEN AVE (47,400 VPD) E X E C U T I V E S U M M A R Y S. TAMARAC DRIVE (14,300 VPD) Holliday, Fenoglio,
OFFICE QUICK STATS SUMMARY & OUTLOOK MARKET TRENDS VACANCY & NET ABSORPTION ECONOMIC STATS
 VENTURA COUNTY OFFICE THIRD QUARTER 217 QUICK STATS Direct Vacancy 13.9% Overall Vacancy 14.3% Lease Rate FSG $2.25 Gross Absorption Under Construction MARKET TRENDS Current Quarter 34,43 SF 18,112 SF
Market Report Q ///////// Los Angeles Industrial. ///////////////L o s A n g e l e s /////////////
 ///////////////L o s A n g e l e s ///////////// ///////////O r a n g e C o u n t y /////////// ////////////V e n t u r a ///////////////// ////////// I n l a n d E m p i r e //////////// Market Report
SOUTHERN CALIFORNIA INDUSTRIAL Prepared for NCREIF
 SOUTHERN CALIFORNIA INDUSTRIAL Prepared for NCREIF Prepared by: Barbara Emmons Perrier Vice Chairman (213) 613-3033 Barbara.Perrier@cbre.com NATIONAL FUNDAMENTAL SUMMARY Industrial market conditions will
>> Construction Boom Continues Into 2016
 Research & Forecast Report GREATER L.A. INDUSTRIAL Accelerating success. >> Construction Boom Continues Into 2016 Key Takeaways > The Greater Los Angeles Basin industrial market delivered 6,099,400 SF
The CoStar Office Report
 DCN:6155 The CoStar Office Report T H I R D Q U A R T E R 2 0 0 4 National Office Market Table of Contents Table of Contents.................................................................... A Methodology........................................................................
Houston s industrial leasing activity decreases 42.7% over the quarter - vacancy rate remains under 5.0%
 Research & Forecast Report HOUSTON INDUSTRIAL Q3 2015 Houston s industrial leasing activity decreases 42.7% over the quarter - vacancy rate remains under 5.0% Lisa Bridges Director of Market Research Houston
MARKET UPDATE Q4 2018
 THE KLABIN COMPANY MARKET UPDATE Q4 2018 SOUTH BAY LOS ANGELES THE KLABIN COMPANY KLABIN.COM A TRADITION OF TRUST HOT TOPICS 1 Full Employment 2 Falling Interest Rates 3 Trade War 4 Lack of Supply 5 Credit
CoStar Office Statistics. T h i r d Q u a r t e r Phoenix Office Market
 CoStar Office Statistics T h i r d Q u a r t e r 2 0 1 7 Third Quarter 2017 Phoenix Table of Contents Table of Contents................................................................. A Methodology......................................................................
Economic growth driving tighter market conditions
 Metro Philadelphia Industrial, 217 Economic growth driving tighter market conditions Net Absorption 1.8 Million sq. ft. Vacancy Rate 5.4% Asking Lease Rate (NNN) $4.35 Development 2.2 Million sq. ft. Figure
The CoStar Office Report. F i r s t Q u a r t e r Phoenix Office Market
 The CoStar Office Report F i r s t Q u a r t e r 2 0 1 6 First Quarter 2016 Phoenix Table of Contents Table of Contents................................................................. A Methodology......................................................................
>What constitutes a. Big Box Vacancy Decreases for First Time in Two Years. CHICAGO BIG BOX First Quarter Research & Forecast Report
 Research & Forecast Report CHICAGO BIG BOX First Quarter 018 Big Box Vacancy Decreases for First Time in Two Years Craig Hurvitz Vice President Chicago The vacancy rate for the Chicago market s big box
Vacancy Net Absorption Construction Rental Rate. Vacancy Rate 2.5% Change from Q2 17 (Basis Points) +30 BPS. GLA Industrial Market.
 +30 BPS. GLA Industrial Market.") Q4 2017 Forecast Vacancy Net Absorption Construction Rental Rate Vacancy Rate 2.5% Change from Q2 17 (Basis Points) +30 BPS Net Absorption 4,787,900 SF Construction Completions 11,127,200 SF Under Construction
Q4 2017 Forecast Vacancy Net Absorption Construction Rental Rate Vacancy Rate 2.5% Change from Q2 17 (Basis Points) +30 BPS Net Absorption 4,787,900 SF Construction Completions 11,127,200 SF Under Construction
Cost of Doing Business Peoria, Arizona
 Cost of Doing Business Peoria, Arizona Prepared for: City of Peoria February 2016 Prepared by: Elliott D. Pollack & Company 7505 East 6 th Avenue, Suite 100 Scottsdale, Arizona 85251 Table of Contents
Industrial Real Estate Portfolio
 Industrial Real Estate Portfolio Portfolio Coverage Page 7 6565 Echo Avenue, Reno, NV Property Summary Address: Size (SF): Office Finish: HVAC Space: Year Built: 2003 Site Area: 6565 Echo Avenue Reno,
TEMPE REDEVELOPMENT OPPORTUNITY
 TEMPE REDEVELOPMENT OPPORTUNITY CONFIDENTIALITY AND DISCLAIMER: The information contained in the following offering memorandum is proprietary and strictly confidential. It is intended to be reviewed only
First Quarter 2017 Industrial Market Report. Chicago. Economic Overview
 Chicago Market Facts 5.3% Chicago s unemployment rate continued to trend downward. Recorded at 5.3% as of February 2017. 17 MSF The number of completed projects increased to 5.1 msf and projects currently
FREESTANDING OLD TOWN SCOTTSDALE OFFICE BUILDING FOR SALE
 FREESTANDING OLD TOWN SCOTTSDALE OFFICE BUILDING FOR SALE 7447 E. EARLL DRIVE SCOTTSDALE, AZ 85251 GEOFF TURBOW 480.294.6019 gturbow@levrose.com ZAK KOTTLER 480.294.6003 zkottler@levrose.com JOE COSGROVE
>> Negative Net Absorption Despite Completions
 Research & Forecast Report MID-COUNTIES INDUSTRIAL Accelerating success. >> Negative Net Absorption Despite Completions Key Takeaways > This quarter, 542,000 square feet of industrial space finished construction,
Market Report Q ///////// Orange County Industrial. ///////////////L o s A n g e l e s /////////////
 ///////////////L o s A n g e l e s ///////////// ///////////O r a n g e C o u n t y /////////// ////////////V e n t u r a ///////////////// ////////// I n l a n d E m p i r e //////////// Market Report
Houston s Industrial Market 2013 YTD Positive Net Absorption Reaches 4.5M SF Houston
 Q3 2013 INDUSTRIAL MARKET HOUSTON INDUSTRIAL MARKET RESEARCH & FORECAST REPORT Houston s Industrial Market 2013 YTD Positive Net Absorption Reaches 4.5M SF Houston HOUSTON INDUSTRIAL MARKET INDICATORS
Q Market Report
 ///////////////L o s A n g e l e s ///////////// ///////////O r a n g e C o u n t y /////////// ////////////V e n t u r a ///////////////// ////////// I n l a n d E m p i r e //////////// Market Report
MAR KET GLANCE SAN DIEGO OFFICE MARKET REPORT PROPERTY SERVICES DEVELOPMENT INVESTMENT FOURTH QUARTER 2015 PROPERTY SERVICES DEVELOPMENT INVESTMENT
 AT A SAN DIEGO OFFICE MARKET REPORT FOURTH QUARTER 215 AT A NEW SUPPLY PUSHES VACANCY RATES HIGHER San Diego s regional economy has been buzzing and added a net total of 37,8 jobs in the 12 months ending
$3,575,000 UNIQUE PURCHASE OPPORTUNITY 1407 TRUMAN STREET SAN FERNANDO, CA
 UNIQUE PURCHASE OPPORTUNITY NEWER CONSTRUCTION HIGH IMAGE CLASS A COLD STORAGE IN-FILL LOCATION IN SAN FERNANDO VALLEY, CA $3,575,000 TRUMAN STREET WORKMAN STREET 16,971 Square Feet Class A Building Strategic
Market Report Q ///////// Los Angeles Industrial. ///////////////L o s A n g e l e s /////////////
 ///////////////L o s A n g e l e s ///////////// ///////////O r a n g e C o u n t y /////////// ////////////V e n t u r a ///////////////// ////////// I n l a n d E m p i r e //////////// Market Report
MARKET WATCH. Market Highlights. Select Sitar Transactions 3Q Economic Indicators. Third Quarter
 MARKET WATCH Third Quarter 2015 Market Highlights Office Total Inventory 362,117,388 SF Total Vacancy Rate 14.20% Average Rate $23.84 PSF YTD Net Absorption 2,217,424 SF Industrial Total Inventory 804,336,981
FOR SALE OR LEASE. Office Condominium 8151 E. INDIAN BEND ROAD SCOTTSDALE, ARIZONA. Located in Central Scottsdale
 FOR SALE OR LEASE Office Condominium 8151 E. INDIAN BEND ROAD SCOTTSDALE, ARIZONA Located in Central Scottsdale Table of Contents PROPERTY SUMMARY... 3-4 PROPERTY OVERVIEW... 5-8 AREA OVERVIEW... 9 EXPENSES...
PARK І PLACE SCALABLE VALUE-ADD / REDEVELOPMENT OPPORTUNITY RARELY AVAILABLE IN A SUPPLY-CONSTRAINED COMMERCIAL CORRIDOR CHICAGO MSA (PALATINE, IL)
") SCALABLE VALUE-ADD / REDEVELOPMENT OPPORTUNITY RARELY AVAILABLE IN A SUPPLY-CONSTRAINED COMMERCIAL CORRIDOR PARK І PLACE CHICAGO MSA (PALATINE, IL) Holliday Fenoglio Fowler, L.P. ( HFF ) an Illinois licensed
SCALABLE VALUE-ADD / REDEVELOPMENT OPPORTUNITY RARELY AVAILABLE IN A SUPPLY-CONSTRAINED COMMERCIAL CORRIDOR PARK І PLACE CHICAGO MSA (PALATINE, IL) Holliday Fenoglio Fowler, L.P. ( HFF ) an Illinois licensed
>> Asking Rents Increase As Space Remains Limited
 Research & Forecast Report MID-COUNTIES INDUSTRIAL Accelerating success. >> Asking Rents Increase As Space Remains Limited Key Takeaways > Average asking rents increased $0.02 Per Square Foot (P) Triple
6200 & 6240 BOX SPRINGS BLVD. RIVERSIDE, CA
 6200 & 6240 BOX SPRINGS BLVD. RIVERSIDE, CA HIGH IMAGE MULTI-TENANT INDUSTRIAL PARK 100% LEASED INDUSTRIAL INVESTMENT BUILDINGS TOTALING ±35,000 SQ.FT Multi-Tenant LOCATION OVERVIEW RIVERSIDE COUNTY RIVERISDE
CALUMET BUSINESS CENTER
 CALUMET BUSINESS CENTER O F F E R I N G S U M M A R Y Twelve Industrial Buildings Totaling 2,070,579 Square Feet Currently 93% Occupied Direct Class I Rail Service Majority of Space Controlled by Credit
SOUTHERN CALIFORNIA NORTHERN CALIFORNIA ARIZONA
 SOUTHERN CALIFORNIA NORTHERN CALIFORNIA ARIZONA WANT BEST IN CLASS? WELCOME TO RIVERROCK. PROPERTY MANAGEMENT WITH RESULTS. RiverRock Real Estate Group is a privately owned, clientcentric property and
DUAL GROCERY-ANCHORED COMMUNITY SHOPPING CENTER IN SAN DIEGO (CHULA VISTA), CA
, CA") DUAL GROCERY-ANCHORED COMMUNITY SHOPPING CENTER IN SAN DIEGO (CHULA VISTA), CA GATEWAY MARKETPLACE THE OPPORTUNITY HFF has been exclusively retained by Ownership to offer qualified investors the exciting
DUAL GROCERY-ANCHORED COMMUNITY SHOPPING CENTER IN SAN DIEGO (CHULA VISTA), CA GATEWAY MARKETPLACE THE OPPORTUNITY HFF has been exclusively retained by Ownership to offer qualified investors the exciting
Office Market Analysis & Forecast Peoria, Arizona
 Office Market Analysis & Forecast Peoria, Arizona Prepared for: City of Peoria August 2015 Prepared by: Elliott D. Pollack & Company 7505 East 6 th Avenue, Suite 100 Scottsdale, Arizona 85251 Table of
A 100% Leased 123,532 SF Industrial Business Park Investment Offering LONG BEACH BUSINESS PARK
 A 100% Leased 123,532 SF Industrial Business Park Investment Offering LONG BEACH 700-806 W. 14TH STREET & 701-733 W. ANAHEIM STREET, LONG BEACH, CA LONG BEACH THE OFFERING NKF Capital Markets is pleased
Industrial Outlook. An in-depth look at the Louisville industrial market. Analysis includes leasing, sales, construction and employment.
 Industrial Outlook Louisville An in-depth look at the Louisville industrial market. Analysis includes leasing, sales, construction and employment. JLL Research Insight Industrial market quick out of the
INVESTMENT HIGHLIGHTS
 2 3 INVESTMENT HIGHLIGHTS AFFLUENT AND DENSE TRADE AREA Ideally located within a trade area where average household incomes exceed $121,600 and over 20,500 residents are located within a 1-mile radius
The CoStar Industrial Report. M i d - Y e a r Chicago Industrial Market
 The CoStar Industrial Report M i d - Y e a r 2 0 1 6 Mid-Year 2016 Chicago Table of Contents Table of Contents................................................................. A Methodology......................................................................
NNN LEASED INVESTMENT OR OWNER/USER OPPORTUNITY
 NNN LEASED INVESTMENT OR OWNER/USER OPPORTUNITY 4244 N. 19TH AVENUE PHOENIX, AZ 85015 Jonathan Levy Advisor 480.425.5538 jonathan.levy@svn.com SVN DESERT COMMERCIAL ADVISORS 5343 N. 16TH STREET, SUITE
Americas Office Trends Report
 AMERICAS OFFICE TRENDS REPORT Americas Office Trends Report Summary The overall national office market recovery slowed slightly in the first quarter of 2016 amid financial market volatility. However, as
Naturally Occurring Affordable Housing
 Naturally Occurring Affordable Housing NAAHL Annual Conference December 1, 2016 page 1 Slicing And Dicing Rental Housing U.S. Rental Housing Inventory By Units Rent Subsidized 3.3 Million 8% Market Rate
245 W. Lodge Drive Tempe, AZ 85283
 245 W. Lodge Drive Tempe, AZ 85283 Prepared For: Kevin Czerwinski Nicholaus Fischer Prepared By: Stein Koss, SIOR skoss@leearizona.com 602.912.3520 & Tom Louer, SIOR tlouer@leearizona.com 602.954.3779
7 YEAR NNN LEASE INVESTMENT OPPORTUNITY
 FOR SALE 7 YEAR NNN LEASE INVESTMENT OPPORTUNITY 714 E. ROSE LANE PHOENIX, AZ 85014 WORLDWIDE REAL ESTATE SERVICES SUMMARY THE OFFERING ASKING PRICE $1,760,714 PRICE PSF $207/PSF NOI - ANNUAL $119,000
Available Retail - Greater Phoenix
 East Valley Plaza 00 N Arizona Ave Chandler, AZ 855 Prime owner/user or redevelopment opportunity with C- 3 zoning and excellent visibility to Arizona Avenue. Building SQFT: 40,75 Year Built: 986 $3,000,000
U.S. Economic and Institutional Apartment Market Overview and Outlook. January 7, 2015
 U.S. Economic and Institutional Apartment Market Overview and Outlook January 7, 2015 Emerging Economic Trends Inflation Adjusted Crude Oil Prices In Alignment with Long-Term Average Price per Barrel (Nov.
Town Council Study Session
 Town Council Study Session Success of Local Business: Main Streets and the Housing Connection January 17, 2018 Study Session Oro Valley s Future Economic Development, Main Streets and Housing Market Study
NEW CLASS A INDUSTRIAL MANUFACTURING CAMPUS
 Placentia Ave W Placentia Ave 215 NEW CLASS A E Rider St N Perris Blvd W Rider St PERRIS COMMERCE CENTER FOR SALE OR LEASE NEW +/- 7,755 SQ. FT. BUILDING DON ARCHER VICE PRESIDENT 909 243 7600 TEL 714
PERRIS CIRCLE INDUSTRIAL PARK #1 290 MARKHAM STREET PERRIS, CA
 PERRIS CIRCLE INDUSTRIAL PARK #1 290 MARKHAM STREET PERRIS, CA W. MARKHAM STREET PROPERTY SUMMARY PROPERTY DESCRIPTION ADDRESS: SUBMARKET: ACRES: 290 Markham Street Perris, CA Inland Empire East 24.26
LAS COLINAS 96.8 ACRES RESIDENTIAL LAND AVAILABLE FOR SALE
 STATE STREET RAMONA EXPRESSWAY LAS COLINAS 96.8 ACRES RESIDENTIAL LAND AVAILABLE FOR SALE LAS COLINAS 1. EXECUTIVE SUMMARY 2. PROPERTY INFORMATION TABLE OF CONTENTS 3. LOCATION INFORMATION 4. CONTACT INFORMATION
The CoStar Industrial Report. F i r s t Q u a r t e r Chicago Industrial Market
 The CoStar Industrial Report F i r s t Q u a r t e r 2 0 1 6 First Quarter 2016 Chicago Table of Contents Table of Contents................................................................. A Methodology......................................................................
The CoStar Industrial Report
 The CoStar Industrial Report F I R S T Q U A R T E R 2 0 1 4 FIRST QUARTER 2014 DALLAS/FT. WORTH Table of Contents Table of Contents....................................................................
O N C O R I N T E R N A T I O N A L
 SPOTLIGHT ON FIVE INVESTMENT SALES LARGE INDUSTRIAL, RESIDENTIAL, OFFICE & RETAIL PROPERTIES SOLD PAGE 2 PAGE 3 5 DAUM Commercial Real Estate Services Since 1904 INVESTMENT SERVICES Group Addressing the
HOUSTON INDUSTRIAL MARKET
 REAL ESTATE OUTLOOK HOUSTON INDUSTRIAL MARKET FIRST QUARTER 217 Industrial Sector Continues Push Forward Flex Market Softening under Pressure from Office Market Availability OV E R V I E W Industrial gains
Positioned for Performance. j u n e Fine Arts Building Berkeley, CA
 Positioned for Performance j u n e 2009 Fine Arts Building Berkeley, CA Trump Place New York, NY 180 Riverside Equity Residential has a portfolio of high-quality assets focused in high-growth markets where
A 205,800 SQUARE FOOT INSTITUTIONAL-QUALITY INDUSTRIAL FACILITY 100% LEASED TO THREE INVESTMENT GRADE CREDIT AND INTERNATIONAL COMPANIES
 Otay Mesa, San Diego Southern California A 205,800 SQUARE FOOT INSTITUTIONAL-QUALITY INDUSTRIAL FACILITY 100% LEASED TO THREE INVESTMENT GRADE CREDIT AND INTERNATIONAL COMPANIES Holliday Fenoglio Fowler,
DCT INDUSTRIAL TRUST REPORTS FOURTH QUARTER AND FULL-YEAR 2017 RESULTS. Net Earnings of $0.22 per Diluted Share in Q4; $1.11 per Diluted Share in 2017
 Press Release FOR IMMEDIATE RELEASE: DCT INDUSTRIAL TRUST REPORTS FOURTH QUARTER AND FULL-YEAR 2017 RESULTS Net Earnings of $0.22 per Diluted Share in Q4; $1.11 per Diluted Share in 2017 FFO, as adjusted,
Pharma leasing boosts market, net absorption soars
 MARKETVIEW New Jersey Office, Q3 218 Pharma leasing boosts market, net absorption soars Leasing Activity 1.77 MSF Net Absorption Availability Rate 997,93 SF Average Asking Lease Rate 2.5% $26.34 PSF *Arrows
CoStar Office Statistics. Y e a r - E n d Portland Office Market
 CoStar Office Statistics Y e a r - E n d 2 0 1 7 Year-End 2017 Portland Table of Contents Table of Contents................................................................. A Methodology......................................................................
Phoenix Real Estate Outlook. May 2015
 Phoenix Real Estate Outlook May 2015 General Economy 2 Arizona & US Nonfarm Employment YTY % Change 240,600 jobs lost 208,400 jobs gained (87%) Source: ADOA 3 Arizona Jobs Regained Since Bottom of Cycle