Description of IHS Hedonic Data Set and Model Developed for PUMA Area Price Index
|
|
|
- Maurice Lamb
- 5 years ago
- Views:
Transcription
1 MAY 2015 Description of IHS Hedonic Data Set and Model Developed for PUMA Area Price Index Introduction Understanding and measuring house price trends in small geographic areas has been one of the most challenging, but important topics in housing research recently. As national and metropolitan arealevel housing markets emerge from the housing downturn, many neighborhoods within those broader geographies have not fully benefitted from this recovery. Being able to measure house price changes in small geographic areas can help housing market stakeholders and policy makers understand which neighborhoods are improving and which continue to struggle so they can make strategic decisions about policy development and implementation. The following technical paper lays out the methodology used to develop IHS s Cook County Submarket Price Index which is based on a hedonic price model tracking price trends for single family homes. 1»
2 Background - Measuring House Prices There are three common methods for measuring house prices and price trends. Each has inherent strengths and limitations, particularly when applied to smaller geographies. These methods include:»» Median sales price This method looks at all sales taking place in a given geography for a given period of time and tracks the median value of those sales over time. The primary strengths of this method are 1) that data on sales activity and prices are often easily available through local deed transfer recordings or multiple listing services and 2) finding the median is a fairly straightforward and simple calculation. For these reasons, trends in median sales prices are often used by local realtor groups or the media to discuss area house price and trends. The main limitation of this method is that there is no way to control for changes in the underlying composition of properties selling at any two points in time. This has the potential to create apples to oranges price comparisons if there are large differences in the mix of the size and quality of properties selling at two points in time. This can be particularly impactful when sample sizes are small such as in small geographic areas.»» Repeat sales index Repeat sales indices take the sales activity on a property at two points in time and measures the change in value over that period. The change is weighted based on the length of time between the two sales, and the average change in sales prices for all properties in a sample are calculated and indexed to an earlier point in time, often the first quarter of The repeat sales index is an improvement over median sales price in many ways. By only tracking price changes for properties that sell multiple times, a repeat sales index is better able to ensure that the price change being measured is for properties with the same characteristics. Repeat sales indices also have limitations, however. Most importantly, because the sample uses only properties that sell at least twice, it is often difficult to get a large enough sample of property sales for a given period to measure price trends in a small geographic area. Case Shiller is the best known repeat sales index, and it tracks price trends nationally for a group of large metropolitan areas. Using a similar methodology, the Institute for Housing Studies has a Cook County House Price Index that tracks price changes in Cook County and in very large submarket areas.»» Hedonic price index Hedonic price indices combine information on property s sales price with data on the characteristics of that individual property and its location and controls for factors that might affect the sales price of a house. A hedonic model tells you how much influence those individual factors have on sale prices, and, by isolating the effect of those variables on price, allows for the development of an index tracking price changes over a period of time on properties with similar characteristics. Hedonic price models are an improvement over repeat sales models because they include data on a far larger group of sales in a given period of time for a geography, not just those with previous sales. This allows for a larger sample in smaller geographic areas while still controlling for the characteristics and location of the properties being sold in a given period. While hedonic price index models have many advantages, there are also limitations. Hedonic indices require extensive amount of data on property characteristics and location, and developing such a data set is complex and can have extensive upfront costs. Additionally, hedonic models are the most statistically sophisticated of the three methods of tracking housing prices and require significant expertise to develop and extensive testing and monitoring to ensure accuracy. 2»
3 IHS Hedonic House Price Index Because of its advantages in tracking small area price trends, IHS developed a hedonic price index to track price changes in smaller geographies. The Institute has adapted this model to track changes in single family house prices in Cook County submarket areas defined by Census Public Use Microdata Areas (PUMAs). PUMA areas contain at least 100,000 people and are built up out of census tracts. There are 17 submarkets in the City of Chicago and 17 that are primarily in suburban Cook County. In the City of Chicago, the submarket surrounding the Loop has been excluded because of insufficient levels of single family home sales. Figure 1 displays all submarkets. The following sections lay out the data used, variables developed, and the hedonic model used: Data and Methodology A review of existing literature on hedonic models was used to identify a core set of variables related to which property and location characteristics significantly influence house price. Figure 2 highlights variables included in the IHS hedonic model. These data include:»» Sales price - Data on single family sales activity was taken from two sources, 1) property transfer records the Cook County Recorder of Deeds via Property Insight and 2) sales records from Midwest Real Estate Data (MRED), the northwest Illinois Multiple Listing Service (MLS).»» Property characteristics To identify key physical characteristics of properties such as the building structure, square feet, number of bathrooms and bedroom, age of the building, data from the Cook County Assessor and the northwest Illinois MLS were used.»» Location - Geographic variables were calculated using ArcGIS software. These variables include distance from properties to Chicago Transit Authority (CTA) rail stations, to Lake Michigan, to any type of publiclyaccessible open space, to Metra rail stations, and to a lake or river other than Lake Michigan. Spatial data for parcels is obtained annually by IHS from the Cook County Assessor. Distances to CTA and Metra rail stations were calculated by joining the Cook County road network from the Cook County Data Portal and CTA and Metra rail station locations obtained from the City of Chicago Data Portal. Lake Michigan, publicly-accessible open space, and lakes and rivers other than Lake Michigan come from the Chicago Metropolitan Agency for Planning (CMAPs) land use file for 2005.»» Distressed sales - Properties that were likely distressed sales were also flagged. This includes properties identified as short sales, sales at foreclosure auction, and sales occurring after a property entered bank real estate owned (REO) status. Foreclosure distressed status was determined by identifying the date of a foreclosure filing on a property and tracking subsequent transaction activity. These data come from the Cook County Clerk of the Court and Cook County Recorder of Deeds via Property Insight.»» Fixed Effects - All results are controlled by the fixed effect of geographical area (Census Tract) and time of sales (year and quarter). 3»
4 Reference Map of Cook County Housing Submarkets FIGURE 1 COOK COUNTY SUBURBS Number* Submarket 3401 Palatine/Barrington 3407 Melrose Park/Maywood 3408 Oak Park/Cicero 3409 LaGrange/Burbank 3410 Orland Park/Lemont 3411 Oak Lawn/Blue Island 3412 Oak Forest/Country Club Hills 3413 Calumet City/Harvey 3414 Chicago Heights/Park Forest 3415 Arlington Heights/Wheeling 3416 Winnetka/Northbrook 3417 Hoffman Estates/Streamwood 3418 Schaumburg 3419 Mount Prospect/Elk Grove Village 3420ª Park Ridge/Des Plaines 3421 Evanston/Skokie 3422ª Elmwood Park/Franklin Park CITY OF CHICAGO Number* Submarket 3501 Uptown/Rogers Park 3502 Lake View/Lincoln Park 3503 Lincoln Square/North Center 3504 Irving Park/Albany Park 3520 Portage Park/Jefferson Park 3521 Austin/Belmont Cragin 3522 Logan Square/Avondale 3523 Humboldt Park/Garfield Park 3524 West Town/Near West Side 3525 Loop and Surrounding 3526 Bridgeport/Brighton Park 3527 Gage Park/West Lawn 3528 Englewood/Greater Grand Crossing 3529 Bronzeville/Hyde Park 3530 Beverly/Morgan Park 3531 Auburn Gresham/Chatham 3532 South Chicago/West Pullman 4» City of Chicago *The listed numbers refer to the codes of the 2010 Census PUMAs upon which the listed housing submarkets are based. ªPUMAs 3420 and 3422 include parts of the City of Chicago.

5 Figure 2) Descirptions of Variables 5»

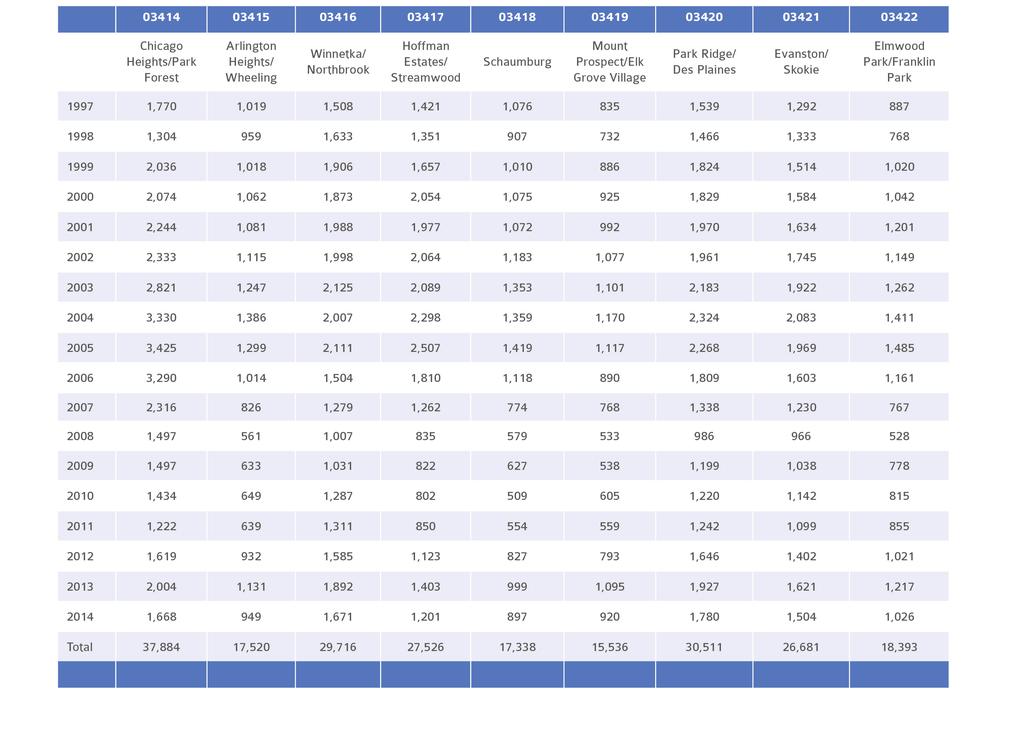
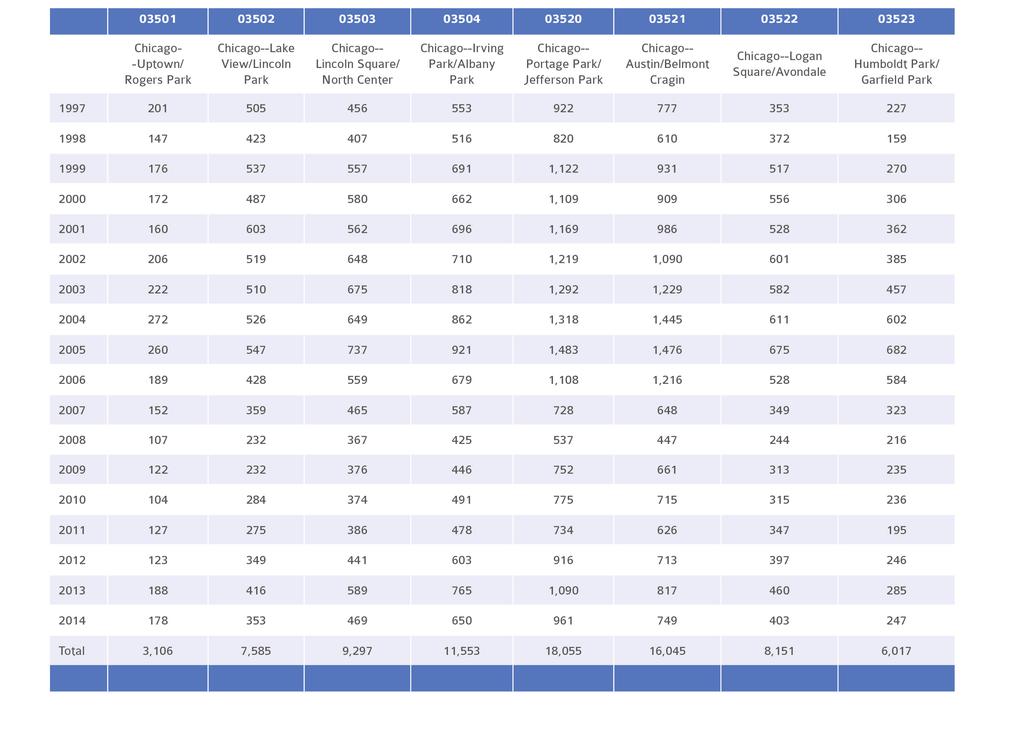
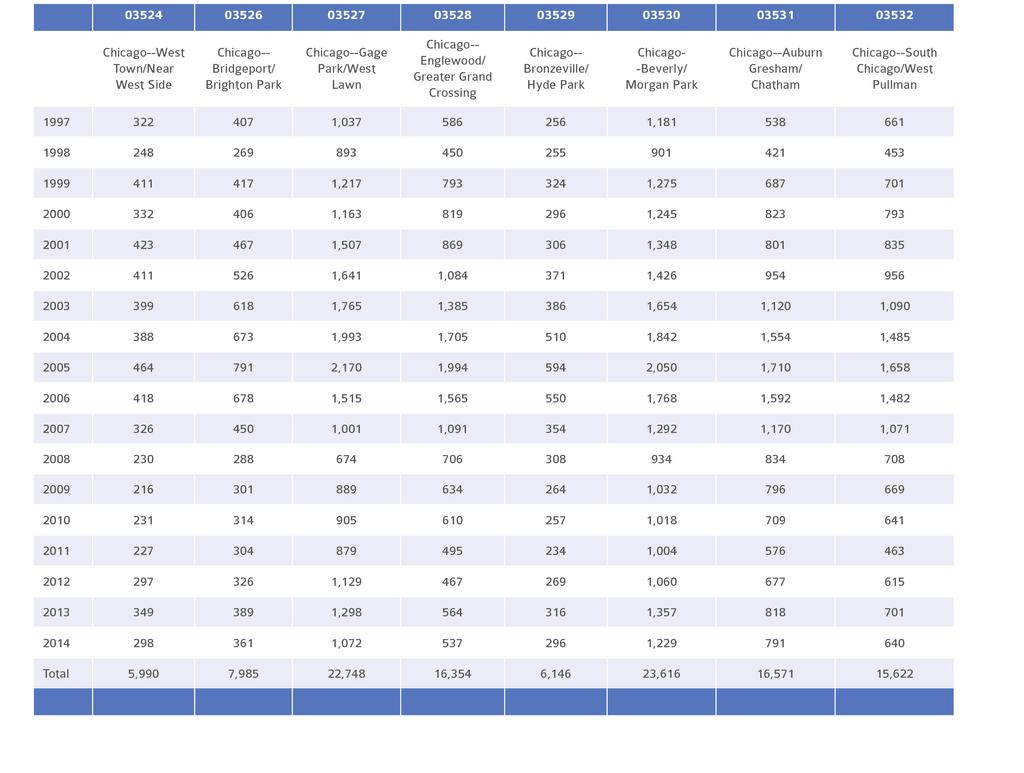
6 Building a final data set for the base hedonic model required creating a large master data set. To start, there were 833,821 detached single family property transactions recorded in Cook County from 1997 to the fourth quarter of Hedonic variables were constructed for each property using methodologies described above. Properties where transactions repeated within 90 days were excluded to avoid any potential recording errors and to reduce potential bias in the index due to frequently traded properties. Additionally, transactions were dropped if there was found to be substantial missing information on essential property characteristics such as the number of bedrooms, existence of an air conditioning system, or because of errors such as missing property identification numbers, or conflicting sales price information. The overall sample rate is 75.7 percent for the entire sample periods of 1997 to 2014, and Figure 3 shows the annual total number of valid observations included in the IHS hedonic model data set is 631,589. The valid sample rate is substantially higher starting in 2009 where over 86 percent of transactions match hedonic variables in each year. Figure 3) Cook County Single Family Sample Data with Hedonic Variables 6»
7 Calibrating the Small Area Index Even in a hedonic model, a sufficient sample size is required to consistently and accurately track price trends. While a sample size of 631,589 records is sufficient to produce a quarterly hedonic house price index for the entire Chicago area, large variation in levels of transaction activity made it challenging to produce quarterly updates for small geographies. To compensate for declining transaction volume and the lower number of transaction in small geographies, a rolling sample method with a 365 day window was adopted. This means that in addition to data from the current quarter, sales data from the previous three quarters were also included. Additional data from previous quarters helps smooth out the volatile nature of transaction activity in small areas from quarter to quarter. Due to the lack of single family houses in Chicago downtown area, PUMA 3525 is excluded. Valid sample sizes for all other submarket areas from 1997 to 2014 can be found in Appendix A. Sample sizes are much smaller for submarkets in the City of Chicago compared to those in Suburban Cook County. This is due to the more diverse housing stock found in many Chicago neighborhoods which include both small and large multi-unit rental properties and condominium units which are not included in this hedonic model. All PUMAs included had large enough valid samples of single family sales to produce stable trends. Results of the Model The results of the hedonic models for Cook County, Chicago, and suburban Cook are shown in Figure 5. The results for most of the individual independent variables are statistically significant and the magnitude and direction of their effect on house prices are consistent with expectations. The results are also largely consistent across geographic regions of Cook County. The r-square for all three models is roughly.77, which indicates the included control variables explain the house price variation strongly. R-squared results for individual submarket areas are not shown, but they are at acceptable levels ranging from 0.53 to »

8 Figure 5) Hedonic Regression by Geographic Area, 1997Q1-2014Q3 8»

9 9» All results are controlled by the fixed effect of geographical area (Census Tract) and time of sales (year and quarter). All t-statistics are calculated using heteroskedasticity corrected robust standard errors * : 10 %, **: 5%, ***: 1% significant
10 Interestingly, the distressed sale dummy variable returns highly significant results. The coefficients are very stable for the three geographic regions ranging from in suburban Cook to in the City of Chicago. Another way to state this would be assuming a median sale price of $187,500, the impact of a distressed sale would drop the price to $100,161 in the City of Chicago or to $110,032 in suburban Cook County. This means the value of a distressed property will be depreciated by 41 to 47 percent compared with a non-distressed property, respectively. The interactive dummy variable of distress sale by year after 2007 show the significant from log of -0.3 to By controlling these annul distressed sales, we are able to calculate the general price changes after the financial crisis. Without the distressed dummy variables, there might be downward bias on the general house price trend due to relatively high concentrated distressed sales after 2007, particularly in certain areas with high levels of distressed sales. For example, if a community has higher level of distresses sales while housing turnover rate relative low, the transactions from the distresses sales will be over-represented in the price index and that will create downward bias in overall price trends. The results of the Cook County-wide hedonic model are generally consistent with those found in other price index models for Cook County. Figure 6 compares quarterly price trends in Cook County calculated by this hedonic price index and IHS s Cook County House Price Index which is calculated using a repeat sales methodology. As the figure shows, the direction of quarterly price changes are generally consistent for the hedonic and repeat sales indices. The hedonic index shows a more substantial price build up leading to the market peak in 2007, but after the market collapse in 2008, price trends for the hedonic and repeat sales models track fairly closely. One possible explanation for why the hedonic model saw greater price increases leading to the market peak is that it includes all property sales, including new properties which may be of higher quality. Because a newly constructed property only counts as one transaction (and doesn t yet have a repeat sale) it is not captured in the repeat sales index which only tracks sales of existing, older properties. Figure 6) Comparison of Cook County Repeat and Hedonic Price Index Results 10»

11 Similarly to how results from the hedonic model can be converted to track changes in house prices countywide, they can also be converted to track price changes at the submarket level. The estimated average price level at time t on the condition of all control variables was used to build hedonic price index. To create a relative measurement compare to other time. The trend lines for all submarkets can be seen in Figure 7. Figure 7) Hedonic House Price Index by Cook County Submarket, »

12 12 I N S T I T U T E F O R H O U S I N G S T U D I E S AT D E P A U L U N I V E R S I T Y»

13 APPENDIX A 13»
14 14»
15 15»
16 16»
Technical Description of the Freddie Mac House Price Index
 Technical Description of the Freddie Mac House Price Index 1. Introduction Freddie Mac publishes the monthly index values of the Freddie Mac House Price Index (FMHPI SM ) each quarter. Index values are
IHS Regional Housing Market Segmentation Analysis
 REPORT IHS Regional Housing Market Segmentation Analysis June, 2017 INSTITUTE FOR HOUSING STUDIES AT DEPAUL UNIVERSITY HOUSINGSTUDIES.ORG IHS Regional Housing Market Segmentation Analysis June 2017 Using
An Introduction to RPX INTRODUCTION
 An Introduction to RPX INTRODUCTION Radar Logic is a real estate information company based in New York. We convert public residential closing data into information about the state and prospects for the
Regional Housing Trends
 Regional Housing Trends A Look at Price Aggregates Department of Economics University of Missouri at Saint Louis Email: rogerswil@umsl.edu January 27, 2011 Why are Housing Price Aggregates Important? Shelter
Residential September 2010
 Residential September 2010 Karl L. Guntermann Fred E. Taylor Professor of Real Estate Adam Nowak Research Associate For the first time since March, house prices turned down slightly in August (-2 percent)
Residential May Karl L. Guntermann Fred E. Taylor Professor of Real Estate. Adam Nowak Research Associate
 Residential May 2008 Karl L. Guntermann Fred E. Taylor Professor of Real Estate Adam Nowak Research Associate The use of repeat sales is the most reliable way to estimate price changes in the housing market
Cook County s Two-to-Four Unit Building Market
 PRESENTATION Cook County s Two-to-Four Unit Building Market Geoff Smith, Institute for Housing Studies at DePaul University Preservation Forum: The Two-to-Four Unit Rental Stock June 13, 2012 1 The Supply
Residential December 2009
 Residential December 2009 Karl L. Guntermann Fred E. Taylor Professor of Real Estate Adam Nowak Research Associate Year End Review The dramatic decline in Phoenix house prices caused by an unprecedented
Residential October 2009
 Residential October 2009 Karl L. Guntermann Fred E. Taylor Professor of Real Estate Adam Nowak Research Associate Summary The latest data for July 2009 reveals that house prices declined by 28 percent
Estimating User Accessibility Benefits with a Housing Sales Hedonic Model
 Estimating User Accessibility Benefits with a Housing Sales Hedonic Model Michael Reilly Metropolitan Transportation Commission mreilly@mtc.ca.gov March 31, 2016 Words: 1500 Tables: 2 @ 250 words each
How Did Foreclosures Affect Property Values in Georgia School Districts?
 Tulane Economics Working Paper Series How Did Foreclosures Affect Property Values in Georgia School Districts? James Alm Department of Economics Tulane University New Orleans, LA jalm@tulane.edu Robert
Estimating National Levels of Home Improvement and Repair Spending by Rental Property Owners
 Joint Center for Housing Studies Harvard University Estimating National Levels of Home Improvement and Repair Spending by Rental Property Owners Abbe Will October 2010 N10-2 2010 by Abbe Will. All rights
THE EFFECT OF PROXIMITY TO PUBLIC TRANSIT ON PROPERTY VALUES
 THE EFFECT OF PROXIMITY TO PUBLIC TRANSIT ON PROPERTY VALUES Public transit networks are essential to the functioning of a city. When purchasing a property, some buyers will try to get as close as possible
Cook County Assessor s Office: 2019 North Triad Assessment. Norwood Park Residential Assessment Narrative March 11, 2019
 Cook County Assessor s Office: 2019 North Triad Assessment Norwood Park Residential Assessment Narrative March 11, 2019 1 Norwood Park Residential Properties Executive Summary This is the current CCAO
Residential August 2009
 Residential August 2009 Karl L. Guntermann Fred E. Taylor Professor of Real Estate Adam Nowak Research Associate Summary The latest data for May 2009 reveals that house prices declined by 33 percent in
2013 Profile of Home Buyers and Sellers Metro Indianapolis Report
 Prepared for: Metro Indianapolis Board of REALTORS Prepared by: Research Division December 2013 Table of Contents Introduction... 2 Highlights... 3 Conclusion... 6 Methodology..7 Report Prepared by: Jessica
A. K. Alexandridis University of Kent. D. Karlis Athens University of Economics and Business. D. Papastamos Eurobank Property Services S.A.
 Real Estate Valuation And Forecasting In Nonhomogeneous Markets: A Case Study In Greece During The Financial Crisis A. K. Alexandridis University of Kent D. Karlis Athens University of Economics and Business.
Residential July 2010
 Residential July 2010 Karl L. Guntermann Fred E. Taylor Professor of Real Estate Adam Nowak Research Associate The Phoenix housing market overall continued to show gradual improvement through June but
Residential January 2009
 Residential January 2009 Karl L. Guntermann Fred E. Taylor Professor of Real Estate Adam Nowak Research Associate Methodology The use of repeat sales is the most reliable way to estimate price changes
Research Report Center for Real Estate and Asset Management College of Business Administration University of Nebraska at Omaha.
 Research Report Center for Real Estate and Asset Management College of Business Administration University of Nebraska at Omaha. January 30, 2019 Omaha Single Family Housing Prices (2000 to 2018): Historically
THE VALUE OF LEED HOMES IN THE TEXAS REAL ESTATE MARKET A STATISTICAL ANALYSIS OF RESALE PREMIUMS FOR GREEN CERTIFICATION
 THE VALUE OF LEED HOMES IN THE TEXAS REAL ESTATE MARKET A STATISTICAL ANALYSIS OF RESALE PREMIUMS FOR GREEN CERTIFICATION GREG HALLMAN SENIOR MANAGING DIRECTOR REAL ESTATE FINANCE AND INVESTMENT CENTER
Improving Median Housing Price Indexes through Stratification
 Improving Median Housing Price Indexes through Stratification Authors Nalini Prasad and Anthony Richards Abstract There is a trade-off between how easy a housing price series is to construct and the extent
City of Lonsdale Section Table of Contents
 City of Lonsdale City of Lonsdale Section Table of Contents Page Introduction Demographic Data Overview Population Estimates and Trends Population Projections Population by Age Household Estimates and
James Alm, Robert D. Buschman, and David L. Sjoquist In the wake of the housing market collapse
 istockphoto.com How Do Foreclosures Affect Property Values and Property Taxes? James Alm, Robert D. Buschman, and David L. Sjoquist In the wake of the housing market collapse and the Great Recession which
Using Hedonics to Create Land and Structure Price Indexes for the Ottawa Condominium Market
 Using Hedonics to Create Land and Structure Price Indexes for the Ottawa Condominium Market Kate Burnett Isaacs Statistics Canada May 21, 2015 Abstract: Statistics Canada is developing a New Condominium
Credit Constraints for Small Multifamily Rental Properties
 MARCH 2012 DEPAUL UNIVERSITY INSTITUTE FOR HOUSING STUDIES Research Brief Credit Constraints for Small Multifamily Rental Properties INTRODUCTION Small multifamily properties are critical to the supply
Residential December 2010
 Residential December 2010 Karl L. Guntermann Fred E. Taylor Professor of Real Estate Adam Nowak Research Associate I The preliminary data for November shows that housing prices declined for another month
REAL ESTATE MARKET OVERVIEW 1 st Half of 2015
 REAL ESTATE MARKET OVERVIEW 1 st Half of 2015 With Comparisons to the 2 nd Half of 2014 September 4, 2015 Prepared for: First Bank of Wyoming Prepared by: Ken Markert, AICP MMI Planning 2319 Davidson Ave.
Washington Market Highlights: Fourth Quarter 2017
 Washington State s Housing Market 4th Quarter 2017 Washington Market Highlights: Fourth Quarter 2017 Existing home sales declined in the fourth quarter by 0.2 percent to a seasonally adjusted annual rate
Minneapolis St. Paul Residential Real Estate Index
 University of St. Thomas Minneapolis St. Paul Residential Real Estate Index Welcome to the latest edition of the UST Minneapolis St. Paul Residential Real Estate Index. The University of St Thomas Residential
ESTIMATED FULL VALUE OF REAL PROPERTY IN COOK COUNTY:
 ESTIMATED FULL VALUE OF REAL PROPERTY IN COOK COUNTY: 2003-2012 August 14, 2014 ESTIMATED FULL VALUE OF PROPERTY IN COOK COUNTY: Civic Federation Methodology CALCULATION OF ESTIMATED FULL VALUE The full
HOME Survey. Housing Opportunities and Market Experience. June National Association of REALTORS Research Group
 HOME Survey Housing Opportunities and Market Experience June 2018 National Association of REALTORS Research Group Introduction The Housing Opportunities and Market Experience (HOME) report was created
Washington Market Highlights: Fourth Quarter 2018
 Washington State s Housing Market 4th Quarter 2018 Washington Market Highlights: Fourth Quarter 2018 Existing home sales fell in the fourth quarter by 2.7 percent to a seasonally adjusted annual rate of
Residential January 2010
 Residential January 2010 Karl L. Guntermann Fred E. Taylor Professor of Real Estate Adam Nowak Research Associate Another improvement to the ASU-RSI is introduced this month with new indices for foreclosure
Over the past several years, home value estimates have been an issue of
 abstract This article compares Zillow.com s estimates of home values and the actual sale prices of 2045 single-family residential properties sold in Arlington, Texas, in 2006. Zillow indicates that this
ONLINE APPENDIX "Foreclosures, House Prices, and the Real Economy" Atif Mian Amir Sufi Francesco Trebbi [NOT FOR PUBLICATION]
![ONLINE APPENDIX Foreclosures, House Prices, and the Real Economy Atif Mian Amir Sufi Francesco Trebbi [NOT FOR PUBLICATION]](/thumbs/76/73338213.jpg "ONLINE APPENDIX Foreclosures, House Prices, and the Real Economy Atif Mian Amir Sufi Francesco Trebbi [NOT FOR PUBLICATION]") ONLINE APPENDIX "Foreclosures, House Prices, and the Real Economy" Atif Mian Amir Sufi Francesco Trebbi [NOT FOR PUBLICATION] Appendix Figures 1 and 2: Other Measures of House Price Growth Appendix Figure
ONLINE APPENDIX "Foreclosures, House Prices, and the Real Economy" Atif Mian Amir Sufi Francesco Trebbi [NOT FOR PUBLICATION] Appendix Figures 1 and 2: Other Measures of House Price Growth Appendix Figure
Census Tract Data Analysis
 Data Analysis Study Area: s within the City of Evansville, Indiana Prepared For Mr. Kelley Coures City of Evansville Department of Metropolitan Development 1 NW MLK Jr. Boulevard Evansville, Indiana 47708
Market Segmentation: The Omaha Condominium Market
 Market Segmentation: The Omaha Condominium Market Roger P. Sindt Steven Shultz University of Nebraska at Omaha Introduction A highly visible and growing niche in the homeownership market is the condominium
2013 Profile of Home Buyers and Sellers Texas Report
 2013 Profile of Home Buyers and Sellers Report Prepared for: Association of REALTORS Prepared by: NATIONAL ASSOCIATION OF REALTORS Research Division December 2013 2013 Profile of Home Buyers and Sellers
ESTIMATED FULL VALUE OF REAL PROPERTY IN COOK COUNTY:
 ESTIMATED FULL VALUE OF REAL PROPERTY IN COOK COUNTY: 2007-2016 May 21, 2018 MAJOR FINDINGS This report provides an estimate of the full market value of property in Cook County between tax years 2007 and
Young-Adult Housing Demand Continues to Slide, But Young Homeowners Experience Vastly Improved Affordability
 Young-Adult Housing Demand Continues to Slide, But Young Homeowners Experience Vastly Improved Affordability September 3, 14 The bad news is that household formation and homeownership among young adults
RESIDENTIAL MARKET ANALYSIS
 RESIDENTIAL MARKET ANALYSIS EVAN ABRAMOWITZ Joseph Bernard Investment Real Estate Oregon Association of Realtors Student Fellow Masters of Real Estate Development Graduate Student National housing market
Re-sales Analyses - Lansink and MPAC
 Appendix G Re-sales Analyses - Lansink and MPAC Introduction Lansink Appraisal and Consulting released case studies on the impact of proximity to industrial wind turbines (IWTs) on sale prices for properties
Washington Market Highlights: Third Quarter 2018
 Washington State s Housing Market 3rd Quarter 2018 Washington Market Highlights: Third Quarter 2018 Existing home sales rose in the third quarter by 0.1 percent to a seasonally adjusted annual rate of
Appendix 1: Gisborne District Quarterly Market Indicators Report April National Policy Statement on Urban Development Capacity
 Appendix 1: Gisborne District Quarterly Market Indicators Report April 2018 National Policy Statement on Urban Development Capacity Quarterly Market Indicators Report April 2018 1 Executive Summary This
Residential March 2010
 Residential March 2010 Karl L. Guntermann Fred E. Taylor Professor of Real Estate Adam Nowak Research Associate The latest data for December 2009 reveals that overall house prices declined by 13 percent
A Quantitative Approach to Gentrification: Determinants of Gentrification in U.S. Cities,
 A Quantitative Approach to Gentrification: Determinants of Gentrification in U.S. Cities, 1970-2010 Richard W. Martin, Department of Insurance, Legal, Studies, and Real Estate, Terry College of Business,
Geographic Variations in Resale Housing Values Within a Metropolitan Area: An Example from Suburban Phoenix, Arizona
 INTRODUCTION Geographic Variations in Resale Housing Values Within a Metropolitan Area: An Example from Suburban Phoenix, Arizona Diane Whalley and William J. Lowell-Britt The average cost of single family
Housing Supply Restrictions Across the United States
 Housing Supply Restrictions Across the United States Relaxed building regulations can help labor flow and local economic growth. RAVEN E. SAKS LABOR MOBILITY IS the dominant mechanism through which local
Performance of the Private Rental Market in Northern Ireland
 Summary Research Report July - December Performance of the Private Rental Market in Northern Ireland Research Report July - December 1 Northern Ireland Rental Index: Issue No. 8 Disclaimer This report
Frequently Asked Questions: Residential Property Price Index
 CENTRAL BANK OF CYPRUS EUROSYSTEM Frequently Asked Questions: Residential Property Price Index 1. What is a Residential Property Price Index (RPPI)? An RPPI is an indicator which measures changes in the
2011 Profile of Home Buyers and Sellers Texas Report
 2011 Profile of Home and Sellers Report Prepared for: Association of REALTORS Prepared by: NATIONAL ASSOCIATION OF REALTORS Research Division December 2011 2011 Profile of Home and Sellers Report Table
Foreclosures Continue to Bring Home Prices Down * FNC releases Q Update of Market Distress and Foreclosure Discount
 Foreclosures Continue to Bring Home Prices Down * FNC releases Q4 2011 Update of Market Distress and Foreclosure Discount The latest FNC Residential Price Index (RPI), released Monday, indicates that U.S.
Land Use Impacts of BRT
 Land Use Impacts of BRT Commuter Choice Workshop BRT Session Part II January 18, 2012 Victoria Perk, Senior Research Associate Cheryl Thole, Senior Research Associate National Bus Rapid Transit Institute
2011 Profile of Home Buyers and Sellers New York Report
 2011 Profile of Home and Sellers Report Prepared for: Association of REALTORS Prepared by: NATIONAL ASSOCIATION OF REALTORS Research Division December 2011 2011 Profile of Home and Sellers Report Table
Volume Title: Well Worth Saving: How the New Deal Safeguarded Home Ownership
 This PDF is a selection from a published volume from the National Bureau of Economic Research Volume Title: Well Worth Saving: How the New Deal Safeguarded Home Ownership Volume Author/Editor: Price V.
Assessment Quality: Sales Ratio Analysis Update for Residential Properties in Indiana
 Center for Business and Economic Research About the Authors Dagney Faulk, PhD, is director of research and a research professor at Ball State CBER. Her research focuses on state and local tax policy and
Housing market and finance
 Housing market and finance Q: What is a market? A: Let s play a game Motivation THE APPLE MARKET The class is divided at random into two groups: buyers and sellers Rules: Buyers: Each buyer receives a
DATA FOR FEBRUARY Published March 20, Sales are up +19.6% month-over-month. The year-over-year comparison is down -7.3%.
 Permission is granted only to ARMLS Subscribers for reproduction with attribution on to ARMLS COPYRIGHT 2019. For questions regarding this publication contact Brand@ARMLS.com. DATA FOR FEBRUARY 2019 -
Kitchener-Cambridge-Waterloo and Guelph CMAs
 H o u s i n g M a r k e t I n f o r m a t i o n Housing Now Kitchener-Cambridge-Waterloo and Guelph CMAs C a n a d a M o r t g a g e a n d H o u s i n g C o r p o r a t i o n Date Released: Kitchener-Cambridge-Waterloo
Metro Boston Perfect Fit Parking Initiative
 Metro Boston Perfect Fit Parking Initiative Phase 1 Technical Memo Report by the Metropolitan Area Planning Council February 2017 1 About MAPC The Metropolitan Area Planning Council (MAPC) is the regional
AVM Validation. Evaluating AVM performance
 AVM Validation Evaluating AVM performance The responsible use of Automated Valuation Models in any application begins with a thorough understanding of the models performance in absolute and relative terms.
Effects of Zoning on Residential Option Value. Jonathan C. Young RESEARCH PAPER
 Effects of Zoning on Residential Option Value By Jonathan C. Young RESEARCH PAPER 2004-12 Jonathan C. Young Department of Economics West Virginia University Business and Economics BOX 41 Morgantown, WV
Myth Busting: The Truth About Multifamily Renters
 Myth Busting: The Truth About Multifamily Renters Multifamily Economics and Market Research With more and more Millennials entering the workforce and forming households, as well as foreclosed homeowners
Hennepin County Economic Analysis Executive Summary
 Hennepin County Economic Analysis Executive Summary Embrace Open Space commissioned an economic study of home values in Hennepin County to quantify the financial impact of proximity to open spaces on the
CoStar Commercial Repeat Sales Indices (CCRSI)
") CoStar Commercial Repeat Sales Indices (CCRSI) Copyright 2011 CoStar Group, Inc. All Rights Reserved. This news release includes "forward-looking statements" including, without limitation, statements regarding
CoStar Commercial Repeat Sales Indices (CCRSI) Copyright 2011 CoStar Group, Inc. All Rights Reserved. This news release includes "forward-looking statements" including, without limitation, statements regarding
RESIDENTIAL PROPERTY PRICE INDEX (RPPI)
") CENTRAL BANK OF CYPRUS EUROSYSTEM RESIDENTIAL PROPERTY PRICE INDEX (RPPI) Q4 The residential property price index is on an upward trend 1 The RPPI (houses and apartments) increased by 0,4% in Q4. Increases
CENTRAL BANK OF CYPRUS EUROSYSTEM RESIDENTIAL PROPERTY PRICE INDEX (RPPI) Q4 The residential property price index is on an upward trend 1 The RPPI (houses and apartments) increased by 0,4% in Q4. Increases
RESIDENTIAL PROPERTY PRICE INDEX (RPPI)
") EUROSYSTEM RESIDENTIAL PROPERTY PRICE INDEX (RPPI) 2018 Q1 The residential property price index is still on an upward trend 1 The RPPI 1 (houses and apartments) increased by 0,6% in 2018Q1. This was the
EUROSYSTEM RESIDENTIAL PROPERTY PRICE INDEX (RPPI) 2018 Q1 The residential property price index is still on an upward trend 1 The RPPI 1 (houses and apartments) increased by 0,6% in 2018Q1. This was the
RESIDENTIAL PROPERTY PRICE INDEX (RPPI)
") EUROSYSTEM RESIDENTIAL PROPERTY PRICE INDEX (RPPI) Q3 The Residential Property Price Index continued to recover 1 The RPPI (houses and apartments) increased by 0,4% in Q3 1, its fifth consecutive quarterly
EUROSYSTEM RESIDENTIAL PROPERTY PRICE INDEX (RPPI) Q3 The Residential Property Price Index continued to recover 1 The RPPI (houses and apartments) increased by 0,4% in Q3 1, its fifth consecutive quarterly
Residential Property Index Series. August 2017
 Residential Property Index Series August 2017 This page intentionally left blank Contents Overview 4 Index Series 4 Index Maintenance 6 Daily Valuation 6 Selection Rules 6 Base Date 6 Index Rebalancing
Price Indices: What is Their Value?
 SKBI Annual Conferece May 7, 2013 Price Indices: What is Their Value? Susan M. Wachter Richard B. Worley Professor of Financial Management Professor of Real Estate and Finance Overview I. Why indices?
Trends in Scottish Residential Lettings
 The Citylets Report Issue 1 Spring 2007 Trends in Scottish Residential tings A Tale of Three Cities Introduction citylets.co.uk is Scotland s original residential lettings portal advertising over 45,000
Summary. Houston. Dallas. The Take Away
 Page Summary The Take Away The first quarter of 2017 was marked by continued optimism through multiple Texas metros as job growth remained positive and any negatives associated with declining oil prices
Why are house prices so high in the Portland Metropolitan Area?
 ROBERT F. MCCULLOUGH, JR. PRINCIPAL Why are house prices so high in the Portland Metropolitan Area? Robert McCullough A question that comes up frequently in neighborhood discussions concerns the rapid
86 years in the making Caspar G Haas 1922 Sales Prices as a Basis for Estimating Farmland Value
 2 Our Journey Begins 86 years in the making Caspar G Haas 1922 Sales Prices as a Basis for Estimating Farmland Value Starting at the beginning. Mass Appraisal and Single Property Appraisal Appraisal
CoreLogic Home Value Hedonic Indices FAQs. August 2017
 CoreLogic Home Value Hedonic Indices FAQs August 2017 Contents 1. Describing the index 4 1.1. What is an Index? 4 1.2. What does the index value mean? 4 1.3. Why are there multiple price indices in the
STATISTICAL REFLECTIONS
 STATISTICAL REFLECTIONS 9 November 2018 Contents Summary...1 Changes in property transactions...1 Annual price index...1 Quarterly pure price index...2 Distribution of existing home transactions...2 Regional
2012 Profile of Home Buyers and Sellers Florida Report
 2012 Profile of Home and Sellers Report Prepared for: REALTORS Prepared by: NATIONAL ASSOCIATION OF REALTORS Research Division December 2012 2012 Profile of Home and Sellers Report Table of Contents Introduction...
Re-benchmarking of Existing Home Sales. December 21, 2011
 Re-benchmarking of Existing Home Sales December 21, 2011 What is Getting Revised? No Revision to Median Home Price No Revision to Months Supply of Inventory Local MLS data converted to months supply Downward
An Investigation into the Potential Relationship between Property Values and High Voltage Overhead Transmission Lines in Ireland
 An Investigation into the Potential Relationship between Property Values and High Voltage Overhead Transmission Lines in An independent report prepared for EirGrid Plc The Oval, 160 Shelbourne Road Ballsbridge,
2014 Profile of Home Buyers and Sellers Texas Report
 2014 Profile of Home Buyers and Sellers Report Prepared for: Association of REALTORS Prepared by: NATIONAL ASSOCIATION OF REALTORS Research Division December 2014 2014 Profile of Home Buyers and Sellers
Briefing Book. State of the Housing Market Update San Francisco Mayor s Office of Housing and Community Development
 Briefing Book State of the Housing Market Update 2014 San Francisco Mayor s Office of Housing and Community Development August 2014 Table of Contents Project Background 2 Household Income Background and
BELMONT CRAGIN HOUSING STUDY
 BELMONT CRAGIN HOUSING STUDY June 2016 Draft for Review Nathalie P. Voorhees Center for Neighborhood and Community Improvement CONTENTS BACKGROUND... 1 KEY FINDINGS... 2 ABOUT THE COMMUNITY... 3 CURRENT
Cook County Assessor s Office: 2019 North Triad Assessment. Evanston Residential Assessment Narrative Updated: April 8 th, 2019
 Cook County Assessor s Office: 2019 North Triad Assessment Evanston Residential Assessment Narrative Updated: April 8 th, 2019 1 Updates to this report A previous version of this report was rendered in
Table of Contents. Appendix...22
 Table Contents 1. Background 3 1.1 Purpose.3 1.2 Data Sources 3 1.3 Data Aggregation...4 1.4 Principles Methodology.. 5 2. Existing Population, Dwelling Units and Employment 6 2.1 Population.6 2.1.1 Distribution
2012 Profile of Home Buyers and Sellers Texas Report
 2012 Profile of Home and Sellers Report Prepared for: Association of REALTORS Prepared by: NATIONAL ASSOCIATION OF REALTORS Research Division December 2012 2012 Profile of Home and Sellers Report Table
RESIDENTIAL MARKET ANALYSIS
 11 RESIDENTIAL MARKET ANALYSIS Kyle Smith Portland State University National housing market statistics reflect an increase in value from the prior year, bucking the multi-quarter trend of declining sales
RESIDENTIAL PROPERTY PRICE INDEX (RPPI)
") EUROSYSTEM RESIDENTIAL PROPERTY PRICE INDEX (RPPI) 2017Q1 Residential property prices continued to increase moderately in 2017Q1 1 The RPPI (houses and apartments) recorded the third consecutive marginal
EUROSYSTEM RESIDENTIAL PROPERTY PRICE INDEX (RPPI) 2017Q1 Residential property prices continued to increase moderately in 2017Q1 1 The RPPI (houses and apartments) recorded the third consecutive marginal
2012 Profile of Home Buyers and Sellers New Jersey Report
 Prepared for: New Jersey Association of REALTORS Prepared by: Research Division December 2012 Table of Contents Introduction... 2 Highlights... 4 Conclusion... 7 Report Prepared by: Jessica Lautz 202-383-1155
HOUSING MARKET ANALYSIS
 HOUSING MARKET ANALYSIS NGAN NGUYEN Oregon Association of Realtors Student Fellow & Certificate of Real Estate Development Graduate Student National housing market statistics reflect a decreasing prices
The Impact of. The Impact of. Multifamily. Multifamily. Foreclosures and. Foreclosures and. Over-Mortgaging. Over-Mortgaging.
 The Impact of The Impact of Multifamily Multifamily Foreclosures and Foreclosures and Over-Mortgaging Over-Mortgaging in Neighborhoods in Neighborhoods in New York City in New York City Harold Shultz,
14 N O V E M B E R
 14 N O V E M B E R 2 0 1 8 REINZ HOUSE PRICE INDEX (HPI) As one of the country s foremost authorities on real estate data, we are proud to bring you the REINZ HPI (House Price Index). It provides a level
PUBLICATION 1905 A Reprint from Tierra Grande
 JULY 2009 Housing Markets PUBLICATION 1905 A Reprint from Tierra Grande Conflicting real estate data seem to be the norm rather than the exception, especially when markets change rapidly. Lately, national
Residential Property Index Series. January 2018
 Residential Property Index Series January 2018 This page intentionally left blank Contents Overview 4 Index Series 4 Index Maintenance 6 Daily Valuation 6 Selection Rules 6 Base Date 6 Index Rebalancing
CONTENTS. Executive Summary 1. Southern Nevada Economic Situation 2 Household Sector 5 Tourism & Hospitality Industry
 CONTENTS Executive Summary 1 Southern Nevada Economic Situation 2 Household Sector 5 Tourism & Hospitality Industry Residential Trends 7 Existing Home Sales 11 Property Management Market 12 Foreclosure
RESIDENTIAL PROPERTY PRICE INDEX (RPPI)
") EUROSYSTEM RESIDENTIAL PROPERTY PRICE INDEX (RPPI) 2017Q2 Moderate recovery in the Residential Property Price Index 1 The RPPI (houses and apartments) recorded an increase of 0,5% on a quarterly basis
EUROSYSTEM RESIDENTIAL PROPERTY PRICE INDEX (RPPI) 2017Q2 Moderate recovery in the Residential Property Price Index 1 The RPPI (houses and apartments) recorded an increase of 0,5% on a quarterly basis
Prices of dwellings in housing companies
 Housing 2017 Prices of dwellings in housing companies 2017, November Prices of dwellings in housing companies fell in November According to Statistics Finland s preliminary data, prices of dwellings in
Prices of dwellings in housing companies
 Housing 2017 Prices of dwellings in housing companies 2017, October Prices of dwellings in housing companies fell in October According to Statistics Finland s preliminary data, prices of dwellings in old
TECHNICAL ASSISTANCE REPORT RESIDENTIAL PROPERTY PRICE STATISTICS CAPACITY DEVELOPMENT MISSION. Copies of this report are available to the public from
 IMF Country Report No. 18/200 June 2018 INDONESIA TECHNICAL ASSISTANCE REPORT RESIDENTIAL PROPERTY PRICE STATISTICS CAPACITY DEVELOPMENT MISSION This Technical Assistance Report on Indonesia was prepared
Market Trends Generated on 04/24/2018 Page 1 of Alpaca St, South El Monte, CA , Los Angeles County.
 9743 Alpaca St, South El Monte, CA 91733-3028, Los Angeles County Pricing Trends Median Sale Price to Current Value - Tax The percentage of properties that have increased or decreased in value based on