IHS Regional Housing Market Segmentation Analysis
|
|
|
- Ethelbert Wade
- 5 years ago
- Views:
Transcription
1 REPORT IHS Regional Housing Market Segmentation Analysis June, 2017 INSTITUTE FOR HOUSING STUDIES AT DEPAUL UNIVERSITY HOUSINGSTUDIES.ORG
2 IHS Regional Housing Market Segmentation Analysis June 2017 Using clustering techniques and data on current housing market and socioeconomic conditions, IHS developed a segmentation analysis to help regional policy makers and housing stakeholders understand variation in local housing submarkets. These data and analysis were developed to allow for more strategic and targeted outreach and implementation of the Homes for a Changing Region program and more broadly, to inform the development of new regional housing initiatives that are responsive to local needs. Table of Contents Abbreviated methodology o About the technique 2 o About the data 2 Clustering results o Overview of cluster patterns and maps 4 Technical appendix o Data preprocessing Normalization of census tracts for longitudinal analysis 15 Normalization of original data values 15 Margin of error analysis 15 Methods for standard errors 16 o K-Medoids clustering technique About the method 16 Choosing the number of clusters K 16 Methods for evaluating cluster quality 17 Qualitative testing 17 Digital appendix o Census tract classification o Summary table o Variables analyzed and data sources 1
3 ABBREVIATED METHODOLOGY About the technique When developing housing and community development strategies, policy makers, and urban planners rely on a deep understanding of the characteristics of the communities in which they work. While it is simple to evaluate a community s median income or unemployment rate, it becomes challenging to characterize communities when comparing many factors, such as educational attainment, population changes, levels of mortgage credit, or the underlying housing stock. A housing market segmentation study can explore differences by building an integrated model that identifies geographic units with similar characteristics. This data modeling approach can be invaluable for urban planning, real estate development, geo-demographic research, legislative policy work, economic investment, and more. An extensive history of housing segmentation and its applications can be found in Housing Market Segmentation: a Review by Islam and Asami, and The definition and identification of housing submarkets written by C.A. Watkins. 1,2 Clustering algorithms incorporate multiple variables to group items by their overall similarity. When applied to community-level data, clustering provides a way to compare different geographic units that share similar traits, regardless of their physical proximity. The goal of this study was to use clustering techniques to perform a housing market segmentation analysis of the seven county region surrounding Chicago, IL namely Cook, DuPage, Kane, Kendall, Lake, McHenry, and Will counties. The model incorporated data on housing stock and affordability, housing market activity, resident demographics, and socioeconomic indicators to identify communities with similar characteristics. The segmentation algorithm and associated techniques are discussed in greater detail in the technical appendix. About the data Data were collected from five sources: the 2000 US Decennial Census; year sample estimates from the US Census Bureau s American Community Survey (ACS); the US 2010 Project at Brown University; Housing and Urban Development s 2013 Location Affordability Index; and housing market conditions data from the Institute for Housing Studies at DePaul University. The communities studied comprise a seven-county region in northeastern Illinois, and include Cook, DuPage, Kane, Kendall, Lake, McHenry, and Will 1 K. S. Islam and Y. Asami, Housing Market Segmentation : a Review, Rev. Urban Reg. Dev. Stud., vol. 21, no. 2, C. A. Watkins, The definition and identification of housing submarkets, Environ. Plan. A, vol. 33, no. 12, pp ,
4 counties. The region was studied at the census-tract level, with census tracts defined by the year 2010 Decennial Census; a total of 1985 census tracts were analyzed. 3 Data for this study were collected to analyze a number of topics related to housing demand and supply, including variables associated with current and changing demographic and socioeconomic conditions, housing affordability, housing stock, and investment and market patterns. These data included information on population change, income level, household size, age, housing tenure, rents and home values, cost burden, vacancy, educational attainment, density, housing stock age and type, mortgage activity, foreclosure distress, and characteristics of property sales. By request, IHS excluded data on poverty status and race and ethnicity so that these features could be analyzed separately by the Chicago Metropolitan Agency for Planning (CMAP) and project partners. A full list of variables and sources is included in the digital appendix. 3 See the technical note for more on the treatment of the data for analysis 3
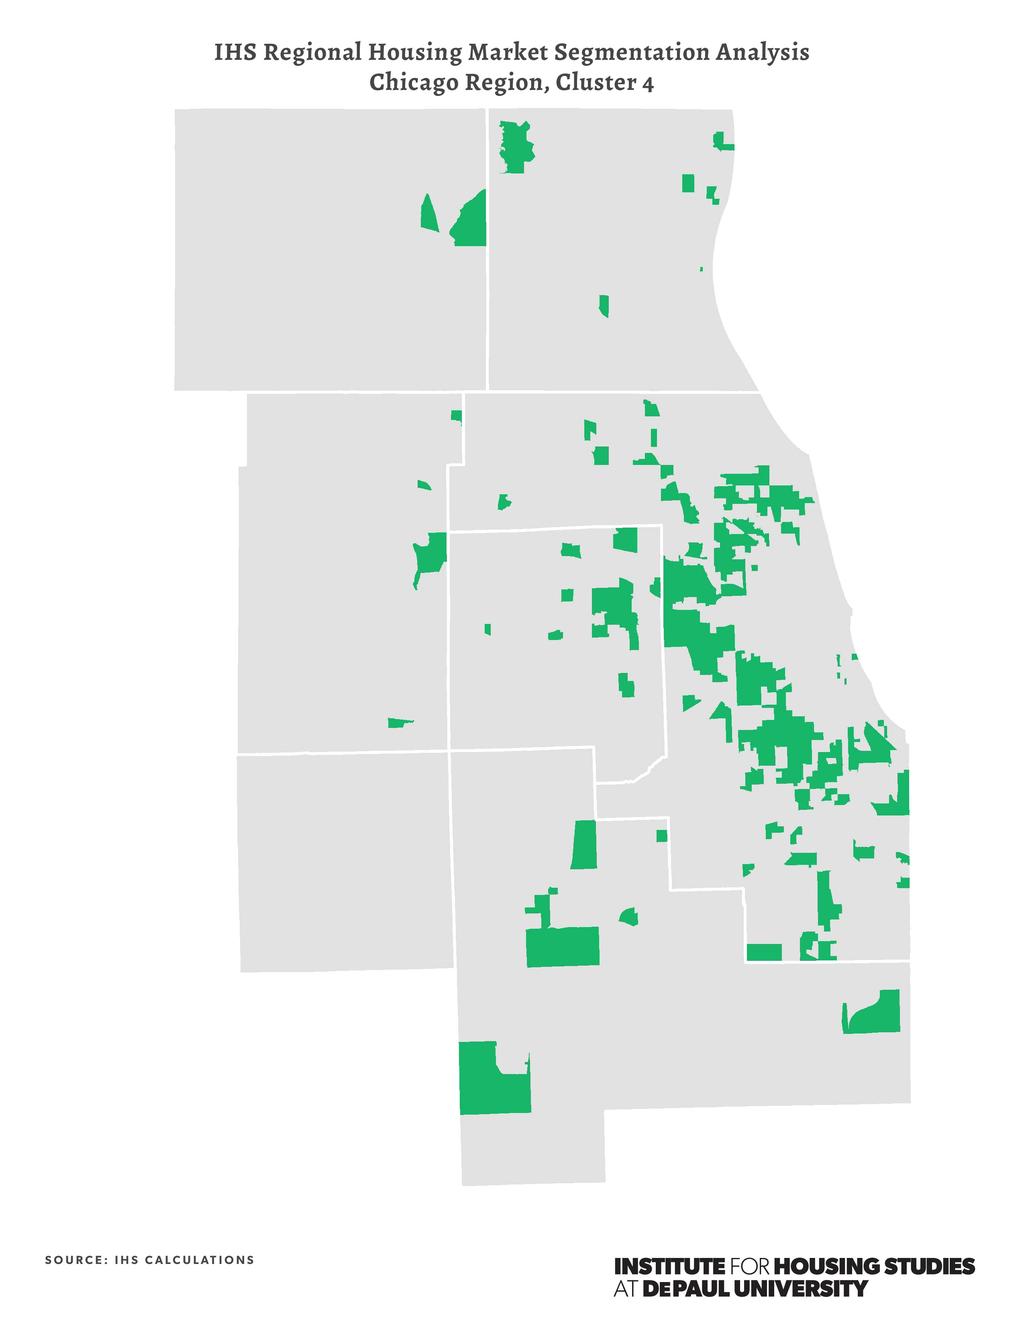
5 CLUSTERING RESULTS Overview of cluster patterns and maps The clustering application identified eight distinct clusters in the Chicago seven county region. It clustered wealthy, economically distressed, and high-growth census tracts consistently and distinctly. Though geographic location was not included as a variable, the results also highlighted a strong geographic pattern related to the historical evolution of urban development outward from downtown Chicago based on age of the housing stock. It also identified a cluster unique in its high levels of growth, housing stock age, and income but geographically distinct, with tracts concentrated in downtown Chicago and dispersed in pockets across the region. Clusters were most strongly differentiated by age of housing, household income, population growth, and economic hardship indicators such as unemployment and foreclosure. The algorithm identified two low- to moderate-income primarily suburban clusters differentiated by housing stock, an aging population, and certain economic indicators. The algorithm also identified two high-wealth clusters: one typified by middleaged homeowners in communities with moderate sales activities, and a second cluster of young, highly educated, urban professionals. Finally, two economically-distressed clusters were identified, differentiated by the varying degrees of unemployment, subsidized housing, and investment indicators. A summary of characteristics are in Table 1 below. A full summary table with value ranges for each cluster and data variable analyzed in the segmentation model are included in the digital appendix. 4
6 Table 1. IHS Regional Housing Market Segmentation Analysis, Summary of Cluster Characteristics Cluster Housing Affordability Housing Stock Investment and market conditions Demographic and socioeconomic characteristics 1 High and increasing levels of cost burden Housing stock is low cost, but incomes are low and have seen large declines Low transportation costs Relatively high density urban cluster with older housing stock built prior to 1940 High levels of renters and a largest share of subsidized housing High distress area with high levels of foreclosure activity and vacancy Low levels of mortgage investment, but high levels of cash sales Low levels of educational attainment Lower-income with the largest income declines Unemployment is high and increasing Increase in senior population High, but decreasing levels of children 2 High and increasing levels of cost burden, largely due to declining incomes Low transportation costs Relatively high density urban and suburban cluster with older housing stock built prior to 1940 Moderate to high levels of renters with lower levels of subsidized housing High distress area with higher levels of foreclosure activity but moderate levels of vacancy Low levels of mortgage investment, but high levels of cash sales Low levels of educational attainment Households have lower- and moderateincome and have seen declining incomes This area is characterized by large households and high levels of children 3 House prices and rents are high and increasing, but lower levels of cost burden due to high and growing incomes Low transportation costs High density urban cluster with older housing stock High level of renters, but only area with declining levels of renters Generally lower levels of levels of subsidized housing Very active housing market with high levels of mortgage activity and turnover and low vacancy Low foreclosure distress High/middle income, younger, and educated households Only cluster to see incomes increase High levels of small 1-person households with low levels of children 4 Moderate cost burdened with substantial increases in burdened households Housing costs are generally low, but incomes are declining High transportation costs Largely suburban cluster with some lower density urban areas and largely post-war housing stock built Largely owner occupied cluster with low levels of subsidized housing Moderate levels of foreclosure activity and high/moderate level of distressed sales Moderate levels of mortgage lending and housing market activity Primarily middle and moderate income households with generally lower levels of educational attainment Family area with moderate share of children but somewhat older population 5 Moderate cost burdened with substantial increases in burdened households Housing costs are generally low, but incomes declining High transportation costs Lower-density suburban cluster with housing stock largely built Largely owner occupied, but higher level of renters and subsidized housing Moderate levels of foreclosure activity and high/moderate level of distressed and cash sales Only cluster with house price decline Primarily moderate income households with generally lower levels of educational attainment Family area with moderate share of children 6 Expensive cluster in terms of housing costs (both house prices and rents) Low cost burden due to high incomes High transportation costs Largely suburban, low density with a mix of both older and newer housing Largely owner occupied with low levels of subsidized housing Not heavily impacted by foreclosures Low vacancy with higher levels of mortgage investment, and higher levels recent housing turnover Largely higher income and highly educated High share seniors and low share of younger adults Family cluster with high share of 2-4 person households but moderate levels of children. 7 This area has moderate levels of cost burden with slight increases Home prices are moderate, but rents are high (core), and incomes are high Transportation costs are very high (fringe areas) Bimodal cluster includes areas with high levels of recent, post-2000 development in the urban core and fringe Outside of core, primarily low density Lowest level of renters Moderate levels of foreclosure activity and distressed sales Moderate levels of lending, somewhat stagnant recent market activity Cluster with most significant population growth Higher/middle-income cluster, but only moderate levels of educational attainment Large family households and high share of children, likely at fringe Primarily middle-aged households 8 Moderate levels of cost burden with slight increases Home prices and rents are moderate due to higher incomes Very high transportation costs Suburban, low density cluster with a housing largely built after 1980 Largely owner occupied cluster with low levels of subsidized housing Not heavily impacted by foreclosures but moderate levels of distressed sales Low vacancy with moderate levels of mortgage investment Moderate levels of population growth Higher/middle-income cluster, but only moderate levels of educational attainment High share of 2-4 person households but large decline in children Primarily middle-aged households 5
7
8
9
10
11
12
13
14
15
16 TECHNICAL APPENDIX Data preprocessing Normalization of census tracts for longitudinal analysis Since 2000 Census tracts differ from 2010 tracts, IHS was required to normalize year 2000 data to 2010 census boundaries. For certain data, IHS utilized transformations of Census data from Brown University s US 2010 Project. Where data were not available, IHS utilized an application developed by Brown University to normalize the results. 4 After removing five census tracts that did not represent residential areas, 1,980 census tracts were included in the analysis. 5 Normalization of original data values In clustering applications, a typical preprocessing step is to standardize variables so that all data are transformed to a comparable range of value. This is because variables measured at different scales will likely skew an analysis, where a variable with a larger range might outweigh variables with smaller ranges. To correct this, the following transformations were applied: Each count variable was converted to percentages ranging in the [0,1] interval. Each continuous variable with a dollar amount such as median household income, home value, or contract rent was converted to a new variable in the [0,1] range using a Min-Max Scaling. Year 2000 variables were also adjusted for inflation. 6 Variables describing changes between year 2013 and year 2000 were computed by subtracting the percentage values in 2013 from the percentage values in 2000 and/or subtracting the inflation adjusted year 2000 amounts from year 2013 amounts. Margin of error analysis The Census ACS estimates are based on a sample and as a result, may be affected by high levels of sampling variability. The reliability of each ACS estimate can be analyzed using the published margin of error that is based on a 90-percent confidence level. 7 The margin of error (MOEs) measures the variation in the random samples due to chance. 4 See ( 5 Two tracts, and , represent Midway and O Hare airport, respectively. Tract is an Army Munitions. Tract and both have zero population. 6 The dollar values of Year 2000 variables were converted to a 2013 Inflation Adjusted amount by multiplying them by a factor of , obtained from the Bureau of Labor Statistics. 7 U.S. Census Bureau (2008). A Compass for Understanding and Using American Community Survey Data: What General Data Users Need to Know. Washington DC: U.S. Government Printing Office 15
17 Method for standard errors A commonly used technique to decide whether a certain ACS variable estimate is reliable employs the coefficient of variation (CV) of the sample estimate. The coefficient of variation is defined as the ratio between standard error and estimated value, and measures the relative amount of variability associated with the sample estimate. Low CV values indicate more reliable estimates. In line with these criterion, only ACS estimates with CV values below 30 percent were used in this analysis. In order to include certain ACS variables with CV values exceeding 30 percent, IHS followed Census Bureau protocols to create a new derived variable with a reduced and acceptable margin of error. The CV of the aggregated estimate was computed to assess its reliability and the new aggregated variable was used in the analysis if the CV was below 30 percent. K-Medoids clustering technique About the method This analysis uses a K-Medoid technique as the method for defining clusters of census tracts with similar characteristics. K-Medoid is a distance-based partitioning method that divides the set of data points into non-overlapping subsets (or clusters) such that each data point is exactly in one subset. Objects within a subset are more similar to one another and different from the objects in other clusters. The K-Medoid technique groups data points by calculating their pairwise distance from a central point in each cluster. The central-most point (medoid) of the cluster can be regarded as the representation of that cluster. Each data point is then assigned to the closest medoid, and the collection of points assigned to a medoid forms the associated cluster. Extensive discussion of this technique can be found in the textbook by L. Kaufman and P.J. Rousseeuw. 8 K-medoid clustering was chosen for this analysis as it can better handle the variation and outliers present in housing data utilized for the study. 9 The analysis was computed using the PAM implementation in the R cluster package. Eight clusters were created using the Euclidian distance measure. Choosing the number of clusters k One major challenge among clustering methodologies is the need to pre-select an appropriate number (k) of clusters. The intended use of the final clustering results can cause additional complexity. If there are too few clusters the segmentation is coarse, resulting in broad, non-specific clusters. With too many clusters, there are very small differences among variables, and it becomes difficult to characterize the clusters. One common quantitative approach to choosing the appropriate number of clusters is to cluster the data multiple times and choose a different number of clusters each time. An internal validity metric measuring 8 L. Kaufman and P. J. Rousseeuw, Finding groups in data : an introduction to cluster analysis. Wiley, H. S. Park and C. H. Jun, A simple and fast algorithm for K-medoids clustering, Expert Syst. Appl., vol. 36, no. 2 PART 2, pp ,
18 the quality of the clustering results is recorded for each trial and the optimal k is selected according to some criterion specific to the chosen metric. Methods for evaluating cluster quality Silhouette width is a common internal validity measure for clustering and has been shown to be robust when applied to many clustering algorithms. 10 To choose the appropriate number of clusters for this study, silhouette width was recorded for values of k from two to eleven. Eight clusters were selected as they were associated with both a narrow silhouette width and an acceptable level of granularity for the intended use. Qualitative testing Clustering seeks to create useful, understandable, and insightful groupings. Considering these goals, qualitative evaluations of cluster quality are also relevant. For this study, mapping and evaluation of geographic patterns and trends verified that the algorithms produced clusters with merit by assessing whether clusters made sense intuitively and accurately reflected the observed characteristics of the areas. Clustering results were analyzed using a three-step process. First, silhouette distances were computed as a quantitative assessment of clusters quality. Census tracts and associated clusters were then mapped to determine whether the results were consistent with the observed characteristics in the region. Finally, the values for each variable included in the segmentation were compared among clusters to identify if significant differences among clusters and to descriptively characterize each cluster. The results were further refined through meetings with project partners, resulting in the final housing market segmentation results presented in this document. 10 L. Vendramin, R. Campello, and E. Hruschka, Relative Clustering Validity Criteria: A Comparative Overview, Stat. Anal. Data Min., vol. 3, no. 5,
Description of IHS Hedonic Data Set and Model Developed for PUMA Area Price Index
 MAY 2015 Description of IHS Hedonic Data Set and Model Developed for PUMA Area Price Index Introduction Understanding and measuring house price trends in small geographic areas has been one of the most
November An updated analysis of the overall housing needs of the City of Aberdeen. Prepared by: Community Partners Research, Inc.
 City of Aberdeen HOUSING STUDY UPDATE November 2010 An updated analysis of the overall housing needs of the City of Aberdeen Prepared by: Community Partners Research, Inc. nd 10865 32 Street North Lake
HOME Survey. Housing Opportunities and Market Experience. June National Association of REALTORS Research Group
 HOME Survey Housing Opportunities and Market Experience June 2018 National Association of REALTORS Research Group Introduction The Housing Opportunities and Market Experience (HOME) report was created
American Community Survey 5-Year Estimates
 DP04 SELECTED HOUSING CHARACTERISTICS 2006-2010 American Community Survey 5-Year s Supporting documentation on code lists, subject definitions, data accuracy, and statistical testing can be found on the
American Community Survey 5-Year Estimates
 DP04 SELECTED HOUSING CHARACTERISTICS 2007-2011 American Community Survey 5-Year Estimates Supporting documentation on code lists, subject definitions, data accuracy, and statistical testing can be found
SELECTED HOUSING CHARACTERISTICS American Community Survey 5-Year Estimates
 DP04 SELECTED HOUSING CHARACTERISTICS 2008-2012 American Community Survey 5-Year Estimates Supporting documentation on code lists, subject definitions, data accuracy, and statistical testing can be found
The Impact of Using. Market-Value to Replacement-Cost. Ratios on Housing Insurance in Toledo Neighborhoods
 The Impact of Using Market-Value to Replacement-Cost Ratios on Housing Insurance in Toledo Neighborhoods February 12, 1999 Urban Affairs Center The University of Toledo Toledo, OH 43606-3390 Prepared by
Cultural Policy Center at the University of Chicago. Irving B Harris Graduate School of Public Policy Studies
 Cultural Policy Center at the University of Chicago Irving B Harris Graduate School of Public Policy Studies This study was made possible through the generous support of The Joyce Foundation Project Goals
City of Lonsdale Section Table of Contents
 City of Lonsdale City of Lonsdale Section Table of Contents Page Introduction Demographic Data Overview Population Estimates and Trends Population Projections Population by Age Household Estimates and
Cook County Assessor s Office: 2019 North Triad Assessment. Evanston Residential Assessment Narrative Updated: April 8 th, 2019
 Cook County Assessor s Office: 2019 North Triad Assessment Evanston Residential Assessment Narrative Updated: April 8 th, 2019 1 Updates to this report A previous version of this report was rendered in
American Community Survey 5-Year Estimates
 DP04 SELECTED HOUSING CHARACTERISTICS 2011-2015 American Community Survey 5-Year Estimates Note: This is a modified view of the original table. Supporting documentation on code lists, subject definitions,
Applying Lessons from The 606 to Map Displacement Pressure in Chicago
 PRESENTATION November 14, 2018 Applying Lessons from The 606 to Map Displacement Pressure in Chicago Presented by Institute for Housing Studies Institute for Housing Studies IHS s mission is to provide
APPENDIX A. Market Study Standards and Requirements
 APPENDIX A Market Study Standards and Requirements Section 42(m)(1)(A)(iii) of the IRS Code and Section IV(A)(2) of the 2018 Qualified Allocation Plan (QAP) require market studies for all low-income housing
Cook County Assessor s Office: 2019 North Triad Assessment. Elk Grove Residential Assessment Narrative April 16th, 2019
 Cook County Assessor s Office: 2019 North Triad Assessment Elk Grove Residential Assessment Narrative April 16th, 2019 1 Elk Grove Residential Properties Executive Summary Since the 2016 re-assessment,
MONTGOMERY COUNTY RENTAL HOUSING STUDY. NEIGHBORHOOD ASSESSMENT June 2016
 MONTGOMERY COUNTY RENTAL HOUSING STUDY NEIGHBORHOOD ASSESSMENT June 2016 AGENDA Model Neighborhood Presentation Neighborhood Discussion Timeline Discussion Next Steps 2 WORK COMPLETED Socioeconomic Analysis
Cook County Assessor s Office: 2019 North Triad Assessment. Norwood Park Residential Assessment Narrative March 11, 2019
 Cook County Assessor s Office: 2019 North Triad Assessment Norwood Park Residential Assessment Narrative March 11, 2019 1 Norwood Park Residential Properties Executive Summary This is the current CCAO
Credit Constraints for Small Multifamily Rental Properties
 MARCH 2012 DEPAUL UNIVERSITY INSTITUTE FOR HOUSING STUDIES Research Brief Credit Constraints for Small Multifamily Rental Properties INTRODUCTION Small multifamily properties are critical to the supply
2011 ASSESSMENT RATIO REPORT
 2011 Ratio Report SECTION I OVERVIEW 2011 ASSESSMENT RATIO REPORT The Department of Assessments and Taxation appraises real property for the purposes of property taxation. Properties are valued using
Understanding The 606 s impact on the surrounding neighborhood s housing market
 PRESENTATION March 3, 2017 Understanding The 606 s impact on the surrounding neighborhood s housing market Presented by the Institute for Housing Studies at LISC Data Friday Institute for Housing Studies
ESTIMATED FULL VALUE OF REAL PROPERTY IN COOK COUNTY:
 ESTIMATED FULL VALUE OF REAL PROPERTY IN COOK COUNTY: 2003-2012 August 14, 2014 ESTIMATED FULL VALUE OF PROPERTY IN COOK COUNTY: Civic Federation Methodology CALCULATION OF ESTIMATED FULL VALUE The full
Housing Study & Needs Assessment
 Housing Study & Needs Assessment Phase II Public Engagement Presentation #2 Winston-Salem, North Carolina January 25, 2018 MEETING OVERVIEW Welcome & Introductions Purpose & Goals Community Discussions
Little Haiti Community Needs Assessment: Housing Market Analysis December 2015
 Little Haiti Community Needs Assessment: Housing Market Analysis December 2015 Prepared by: EXECUTIVE SUMMARY Background The Little Haiti Housing Needs Assessment provides a current market perspective
While the United States experienced its larg
 Jamie Davenport The Effect of Demand and Supply factors on the Affordability of Housing Jamie Davenport 44 I. Introduction While the United States experienced its larg est period of economic growth in
Detroit Neighborhood Housing Markets
 Detroit Neighborhood Housing Markets Market Study 2016 In 2016, Capital Impact s Detroit Program worked with local and national experts to determine the residential market demand across income levels for
Trends in Affordable Home Ownership in Calgary
 Trends in Affordable Home Ownership in Calgary 2006 July www.calgary.ca Call 3-1-1 PUBLISHING INFORMATION TITLE: AUTHOR: STATUS: TRENDS IN AFFORDABLE HOME OWNERSHIP CORPORATE ECONOMICS FINAL PRINTING DATE:
SOCIAL AND ECONOMIC TRENDS IN INDIANAPOLIS : AN OVERVIEW OF NEIGHBORHOOD LEVEL CHANGE
 SOCIAL AND ECONOMIC TRENDS IN INDIANAPOLIS 2000-2014: AN OVERVIEW OF NEIGHBORHOOD LEVEL CHANGE Alan Mallach Center for Community Progress November 2016 This is a draft research brief for limited public
Technical Description of the Freddie Mac House Price Index
 Technical Description of the Freddie Mac House Price Index 1. Introduction Freddie Mac publishes the monthly index values of the Freddie Mac House Price Index (FMHPI SM ) each quarter. Index values are
A STUDY OF THE DISTRICT OF COLUMBIA S APARTMENT RENTAL MARKET 2000 TO 2015: THE ROLE OF MILLENNIALS
 A STUDY OF THE DISTRICT OF COLUMBIA S APARTMENT RENTAL MARKET 2000 TO 2015: THE ROLE OF MILLENNIALS Fahad Fahimullah, Yi Geng, & Daniel Muhammad Office of Revenue Analysis District of Columbia Government
Carver County AFFORDABLE HOUSING UPDATE
 Carver County AFFORDABLE HOUSING UPDATE July 2017 City of Chaska Community Partners Research, Inc. Lake Elmo, MN Executive Summary - Chaska Key Findings - 2017 Affordable Housing Study Update Chaska is
Valuing Land in Dispute Resolution: Using Coefficient of Variation to Determine Unit of Measurement
 From the SelectedWorks of Bryan Younge March 4, 2015 Valuing Land in Dispute Resolution: Using Coefficient of Variation to Determine Unit of Measurement Bryan Younge Available at: https://works.bepress.com/bryan_younge/1/
ECONOMIC CURRENTS. Vol. 5 Issue 2 SOUTH FLORIDA ECONOMIC QUARTERLY. Key Findings, 2 nd Quarter, 2015
 ECONOMIC CURRENTS THE Introduction SOUTH FLORIDA ECONOMIC QUARTERLY Economic Currents provides an overview of the South Florida regional economy. The report presents current employment, economic and real
White Oak Science Gateway Master Plan Staff Draft AFFORDABLE HOUSING ANALYSIS. March 8, 2013
 White Oak Science Gateway Master Plan Staff Draft AFFORDABLE HOUSING ANALYSIS March 8, 2013 Executive Summary The Draft White Oak Science Gateway (WOSG) Master Plan encourages development of higher density,
Briefing Book. State of the Housing Market Update San Francisco Mayor s Office of Housing and Community Development
 Briefing Book State of the Housing Market Update 2014 San Francisco Mayor s Office of Housing and Community Development August 2014 Table of Contents Project Background 2 Household Income Background and
Census Tract Data Analysis
 Data Analysis Study Area: s within the City of Evansville, Indiana Prepared For Mr. Kelley Coures City of Evansville Department of Metropolitan Development 1 NW MLK Jr. Boulevard Evansville, Indiana 47708
Carver County AFFORDABLE HOUSING UPDATE
 Carver County AFFORDABLE HOUSING UPDATE July 2017 City of Waconia Community Partners Research, Inc. Lake Elmo, MN Executive Summary - Waconia Key Findings - 2017 Affordable Housing Study Update Waconia
Geographic Variations in Resale Housing Values Within a Metropolitan Area: An Example from Suburban Phoenix, Arizona
 INTRODUCTION Geographic Variations in Resale Housing Values Within a Metropolitan Area: An Example from Suburban Phoenix, Arizona Diane Whalley and William J. Lowell-Britt The average cost of single family
April 12, The Honorable Martin O Malley And The General Assembly of Maryland
 April 12, 2011 The Honorable Martin O Malley And The General Assembly of Maryland As required by Section 2-202 of the Tax-Property Article of the Annotated Code of Maryland, I am pleased to submit the
SJC Comprehensive Plan Update Housing Needs Assessment Briefing. County Council: October 16, 2017 Planning Commission: October 20, 2017
 SJC Comprehensive Plan Update 2036 Housing Needs Assessment Briefing County Council: October 16, 2017 Planning Commission: October 20, 2017 Overview GMA Housing Element Background Demographics Employment
Estimating User Accessibility Benefits with a Housing Sales Hedonic Model
 Estimating User Accessibility Benefits with a Housing Sales Hedonic Model Michael Reilly Metropolitan Transportation Commission mreilly@mtc.ca.gov March 31, 2016 Words: 1500 Tables: 2 @ 250 words each
Housing for the Region s Future
 Housing for the Region s Future Executive Summary North Texas is growing, by millions over the next 40 years. Where will they live? What will tomorrow s neighborhoods look like? How will they function
The Honorable Larry Hogan And The General Assembly of Maryland
 2015 Ratio Report The Honorable Larry Hogan And The General Assembly of Maryland As required by Section 2-202 of the Tax-Property Article of the Annotated Code of Maryland, I am pleased to submit the Department
What s Next for Commercial Real Estate Leveraging Technology and Local Analytics to Grow Your Commercial Real Estate Business
 What s Next for Commercial Real Estate Leveraging Technology and Local Analytics to Grow Your Commercial Real Estate Business - A PUBLICATION OF GROWTH MAPS- TABLE OF CONTENTS Intro 1 2 What Does Local
ESTIMATED FULL VALUE OF REAL PROPERTY IN COOK COUNTY:
 ESTIMATED FULL VALUE OF REAL PROPERTY IN COOK COUNTY: 2007-2016 May 21, 2018 MAJOR FINDINGS This report provides an estimate of the full market value of property in Cook County between tax years 2007 and
AVM Validation. Evaluating AVM performance
 AVM Validation Evaluating AVM performance The responsible use of Automated Valuation Models in any application begins with a thorough understanding of the models performance in absolute and relative terms.
Equalization. Overview. Multiplier Basics
 The purpose of this primer is to outline the Illinois Department of Revenue s (IDOR) process in the determination of Cook County s equalization factor commonly known as the multiplier. It describes how
Volume Author/Editor: Gregory K. Ingram, John F. Kain, and J. Royce Ginn. Volume URL:
 This PDF is a selection from an out-of-print volume from the National Bureau of Economic Research Volume Title: The Detroit Prototype of the NBER Urban Simulation Model Volume Author/Editor: Gregory K.
Comparative Housing Market Analysis: Minnetonka and Surrounding Communities
 Comparative Housing Market Analysis: Minnetonka and Surrounding Communities Prepared by Mark Huonder, Eric King, Katie Knoblauch, and Xiaoxu Tang Students in HSG 5464: Understanding Housing Assessment
Metro Atlanta Rental Housing Affordability: How Hot is Too Hot for Low-Income Workers?
 Metro Atlanta Rental Housing Affordability: How Hot is Too Hot for Low-Income Workers? July 2018 Atlanta Regional Commission For more information, contact: cdegiulio@atlantaregional.org Metro Atlanta s
APPENDIX C CHARACTERISTICS OF THE ENERGIZE PHOENIX CORRIDOR
 APPENDIX C CHARACTERISTICS OF THE ENERGIZE PHOENIX CORRIDOR BACKGROUND ON RESIDENTIAL AND COMMERCIAL BUILDINGS IN THE EP CORRIDOR The 10-mile EP corridor (Figure G1) is a highly diverse, mixed-use L-shaped
The supply of single-family homes for sale remains
 Oh Give Me a (Single-Family Rental) Home Harold D. Hunt and Clare Losey December, 18 Publication 2218 The supply of single-family homes for sale remains tight in many markets across the United States.
Memo to the Planning Commission JULY 12TH, 2018
 Memo to the Planning Commission JULY 12TH, 2018 Topic: California State Senate Bill 828 and State Assembly Bill 1771 Staff Contacts: Joshua Switzky, Land Use & Housing Program Manager, Citywide Division
Housing affordability in England and Wales: 2018
 Statistical bulletin Housing affordability in England and Wales: 2018 Brings together data on house prices and annual earnings to calculate affordability ratios for national and subnational geographies
Post-Katrina housing affordability challenges continue in 2008, worsening among Orleans Parish very low income renters
 Post-Katrina housing affordability challenges continue in 2008, worsening among Orleans Parish very low income renters Based on 2004, 2007 and 2008 American Community Survey data from the U.S. Census Bureau
REGIONAL. Rental Housing in San Joaquin County
 Lodi 12 EBERHARDT SCHOOL OF BUSINESS Business Forecasting Center in partnership with San Joaquin Council of Governments 99 26 5 205 Tracy 4 Lathrop Stockton 120 Manteca Ripon Escalon REGIONAL analyst april
Key Findings on the Affordability of Rental Housing from New York City s Housing and Vacancy Survey 2008
 Furman Center for real estate & urban policy New York University school of law n wagner school of public service 110 West 3rd Street, Suite 209, New York, NY 10012 n Tel: (212) 998-6713 n www.furmancenter.org
Leveraging What You Have: Partnering to Improve Existing Affordable Housing
 Leveraging What You Have: Partnering to Improve Existing Affordable Housing Adam Rust Director of Research for Reinvestment Partners Randy Hemann Assistant City Manager - High Point Dr. Stephen Sills Director
A Quantitative Approach to Gentrification: Determinants of Gentrification in U.S. Cities,
 A Quantitative Approach to Gentrification: Determinants of Gentrification in U.S. Cities, 1970-2010 Richard W. Martin, Department of Insurance, Legal, Studies, and Real Estate, Terry College of Business,
Estimating National Levels of Home Improvement and Repair Spending by Rental Property Owners
 Joint Center for Housing Studies Harvard University Estimating National Levels of Home Improvement and Repair Spending by Rental Property Owners Abbe Will October 2010 N10-2 2010 by Abbe Will. All rights
How Did Foreclosures Affect Property Values in Georgia School Districts?
 Tulane Economics Working Paper Series How Did Foreclosures Affect Property Values in Georgia School Districts? James Alm Department of Economics Tulane University New Orleans, LA jalm@tulane.edu Robert
City of Mitchell RENTAL HOUSING UPDATE
 City of Mitchell RENTAL HOUSING UPDATE March 2015 An updated examination of rental housing market conditions in the Mitchell area Community Partners Research, Inc. 10865 32 nd Street North Lake Elmo, MN
Housing Characteristics
 CHAPTER 7 HOUSING The housing component of the comprehensive plan is intended to provide an analysis of housing conditions and need. This component contains a discussion of McCall s 1990 housing inventory
Status of HUD-Insured (or Held) Multifamily Rental Housing in Final Report. Executive Summary. Contract: HC-5964 Task Order #7
 Multifamily Rental Housing in Final Report. Executive Summary. Contract: HC-5964 Task Order #7") Status of HUD-Insured (or Held) Multifamily Rental Housing in 1995 Final Report Executive Summary Cambridge, MA Lexington, MA Hadley, MA Bethesda, MD Washington, DC Chicago, IL Cairo, Egypt Johannesburg,
Status of HUD-Insured (or Held) Multifamily Rental Housing in 1995 Final Report Executive Summary Cambridge, MA Lexington, MA Hadley, MA Bethesda, MD Washington, DC Chicago, IL Cairo, Egypt Johannesburg,
CHAPTER 3. HOUSING AND ECONOMIC DEVELOPMENT
 CHAPTER 3. HOUSING AND ECONOMIC DEVELOPMENT This chapter analyzes the housing and economic development trends within the community. Analysis of state equalized value trends is useful in estimating investment
CITY OF VALDOSTA, GEORGIA ANALYSIS OF IMPEDIMENTS TO FAIR HOUSING CHOICE
 CITY OF VALDOSTA, GEORGIA ANALYSIS OF IMPEDIMENTS TO FAIR HOUSING CHOICE Prepared for: City of Valdosta, Georgia Ms. Mara S. Register, Assistant to the City Manager Public Involvement Department 300 North
concepts and techniques
 concepts and techniques S a m p l e Timed Outline Topic Area DAY 1 Reference(s) Learning Objective The student will learn Teaching Method Time Segment (Minutes) Chapter 1: Introduction to Sales Comparison
CITY OF CLAREMONT MASTER PLAN 2017 CHAPTER 6: HOUSING
 CITY OF CLAREMONT MASTER PLAN CHAPTER 6: HOUSING Prepared by the Claremont Planning Board and the Claremont Planning and Development Department Vision Claremont Master Plan Chapter 6: Housing Quality housing
2012 Profile of Home Buyers and Sellers New Jersey Report
 Prepared for: New Jersey Association of REALTORS Prepared by: Research Division December 2012 Table of Contents Introduction... 2 Highlights... 4 Conclusion... 7 Report Prepared by: Jessica Lautz 202-383-1155
METROPOLITAN COUNCIL S FORECASTS METHODOLOGY
 METROPOLITAN COUNCIL S FORECASTS METHODOLOGY FEBRUARY 28, 2014 Metropolitan Council s Forecasts Methodology Long-range forecasts at Metropolitan Council are updated at least once per decade. Population,
V2 = ( V1 - v1 ) V2 = V1 + ( v2 - ) (v2 - v1) is the net inventory change between the two time periods, and the rate of net inventory change is
 V2 = V1 + ( v2 - ) (v2 - v1) is the net inventory change between the two time periods, and the rate of net inventory change is") A IMPLIFIED URBAN HOUING INVENTORY MODEL - WITH PRACTICAL APPLICATION Ko Ching hih, U.. Department of Housing Urban Development I. Introduction ince 1950, the Bureau of the Census has established a standard
A IMPLIFIED URBAN HOUING INVENTORY MODEL - WITH PRACTICAL APPLICATION Ko Ching hih, U.. Department of Housing Urban Development I. Introduction ince 1950, the Bureau of the Census has established a standard
ASSESSMENT METHODOLOGY
 2019 ASSESSMENT METHODOLOGY COMMERCIAL RETAIL AND OFFICE CONDOMINIUMS A summary of the methods used by the City of Edmonton in determining the value of commercial retail and office condominium properties
Water Use in the Multi family Housing Sector. Jack C. Kiefer, Ph.D. Lisa R. Krentz
 Water Use in the Multi family Housing Sector Jack C. Kiefer, Ph.D. Lisa R. Krentz Presentation Overview Background on WRF 4554 Data sources Water use comparisons Examples of modeling variability in water
RENTAL MARKET REPORT. Manitoba Highlights* Highlight Box. Housing market intelligence you can count on
 H o u s i n g M a r k e t I n f o r m a t i o n RENTAL MARKET REPORT Manitoba Highlights* C a n a d a M o r t g a g e a n d H o u s i n g C o r p o r a t i o n Date Released: Spring 2011 Figure 1 Winnipeg
Methodological Appendix: The Growing Shortage of Affordable Housing for the Extremely Low Income in Massachusetts
 Appendix A: Estimating Extremely Low-Income Households This report uses American Community Survey (ACS) five-year estimate microdata to attain a sample size and geographic coverage that are sufficient
HOUSINGSPOTLIGHT. The Shrinking Supply of Affordable Housing
 HOUSINGSPOTLIGHT National Low Income Housing Coalition Volume 2, Issue 1 February 2012 The Shrinking Supply of Affordable Housing One way to measure the affordable housing problem in the U.S. is to compare
An Assessment of Current House Price Developments in Germany 1
 An Assessment of Current House Price Developments in Germany 1 Florian Kajuth 2 Thomas A. Knetsch² Nicolas Pinkwart² Deutsche Bundesbank 1 Introduction House prices in Germany did not experience a noticeable
Town of Prescott Valley 2013 Land Use Assumptions
 Town of Prescott Valley 2013 Land Use Assumptions Raftelis Financial Consultants, Inc. November 22, 2013 Table of Contents Purpose of this Report... 1 The Town of Prescott Valley... 2 Summary of Land Use
PROFILE. Cultivate Hopkins Comprehensive Plan 8/21/18 DRAFT. Cultivate Hopkins Appendix B3: Housing 1
 APPENDIX B3: PROFILE HOUSING Cultivate Hopkins Comprehensive Plan 8/21/18 DRAFT Cultivate Hopkins Appendix B3: Housing 1 Existing Conditions This section describes existing conditions in housing stock
MISSISSIPPI GULF COAST APARTMENT SURVEY
 MISSISSIPPI GULF COAST APARTMENT SURVEY PREPARED FOR GULF REGIONAL PLANNING COMMISSION 1635 POPPS FERRY ROAD, SUITE G TELEPHONE (228) 864-1167 BILOXI, MISSISSIPPI 39532 PREPARED BY W. S. LOPER AND ASSOCIATES
Young-Adult Housing Demand Continues to Slide, But Young Homeowners Experience Vastly Improved Affordability
 Young-Adult Housing Demand Continues to Slide, But Young Homeowners Experience Vastly Improved Affordability September 3, 14 The bad news is that household formation and homeownership among young adults
UNDERSTANDING DEVELOPER S DECISION- MAKING IN THE REGION OF WATERLOO
 UNDERSTANDING DEVELOPER S DECISION- MAKING IN THE REGION OF WATERLOO SUMMARY OF RESULTS J. Tran PURPOSE OF RESEARCH To analyze the behaviours and decision-making of developers in the Region of Waterloo
Past & Present Adjustments & Parcel Count Section... 13
 Assessment 2017 Report This report includes specific information regarding the 2017 assessment as well as general information about both the appeals and assessment processes. Contents Introduction... 3
Automated Valuation Model
 Automated Valuation Model An innovative tool for Market Intelligence and Risk Management June 2015 Regulated by RICS EPS - Introduction Established presence in SEE: Greece (since 2000) & Romania, Bulgaria
OVERVIEW OF RECENT/EXPECTED ECONOMIC/ HOUSING MARKET CONDITIONS
 OVERVIEW OF RECENT/EXPECTED ECONOMIC/ HOUSING MARKET CONDITIONS STRONG ECONOMIC FUNDAMENTALS *BUT* EXTRAORDINARY SHORT-TERM FACTORS RESULTING IN MAJOR SHIFTS IN TYPES OF HOUSING PRODUCTS AND GEOGRAPHICAL
How Fair Market Rents Limit Voucher Households to Live in Better Neighborhoods: The Case of Baltimore Metropolitan Area
 How Fair Market Rents Limit Voucher Households to Live in Better Neighborhoods: The Case of Baltimore Metropolitan Area JEON, Jae Sik (University of Maryland) jsjeon11@umd.edu ACSP 2014 Conference 1. Background
Assessing Affordable Housing Need A Practical Toolkit. Jenni Easton, AICP Nick Fedorek
 Assessing Affordable Housing Need A Practical Toolkit Jenni Easton, AICP Nick Fedorek Research questions: What should communities know about their housing markets? What can various types of analysis tell
Housing in the Evolving American Suburb The Houston Story
 Housing in the Evolving American Suburb The Houston Story Prepared for ULI Houston April, 2018 Presented by: Gregg Logan Managing Director RCLCO glogan@rclco.com Prepared for ULI Houston April, 2018 Suburbs
Housing Price Forecasts. Illinois and Chicago PMSA, April 2013
 Housing Price Forecasts Illinois and Chicago PMSA, April 2013 Presented To Illinois Association of Realtors From R E A L Regional Economics Applications Laboratory, Institute of Government and Public Affairs
RESOLUTION NO ( R)
") RESOLUTION NO. 2013-06- 088 ( R) A RESOLUTION OF THE CITY COUNCIL OF THE CITY OF McKINNEY, TEXAS, APPROVING THE LAND USE ASSUMPTIONS FOR THE 2012-2013 ROADWAY IMPACT FEE UPDATE WHEREAS, per Texas Local
RESOLUTION NO. 2013-06- 088 ( R) A RESOLUTION OF THE CITY COUNCIL OF THE CITY OF McKINNEY, TEXAS, APPROVING THE LAND USE ASSUMPTIONS FOR THE 2012-2013 ROADWAY IMPACT FEE UPDATE WHEREAS, per Texas Local
ECONOMIC CURRENTS. Vol. 4, Issue 3. THE Introduction SOUTH FLORIDA ECONOMIC QUARTERLY
 ECONOMIC CURRENTS THE Introduction SOUTH FLORIDA ECONOMIC QUARTERLY Vol. 4, Issue 3 Economic Currents provides an overview of the South Florida regional economy. The report presents current employment,
Course Mass Appraisal Practices and Procedures
 Course 331 - Mass Appraisal Practices and Procedures Course Description This course is designed to build on the subject matter covered in Course 300 Fundamentals of Mass Appraisal and prepare the student
Carver County AFFORDABLE HOUSING UPDATE
 Carver County AFFORDABLE HOUSING UPDATE July 2017 City of Carver Community Partners Research, Inc. Lake Elmo, MN Executive Summary - Carver Key Findings - 2017 Affordable Housing Study Update Carver has
A Brief Overview of H-GAC s Regional Growth Forecast Methodology
 A Brief Overview of H-GAC s Regional Growth Forecast Methodology -Houston-Galveston Area Council Email: forecast@h-gac.com Data updated; November 8, 2017 Introduction H-GAC releases an updated forecast
The State of Renters & Their Homes
 FORECLOSURES FINDING #14 The number of pre-foreclosure notices issued to one- to four-unit properties and condominiums in 2015 fell from the previous year. Pre-foreclosure notices for one- to four-unit
Addressing the Impact of Housing for Virginia s Economy
 Addressing the Impact of Housing for Virginia s Economy A REPORT FOR VIRGINIA S HOUSING POLICY ADVISORY COUNCIL NOVEMBER 2017 Appendix Report 2: Housing the Commonwealth's Future Workforce 2014-2024 Jeannette
A View Like Never Before
 A View Like Never Before Introducing CoStar Multifamily Whether you buy, sell, develop, underwrite or value multifamily properties, or advise industry professionals, you need granular multifamily property
Housing Affordability in Lexington, Kentucky
 University of Kentucky UKnowledge CBER Research Report Center for Business and Economic Research 6-29-2009 Housing Affordability in Lexington, Kentucky Christopher Jepsen University of Kentucky, chris.jepsen@uky.edu
An Introduction to RPX INTRODUCTION
 An Introduction to RPX INTRODUCTION Radar Logic is a real estate information company based in New York. We convert public residential closing data into information about the state and prospects for the
Carver County AFFORDABLE HOUSING UPDATE
 Carver County AFFORDABLE HOUSING UPDATE July 2017 City of Cologne Community Partners Research, Inc. Lake Elmo, MN Executive Summary - Cologne Key Findings - 2017 Affordable Housing Study Update Cologne
SUBSTITUTE ORDINANCE
 SUBSTITUTE ORDINANCE WHEREAS, the City of Chicago ("City") is a home rule unit of government by virtue of the provisions of the Constitution of the State of Illinois of 1970, and as such, may exercise
Housing Market Update
 Housing Market Update March 2017 New Hampshire s Housing Market and Challenges Market Overview Dean J. Christon Executive Director, New Hampshire Housing Finance Authority New Hampshire s current housing