LAND MONITOR REPORT
|
|
|
- Bruce Hoover
- 5 years ago
- Views:
Transcription


1 LAND MONITOR REPORT


2 CONTENTS Introduction 3 Housing Industry Association Wagga Branch 3 Definitions 4 Accuracy & Data Interpretation 5 Disclaimer 5 Opteon Southern Inland NSW 5 Residential Land Key Findings 7 Residential Land Graphs 8 Potential Residential Supply 15 Construction Statistics 20 Forecast Population and Dwellings 21 Commercial Land - Key Findings 23 Commercial Land - Graphs 24 Retail & Commercial Floorspace 27 22


3 The Wagga Wagga Land Monitor Report has been developed by the Housing Industry Association Wagga Branch and provides an overview of the vacant land supply in Wagga Wagga. The statistical information relates to historical take-up rates, current production and consumption together with future supply of vacant residential, rural residential, commercial and industrial land. This report also includes information regarding commercial and retail floor space together with demographics and development applications reported by financial years. It is hoped this information will enable stakeholders to make better informed decisions relating to market demand and future economic growth. The ultimate aim is to ensure that there is a sufficient supply and choice of vacant land going forward. THE HOUSING INDUSTRY ASSOCIATION WAGGA BRANCH The Housing Industry Association (HIA) is the official body of Australia s home building industry. HIA is divided in nine geographic regions that provide a state or local focus, ensuing members needs and ideas are heard at the highest level. Our policy areas cover economics, industry, building, planning, industrial relations, legal, environment, training and skills. We advocate the views and policies of our members by contributing to enquiries and forums that impact on the residential building sector. For information on the local branch phone or enquiry@hia.com.au We thank The City of Wagga Wagga for providing statistical data and contributing financially to the production of this report. 33

4 DEFINITIONS The following definitions have been adopted throughout this report: Vacant Land A lot that is vacant and is suitable for either residential or non residential use. Lots produced for the purpose of public reserves, road reserves and boundary adjustments etc. have been excluded from the vacant lot count. Lots Produced Lots produced for either residential or non residential use that have been registered with the New South Wales Land Titles Office (LTO). Lots produced for the purpose of public reserves, road reserves and boundary adjustments are not included in the lots produced count. Lots Consumed Industrial Use Median A vacant lot for which a Construction Certificate (CC) or Complying Development Certificate (CDC) has been issued. A CC or CDC provides consent for construction to take place on a lot. Land suitable for industrial and business uses outside the CBD and removed from suburban shopping centres. The median is the middle point of a number set, in which half the numbers are above the median and half are below. Dwelling Use Average Lots Sold A vacant lot for which a Contract of Sale was exchanged during the financial year and that sale registered with the LTO. Settlement of the sale may have occurred after the end of the financial year. We have attempted to exclude any sales that are not arms length ie those between related parties. Land suitable construction of residential dwelling. for the a single The average is obtained by dividing the sum of a set of values by the number of values in the set. Rural Residential Use Land suitable for the construction of a single dwelling with a site area generally larger than 1,200 square metres. Population The population statistics quoted in this report relate to the whole Local Government Area of Wagga Wagga. Units Use Commercial Use Land in the Wagga Wagga central business district and in the vicinity of suburban shopping centres. Land suitable for the construction of Community Title and/or Strata Title units, duplexes, multiple dwellings on one title and flat developments. 44


5 ACCURACY & DATA INTERPRETATION As with any statistical calculation, a margin of error will result. In this report such errors are minor and typical due to a small percentage of lots for which a construction certificate or complying development certificate has been issued but does not result in construction in the short term. This report should not be used as an indication of a change in market value or the performance of our economy. Property market growth or decline is the result of various factors not limited to: The strength of the economy. Decreasing household sizes resulting in more houses being required for the same population. Housing affordability as result of various factors such as interest rates and rising construction costs. Temporary housing demand as result of major building projects. OPTEON SOUTHERN INLAND NSW The information in this report has been researched, collated and produced by Opteon Southern Inland New South Wales. Formerly Bolton Connolly, we are the largest real estate valuation and advisory firm in Wagga Wagga. Established in the late 1970s we have over 35 years experience in the Riverina and South West Slope s regions of New South Wales. Through the Opteon Property Group our Wagga Wagga and Griffith offices are part of the largest valuation firm in Australia. Our local knowledge and experience together with our network around Australia ensures we can provide the highest quality advice regardless of your needs. When you next require professional property advice contact us at wagga.info@opg.net Government decisions and grants that affect homebuilders. A shortage of supply of land. The availability of large in globo parcels that attract larger property developers to the market. DISCLAIMER Copyright in the report and the information is owned by the HIA Wagga Branch. Reproduction is not permitted without the prior written consent of the HIA. While the information contained in this report has been prepared with all due care for the benefit of the user, the HIA Wagga Branch, its officers, employees and agents do not warrant or make representations in relation to its accuracy. The information is made available on the understanding that the HIA shall not have a liability for any loss whatsoever that might arise as a result of use of the information by the reader or by third parties who receive information directly or indirectly. It is the user s responsibility to make his or her own investigations, decisions and enquiries about the accuracy and completeness of the information. 55


6 Residential SNAPSHOT 775 vacant residential lots. 257 new vacant lots produced - a 20% decrease. 421 lots in the city have been vacant for over 4 years. 299 lots were built on - a 50% increase. Average price of vacant lots remains static. 295 vacant lots were sold. 221 of sold lots were between 600 & 1,500 sqm. Approx. 4,025 potential future lots zoned residential. 66


 and median limited supply of land.")
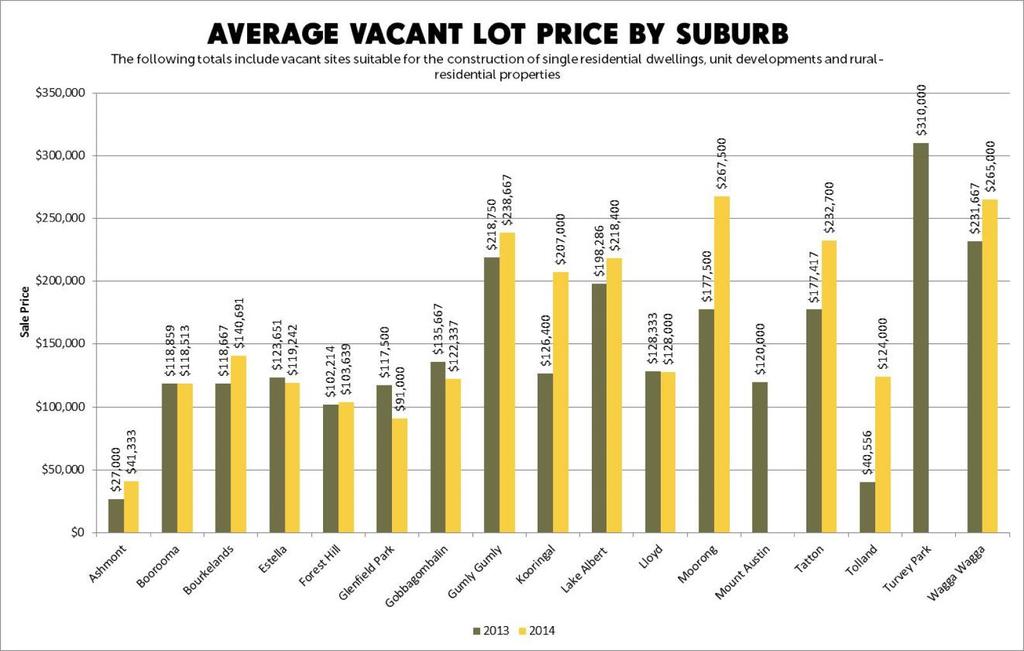
7 KEY FINDINGS RESIDENTIAL LAND As at 30 June 2014, there were 775 vacant 299 vacant lots were built on in the city, a The average vacant lot price per square residential lots in Wagga Wagga and 421 of them had been vacant for more than 4 years. Tatton had the highest number of existing vacant land at 100 lots. 50% increase on the year before. 60% were located in four suburbs, being Boorooma, Tatton, Lloyd and Bourkelands. Wagga Wagga s established suburbs had the metre is relatively consistent across the majority of suburbs at $140 to $180 per square metre. (The small sample size in some suburbs is causing distortion, particularly in Tolland). highest proportion of land that had been vacant for more than 4 years. Central Wagga Wagga remains our most Central Wagga Wagga, 97 are in one expensive suburb per square metre due to a development. Both the average ($139,000) and median limited supply of land. ($125,000) lot prices remained static over the 257 new vacant lots were produced in the last two years. In 2011 the population of the Wagga Wagga city. This is a 20% decrease compared to the Local Government Area (LGA) was year before which is largely due to a Central The highest demand was for vacant lots 61,781. Wagga Wagga unit development in between 600 and 1,500 square metres The number of vacant dwelling lots accounting for 75% of the 295 lots sold in Between the population is estimated produced increased by 29% to increase by 1.4% to 64,748. Of the 107 lots produced in in Of the 257 vacant lots produced in Demand for rural residential lots has This equates to an increase of 897 people, % were located in four suburbs remained constant over the last two years at which divided by the average household size being Bourkelands, Gobbagombalin (Estella about 15% of sales. of 2.52 people results in an estimate of 356 Rise), Estella and Boorooma. new homes or units required in
8 The following totals include vacant sites suitable for the construction of single residential dwellings, unit developments and rural-residential properties 88
9 99
10 The following totals include vacant sites suitable for the construction of single residential dwellings, unit developments and rural-residential properties 1010
11 The following totals include vacant sites suitable for the construction of single residential dwellings, unit developments and rural-residential properties 1111
12 1212

13 Total lots that have been vacant for more than 4 years at 30 June

14 The above totals include vacant sites suitable for the construction of single residential dwellings, unit developments and rural-residential properties 1414


15 ESTIMATED POTENTIAL LOTS CURRENTLY ZONED RESIDENTIAL NOT SUBDIVIDED Estimated potential greenfield lots Gobbagombalin Boorooma 1,250 Lots Estella 350 Lots 4, Lots Turvey Park 60 Lots Governors Hill 135 Lots Forest Hill 650 Lots Lloyd 1,200 Lots This information was supplied by active land developers and represents the majority of potential greenfield residential subdivisions, other smaller developable parcels are located throughout the city. 1515
 (rhs)")
16 The following totals include vacant sites suitable for the construction of single residential dwellings, unit developments and rural-residential properties (rhs) (rhs) 1616
17 1717
18 1818
19 1919

20 CONSTRUCTION STATISTICS Source: id.com

 2014-15 At 30")

21 FORECAST POPULATION AND DWELLINGS New dwellings required per year Existing Lots (excluding aged) At 30 June Potential future lots 4, years supply

22 commercial SNAPSHOT 11 industrial lots produced. 89 vacant industrial lots. The majority, (74%) of vacant industrial lots are at East Wagga Wagga. 30 vacant commercial lots. Non-residential construction was 50% lower than the year before and below the long term average. Fitzmaurice Street is the commercial/services sector and Baylis Street is the main retail precinct. 2222


23 KEY FINDINGS COMMERCIAL LAND As of 30 June 2014 there At 30 June 2014, of the 89 The Fitzmaurice Street were 30 vacant vacant industrial lots 74% area is the commercial/ commercial land parcels in were located in the East services sector of the CBD the city, four had been Wagga Wagga area. while Baylis Street is the developed during main retail precinct. Over the last 2 years industrial land had been relatively consistent with 10 lots produced in , 11 lots produced in and 1 lot built on each year. Non-residential construction cost has There are 8 shopping fluctuated over the last 6 malls and arcades in the years was 50% CBD. below the previous year and about 30% below the 6 year average. 2323
24 2424
25 2525
26 2626


27 RETAIL & COMMERCIAL FLOORSPACE EXISTING AT 30 JUNE

28 2828
LAND MONITOR REPORT
 LAND MONITOR REPORT 2015-2016 contents Introduction 3 Housing Industry Association Wagga Branch 3 Definitions 4 Accuracy & Data Interpretation 5 Disclaimer 5 Opteon Southern Inland NSW 5 Residential Land
LAND MONITOR REPORT
 2016-2017 LAND MONITOR REPORT Wagga Wagga Land Monitor Report 2016-2017 Contents Introduction 3 Housing Industry Association Wagga Branch 3 Definitions 4 Accuracy & Data Interpretation 5 Disclaimer 5 Opteon
Toowoomba Property Factsheet
 Toowoomba Property Factsheet 1st Half 2018 OVERVIEW Located 125 kilometres west of Brisbane s CBD, Toowoomba is the main urban centre for the Toowoomba Regional area. In 2016 the labour force (59.6%) was
Quarterly Review The Australian Residential Property Market and Economy
 Quarterly Review The Australian Residential Property Released January 2018 Contents Introduction 3 Housing Market 4 Mortgage Lending 11 Housing Supply 17 Demographic Overview 20 Household Finances 22 National
Creswick Property Factsheet
 Creswick Property Factsheet 1st Half 2018 OVERVIEW Creswick, located 129km north west of Melbourne is 430m above sea level. A population of 3,170 was recorded in the 2016 ABS census. The area provides
Alexandria Property Factsheet
 Alexandria Property Factsheet 1st Half 2018 OVERVIEW Alexandria is an inner-eastern Sydney suburb located approx. 4km south of the Sydney CBD. Formerly recognised as an industrial suburb, it is now growing
Ingleburn Property Factsheet
 Ingleburn Property Factsheet 1st Half 2018 OVERVIEW Ingleburn is a suburb situated approx. 44 kilometres from the Sydney CBD. This small hub is an ideal location for families and professionals due to its
MONTHLY RESEARCH BULLETIN SEPTEMBER 2016
 MONTHLY RESEARCH BULLETIN SEPTEMBER 2016 ABOUT REIV The Real Estate Institute of Victoria has been the peak professional association for the Victorian real estate industry since 1936. Over 2,000 real estate
Comparative Market Analysis
 Australian Buyers Agent Services L29 Chifley Tower, Sydney, NSW, 2000 Ph: 1300 319 809 Comparative Market Analysis Contact Details Australian Buyers Agent Services Mobile: 1300 319 809 Email: info@austbas.com.au
Comparative Market Analysis
 Comparative Market Analysis Generated by: Mark Attard FinancePath ACL 388674 Level 1, Suite 9 The Central, 1Ricketts Road Mt Waverley, VIC 3149 Mobile: Email: Phone: 0408 233 200 mattard@financepath.com.au
Domain Rental Report September Quarter 2016
 Domain Rental Report September Quarter 2016 Dr Andrew Wilson Chief Economist for Domain.com.au Key findings House rents in Sydney, Melbourne, Brisbane, Adelaide and Darwin all remain steady Canberra is
Suburb Profile Report. Paddington, 2021 NSW
 Suburb Profile Report Paddington, 2021 NSW October 2018 About Sound Property Group Sound Property Group is a property investment and education company specialised in sourcing strategic real estate opportunities,
Bargara Property Factsheet
 Bargara Property Factsheet 1st Half 2018 OVERVIEW Bargara* is located in the Bundaberg Region of south-east Queensland, approximately 384km north of Brisbane s CBD. Over the last 7 years the population
80 Baptist Street Redfern NSW RP AUTOVAL Automated Valuation
 RP AUTOVAL Automated Valuation Prepared On February 203 PROPERTY DESCRIPTION ESTIMATED VALUE: Estimated Price Range: FSD* + - 5% $955,000 $80,000 - $,095,000 (Forecast Standard Deviation) This estimate
28 Dimboola Road Nhill VIC RP AUTOVAL Automated Valuation
 RP AUTOVAL Automated Valuation Prepared On 0 March 08 PROPERTY DESCRIPTION ESTIMATED VALUE: Estimated Price Range: FSD* + - 6% $98,47 $8,678 - $4,75 (Forecast Standard Deviation) This estimate value has
Comparative Market Analysis
 Paul Pappas, Suite 2, Level 2, 88 Pitt Street, Sydney NSW 2000 Ph: 02 9231 0511 Comparative Market Analysis Report Powered by Contact Details Paul Pappas Mobile: 0411 877 662 Email: paul.pappas@mortgagechoice.com.au
Local Government Area Statistics Report Suburban Melbourne
 Generated by: Investors Choice Mortgages Australian Credit Licence # 391985 VIC Contact Details Jane Slack Smith Local Government Area Statistics Report Suburban Melbourne Mobile: 0432 687 560 Ph: 1800
DETAILED PROPERTY REPORT 20/03/ /125 Sample Street, Sampleville
 DETAILED PROPERTY REPORT 20/03/2012 1/125 Sample Street, Sampleville PROPERTY DETAILS 1/125 Sample Street, Sampleville ESTIMATED VALUE $923,524 Estimated Value Range $799,884 - $1,047,163 3 2 1 Primary
CoreLogic RP Data June Rental Index Results
 Rental Review Snapshot Released: July 10, 2015 & recorded the greatest annual increases in weekly rents while rents in, & continue to decline. capital city rental rates fell by -0.2% in June The rate of
Local Government Area Statistics Report Suburban Brisbane
 Generated by: Investors Choice Mortgages Australian Credit Licence # 391985 VIC Contact Details Jane Slack Smith Local Government Area Statistics Report Suburban Brisbane Mobile: 0432 687 560 Ph: 1800
SHOALHAVEN CITY COUNCIL GROWTH OVERVIEW FUTURE DEVELOPMENTS**
 Number of Sales Median Price OVERVIEW Sanctuary Point is located approx. 2km of Sydney. The area is home to predominately elderly couples and well established families seeking a relaxed lifestyle. The
CITY OF GREATER GEELONG LGA GROWTH OVERVIEW FUTURE DEVELOPMENTS**
 Number of Sales Median Price OVERVIEW As the second largest city in Victoria, Geelong provides an alternate option for those looking for an affordable city lifestyle outside of Melbourne. Geelong has developed
New Plymouth District Council 1 of 23
 New Plymouth District Council 1 of 23 Contents Executive Summary... 4 Introduction... 4 Purpose of this Quarterly Report... 4 First Quarterly Report... 5 New Plymouth District... 5 New Plymouth District
Ashmore & Molendinar Property Factsheet
 Ashmore & Molendinar Property Factsheet 1st Half 2018 OVERVIEW Ashmore is a suburb in Gold Coast, located 5 kilometer west of Surfers Paradise. In the 2016 census, Ashmore recorded a population of 11,910
Information Memorandum
 Information Memorandum Frenchs Forest 67-75 Dareen Street 320-328 Warringah Road Agent - Stuart Bath 0416 207 215 INFORMATION Memorandum Sections 1 Executive Summary 2 About the property 3 Northern Beaches
Special Report. Australia s Cheapest Suburbs with the Greatest Potential for Capital Growth. For more reports head to
 Demand Supply Ratio Market Report Special Report Australia s Cheapest Suburbs with the Greatest Potential for Capital Growth Market: Australia Created by: hotspotcentral.com.au Contact: t: 1300 200 340
Individual Property Report. Cambooya Toowoomba, QLD 4358, Australia
 Individual Property Report Address: Cambooya Toowoomba, QLD 4358, Australia Contents Your Property Risk Summary Property Details Suburb Metrics Market Overview Equity Risk Factors Cash Flow Risk Rating
Rental report. December Quarter Dr Andrew Wilson Senior Economist for the Domain Group
 Rental report December Quarter 2014 Dr Andrew Wilson Senior Economist for the Domain Group Key findings Rents remain at or near record levels in most capitals rents surge to peak levels despite record
CoreLogic RP Data November Rental Index Results
 Rental Review Snapshot Released: December 3, 2015 Capital city rental growth lowest on record over the past twelve months Weekly rents across the combined capital city measure were unchanged in November
Domain House Price Report March Quarter 2016
 Domain House Price Report March Quarter 2016 Dr Andrew Wilson Chief Economist for Domain Key findings Sydney median house price drops below $1 million House and unit prices are down in Sydney, Brisbane,
Residential Commentary Sydney Apartment Market
 Residential Commentary Sydney Apartment Market April 2017 Executive Summary Sydney Apartment Market: Key Indicators 14,200 units are currently under construction in Inner Sydney with completion expected
Hunter Valley Property Factsheet
 Hunter Valley Property Factsheet 1st Half 2018 *IMAGE* 6.5cm HIGH 10.6cm WIDE OVERVIEW The Hunter Valley is 2 hours north of Sydney and is also just 40 minutes from Newcastle. The region is well-known
Domain.com.au House Price Report December Quarter 2015
 Domain.com.au House Price Report December Quarter 2015 Dr Andrew Wilson Senior Economist for Domain.com.au Key findings Record drop in Sydney median house prices over the December quarter Melbourne and
Special Report. Australia s Cheapest Suburbs with the Greatest Potential for Capital Growth. For more reports head to
 Special Report Australia s Cheapest Suburbs with the Greatest Potential for Capital Growth Market: Australia Compilation date: May 2013 Created by: Redwerks Pty Ltd Contact: 1300 200 340 For more reports
EDITION 1 GEELONG REGIONAL CENTRE REVIEW GEELONG 2017 MARCH
 2017 EDITION 1 GEELONG REGIONAL CENTRE REVIEW 2017 MARCH GEELONG GEELONG AT A GLANCE OVERVIEW MAJOR GOVERNMENT FUNDED PROJECTS National Disability Insurance Agency Headquarters / Department of Human Services
*IMAGE* 6.5cm HIGH 10.6cm WIDE
 Number of Sales Median Price *IMAGE* 6.5cm HIGH 1.6cm WIDE Hobart OVERVIEW and it s surrounds have never experienced price growth quite like we are seeing. Demand is being driven by young owner/occupiers
Top 10 Predictions Perth
 Perth Data for the Quarter Ending July 2014 #1 Secret Harbour Houses 6173 * 5.27% pa. 0.89% 7.92% 2.41% 9+ %pa. 8+ %pa. Sale Count 90 Median Value $501,500 5 years 8 years Median Rent $500 /wk Jul 14-Aug
Residential Market Snapshot Podgorica. August 2017
 PURPOSE OF THE RESEARCH The aim of our residential real estate market research was to analyse the actual apartment supply in Podgorica, having used the advertisements of the largest real estate portal
House price report. December quarter Dr Andrew Wilson Senior Economist for the Domain Group
 December quarter 2014 Dr Andrew Wilson Senior Economist for the Domain Group Key findings Capital city house prices increased over the December quarter with remaining the runaway leader December quarter
Retail shopping centres
 Retail shopping centres Introduction Retail can be defined as the sale of goods and commodities to consumers, usually in smaller quantities as opposed to wholesale. This activity is usually confined to
CoreLogic RP Data Property Market Indicator Summary All data to week ending 30 August 2015
 Final week of winter returns high auction volumes and a strong clearance rate For the last week of winter, the preliminary auction clearance rate was 75.4 per cent, with 2,583 auctions held across Australia
Domain House Price Report
 Domain House Price Report June Quarter 2016 Dr Andrew Wilson Chief Economist for Domain Key findings median house price back up over $1 million Median house prices hit new record in Melbourne, and, with
MONTHLY RESEARCH BULLETIN DECEMBER 2016
 MONTHLY RESEARCH BULLETIN DECEMBER 2016 ABOUT REIV The Real Estate Institute of Victoria has been the peak professional association for the Victorian real estate industry since 1936. Over 2,000 real estate
Assessment-To-Sales Ratio Study for Division III Equalization Funding: 1999 Project Summary. State of Delaware Office of the Budget
 Assessment-To-Sales Ratio Study for Division III Equalization Funding: 1999 Project Summary prepared for the State of Delaware Office of the Budget by Edward C. Ratledge Center for Applied Demography and
Appendix 1: Gisborne District Quarterly Market Indicators Report April National Policy Statement on Urban Development Capacity
 Appendix 1: Gisborne District Quarterly Market Indicators Report April 2018 National Policy Statement on Urban Development Capacity Quarterly Market Indicators Report April 2018 1 Executive Summary This
CoreLogic Quarterly Rental Review
 CoreLogic Quarterly Rental Review December Quarter 2018 Copyright 2019 RP Data Pty Ltd trading as CoreLogic Asia Pacific (CoreLogic) and its licensors are the sole and exclusive owners of all rights, title
Residential Commentary - Perth Apartment Market
 Residential Commentary - Perth Apartment Market March 2016 Executive Summary The Greater Perth apartment market has attracted considerable interest from local and offshore developers. Projects under construction
PIA would be pleased to meet with the Department to outline any aspect of our submission. Please contact myself or John Brockhoff on
 31 January 2018 Deborah Brill Director, Housing and Infrastructure Policy Department of Planning and Environment PO Box 39 SYDNEY NSW 2001 Dear Deborah, PIA Submission: Affordable Housing SEPP 70 Amendments
Domain Rental Report June Quarter 2015
 Domain Rental Report June Quarter 2015 Dr Andrew Wilson Senior Economist for the Domain Group Key findings Rents remain at or near record levels in most Australian capital cities house rents surge 1.9
State of the Market Report
 State of the Market Report Dr Andrew Wilson Senior Economist for the Domain Group Sydney About us Domain Group Domain Group, a Fairfax Media real estate business, is a leading supplier of multi-platform
SAVILLS VIETNAM HA NOI DA NANG HCMC. The most innovative Advisory Services in Viet Nam. Over 22 years First to Market. 68,000 sqm Leased in 2016
 SAVILLS VIETNAM HA NOI Over 22 years First to Market The most innovative Advisory Services in Viet Nam DA NANG 68,000 sqm Leased in 2016 US$ 200 mil 2016 residential sales Over USD 100M pa Number one for
RESIDENTIAL RESEARCH A REVIEW OF KEY RESIDENTIAL INDICATORS ACROSS MAJOR AUSTRALIAN CITIES
 RESIDENTIAL RESEARCH A REVIEW OF KEY RESIDENTIAL INDICATORS ACROSS MAJOR AUSTRALIAN CITIES Aug-17 Feb-18 Aug-18 Economic growth was recorded at 3.1 growth in March 2018. Unemployment across Australia was
SA Property Landscape
 SA Property Landscape Foreword Real estate and its supplier industries are critical to South Australia s economy. Therefore Land Services SA and BDO are pleased to provide the South Australian Property
NZ property report OCTOBER 2016
 NZ property report OCTOBER 2016 Report Definitions Sales by registration type; rolling three month, year-on-year growth This data set provides an insight into who is active in the market compared to the
Suburb Profile Report
 Prepared on: Prepared for: 3 September 08 Sample Report COLLINGWOOD.4km Distance from GPO 8.5k Population 3.6% 5 year population change 9 years Average length of ownership The size of Collingwood is approximately.3
Auckland Council Quarterly Monitoring Report
 Auckland Council Quarterly Monitoring Report for the National Policy Statement on Urban Development Capacity June 2018 2018 Auckland Council Prepared by the Land Use, Infrastructure Research and Evaluation
Special Property Hotspot Report
 Special Property Hotspot Report Australia s Cheapest Suburbs with the Greatest Potential for Capital Growth for 2015 Market: Australia Created by: hotspotcentral.com.au Contact: t: 1300 200 340 For more
UDIA WA DEVELOPMENT JUNE 2018
 UDIA WA DEVELOPMENT JUNE 218 UDIA (WA) The UDIA provides market research and in-depth analysis of the urban development industry and property market. To download this report and other UDIA research visit
Housing affordability in England and Wales: 2018
 Statistical bulletin Housing affordability in England and Wales: 2018 Brings together data on house prices and annual earnings to calculate affordability ratios for national and subnational geographies
FY2012 RESULTS PRESENTATION
 FY2012 RESULTS PRESENTATION 21 August 2012 INVESTMENT HIGHLIGHTS Proven track record of consistent earnings growth and meeting targets Strategically located and diverse residential portfolio Urban and
Inner Perth Residential Market Report
 Inner Perth Residential Market Report MARCH QUARTER 2014 Inner Perth Residential Market Market Highlights While Western Australia will experience slowed short term growth as the state transitions from
2011 ASSESSMENT RATIO REPORT
 2011 Ratio Report SECTION I OVERVIEW 2011 ASSESSMENT RATIO REPORT The Department of Assessments and Taxation appraises real property for the purposes of property taxation. Properties are valued using
House price report. September quarter Dr Andrew Wilson Senior Economist for the Domain Group
 September quarter 2014 Dr Andrew Wilson Senior Economist for the Domain Group Key findings Most capital city housing markets recorded falls in house prices over the September quarter September quarter
An Assessment of Sydney s Industrial Land Supply. A shortage of developable land has the potential to impact occupier location strategies
 An Assessment of Sydney s Industrial Land Supply A shortage of developable land has the potential to impact occupier location strategies At 4Q17 3 years 4.1% 37% 4 years Gross-take up above 1 million sqm
Census Tract Data Analysis
 Data Analysis Study Area: s within the City of Evansville, Indiana Prepared For Mr. Kelley Coures City of Evansville Department of Metropolitan Development 1 NW MLK Jr. Boulevard Evansville, Indiana 47708
Briefing Office and retail
 Savills China Research Dalian Briefing Office and retail August 218 Image: Labor Park, Qingniwa Area, Zhongshan District SUMMARY A lack of new supply saw rents and occupancy rates in both the Grade A office
Industry Insights and Trends Data to 30 November 2017
 NSW Clubs Industry Insights and Trends Data to 30 November 2017 24 th January 2018 The contents of this document are primarily based on the NSW Clubs State Gaming Rankings data up to and including the
Strata Plan Fast Facts
 December 2015 ISSN: 2201-4292 Title: Strata Plan Fast Facts ISSN: 2201-4292 Land and Property Information www.lpi.nsw.gov.au Copyright Crown in right of New South Wales through Land and Property Information
Housing Need and Demand Study
 Housing Need and Demand Study Consultants Arcangela Roy Keith Harriman What is a Housing Need and Demand Study? The purpose to establish the current and emerging housing needs of a community. It addresses
Miami-Dade County Office Market Report 1Q Real Capital Partners Real Estate Services
 -Dade County Office Report 1Q 216 Real Capital Partners Real Estate Services 1Q 216 -Dade County Office Report Overview -Dade County s Vacancy Increases to 1.4% Net Negative (11,64) SF in the Quarter The
SAVILLS VIETNAM HA NOI DA NANG HCMC. The most innovative Advisory Services in Viet Nam. Over 22 years First to Market. 68,000 sqm Leased in 2016
 SAVILLS VIETNAM HA NOI Over 22 years First to Market The most innovative Advisory Services in Viet Nam DA NANG 68,000 sqm Leased in 2016 US$ 200 mil 2016 residential sales Over USD 100M pa Number one for
THE VALUATION OF LAND UNDER ROADS
 A Coalface Discussion Paper Introduction We are aware of 5 different suggested methodologies for the valuation of land under roads 1, and in this paper we have sought to summarise each method, and to compare
Economic Significance of the Property Industry to the. WELLINGTON Economy PREPARED FOR PROPERTY COUNCIL NEW ZEALAND BY URBAN ECONOMICS
 Economic Significance of the Property Industry to the WELLINGTON Economy PREPARED FOR PROPERTY COUNCIL NEW ZEALAND BY URBAN ECONOMICS 2016 ABOUT PROPERTY COUNCIL NEW ZEALAND Property Council New Zealand
HOUSING AFFORDABILITY
 HOUSING AFFORDABILITY 2016 A study for the Perth metropolitan area Research and analysis conducted by: In association with industry experts: And supported by: Contents 1. Introduction...3 2. Executive
26 February 2013 FIRST HALF RESULTS PRESENTATION
 26 February 2013 FIRST HALF RESULTS PRESENTATION Investment highlights Proven track record of consistent earnings growth and meeting targets Strategically located and diverse residential portfolio Urban
Monthly Indicators. June Monthly Snapshot + 5.0% % + 6.6%
 Monthly Indicators 2017 Although sales have been robust locally, there has been a general slowdown in sales across much of the country, and this cannot be blamed on negative economic news. Wage growth,
Market Commentary Perth CBD Office
 Market Commentary Perth CBD Office November 2016 Executive Summary The vacancy rate at 3Q16 is 24.7%, reflecting a quarterly increase of 0.1 percentage points. Two office projects are under construction
Housing market report
 Capital city market report Prepared September Dr Andrew Wilson, Senior Economist Australian Property Monitors No sign of winter pause as housing markets gather strength into spring National overview Buyer
Update. Property Market. ljhcommercial.com.au Canberra. Canberra Industrial Market - December 2013
 Industrial Market - December 2013 This is a guide to the industrial market conditions in the Australian Capital Territory, including nearby Queanbeyan across the border in New South Wales. With a population
Economy. Denmark Market Report Q Weak economic growth. Annual real GDP growth
 Denmark Market Report Q 1 Economy Weak economic growth In 13, the economic growth in Denmark ended with a modest growth of. % after a weak fourth quarter with a decrease in the activity. So Denmark is
The Honorable Larry Hogan And The General Assembly of Maryland
 2015 Ratio Report The Honorable Larry Hogan And The General Assembly of Maryland As required by Section 2-202 of the Tax-Property Article of the Annotated Code of Maryland, I am pleased to submit the Department
6.5 % p.a. Minimum investment $50,000.
 AN AWARD-WINNING AUCKLAND OFFICE PROPERTY INVESTMENT OPPORTUNITY 6.5 % projected pre-tax cash return.* p.a. Minimum investment $50,000. 585 interests available. 33 CORINTHIAN DRIVE, ALBANY, AUCKLAND *
OFFICE QUICK STATS SUMMARY & OUTLOOK MARKET TRENDS VACANCY & NET ABSORPTION ECONOMIC STATS
 LOS ANGELES SAN GABRIEL VALLEY OFFICE SECOND QUARTER 218 QUICK STATS Direct Vacancy 11.1% Overall Vacancy 11.4% Lease Rate FSG $2.32 Gross Absorption Under Construction MARKET TRENDS Current Quarter 345,68
April 12, The Honorable Martin O Malley And The General Assembly of Maryland
 April 12, 2011 The Honorable Martin O Malley And The General Assembly of Maryland As required by Section 2-202 of the Tax-Property Article of the Annotated Code of Maryland, I am pleased to submit the
Has The Office Market Reached A Peak? Vacancy. Rental Rate. Net Absorption. Construction. *Projected $3.65 $3.50 $3.35 $3.20 $3.05 $2.90 $2.
 Research & Forecast Report OAKLAND METROPOLITAN AREA OFFICE Q1 Has The Office Market Reached A Peak? > > Vacancy remained low at 5. > > Net Absorption was positive 8,399 in the first quarter > > Gross
Economic Significance of the Property Industry to the. OTAGO Economy PREPARED FOR PROPERTY COUNCIL NEW ZEALAND BY URBAN ECONOMICS
 Economic Significance of the Property Industry to the OTAGO Economy PREPARED FOR PROPERTY COUNCIL NEW ZEALAND BY URBAN ECONOMICS 2016 ABOUT PROPERTY COUNCIL NEW ZEALAND Property Council New Zealand is
HOTSPOTS REPORT PROPERTY WATCH REPORT. SYDNEY 2 nd HALF 2015
 HOTSPOTS REPORT PROPERTY WATCH REPORT SYDNEY 2 nd HALF 2015 GOLD COAST Surfers Paradise Fourth Quarter 2013 SYDNEY HOTSPOTS July December 2015 MARKET CONDITIONS 2015 This Sydney Hotspot Report analyses
INDUSTRIAL QUICK STATS SUMMARY & OUTLOOK MARKET TRENDS VACANCY & NET ABSORPTION ECONOMIC STATS
 ORANGE COUNTY INDUSTRIAL FOURTH QUARTER 217 QUICK STATS Direct Vacancy 2.3% Overall Vacancy 2.7% Lease Rate NNN $.91 Gross Absorption Under Construction MARKET TRENDS Current Quarter 4,283,991 SF 963,138
Dwelling Stock and Diversity in the City of Melbourne
 Melbourne City Research Dwelling Stock and Diversity in the City of Melbourne September, 2012 www.melbourne.vic.gov.au Contents Dwelling Stock and Diversity in the City of Melbourne 1 1. Introduction 6
LSL New Build Index. The market indicator for New Builds March Political events
 LSL New Build Index The market indicator for New Builds March 2018 In the year to end February 2018 new build house prices rose on average by 9.7% across the UK which is up on last year s figure of 5.3%
Kitchens and Bathrooms Report
 HIA GWA Kitchens & Bathrooms Past Growth and Future Prospects Housing Industry Association Kitchens and Bathrooms Report Past Growth and Future Prospects March 2018 HIA Economics 79 Constitution Avenue
Miami-Dade County Office Market Report 4Q Real Capital Partners Real Estate Services. *Data Source CoStar Miami-Dade County Office Market Report
 Miami-Dade County Office Market Report 4Q 216 Real Capital Partners Real Estate Services *Data Source CoStar Miami-Dade County Office Market Report 4Q 216 Miami-Dade County Office Market Report Overview
RP Data chart pack. November 2014
 RP Data chart pack November 2014 Macro housing market indicators 2 Residential real estate underpins Australia's wealth Residential Real Estate $5.6 Trillion Australian Superannuation $1.8 Trillion Australian
OFFICE QUICK STATS SUMMARY & OUTLOOK MARKET TRENDS VACANCY & NET ABSORPTION ECONOMIC STATS
 LOS ANGELES NORTH OFFICE FOURTH QUARTER 217 QUICK STATS Direct Vacancy 11.8% Overall Vacancy 12.5% Lease Rate FSG $2.75 Gross Absorption Under Construction MARKET TRENDS Current Quarter 1,6,941 SF 89,158
INDUSTRIAL QUICK STATS SUMMARY & OUTLOOK MARKET TRENDS VACANCY & NET ABSORPTION ECONOMIC STATS
 VENTURA COUNTY INDUSTRIAL FOURTH QUARTER 217 QUICK STATS Direct Vacancy 2.1% Overall Vacancy 2.4% Lease Rate NNN $.7 Gross Absorption Under Construction MARKET TRENDS Current Quarter 1,332,957 SF 774,362
Affordability 4 Years On
 Affordability 4 Years On Measuring Affordability Levels in Abu Dhabi UAE 2018 Affordability 4 Years On 2018 Colliers International 1 Definition of Affordable Housing: The definition of affordable housing
CONVEYANCING FEES IN A COMPETITIVE MARKET
 CONVEYANCING FEES IN A COMPETITIVE MARKET Joanne Baker December 1996 JUSTICE RESEARCH CENTRE ISBN 0 909136 60 2 Law Foundation of New South Wales December 1996 Published by the Law Foundation of New South
Independent Market Operator 8 September 2015 Manager System Capacity PO Box 7096 Cloisters Square PERTH WA 6850
 Your Ref: Purchase Order 60144 Our Ref: Job:180148 (DC) File:29425-2010 Enquiries: Darren Criddle Ph: 9273 9026 E-mail: Darren.Criddle@landgate.wa.gov.au Independent Market Operator 8 September 2015 Manager
CoStar Office Statistics. Y e a r - E n d Portland Office Market
 CoStar Office Statistics Y e a r - E n d 2 0 1 7 Year-End 2017 Portland Table of Contents Table of Contents................................................................. A Methodology......................................................................
Table of Contents. Appendix...22
 Table Contents 1. Background 3 1.1 Purpose.3 1.2 Data Sources 3 1.3 Data Aggregation...4 1.4 Principles Methodology.. 5 2. Existing Population, Dwelling Units and Employment 6 2.1 Population.6 2.1.1 Distribution