PropertyShark.com. Foreclosure Report, May 2008
|
|
|
- Gilbert Chandler
- 5 years ago
- Views:
Transcription

1 PropertyShark.com Foreclosure Report, 28
2 Monthly Foreclosure Report, 28 PropertyShark.com provides real estate professionals and investors with comprehensive property information, including owner name and phone number, building details, comparable sales, foreclosure listings, zoning, violations, maps, mailing lists, and photos. PropertyShark.com offers the transparency essential to evaluate real estate and make informed decisions. For a free basic account, visit In this monthly report, PropertyShark.com provides charts, tables, and metrics about residential foreclosures (a.k.a. trustee sales) in four key metro areas (New York City, Miami, Los Angeles, and Seattle). The time period includes numbers from the past two years, with emphasis on 28. For the purposes of this report, a foreclosure is defined as a property scheduled for auction for the first time during the period. The report focuses on new foreclosures rather than properties that have been in and out of foreclosure or those that have had auctions postponed. Key Takeaways Los Angeles foreclosures set a monthly record; New York City and Seattle foreclosures decline from last month: The number of newly scheduled trustee sales in Los Angeles County surged 17% from il 28, setting a two-year record with 5,38 new trustee sales. New foreclosures in Miami remained flat while New York City and Seattle saw a decrease when compared to the previous month. Los Angeles, Miami, Seattle and NYC foreclosures all up big over 27: The number of new foreclosures were up over 27 by 233% in Los Angeles, 73% in Miami, 68% in Seattle, and 5% in New York City. The foreclosure epicenter in New York City is District 12 in Queens: District 12 in Queens (Jamaica, South Jamaica, Hollis and St. Albans) had 8 new foreclosure auctions scheduled in 28. Foreclosures in this Queen s community district eclipses the entire boroughs of Brooklyn (55 new auctions) and Staten Island (47) for the month. Total lien amount in Los Angeles County approaches $2 billion: In Los Angeles County, the sum of the lien amounts for properties scheduled for trustee sale in 28 was $1,964,112,58, just shy of the $2 billion mark. Note: All data is aggregated from government records and legal notices and is supplied as-is for informational purposes. It should not be used for purposes of making investment decisions. In this report, a foreclosure is defined as a property scheduled to have a foreclosure auction take place during the period for the first time. It focuses on new foreclosures rather than properties that have been in and out of foreclosure or those that had auctions delayed or postponed. Lien amounts are not always known. PropertyShark.com will not be liable for any losses or damages arising from or in any way related to this report, including without limitation any errors therein. 2
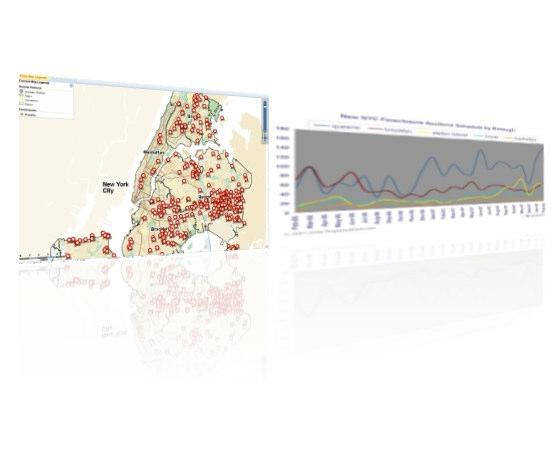
3 Four County Comparison (Los Angeles, Miami, NYC, Seattle) Monthly Foreclosure Report, 28 Comparison to il 28 Los Angeles County foreclosure numbers surged up 17% from il 28, once again breaking its record for new monthly foreclosure auctions. The number of new foreclosures in Miami-Dade county remained flat when compared to the previous month. Nevertheless, the current number of 882 new foreclosures represents a twoyear high for Miami. Both New York City (down 4.9%) and Seattle (down 16.2%) saw a decline in new foreclosures. New Residential Foreclosures, 28 Los Angeles 538 Miami 882 New York City 313 Seattle Foreclosures/Household, 28 Los Angeles.169% Miami.114% New York City.1% Seattle.23%.%.2%.4%.6%.8%.1%.12%.14%.16%.18% % Change 27 New York City % Seattle % Los Angeles 1,599 1,397 1,715 1,897 1,79 2,154 2,443 2,3 3,868 2,537 2,478 4,544 5, % Miami % Comparison to 27 All four regions saw their numbers go up when compared to the same month last year, with Los Angeles foreclosures rocketing up 232.6%, Miami up 72.9%, Seattle up 68.4%, and New York City up 49.8%. Foreclosures/Household Los Angeles and Miami had the highest monthly foreclosure rate per household. The Los Angeles rate was 28% higher than Miami, 439% higher than Seattle, and 1229% higher than New York City. New York City New York City New York City new foreclosures (313) saw a second consecutive month of decline, down 4.86% from il 28 (329). However, the number of foreclosures is high New NYC Foreclosure Auctions Scheduled compared to its 27 monthly 2 average, and was up 49.8% 15 compared to 27 (29). 1 Single and two-family dwellings 5 located predominantly in the boroughs of Queens and -6 Brooklyn were the most common property types scheduled for auction. 3

4 Monthly Foreclosure Report, 28 While most of New York City has e s c a p e d t h e a s t r o n o m i c a l foreclosure activity seen nationwide, some areas like the neighborhoods of Jamaica, South Jamaica, Hollis and St. Albans are in dire shape, with a foreclosure rate per household 21 times higher than the city a v e r a g e. Ashleigh Rose C l a r k, D a t a Acquisition Manager PropertyShark.com NYC Borough Overview Q u e e n s ( d o w n 8. 3 % ) experienced the most noticeable improvement in new foreclosure counts in 28 compared to the previous month. Despite this, the borough remains responsible for most of New York City s foreclosure activity, compiling 56% of all new scheduled auctions. Compared to 27, Staten Island (up 161%) saw the highest climb in new foreclosures among the five boroughs, followed by Queens (up 113%) and Manhattan (up 16%). A positive surprise came from the boroughs of Brooklyn (down 13%) and The Bronx (down 39%) which saw foreclosures decline considerably compared to 27. Building Type New Foreclosures Average Lien Total Lien Two Families 129 $479,732 $6,926,31 Single Family 118 $368,214 $42,712,857 Three or More Families 37 $516,133 $16,,124 Condo 15 $316,633 $4,749,59 Coop 14 $534,572 $5,345,729 Total 313 $433,893 $129,734,25 New NYC Foreclosure Auctions Scheduled by Borough Queens Brooklyn Staten Island Bronx Manhattan Borough Queens Brooklyn Staten Island Bronx Manhattan NYC Total Jamaica 11434, Queens, NYC Address: Road Loan Amount $288,434 Sq. Ft.: 1,76 Built: 1925 Foreclosures Per Household Staten Island continues to show the highest percentage of foreclosures per household among the five boroughs, 352% higher than Brooklyn, 573% higher than the Bronx and 1389% higher than Manhattan. Borough New Foreclosures Households Foreclosures/ Staten Island ,.28% Queens ,.23% Brooklyn ,.6% Bronx 2 473,.4% Manhattan ,.2% Total 313 3,18,.1% 4

5 Monthly Foreclosure Report, 28 Top 15 zip codes in New York City: District 12 in Queens (Jamaica, South Jamaica, Hollis, and St. Albans) had seven zip codes in the top 15, as well as the top three. Zip Code Neighborhood Borough New Foreclosures Total Lien Average Lien The aggregate amount of all liens from Los Angeles County properties scheduled for trustee sale for the first time in 28 is shockingly close to $2 billion, underlying the severity of the housing crisis in this region. Robert Sarb, Product Manager, PropertyShark.com Jamaica, South Jamaica, Hollis, St. Albans Queens 2 $8,369,847 $418, Jamaica, South Jamaica, Hollis, St. Albans Queens 12 $4,81,549 $34, Jamaica, South Jamaica, Hollis, St. Albans Queens 12 $5,79,271 $423, East New York, New Lots, City Line, Starrett City Brooklyn 9 $3,12,881 $344, Jamaica, South Jamaica, Hollis, St. Albans Queens 8 $2,837,51 $45, Woodhaven, Richmond Hill, Kew Gardens Queens 8 $3,892,552 $486, The Rockaways, Broad Channel Queens 8 $3,589,9 $448, Jamaica, South Jamaica, Hollis, St. Albans Queens 8 $2,393,335 $341, Howard Beach, Ozone Park, South Ozone Park Queens 8 $3,938,319 $492, Jamaica, South Jamaica, Hollis, St. Albans Queens 8 $3,735,193 $466, North Island Staten Island 7 $3,7,538 $433, North Island Staten Island 7 $2,261,99 $526, Laurelton, Cambria Heights, Queens Village, Glen Oaks Queens 7 $3,6,917 $582, Jamaica, South Jamaica, Hollis, St. Albans Queens 6 $3,433,373 $53, Bedford Stuyvesant, Tompkins Park North, Stuyvesant Brooklyn 6 $3,173,98 $353,572 Los Angeles Los Angeles The number of newly scheduled trustee sales in Los Angeles County surged 17% from il 28 and 232% from 27, setting a two-year record with 5,38 new trustee sales. The total lien amount was just shy of $2 billion. New Foreclosure Auctions in Los Angeles Monthly Change Los Angeles County 1,599 1,397 1,715 1,897 1,79 2,154 2,443 2,3 3,868 2,537 2,478 4,544 5, % Woodland Hills, CA Address: 4957 Alatar Drive Loan Amount $1,352, Bed/Baths: 5/5 Sq. Ft.: 4,79 Built: 1998 Top 15 Zip Codes in Los Angeles While zip codes in the Palmdale/Lancaster area continue to have the highest number of foreclosures, we have seen a troubling increase in foreclosures in some of the priciest zip codes of the county. The number of owners with a lien against their properties over $1 million reached 7 this month, more than double the average monthly number seen in the past 12 months. Zip Code City New Trustee Sales Average owed* 9355 Palmdale 233 $258, Lancaster 183 $255, Quartz Hill 114 $293, Palmdale 111 $355, Lancaster 99 $239, Los Angeles 97 $388, Los Angeles 88 $351, Norwalk 87 $356, Los Angeles 84 $376, Los Angeles 8 $413, Lancaster 8 $283, Pomona 73 $325, Long Beach 7 $332, Los Angeles 61 $348,888 *Average owed when known 5
6 Monthly Foreclosure Report, 28 Miami Miami-Dade County The number of new foreclosures remained flat in 28 from the previous month (882), when it reached a two-year peak. Compared to 27, Miami- Dade County registered a 72.9% increase New Foreclosure Auctions in Miami -6 Monthly Change Miami-Dade % Top 15 zip codes in Miami Zip Code Neighborhood New Foreclosures Crossings, Kendall, Miami Homestead Miami, Perrine, Quail Heights, Country Lakes North Miami Beach Homestead, Leisure City, Naranja Miami Miami, Kendall West Hialeah, Miami Gardens, Miami Lakes East Perrine Miami Miami Miami Beach Miami Shores, North Miami Beach Miami Hialeah 18 Seattle New Foreclosure Auctions in Seattle Seattle There were 16 new foreclosure auctions scheduled in 28, down 16% from the 191 in il 28, but up by 68% compared to
7 Monthly Foreclosure Report, 28 Monthly Change Seattle % Top 1 zip codes in Seattle Zip Code Neighborhood New Foreclosures Average owed Columbia 1 $12, Auburn 9 $15, Seattle 8 $2, Covington, Kent, Lake Sawyer 7 $19, Kent 6 $43, Burien, Seatac, Seattle, Tukwila 6 $14, Algona, Auburn, Federal Way 6 $2, Four Corners, Maple Valley, Wilderness Village 5 $16, Enumclaw 4 $64, Des Moines, Normandy Park, Seatac, Redondo Beach 4 $119,681 7
PropertyShark.com. Foreclosure Report, Q Covering: Los Angeles, Miami, New York City, Seattle
 PropertyShark.com Foreclosure Report, Covering: Los Angeles, Miami,, Quarterly Foreclosure Report, PropertyShark.com provides real estate professionals and investors with comprehensive property information,
PropertyShark.com. Foreclosure Report, April Covering: Los Angeles, Miami, New York City, Seattle
 PropertyShark.com Foreclosure Report, il 29 Covering:, Miami,, Seattle Monthly Foreclosure Report, il 29 PropertyShark.com provides real estate professionals and investors with comprehensive property information
Foreclosure Report, July 2008
 Foreclosure Report, y 2008 provides real estate professionals and investors with comprehensive property information, including owner name and phone number, building details, comparable sales, foreclosure
PropertyShark.com Monthly Foreclosures Report
 PropertyShark.com Monthly Foreclosures Report February, 28 Scope: In this monthly report, PropertyShark.com provides charts, tables, and metrics about residential foreclosures (a.k.a. trustee sales) in
PropertyShark.com. Long Island Foreclosure Report, Q2 2009
 PropertyShark.com Long Island Foreclosure Report, Long Island Foreclosure Report, PropertyShark.com provides real estate professionals and investors with comprehensive property information, including owner
san francisco Report Q A quarterly analysis of residential sales in san francisco County
 san francisco Report Q2 2015 A quarterly analysis of residential sales in san francisco County 2 2-3 4 5 6 7-8 9 10 Highlights Residential Stats House versus Condo Sales Price Range Transaction Luxury
ARE DOB-ECB VIOLATIONS INCREASING?
 STATE OF NYC NEIGHBORHOODS ARE DOB-ECB VIOLATIONS INCREASING? A Closer Look at Ongoing Enforcement with DOB Compliance Data Are DOB-ECB Violations Increasing? 1 MAP OF NYC COMMUNITY BOARDS Bronx Brooklyn
The State of Renters & Their Homes
 FORECLOSURES FINDING #14 The number of pre-foreclosure notices issued to one- to four-unit properties and condominiums in 2015 fell from the previous year. Pre-foreclosure notices for one- to four-unit
1. Contract Authorization - Electrical Repair Services
 QUEENS LIBRARY BUILDINGS AND GROUNDS COMMITTEE THURSDAY, NOVEMBER 10, 2016 Central Library 89-11 Merrick Blvd., Jamaica, NY 11432 AGENDA 6:00 PM BUILDINGS AND GROUNDS COMMITTEE - REGULAR MEETING Hon. Robert
New Development Report
 New Development Report 2018 First Quarter MANHATTAN $ 2,513 $ 2,185 $ 2,152 3.7% YoY PER SQ. FT. ACTIVE PER SQ. FT. CONTRACT SIGNED PER SQ. FT. CLOSED 1% YoY 4.1% YoY BROOKLYN $ 1,475 PER SQ. FT. ACTIVE
Question of the Month: How would you summarize New York City s 2018 investments sales market? - by Shimon Shkury. February 19, New York City
 Question of the Month: How would you summarize New York City s 2018 investments sales market? - by Shimon Shkury February 19, 2019 - New York City Shimon Shkury, Ariel The NYC market saw dollar volume
Manhattan Rental Market Report August 2013 mns.com
 Manhattan Rental Market Report August 2013 TABLE OF CONTENTS 03 Introduction 04 A Quick Look 07 Mean Manhattan Rental Prices 11 Manhattan Price Trends 12 Neighborhood Price Trends 12 Battery Park City
Key Findings on the Affordability of Rental Housing from New York City s Housing and Vacancy Survey 2008
 Furman Center for real estate & urban policy New York University school of law n wagner school of public service 110 West 3rd Street, Suite 209, New York, NY 10012 n Tel: (212) 998-6713 n www.furmancenter.org
LUXURY MARKET REPORT. - March
 LUXURY MARKET REPORT - March 2018 - www.luxuryhomeing.com THIS IS YOUR LUXURY MARKET REPORT MAP OF LUXURY RESIDENTIAL MARKETS Welcome to the Luxury Report, your guide to luxury real estate market data
New Development Report
 New Development Report 2017 Third Quarter MANHATTAN $ 2,537 PER SQ. FT. ACTIVE $ 2,138 PER SQ. FT. CONTRACT SIGNED $ 2,096 PER SQ. FT. CLOSED BROOKLYN $ 1,468 PER SQ. FT. ACTIVE $ 1,423 PER SQ. FT. CONTRACT
LUXURY MARKET REPORT. - May
 LUXURY MARKET REPORT - May 2018 - www.luxuryhomeing.com THIS IS YOUR LUXURY MARKET REPORT MAP OF LUXURY RESIDENTIAL MARKETS Welcome to the Luxury Report, your guide to luxury real estate market data and
Brooklyn Rental Market Report June 2013 mns.com
 Brooklyn Rental Market Report June 2013 TABLE OF CONTENTS 03 Introduction 04 A Quick Look 05 Mean Brooklyn Rental Prices 07 Brooklyn Price Trends 08 Neighborhood Price Trends 08 Bay Ridge 09 Bedford-Stuyvesant
LUXURY MARKET REPORT. - March
 LUXURY MARKET REPORT - March 2018 - www.luxuryhomemarketing.com THIS IS YOUR LUXURY MARKET REPORT MAP OF LUXURY RESIDENTIAL MARKETS Welcome to the Luxury Market Report, your guide to luxury real estate
IV. Data on New York City s Housing and Neighborhoods. Chapter 1. Housing Stock*
 Total Housing Units (Thousands) IV. Data on New York City s Housing and Neighborhoods 1,000 800 600 400 200 0 Chapter 1. Housing Stock* Chart 1-1 Total Housing Units in the Five Boroughs 2000 2002 Bronx
ECONOMIC CURRENTS. Vol. 4, Issue 3. THE Introduction SOUTH FLORIDA ECONOMIC QUARTERLY
 ECONOMIC CURRENTS THE Introduction SOUTH FLORIDA ECONOMIC QUARTERLY Vol. 4, Issue 3 Economic Currents provides an overview of the South Florida regional economy. The report presents current employment,
State of Land Use and the Built Environment
 State of Land Use and the Built Environment The city approved more units for construction in 214 than in 213, but the level remained below that of the mid-2s. Meanwhile, city-initiated rezonings all but
TABLE OF CONTENTS 03 INTRODUCTION 04 NOTABLE TRENDS 05 MEAN RENTAL PRICES 07 PRICE TRENDS
 TABLE OF CONTENTS 03 INTRODUCTION 04 NOTABLE TRENDS 05 MEAN RENTAL PRICES 07 PRICE TRENDS 07 LONG ISLAND CITY 07 ASTORIA 07 RIDGEWOOD 07 FLUSHING 08 REGO PARK 08 FOREST HILLS 08 JACKSON HEIGHTS 12 THE
Chapter 8. Housing Quality
 Chapter 8. Housing Quality Information on the quality of New York City s housing stock presented in this chapter is derived from two sources. First, data on the age of the housing stock, housing maintenance
One Host, One Home: New York City (January 2018 Update)
") One Host, One Home: New York City (January 2018 Update) Key Figures About Airbnb s NYC Community Today, we re releasing updated information about the Airbnb community in New York City. This covers the
One Host, One Home: New York City (January 2018 Update) Key Figures About Airbnb s NYC Community Today, we re releasing updated information about the Airbnb community in New York City. This covers the
Queens Rental Market Report June 2016 mns.com
 Queens Rental Market Report June 2016 TABLE OF CONTENTS 03 Introduction 04 A Quick Look 10 Queens Price Trends 11 Neighborhood Price Trends 11 Long Island City 12 Astoria 13 Ridgewood 14 Flushing 15 Rego
Instructions for Form NYC-RPT Real Property Transfer Tax Return
 Instructions for Form NYC-RPT Page 1 Instructions for Form NYC-RPT Real Property Transfer Tax Return IMPORTANT 1. Always submit pages 1-4 of the return. Attach Schedules A through H, Schedule M and Schedule
New Development Year-End Report
 New Development Year-End Report 2017 MANHATTAN $ 2,610 $ 2,282 $ 2,133 0.9% YoY PER SQ. FT. ACTIVE 2.2% YoY PER SQ. FT. CONTRACT SIGNED 2.3% YoY PER SQ. FT. CLOSED BROOKLYN $ 1,440 PER SQ. FT. ACTIVE $
Foreclosures Continue to Bring Home Prices Down * FNC releases Q Update of Market Distress and Foreclosure Discount
 Foreclosures Continue to Bring Home Prices Down * FNC releases Q4 2011 Update of Market Distress and Foreclosure Discount The latest FNC Residential Price Index (RPI), released Monday, indicates that U.S.
One Host, One Home: New York City (February 2017 Update)
") One Host, One Home: New York City (February 2017 Update) Key Figures About Airbnb s NYC Community Today, we re releasing updated information about the Airbnb community in New York City. This covers the
One Host, One Home: New York City (February 2017 Update) Key Figures About Airbnb s NYC Community Today, we re releasing updated information about the Airbnb community in New York City. This covers the
PROPERTY APPRAISER: 2009 PRELIMINARY ROLL CONFIRMS SIGNIFICANT DECLINE IN VALUES
 FOR IMMEDIATE RELEASE: MEDIA CONTACT: Patrick Smikle: 305-375-4789 PROPERTY APPRAISER: 2009 PRELIMINARY ROLL CONFIRMS SIGNIFICANT DECLINE IN VALUES (MIAMI, July 01, 2009) It s official. The July 1, 2009
2nd Quarter Flatbush Fort Greene Brooklyn. A comprehensive analysis of the residential real estate market in Brooklyn.
 Prospect Park South Red Hook Sheepshead Bay Sunset Park Williamsburg Windsor Terrace Bath Beach Bensonhurst Bay Ridge Bedford - Stuyvesant Boerum Hill Brooklyn Heights Bushwick Carroll Gardens Clinton
Multifamily Metro Outlook: New York Spring 2018
 Overview The New York City metro is the nation s largest apartment market with 2.2 million rental units, of which 47 percent are rent-stabilized and 1.2 percent rent-controlled. As anticipated, a glut
U.S. Foreclosure Activity Increases 2 Percent in July Boosted by 6 Percent Increase in Foreclosure Starts
 August 13, 2013 By RealtyTrac Staff U.S. Foreclosure Activity Increases 2 Percent in July Boosted by 6 Percent Increase in Foreclosure Starts Bank Repossessions Up 4 Percent From Previous Month, 29 States
Brooklyn Rental Market Report September 2015 mns.com
 Brooklyn Rental Market Report September 2015 TABLE OF CONTENTS 03 Introduction 04 A Quick Look 05 Mean Brooklyn Rental Prices 10 Brooklyn Price Trends 11 Neighborhood Price Trends 11 Bay Ridge 12 Bedford-Stuyvesant
One Host, One Home: New York City (April 2018 Update)
") One Host, One Home: New York City (April 2018 Update) Key Figures About Airbnb s NYC Community Today, we re releasing updated information about the Airbnb community in New York City. This covers the time
One Host, One Home: New York City (April 2018 Update) Key Figures About Airbnb s NYC Community Today, we re releasing updated information about the Airbnb community in New York City. This covers the time
Q brooklyn. the corcoran report. peter comitini comitini.comsm
 Q2. brooklyn the corcoran report peter comitini comitini.comsm peter@comitini.com 212. 444.7844 MID YEAR brooklyn snapshot Brooklyn has seen a more modest increase in compared to the exuberant early part
Brooklyn Rental Market Report October 2014 mns.com
 Brooklyn Rental Market Report October 2014 TABLE OF CONTENTS 03 Introduction 04 A Quick Look 05 Mean Brooklyn Rental Prices 10 Brooklyn Price Trends 11 Neighborhood Price Trends 11 Bay Ridge 12 Bedford-Stuyvesant
Queens Rental Market Report November 2015 mns.com
 Queens Rental Market Report November 2015 TABLE OF CONTENTS 03 Introduction 04 A Quick Look 05 Mean Queens Rental Prices 10 Queens Price Trends 11 Neighborhood Price Trends 11 Long Island City 12 Astoria
L U X U R Y M A R K E T R E P O R T 2 Q
 L U X U R Y M A R K E T R E P O R T 2 Q 2 1 8 The quarterly Luxury Market Report provided by Trump International Realty is a resource compiling pertinent data and analytics to give you a pulse on the current
UNHP // Views from the Northwest Bronx Blog Series Charts and Images #ViewsNWBX
 UNHP // Views from the Northwest Bronx Blog Series Charts and Images #ViewsNWBX The northwest Bronx is a series of neighborhoods from the Cross Bronx expressway to the County line, dominated by multifamily
Brooklyn Rental Market Report October 2015 mns.com
 Brooklyn Rental Market Report October 2015 TABLE OF CONTENTS 03 Introduction 04 A Quick Look 05 Mean Brooklyn Rental Prices 10 Brooklyn Price Trends 11 Neighborhood Price Trends 11 Bay Ridge 12 Bedford-Stuyvesant
EMH Commercial Realty Exclusive Listing
 EMH Commercial Realty Exclusive Listing 177 Sheffield Ave, Brooklyn, NY 11207 SE Corner of Glenmore Ave & Pitkin Ave Exclusive Agent: Heshie Goldfein & Sadya Liberow 1 Investment Highlights: Asking Price:
MANHATTAN RESIDENTIAL MARKET REPORT SECOND QUARTER
 2017 MANHATTAN RESIDENTIAL MARKET REPORT SECOND QUARTER Data Highlights SECOND QUARTER 2017 Cover Property: halstead.com WEB# 16183475 New records were set for average and median apartment prices, as high-end
Manhattan Rental Market Report November 2014 mns.com
 Manhattan Rental Market Report November 2014 TABLE OF CONTENTS 03 Introduction 04 A Quick Look 07 Mean Manhattan Rental Prices 11 Manhattan Price Trends 12 Neighborhood Price Trends 12 Battery Park City
ECONOMIC CURRENTS. Vol. 5 Issue 2 SOUTH FLORIDA ECONOMIC QUARTERLY. Key Findings, 2 nd Quarter, 2015
 ECONOMIC CURRENTS THE Introduction SOUTH FLORIDA ECONOMIC QUARTERLY Economic Currents provides an overview of the South Florida regional economy. The report presents current employment, economic and real
CONSTRUCTION OUTLOOK UPDATE
 buildingcongress.com MARCH 08 CONSTRUCTION OUTLOOK UPDATE FIVE YEARS, FIVE BOROUGHS A review of 0-07 construction starts data for New York City shows construction activity increasingly diversified throughout
Brooklyn Rental Market Report July 2016 mns.com
 Brooklyn Rental Market Report July 2016 TABLE OF CONTENTS 03 Introduction 04 A Quick Look 05 Mean Brooklyn Rental Prices 10 Brooklyn Price Trends 11 Neighborhood Price Trends 11 Bay Ridge 12 Bedford-Stuyvesant
3rd Quarter Flatbush Fort Greene Brooklyn. A comprehensive analysis of the residential real estate market in Brooklyn.
 Prospect Park South Red Hook Sheepshead Bay Sunset Park Williamsburg Windsor Terrace The Corcoran Report Bath Beach Bensonhurst Bay Ridge Bedford - Stuyvesant Boerum Hill Brooklyn Heights Bushwick Carroll
New Development Year-End Report
 New Development Year-End Report MANHATTAN 2,775 PER SQ. FT. ACTIVE 2,268 BROOKLYN 1,34 PER SQ. FT. ACTIVE 1,335 PER SQ. FT. CONTRACT SIGNED PER SQ. FT. CONTRACT SIGNED 1,98 1,167 PER SQ. FT. CLOSED PER
New York City NY If you are unfamiliar with the tax lien program please read the Overview for important disclaimers. Date
 Queens NY 11/30 New York City NY If you are unfamiliar with the tax lien program please read the Overview for important disclaimers. BHID Parcel # Location Auction Date County 1585020 5-05599- 0043 500
Dilbeck Real Estate's MARKET UPDATE
 Dilbeck Real Estate's MARKET UPDATE Current Real Estate Market Conditions for Single Family Homes Trends in Pricing Current Levels of Supply and Demand Value Metrics Report for the week of December 31,
ECONOMIC CURRENTS. Vol. 3, Issue 3 SOUTH FLORIDA ECONOMIC QUARTERLY. Introduction
 ECONOMIC CURRENTS THE Introduction SOUTH FLORIDA ECONOMIC QUARTERLY Economic Currents provides an overview of the South Florida regional economy. The report presents current employment, economic and real
LIGHTSTONE VALUE PLUS REIT V Investor Presentation. June 21, 2018
 LIGHTSTONE VALUE PLUS REIT V Investor Presentation June 21, 2018 1 2 Dial-in Information To listen to today s call: +1 (914) 614-3221 Participant PIN Code: 476-364-176 3 Forward-Looking Statements This
QUEENS RENTAL MARKET REPORT
 QUEENS RENTAL MARKET REPORT AUGUST 2018 TABLE OF CONTENTS 03 INTRODUCTION 04 A QUICK LOOK 10 QUEENS PRICE TRENDS 11 NEIGHBORHOOD PRICE TRENDS 11 LONG ISLAND CITY 12 ASTORIA 13 RIDGEWOOD 14 FLUSHING 15
Manhattan Rental Market Report November 2015 mns.com
 Manhattan Rental Market Report November 2015 TABLE OF CONTENTS 03 Introduction 04 A Quick Look 07 Mean Manhattan Rental Prices 11 Manhattan Price Trends 12 Neighborhood Price Trends 12 Battery Park City
Increasing Foreclosures Could Hurt Demand for Homes, Slowing Housing Recovery
 Release Date: April 22, 2010 February 2010 Quinn W. Eddins, Director of Research New Radar Logic data packages are available at /productsservices_analytics.html Increasing Foreclosures Could Hurt Demand
M A N H A T T A N 69 THE FURMAN CENTER FOR REAL ESTATE & URBAN POLICY. Financial District Greenwich Village/Soho
 M A N H A T T A N Page Financial District 301 72 Greenwich Village/Soho 302 73 Lower East Side/Chinatown 303 74 Clinton/Chelsea 304 75 69 THE FURMAN CENTER FOR REAL ESTATE & URBAN POLICY Midtown 305 76
Release Date: May 21, 2009 March Key Characteristics
 Release Date: May 21, 2009 March 2009 Key Characteristics The RPX 25-MSA Composite has stabilized since January 2009, after being in virtual freefall for much of 2008. The Composite declined only 0.3 percent
UPGRADING PRIVATE PROPERTY AT PUBLIC EXPENSE The Rising Cost of J-51
 UPGRADING PRIVATE PROPERTY AT PUBLIC EXPENSE The Rising Cost of J-51 POLICY BRIEF By Tom Waters and Victor Bach June 2012 The Community Service Society of New York (CSS) draws on a 168-year history of
Brooklyn Rental Market Report July 2015 mns.com
 Brooklyn Rental Market Report July 2015 TABLE OF CONTENTS 03 Introduction 04 A Quick Look 05 Mean Brooklyn Rental Prices 10 Brooklyn Price Trends 11 Neighborhood Price Trends 11 Bay Ridge 12 Bedford-Stuyvesant
Brooklyn Rental Market Report April 2015 mns.com
 Brooklyn Rental Market Report April 2015 TABLE OF CONTENTS 03 Introduction 04 A Quick Look 05 Mean Brooklyn Rental Prices 10 Brooklyn Price Trends 11 Neighborhood Price Trends 11 Bay Ridge 12 Bedford-Stuyvesant
3-BUILDING BROOKLYN PACKAGE
 3-BUILDING BROOKLYN PACKAGE 538 Bainbridge Street Brooklyn, NY 11233 1430 Dekalb Avenue Brooklyn, NY 11237 743 MacDonough Street Brooklyn, NY 11233 Ocean Hill & Bushwick 3-Story Buildings 15,335± SF 18
Monthly Market Data Report
 MARKET DATA REPORT Monthly Market Data Report Report Characteristics Report Name: Monthly Market Data Report Report Date Range: 7/2015 7/2016 : Location Avg/Med: Avg Only Include Metrics By: County Run
LUXURY MARKET REPORT. - February
 LUXURY MARKET REPORT - February 2018 - www.luxuryhomeing.com THIS IS YOUR LUXURY MARKET REPORT MAP OF LUXURY RESIDENTIAL MARKETS Welcome to the Luxury Report, your guide to luxury real estate market data
Miami Beach, FL 33141
 NEIGHBORHOOD REPORT Miami Beach, FL Prepared for Prospective Customer Presented by Christopher Lazaro Florida Real Estate License: BK3252123 Please call me with any questions or requests. I can produce
Third Quarter 2018 Market Report Brooklyn Residential
 Market Report Brooklyn Residential Data Highlights Cover Property: halstead.com WEB# 18921216# The median apartment price fell 3% in Brooklyn over the past year. Co-op prices rose in Brooklyn, while condo
Monthly Indicators. November Monthly Snapshot % % %
 Monthly Indicators For residential real estate activity in the Miami-Fort Lauderdale-Pompano Beach MSA provided by Florida REALTORS 2012 Monthly Snapshot + 21.5% + 16.0% - 46.9% One-Year in Closed Sales
Queens Rental Market Report October 2017 mns.com
 Queens Rental Market Report October 2017 TABLE OF CONTENTS 03 Introduction 04 A Quick Look 10 Queens Price Trends 11 Neighborhood Price Trends 11 Long Island City 12 Astoria 13 Ridgewood 14 Flushing 15
Brooklyn Rental Market Report August 2015 mns.com
 Brooklyn Rental Market Report August 2015 TABLE OF CONTENTS 03 Introduction 04 A Quick Look 05 Mean Brooklyn Rental Prices 10 Brooklyn Price Trends 11 Neighborhood Price Trends 11 Bay Ridge 12 Bedford-Stuyvesant
Seattle Market Watch April 2018 Data from Northwest Multiple Listing Service April 9, 2018
 Seattle March numbers Change from Feb 427 for Sale + 47% Seattle Watch April 2018 Supply & Demand Trends For Sale Sold Pending Spring is bringing out the buyers (and the inventory) Monthly data for Seattle,
CALIFORNIA FORECLOSURE ACTIVITY MIXED
 CALIFORNIA FORECLOSURE ACTIVITY MIXED Foreclosure delays may be behind current peak in foreclosure activity Discovery Bay, CA, September 16, 2008 ForeclosureRadar (www.foreclosureradar.com), the only website
Communities at the Crossroads: A Survey of Five First-Ring Suburbs
 Communities at the Crossroads: A Survey of Five First-Ring Suburbs 19 inner ring suburbs of Cleveland Inner-ring Suburban Key Challenges Bottom feeding flippers and speculators Increase in vacant homes
90 Alton Rd, Miami Beach, FL 33139
 PROPERTY REPORT 90 Alton Rd, Miami Beach, FL 33139 Presented by Christopher Lazaro Florida Real Estate License: BK3252123 Hello & Happy New Year! You may call me any time to discuss your Residential &
Commercial and Multifamily Construction Starts in 2016 Rise in Most of the Top U.S. Metropolitan Areas
 Commercial and Multifamily Construction Starts in 2016 Rise in Most of the Top U.S. Metropolitan Areas However, New York NY Settles Back After Robust 2015 Most of the leading U.S. metropolitan areas for
ECONOMIC CURRENTS. Vol. 3, Issue 1. THE SOUTH FLORIDA ECONOMIC QUARTERLY Introduction
 ECONOMIC CURRENTS THE SOUTH FLORIDA ECONOMIC QUARTERLY Introduction Economic Currents provides an overview of the South Florida regional economy. The report contains current employment, economic and real
Queens Rental Market Report November 2017 mns.com
 Queens Rental Market Report November 2017 TABLE OF CONTENTS 03 Introduction 04 A Quick Look 10 Queens Price Trends 11 Neighborhood Price Trends 11 Long Island City 12 Astoria 13 Ridgewood 14 Flushing 15
IRVINE, Calif. May 8, 2014
 ALL-CASH SHARE OF U.S. RESIDENTIAL SALES REACHES NEW HIGH IN FIRST QUARTER EVEN AS INSTITUTIONAL INVESTOR SHARE OF SALES DROPS TO LOWEST LEVEL SINCE Q1 2012 May 5, 2014 By RealtyTrac Staff All-Cash Purchases
Instructions for Form NYC-RPT Real Property Transfer Tax Return
 Instructions for Form NYC-RPT Page 1 Instructions for Form NYC-RPT Real Property Transfer Tax Return IMPORTANT 1. Always submit pages 1-4 of the return. Attach Schedules A through H, Schedule M and Schedule
FOR IMMEDIATE RELEASE Contact: Brenda Morton Dulles Area Association of REALTORS
 FOR IMMEDIATE RELEASE Contact: Brenda Morton 703 777 2468 Dulles Area Association of REALTORS bmorton@dullesarea.com August 2018 Loudoun County Market Trends Report Despite persistent low inventory, sales
Exclusive Report: Q Foreclosure Inventory Update
 U.S. Foreclosure Inventory Bouncing Back After National Mortgage Settlement After peaking at more than 2.2 million in December 2010, U.S. foreclosure inventory including homes actively in the foreclosure
>> 2016 Off to A Good Start for Tri-Cities
 Research & Forecast Report TRI-CITIES OFFICE Q1 216 Accelerating success. >> 216 Off to A Good Start for Tri-Cities Key Takeaways > The Tri-Cities office market saw vacancy decline for the seventh consecutive
Multifamily Market Commentary September 2016
 Multifamily Market Commentary September 2016 Big Impact from Small Multifamily Properties Multifamily rental units can be found in high-rise structures or in garden-style buildings, but there are a number
2Q2017 L O N G ISLAND CITY
 2Q2017 L O N G ISLAND CITY M A R K E T R E P O R T INTRODUCTION L O N G I S L A N D C I T Y S A L E S R E P O R T Q 2 2 0 1 7 : LONG ISLAND CITY IS THE FASTEST GROWING NEIGHBORHOOD IN THE COUNTRY. The
Queens Rental Market Report February 2018 mns.com
 Queens Rental Market Report February 2018 TABLE OF CONTENTS 03 Introduction 04 A Quick Look 10 Queens Price Trends 11 Neighborhood Price Trends 11 Long Island City 12 Astoria 13 Ridgewood 14 Flushing 15
LUXURY MARKET REPORT. - January
 LUXURY MARKET REPORT - January 2018 - www.luxuryhomemarketing.com THIS IS YOUR LUXURY MARKET REPORT MAP OF LUXURY RESIDENTIAL MARKETS Welcome to the Luxury Market Report, your guide to luxury real estate
August 2017 Loudoun County Market Trends Report Sales Price Reaches Record High; Sales Decline; Inventory Remains Low
 FOR IMMEDIATE RELEASE Contact: Christine Windle 703 777 2468 Dulles Area Association of REALTORS cwindle@dullesarea.com August 2017 Loudoun County Market Trends Report Sales Price Reaches Record High;
Metropolitan Area Statistics
 Metropolitan Area Statistics Apartment Completions 1Q 2011 1Q 2012 % Chg Atlanta - - n/a Boston 133 39-71% Chicago - 20 n/a Cleveland - - n/a Columbus - 272 n/a Dallas-Ft. Worth 604 1,059 75% Denver 328
Multifamily Month In Review: New York City december 2015 Released February 2016 By Ariel Property Advisors
 Multifamily Month In Review: New York City december 2015 Released February 2016 By Ariel Property Advisors Join Our Network: e-mail join@arielpa.com or visit arielpa.nyc 212.544.9500 I arielpa.nyc 122
Multifamily Property For Sale Asking Price Index Trends
 Multifamily Property For Sale Asking Price Index Trends Feb 11 prior YOY $134,167 1.0% 5.5% $158,866 0.7% 6.7% $157,655 0.6% 6.2% $136,264 2.3% 10.7% Current Los Angeles market trends data indicates a
Property values in Miami-Dade up higher than expected
 Page 1 of 5 Miami-Dade County JULY 1, 2015 Property values in Miami-Dade up higher than expected This May 30, 2014 photo shows the construction of buildings in Miami s downtown financial district of Miami.
Single Family Sales Maine: Units
 Maine Home Connection 19 Commercial St Portland, Maine 04101 MaineHomeConnection.com Office: (207) 517-3100 Email: Info@MaineHomeConnection.com For the fourth consecutive year, Maine home sales set a new
MANHATTAN RESIDENTIAL MARKET REPORT FOURTH QUARTER
 2016 MANHATTAN RESIDENTIAL MARKET REPORT FOURTH QUARTER Data Highlights Cover Property: halstead.com WEB# 15919235 Apartment prices averaged a record $2,110,566, fueled by new development closings Resale
Manhattan Rental Market Report March 2016 mns.com
 Manhattan Rental Market Report March 2016 TABLE OF CONTENTS 03 Introduction 04 A Quick Look 07 Mean Manhattan Rental Prices 11 Manhattan Price Trends 12 Neighborhood Price Trends 12 Battery Park City 13
CPEX Quarterly Investment Sales Report Methodology
 CPEX Quarterly Investment Sales Report Methodology CPEX Real Estate s Quarterly Investment Sales Report is a comprehensive survey of commercial real estate sales recorded during the first quarter of 2016
MANHATTAN RESIDENTIAL MARKET REPORT
 2017 FOURTH MANHATTAN RESIDENTIAL MARKET REPORT QUARTER Data Highlights FOURTH QUARTER 2017 Cover Property: halstead.com WEB# 17690202 The average apartment price fell for the second straight quarter,
Manhattan Residential. FOURTH quarter
 2015 Manhattan Residential MARket Report FOURTH quarter Data Highlights FOURTH Quarter 2015 Cover Property: halstead.com WEB# 13676219 The average and median price for all apartments set new records in
INVESTORS PURCHASE RECORD NUMBER OF FORECLOSURES AT AUCTION
 INVESTORS PURCHASE RECORD NUMBER OF FORECLOSURES AT AUCTION April Foreclosure Notices Drop from March Record Levels Discovery Bay, CA, May 12, 2009 ForeclosureRadar (www.foreclosureradar.com), the only
Still Subsidizing Luxury Development:
 Still Subsidizing Luxury Development: 50 High-End Condo Developments That Would Still Be Eligible for 421-a Tax Breaks Even After Proposed Exclusion Zone Expansion and Reform Pratt Center for Community
SPECIAL REPORT. Single-Family Rent Index: H Review
 SPECIAL REPORT Rent Index: H1 2018 Review FEBRUARY 2018 1 National Overview Single-family rentals make up one-half of all residential rentals but are an overlooked segment of the housing market. Much like
Monthly Indicators % - 1.6% + 6.0%
 ly Indicators A RESEARCH TOOL PROVIDED BY METRO MLS FOR ACTIVITY IN THE 4-COUNTY MILWAUKEE METROPOLITAN AREA 2019 Quick Facts It is worthwhile to mention the weather when discussing residential real estate