Mike Gallagher s Real Estate Crystal Ball Predictions for Year 2011
|
|
|
- Angela Gallagher
- 5 years ago
- Views:
Transcription


1 Mike Gallagher s Real Estate Crystal Ball Predictions for Year 211 CAUTION: DO NOT BELIEVE EVERYTHING YOU READ IN THE HONOLULU STAR-BULLETIN REGARDING REAL ESTATE SALES It has been a heck of a year! Many changes took place in the Real Estate Market on Oahu and around the Nation that have significantly impacted many home owner lives in terms of lower equities, negative equity values, Foreclosures, Short Sales, standards of living, all within a suffocating atmosphere of greatly increased State and National Taxes. Due to publication deadlines I am writing this article just prior to the end of December 21 for distribution on January 1 st 211, but I will provide you with an end of year forecast and 211 forecast. 1
2 Oahu SFH Year End 21 Projected Unit Sales Oahu Condo Year End Projected Unit Sales Jan.7 March7 May7 July7 Sept.7 Nov.7 Jan.8 March8 May8 July8 Sept.8 Nov.8 Jan.9 March 9 May 9 July 9 Sept. 9 Nov. 9 Jan. March May July Sept. Nov Jan.7 March7 May7 July7 Sept.7 Nov.7 Jan.8 March8 May8 July8 Sept.8 Nov.8 Jan.9 March 9 May 9 July 9 Sept. 9 Nov. 9 Jan. March May July Sept. Nov. Condos have been leading the downturn this year after considerable gain over the sales number for year 28. At the end of the year 29, 3,467 sales recorded. I believe we will finish the year 21 at 3,866, a +1% increase for the year over year 29. Remember, the market turned and became a Buyer s market in December of 26. That year recorded 6,38 sales. Single Family Homes (S.F.H.) performed much better than the Condo sector this year which I find surprising due the increase in the cost of a typical Oahu home. At the end of year 29, 2,585 sales were recorded. I believe we will finish year 21 at 2,958 total sales, a +13% increase. In year 26 recorded sales were 4,41. Oahu SFH Unit Sales Oahu Condo Unit Sales SFH Unit Sales 4 3 Condo Unit Sales Estimate Estimate When looking at just unit sales we can expel a sigh of relief that things are looking up. Just looking at the unit sales however does not tell the whole story so we will continue to explore the year 21 and project into what may come in 211. Is Now the Time? Before I begin, I must say, I abhorred when Real Estate Agents say: Now appears to be a great time to buy a Hawaii home. It brings to my mind another piece of advice: "Dont ask the barber whether you need a haircut." Do your own research, ask questions and get the whole picture. 2
3 Oahu SFH Median Price Oahu Condo Median Price $65, $33, $64, $325, $63, $62, $61, $6, SFH Median Price $32, $315, $31, Condo Median Price $59, $35, $58, $3, $57, $56, Estimate $295, Estimate Do not get too excited about this news, the rise is directly attributable to higher priced homes, which are flooding the market, selling. Oahu SFH November Year to Date Units by Price Range $-$99,999 $1,-$199,999 $2,-$299,999 $3,- $399,999 $4,-$499,999 $5,-$599,999 $6,-$699,999 $7,-$799,999 $8,-$899,999 $9,-$999,999 $1,,-$1,499,999 $1,5,-$1,999,999 2,,+ Oahu SFH Dec. 9 $2k-$299,999 $3k-$399,999 $4k-$499,999 $5k-$599,999 $6k-$699,999 $7k-$799,999 $8k-$899,999 $9k-$999,999 $1,, to $1,499,999 $1,5, to $1,999,999 $2,, and Up Oahu Condo November Year to Date Unit Sales by Price Range Oahu Condo Sales Year 29 $-$99,999 $1,-$149, $15,-$199,999 $2,-$249,999 $25,-$299,999 $3,-$349,999 $35,-$399,999 $4,-$499,999 $5,-$599,999 $6,-$699,999 $7,-$799,999 $8,+ $1k-$199,999 $2k-$299,999 $3k-$399,999 $4k to $499,999 $5k to $599,999 $6k to $699,999 $7k to $799,999 $8k to $899,999 $9k to $999,999 $1,, and Up In Short: 21 S.F.H. 29 : $2,,+ = 2% $2,,+ =3% $1,5,-$1,999,999 = 2% $1,5,-$1,999,999 = 1% $1,,-$1,499,999 = 7% $1,,-$1,499,999 = 8% $9,-$999,999 = 5% $9,-$999,999 = 4% 3
4 In Short: 21 Condo 29 : $8,+ = 3% $8,+ = 1% $7,-$799,999 = 2% $7,-$799,999 = 3% $6,-$699,999 = 4% $6,-$699,999 = 3% $5,-$599,999 = 6% $5,-$599,999 = 8% Oahu SFH November Units For Sale Year to Date By Price Range Oahu SFH Dec. 9 For Sale $-$99,999 $1,-$199,999 $2,-$299,999 $3,- $399,999 $4,-$499,999 $5,-$599,999 $6,-$699,999 $7,-$799,999 $8,-$899,999 $9,-$999,999 $1,,-$1,499,999 $1,5,-$1,999,999 2,,+ $2k-$299,999 $3k-$399,999 $4k-$499,999 $5k-$599,999 $6k-$699,999 $7k-$799,999 $8k-$899,999 $9k-$999,999 $1,, to $1,499,999 $1,5, to $1,999,999 $2,, and Up Oahu Condo November Units For Sale Year to Date By Price Range Oahu Condo Dec. 9 For Sale $-$99,999 $1,-$149, $15,-$199,999 $2,-$249,999 $25,-$299,999 $3,-$349,999 $35,-$399,999 $4,-$499,999 $5,-$599,999 $6,-$699,999 $7,-$799,999 $8,+ $1k-$199,999 $2k-$299,999 $3k-$399,999 $4k to $499,999 $5k to $599,999 $6k to $699,999 $7k to $799,999 $8k to $899,999 $9k to $999,999 $1,, and Up In Short: 21 S.F.H. 29 For Sale: $2,,+ = 15% $2,,+ =15% $1,5,-$1,999,999 = 5% $1,5,-$1,999,999 = 6% $1,,-$1,499,999 = 11% $1,,-$1,499,999 = 1% $9,-$999,999 = 6% $9,-$999,999 = 2% In Short: 21 Condo 29 For Sale: $8,+ = 14% $8,+ = 2% $7,-$799,999 = 3% $7,-$799,999 = 3% $6,-$699,999 = 4% $6,-$699,999 = 6% $5,-$599,999 = 5% $5,-$599,999 = 6% During the course of last year one most realize that only so many listings come onto the market in 12 months and only so many sell. What is surprising is the amount that sold is so low. 4
5 Oahu SFH December Year to Date Odds of Selling ALL PRICE RANGES Oahu Condo December Year to Date Odds of Selling ALL PRICE RANGES For Sale 15 1 For Sale Jan. Feb. March April May June July Aug. Sept. Oct. Nov. Dec. Jan. Feb. March April May June July Aug. Sept. Oct. Nov. Dec. More along the lines of Should I ask my Barber if I need a Haircut is the Honolulu Board of Realtors President was quoted by the Honolulu Star Advertiser that prices were looking up and the market is getting much better due to the rise in percentage list to sell ratios. Really? Oahu SFH December Year to Date % At Full Price Or More Oahu Condo December Year to Date % At Full Price Or More ALL PRICE RANGES 8% 7% 45% 4% 6% 5% % AT Full List Price Or More 35% 3% % AT Full List Price Or More 4% 3% 2% 1% % % AT Full List Price Or More WITHOUT RE- LISTING OR PRICE REDUCTION 25% 2% 15% 1% 5% % % AT Full List Price Or More WITHOUT RE- LISTING OR PRICE REDUCTION Jan. Feb. March April May June July Aug. Sept. Oct. Nov. Dec. Jan. Feb. March April May June July Aug. Sept. Oct. Nov. Dec. There is so much mis-information out there concerning the Real Estate Market it is no wonder no one knows what is going on. Realtors, Agents all receive a sales report each month from the Honolulu Board of Realtors so in my opinion they are slightly in tune, but when you cannot rely upon the numbers the Board is putting out, what do you do? My advice is you do your own research and of course call me. I will tell what is going on. I will not tell you it is Great Time to Buy or that You Need a Haircut. I do this because I want your trust and your business. You also deserve to have the straight story from someone who will give you the whole picture. When it comes to Sellers, it seems they do not really want to hear what their home is worth from a Realtor and will list with the first Realtor who promises the moon on sales price. Then when the home does not sell, no problem, the Realtor 5
6 simply asks and typically receives permission to continually lower the asking price until the home is sold. If that does not work, the Realtor will keep successively re-listing the property and dropping the price until the home sells, all the while the market is heading down and ultimately the Seller looses a ton of money in the ultimate sales price. Kalaheo Hillside in Kailua for example: 19 sales, Total Market Time for all listings, combined: 135 months or 7.1 months / listing. Total combined listing price: $14,646,8. Final combined Price: $13,662,9. Between the initial asking prices and the final sold price the difference is -$983,9 in Price Reductions and loss of Equity for an average loss of -$51, per listing sold. How many times were 19 homes sold in Kalaheo Hillside Re-Listed by the same agent? The answer is 32% of the time. If you are going to sell your property this year, do it correctly. Just do not listen to what you want to hear. December 29 Note: Average Prices are within the Area s Boxes. Not Medians. 6

7 Inventory Much has been said about inventory this year. It IS the single widely used Buzz Word in the industry and rightfully so. Inventory is tight. There is not enough inventory. Better buy as soon as you see something with these interest rates. Inventory is so low, prices are going up. We have all heard this over the course of year 21 and for the most part it is true, but it is not the Whole Picture. Months of Supply Months of Supply = Total Sales, Year to Date divided by the number of months and dividing the current For Sale inventory by the answer. 7

8 Yes, the inventory situation is great for Oahu home sales and prices. Anything under 6 months of supply is considered by the industry as a Seller s Market. Yes, prices are stabilizing and in some areas on Oahu prices are rising. You still have to look at the whole picture to know what is going on. Back in November and December 21 For Sale inventory started to rise in certain areas on Oahu. In large part the areas that are affected are the more expensive areas of the Island as in 21 we witnessed a significant rise in high priced homes coming onto the market. I do not believe this will be much different in year 211, in fact, I believe this trend will increase as more and more expensive homes come onto the market in larger numbers in 211. One scenario suggests that would be sellers are looking at the opportunity they have with low inventory and stabile and sometimes rising prices. 8
9 The other scenario, more in line for the high priced would be Seller is that they are going to get out while the getting out is good. For instance: Oahu SFH November Year to Date Odds of Selling $2,,+ Oahu SFH November Year to Date Odds of Selling $1,,-$1,499, ,,+ For Sale $1,,-$1,499,999 For Sale 1 2,,+ 1 8 $1,,-$1,499, Jan. Feb. March April May June July Aug. Sept. Oct. Nov. Jan. Feb. March April May June July Aug. Sept. Oct. Nov. Oahu SFH November Year to Date Odds of Selling $6,-$699,999 Oahu Condo November Year to Date Odds of Selling $8, $6,-$699,999 For Sale 2 15 $8,+ For Sale $6,-$699,999 1 $8, Jan. Feb. March April May June July Aug. Sept. Oct. Nov. Jan. Feb. March April May June July Aug. Sept. Oct. Nov. Oahu Condo November Year to Date Odds of Selling $3,-$349, $3,-$349,999 For Sale $3,-$349, Jan. Feb. March April May June July Aug. Sept. Oct. Nov. 9


10 Ja n. ar 7 ch M 7 ay Ju 7 ly Se 7 pt. No 7 v. Ja 7 n M. ar 8 ch M 8 ay Ju 8 ly Se 8 pt. No 8 v. Ja 8 M n. ar ch 9 M 9 ay J u 9 ly Se 9 pt. No 9 v. Ja 9 n M. 1 ar ch M 1 ay J u 1 ly Se 1 pt. No 1 v. 1 M Ja n. ar 7 ch M 7 ay Ju 7 ly Se 7 pt. No 7 v. Ja 7 n M. ar 8 ch M 8 ay Ju 8 ly Se 8 pt. No 8 v. Ja 8 M n. ar ch 9 M 9 ay Ju 9 ly Se 9 pt. No 9 v. Ja 9 n M. 1 ar ch M 1 ay 1 Ju ly Se 1 pt. No 1 v. 1 M Oahu SFH December Inventory Oahu Condo December Inventory Distressed Property Distressed Property: Foreclosures, Bankruptcy, Short Sales, Probate, Lender Sale. Another Buzz Word we heard a lot of in 21: Foreclosures. Distressed Property 1
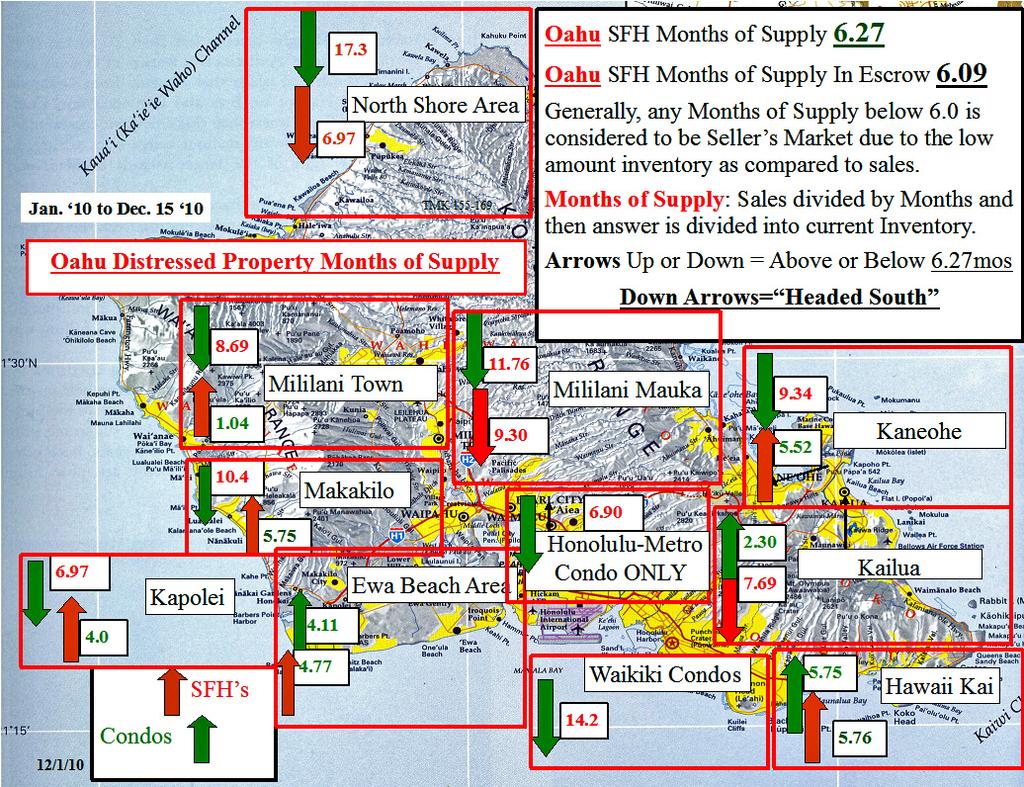
11 I have created the above Map to show the current Months of Supply of homes For Sale that are Distressed Properties. The GREEN Arrows are Condos and the RED Arrows are Single Family Homes (S.F.H.) The direction of the Arrow, Up or Down indicates whether or not the stats for any particular neighborhood is below or above the Oahu Averages. According to the common explanation for Months of Supply, anything less than six Months of Supply is considered a Seller s Market. The overall Oahu Months of Supply for Distressed Property is This indicates it is still a Buyer s Market. Not all areas of Oahu are Buyer s markets. Ewa S.F.H. s and Condos, Kapolei S.F.H. s, Hawaii Kai S.F.H. s and Condos and many more areas are Seller s Markets. The largest areas on the Island with the most amount Distressed Property Months of Supply are Waikiki and North Shore Area Condos, both exceeding 14 Months of Supply. Oahu SFH December Year to Date Distressed Property Odds of Selling ALL PRICE RANGES Oahu Condo December Year to Date Distressed Property Odds of Selling ALL PRICE RANGES Oahu SFH For Sale 25 2 Oahu Condo For Sale 15 1 Oahu SFH 15 1 Oahu Condo 5 5 Jan. Feb. March April May June July Aug. Sept. Oct. Nov. Dec. Jan. Feb. March April May June July Aug. Sept. Oct. Nov. Dec. 25% Oahu % of Inventory Distressed Properties to Total Available Inventory 1% Ewa % of For Sale Distressed Properties to Total Available Inventory Ewa 9% 2% 8% 15% Oahu SFH % of For Sale Inventory Distressed Property 7% 6% Ewa SFH % of For Sale Inventory Distressed Property 5% 1% Oahu Condo % of For Sale Inventory Distressed Property 4% 3% Ewa Condo % of For Sale Inventory Distressed Property 5% 2% 1% % June December % June December 11
12 Leeward SFH % of For Sale Inventory Distressed Property to Total Available Inventory Waipahu Area % of Inventory Distressed Property to Total Available Waipahu Area Inventory 42% 7% 41% 6% 41% 4% 4% 39% Leeward SFH % of For Sale Inventory Distressed Property 5% 4% Waipahu Area SFH % of For Sale Inventory Distressed Property 39% 38% 3% 2% Waipahu Area Condo % of For Sale Inventory Distressed Property 38% 1% 37% 37% % June December June December Oahu SFH December Year to Date Distressed Property Units For Sale Oahu SFH December Year to Date Distressed Property Units Diamond Head Metro Kailua Hawaii Kai Kaneohe SFH Ewa Makakilo Mililani Area Mililani Mauka Leeward Waipahu Central Pearl City Diamond Head Metro Kailua Hawaii Kai Kaneohe SFH Ewa Makakilo Mililani Area Mililani Mauka Leeward Waipahu Central Pearl City Oahu Condo December Year to Date Distressed Property Units For Sale Oahu Condo December Year to Date Distressed Property Units Diamond Head Metro Kailua Hawaii Kai Kaneohe SFH Ewa Makakilo Mililani Area Mililani Mauka Leeward Waipahu Central Pearl City Diamond Head Metro Kailua Hawaii Kai Kaneohe SFH Ewa Makakilo Mililani Area Mililani Mauka Leeward Waipahu Central Pearl City Even More Important than For Sale and is Where we are headed? Oahu SFH December Distressed Property Units In Escrow (A.C.S.) Oahu Condo December Distressed Property Units In Escrow (A.C.S.) Diamond Head Metro Kailua Hawaii Kai Kaneohe SFH Ewa Makakilo Mililani Area Mililani Mauka Leeward Waipahu Aliamanu Central Pearl City Diamond Head Metro Kailua Hawaii Kai Kaneohe SFH Ewa Makakilo Mililani Area Mililani Mauka Leeward Waipahu Central Pearl City

13 Oahu had had its fair share of Foreclosures and like Distressed Properties this year. Overall, we are not like the Mainland, thank goodness. Our current inventory in Distressed Properties is manageable and much lower than the Mainland. The question is: Is what is happening on the Mainland going to affect us here? From the Wall Street Journal: "Number of the Week: 13 Months to Clear Housing Inventory" 13: The number of months it would take to sell off all the foreclosed homes in banks possession, plus all the homes likely to end up there over the next couple years, at the current rate of sales. How much should we worry about a new leg down in the housing market? If the number of foreclosed homes piling up at banks is any indication, there s ample reason for concern. Another 4.8 million mortgage holders were at least 6 days behind on their payments or in the foreclosure process, meaning their homes were well on their way to the inventory pile. That shadow inventory was up 3% from a year earlier. From Corelogic: December 13, 21, Santa Ana, Calif. CoreLogic (NYSE: CLGX), a leading provider of information, analytics and business services, today released negative equity data indicating a third consecutive quarterly decline 13


14 in negative equity for residential properties. CoreLogic reports that 1.8 million, or 22.5 percent, of all residential properties with mortgages were in negative equity at the end of the third quarter of 21, down from 11. million and 23 percent in the second quarter. This is due primarily to foreclosures of severely negative equity properties rather than an increase in home values. During this year the number of borrowers in negative equity has declined by over 5, borrowers. An additional 2.4 million borrowers were near negative equity with less than five percent equity in the third quarter. Together, negative equity and near-negative equity mortgages accounted for 27.5 percent of all residential properties with a mortgage nationwide. Negative equity, often referred to as underwater or upside down, means that borrowers owe more on their mortgages than their homes are worth. Negative equity can occur because of a decline in value, an increase in mortgage debt or a combination of both. "Negative equity is a primary factor holding back the housing market and broader economy. The good news is that negative equity is slowly declining, but the bad news is that price declines are accelerating, which may put a stop to or reverse the recent improvement in negative equity," said Mark Fleming, chief economist with CoreLogic Oahu Median Price $7, $6, $5, $4, Oahu SFH Median Price $3, $2, Oahu Condo Median Price $1, $ Estimate 14
15 Mike Gallagher s Predictions for 211 Based upon what we have learned from year 21, we can honestly say We are not the Mainland. I also conclude that if we are not the Mainland, we will still be affected by transpires on the Mainland in 211. What will transpire on the Mainland? Increased Delinquencies, Foreclosures, Short Sales and Equity Loss resulting in reduced Sales Prices. Continued high Unemployment, higher personal Taxes and ineffective Congress. What will transpire on Oahu? Increased Delinquencies, Foreclosures, Short Sales and Equity Loss resulting in reduced Sales Prices. Continued high Unemployment, higher personal Taxes and a Hawaii Government that will continue to add to the State and City & County Employee rolls and Social Program funding. We will see a higher State G.E. Tax, a State Income Tax increase and a Property Tax increase. This will be done in an effort to create jobs through increased Taxation and Public works projects, which is exactly what we are seeing now on the Horizon in The Rail, Sewers, Water infrastructure work. 15
16 Oahu Median Price Predictons $7, $6, $5, $4, $3, $2, $1, Oahu SFH Median Price Oahu Condo Median Price $ Estimate Dec. 211 It is my hope that you have enjoyed reading this report and that you have gained some market knowledge that will prove valuable to you during the coming year. I encourage you to ask questions, do your own research and give me a call to help you buy or sell your next home. Happy New Year! Mike Gallagher Broker in Charge, Abe Lee Realty Ethics Complaints Review Committee Member, Honolulu Board of Realtors
Oahu Report 1 st. Quarter March 2017
 Oahu Report 1 st. Quarter March 2017 Overall the best way to describe the Oahu S.F.H. Market is to tell you that it is Flat- Line. Unit Sales are barely up at +6%. New Listings are barely off at -6%. The
Oh, the Games Real Estate Agents Must Play
 Oh, the Games Real Estate Agents Must Play The Real Estate industry commonly utilizes a practice in tracking how efficient their agents are in obtaining the most amount of money for their Seller s listings
Oahu Report 2 nd. Quarter June 2017
 Oahu Report 2 nd. Quarter June 2017 Oahu Condo Executive Summary ALL June 2017 P.D.F. Overall the best way to describe the Oahu S.F.H. Market is to tell you that it is believe it or not, a very healthy
Oahu Real Estate December 2014 Year End Report
 Oahu Real Estate December 2014 Year End Report By: Mike Gallagher Real Estate, Inc. In order to view the next large Excel Spread depicting all Areas around Oahu and how they performed over twelve months
Arashi Is The Future For Oahu Real Estate Values
 Arashi Is The Future For Oahu Real Estate Values By: Mike Gallagher If you are like me, you may have not ever heard about this band of singers but you might want to take notice of them. This group just
Released: June 7, 2010
 Released: June 7, 2010 Commentary 2 The Numbers That Drive Real Estate 3 Recent Government Action 9 Topics for Home Buyers, Sellers, and Owners 11 Brought to you by: KW Research Commentary The housing
Kailua S.F.H. & Condo July 2017
 Kailua S.F.H. & Condo July 2017 Kailua S.F.H. Executive Summary ALL June 2017 P.D.F. 1 July 2017 Stats Taking a look at just the stats for the month of July we first see that Unit Sales are off by -30%
Kailua S.F.H. & Condo November 2017
 Kailua S.F.H. & Condo November 2017 Kailua S.F.H. Executive Summary ALL Third Quarter Year to Date September 2017 P.D.F September 2017 Kailua S.F.H. Stats Taking a look at just the stats for the month
Is There Trouble Brewing in Hawaii Real Estate?
 Is There Trouble Brewing in Hawaii Real Estate? By: Mike Gallagher, Mike Gallagher Real Estate, Inc. Is there trouble brewing in Hawaii s Real Estate Market? For several reasons, one in particular is the
THE HONOLULU BOARD OF REALTORS Volume 19, Number 2
 THE HONOLULU BOARD OF REALTORS Volume 19, Number 2 Second Quarter 2009 OVERALL MARKET CONDITIONS The residential housing market on O`ahu bounced back, somewhat, in the second quarter. There were sales
Housing Price Forecasts. Illinois and Chicago PMSA, December 2015
 Housing Price Forecasts Illinois and Chicago PMSA, December 2015 Presented To Illinois Association of Realtors From R E A L Regional Economics Applications Laboratory, Institute of Government and Public
FOR IMMEDIATE RELEASE Contact: David B. Bennett President & CEO Phone:
 FOR IMMEDIATE RELEASE Contact: David B. Bennett President & CEO Phone: 727-216-32 Email: dbennett@tampabayrealtor.com Real Estate Statistics for September 216 At this time of year everyone starts to get
2013 Housing Market Forecast. SILVAR: Los Gatos/Saratoga District October 10, 2012 Leslie Appleton-Young, Vice President & Chief Economist
 2013 Housing Market Forecast SILVAR: Los Gatos/Saratoga District October 10, 2012 Leslie Appleton-Young, Vice President & Chief Economist What we saw from the roof.. C.A.R. NAR THE ECONOMY Recent Housing
Scott Market Report Stronger Sales Continue
 June 20 Scott Market Report Stronger Sales Continue The Outer Banks real estate market is seeing good signs in most market segments. After a somewhat slow start to 20, sales agreements picked up significantly
The Crossroads of Real Estate
 The Crossroads of Real Estate By: Mike Gallagher, Mike Gallagher Real Estate, Inc. At no other time like the present do I see it being more critical for Young Families to choose wisely whether to buy a
FOR IMMEDIATE RELEASE Contact: David B. Bennett President & CEO Phone:
 FOR IMMEDIATE RELEASE Contact: David B. Bennett President & CEO Phone: 727-216-32 Email: dbennett@tampabayrealtor.com Real Estate Statistics for September 217 September s numbers are out, and it comes
Released: May 7, 2010
 Released: May 7, 2010 Commentary 2 The Numbers That Drive Real Estate 3 Recent Government Action 9 Topics for Home Buyers, Sellers, and Owners 11 Brought to you by: KW Research Commentary The economic
Shadow inventory in Texas
 With the national and local real estate markets turning positive, questions remain about the shadow inventory that was supposed to be holding down the market. Concerns over shadow inventory re-entering
AAug ugust 2017
 August 17 17 Housing recovery a balancing act Growth in new listings outpaced sales preventing inventory declines City of Calgary, September 1, 17 Sales posted a modest gain in August, but a rise in new
Housing Price Forecasts. Illinois and Chicago PMSA, January 2018
 Housing Price Forecasts Illinois and Chicago PMSA, January 2018 Presented To Illinois Realtors From R E A L Regional Economics Applications Laboratory, Institute of Government and Public Affairs University
Housing Price Forecasts. Illinois and Chicago PMSA, October 2014
 Housing Price Forecasts Illinois and Chicago PMSA, October 2014 Presented To Illinois Association of Realtors From R E A L Regional Economics Applications Laboratory, Institute of Government and Public
Monthly Market Watch for the Prescott Quad City Area. Provided by Keller Williams Check Realty Statistics from August 2012 Prescott MLS
 August 2012 Monthly Market Watch for the Prescott Quad City Area Provided by Keller Williams Check Realty Statistics from August 2012 Prescott MLS Report Overview: This report includes MLS data for the
Released: June Commentary 2. The Numbers That Drive Real Estate 3. Recent Government Action 9. Topics for Home Buyers, Sellers, and Owners 11
 Released: June 2011 Commentary 2 The Numbers That Drive Real Estate 3 Recent Government Action 9 Topics for Home Buyers, Sellers, and Owners 11 Brought to you by: KW Research Commentary The U.S. housing
FOR IMMEDIATE RELEASE Contact: David B. Bennett President & CEO Phone:
 FOR IMMEDIATE RELEASE Contact: David B. Bennett President & CEO Phone: 727-216-32 Email: dbennett@tampabayrealtor.com Real Estate Statistics for December 217 wrapped up a sizzling 217 with a steady month
CAAR Market Report 2010 First Quarter Published by the Charlottesville Area Association of REALTORS
 CAAR Market Report 2010 First Quarter Published by the Charlottesville Area Association of REALTORS Where Are We Now? In the first quarter of 2010, the Charlottesville real estate market continued the
State of Real Estate. From the Desk of Bill Chee SPECIAL EDITION 2010
 State of Real Estate SPECIAL EDITION 2010 From the Desk of Bill Chee CEO, Prudential Locations The question on everyone s mind is have we hit bottom yet? For the answer, we turn to the data. The beauty
1200 Premier Drive, Suite 140 Chattanooga, TN Each office is independently owned and operated.
 THIS MONTH IN REAL ESTATE K im aulston R REALTOR 1200 Premier Drive, Suite 140 Chattanooga, TN 37421 Each office is independently owned and operated. Cell: 423-316-4022 Office: 423-664-1600 Email: kcraulston@gmail.com
The Impact of Distressed Properties on Neighboring Values... 8
 why now is a great time to sell 2nd QUARTER 2011 table of contents 5 Reasons You Should Consider Selling Now... 1 Will I Get More Money If I Wait?... 3 Almost 14,000 Houses Sold Yesterday... 4 What Exactly
Real gross domestic product California vs. United States
 Real gross domestic product California vs. United States Percent change, year ago 6 4 U.S. California 2 0-2 -4-6 2001 2002 2003 2004 2005 2006 2007 2008 2009 2010 2011 Source: Bureau of Economic Analysis.
Housing Price Forecasts. Illinois and Chicago PMSA, April 2013
 Housing Price Forecasts Illinois and Chicago PMSA, April 2013 Presented To Illinois Association of Realtors From R E A L Regional Economics Applications Laboratory, Institute of Government and Public Affairs
A Premier Hawaii Real Estate and Land Company
 A Premier Hawaii Real Estate and Land Company Third Quarter 2012 Q Operating and Financial Results November 8, 2012 DISCLOSURE Kai Malu Maui Mall 36,000-acre sugar plantation on Maui Statements in this
Charlottesville Housing Market Report Year-End (Published by the Charlottesville Area Association of REALTORS )
") Charlottesville Housing Market Report - 2009 Year-End (Published by the Charlottesville Area Association of REALTORS ) This Quarterly Market Report is produced by the Charlottesville Area Association of
Charlottesville Housing Market Report - 2009 Year-End (Published by the Charlottesville Area Association of REALTORS ) This Quarterly Market Report is produced by the Charlottesville Area Association of
Housing market feels the chill as oversupply continues Feb. 2019
 February 19 19 MONTHLY STATISTICS PACKAGE Housing market feels the chill as oversupply continues 19, March 1, 19 The effects of Calgary s economic climate continue to create weak sales activity and elevated
This Month in Real Estate
 Keller Williams Research This Month in Real Estate Released: June 11, 2009 Commentary. The Numbers That Drive Real Estate Recent Government Action. Research for Buyers and Sellers. 2 4 10 13 1 Green Shoots
Monthly Indicators + 4.8% - 3.5% %
 Monthly Indicators 2015 New Listings were up 45.0 percent for single family/duplex homes but decreased 44.1 percent for townhouse-condo properties. Pending Sales increased 14.3 percent for single family/duplex
This Month in Real Estate
 Keller Williams Research This Month in Real Estate Released: September 14, 2009 Commentary. The Numbers That Drive Real Estate Recent Government Action. Research for Buyers and Sellers. 2 4 10 14 1 Green
Demand down with net migration
 July 1 Demand down with net migration City of Calgary, August, 1 In step with City census data on declining net migration levels, housing sales activity totaled 1,71 units in July, a 1. per cent decrease
2008 Mid-Year CAAR Market Report Real Estate Market is as Hot as ANWR
 2008 Mid-Year CAAR Market Report Real Estate Market is as Hot as ANWR By Dave Phillips, CEO Charlottesville Area Association of REALTORS Just about everything in life is relative to your perspective. Based
CAAR Market Report 2010 Mid-Year Published by the Charlottesville Area Association of REALTORS
 CAAR Market Report 2010 Mid-Year Published by the Charlottesville Area Association of REALTORS Where Are We Now? The pace of home purchases in the Charlottesville market area showed a significant increase
Coachella Valley Median Detached Home Price April April 2017
 The Desert Housing Report Median Price $450,000 $400,000 Coachella Valley Median Detached Home Price April 2002 - $349,000 $389,000 $350,000 $300,000 $250,000 $200,000 $150,000 CV Detached Median Price
things to consider if you are selling your house
 things to consider if you are selling your house KEEPINGCURRENTMATTERS.COM WINTER 2012 EDITION PAGE TABLE OF CONTENTS 1 3 5 7 9 House Prices: Where They Will Be in the Spring Understanding the Impact OF
2019 Housing Market Forecast. Palos Verdes Peninsula AOR January 8, 2019 Jordan G. Levine Senior Economist
 2019 Housing Market Forecast Palos Verdes Peninsula AOR January 8, 2019 Jordan G. Levine Senior Economist Overview Good News: Economic fundamentals solid Homeownership still the dream Rates might not go
September 2018 MLS Statistical Report
 September 218 MLS Statistical Report Total Sales Blame it on Hurricane Florence but overall, sales dropped drastically in August - down 17%. Total Sales Sept'18 172-17% Sept'17 26-2% Sept'16 211 7% 3 2
Aug. Aug 2018 ust 2018
 August 18 MONTHLY STATISTICS PACKAGE City of Calgary Unemployment rate slows housing market recovery 18 City of Calgary, September, 18 Easing sales, gains in new listings and elevated inventory levels
CALGARY REGIONAL HOUSING MARKET STATISTICS 12.14
 CALGARY REGIONAL HOUSING MARKET STATISTICS 12.14 Yearly records set as monthly sales see slight decline Condominium and townhouse sales set a new record for 214 Calgary, January 2, 215 It was a record
Housing and Economy Market Trends
 Housing and Economy Market Trends Mainstreet Organization Prices of single-family, detached homes in suburban Chicago increased 12.1 percent in May 2014 compared with the same period a year ago. Overall,
THINGS TO CONSIDER WHEN SELLING YOUR HOUSE
 THINGS TO CONSIDER WHEN SELLING YOUR HOUSE SPRING 2017 EDITION TABLE OF CONTENTS 3 5 REASONS TO SELL THIS SPRING WHAT S HAPPENING IN THE HOUSING MARKET? 5 LACK OF LISTINGS SLOWING DOWN THE HOUSING MARKET
Patience required in Calgary's housing market recovery Jul. 2018
 July 18 MONTHLY STATISTICS PACKAGE City of Calgary Patience required in Calgary's housing market recovery 18 City of Calgary, August 1, 18 Recent struggles in the job market, accompanied by yet another
A A p p r ril 2017
 April 17 17 Housing market retains momentum in April Citywide prices hold steady as labour market improves City of Calgary, May 1, 17 Calgary s housing market continued to show signs of stability in April.
Housing Market Cycles
 MEGA AGENT Market Update Gary Keller and Jay Papasan 2 The U.S. Housing Market Keller Williams Realty, Inc. Housing Market Cycles 4 The U.S. Housing Market Housing Market Cycles 5 The U.S. Housing Market
S Sep eptember 2016
 September Detached prices stabilize in soft market, October, The segment of Calgary s housing market with the greatest influence on the overall market is showing signs of pricing stability. The detached
Weak sales persist in Calgary and beyond Jun. 2018
 June 218 MONTHLY STATISTICS PACKAGE City of Calgary Weak sales persist in Calgary and beyond 218 City of Calgary, July 3, 218 Many Canadian energyrelated municipalities within Alberta and Saskatchewan
Fourth Quarter & Full Year 2013 Operating & Financial Results February 20, 2014
 Fourth Quarter & Full Year 2013 Operating & Financial Results February 20, 2014 DISCLOSURE Statements in this presentation that are not historical facts are forward-looking statements, within the meaning
Sep September 2018
 18 September 18 MONTHLY STATISTICS PACKAGE City of Calgary Persistent buyers market continues 18 City of Calgary, October 1, 18 With no change in the economic climate, Calgary s sales activity totaled
CALIFORNIA ECONOMIC & MARKET OUTLOOK. October 29,2014 Contra Costa Association of REALTORS Leslie Appleton Young, Chief Economist
 2014 2015 CALIFORNIA ECONOMIC & MARKET OUTLOOK October 29,2014 Contra Costa Association of REALTORS Leslie Appleton Young, Chief Economist OVERVIEW Economic Outlook California Housing Market Outlook Housing
Housing Price Forecasts. Illinois and Chicago PMSA, August 2017
 Housing Price Forecasts Illinois and Chicago PMSA, August 2017 Presented To Illinois Realtors From R E A L Regional Economics Applications Laboratory, Institute of Government and Public Affairs University
Oversupply persists despite improved sales activity for affordable product Mar. 2019
 March 19 MONTHLY STATISTICS PACKAGE Oversupply persists despite improved sales activity for affordable product 19, April 1, 19 March saw a modest decline in city wide sales activity compared to last year.
Housing Price Forecasts. Illinois and Chicago PMSA, July 2016
 Housing Price Forecasts Illinois and Chicago PMSA, July 2016 Presented To Illinois Association of Realtors From R E A L Regional Economics Applications Laboratory, Institute of Government and Public Affairs
OAHU HOUSING SALES CLOSE OUT 2016 STRONG AMID STABLE MEDIAN PRICES
 FOR IMMEDIATE RELEASE MEDIA CONTACT: Jocelyn Collado Becker Communications, Inc. (808) 533-4165 OAHU HOUSING SALES CLOSE OUT 2016 STRONG AMID STABLE MEDIAN PRICES HONOLULU (Jan.6, 2016) Oahu homebuyers
Orange County Housing Report: Too Much Noise. March 11, Good Afternoon!
 Orange County Housing Report: Too Much Noise March 11, 2018 Good Afternoon! Everybody seems to have an opinion about the direction of the housing market. Ignore the Noise: From talk of a housing bubble
Minneapolis St. Paul Residential Real Estate Index
 University of St. Thomas Minneapolis St. Paul Residential Real Estate Index September 2017 Welcome to the latest edition of the UST Minneapolis St. Paul Residential Real Estate Index. The University of
With last month's gain, sales are now up 4.5% from May 2015 and are at their highest annual pace since February 2007.
 JULY 2016 With last month's gain, sales are now up 4.5% from May 2015 and are at their highest annual pace since February 2007. - Lawrence Yun NAR s Chief Economist Now in its seventh year, the US economic
Year to Date (thru June)
") CAAR Market Report 2009 Mid-Year Published by the Charlottesville Area Association of REALTORS Where Are We Now? The pace of home purchases in the Charlottesville area continues to improve from the dismal
CAAR Market Report 2009 Mid-Year Published by the Charlottesville Area Association of REALTORS Where Are We Now? The pace of home purchases in the Charlottesville area continues to improve from the dismal
What is Currently Happening in Kakaako? By: Mike Gallagher
 What is Currently Happening in Kakaako? By: Mike Gallagher For some time now I have been tracking what I term the High End Sales for Single Family Homes in Oahu s seven Top Volume neighborhoods where homes
DATA FOR FEBRUARY Published March 20, Sales are up +19.6% month-over-month. The year-over-year comparison is down -7.3%.
 Permission is granted only to ARMLS Subscribers for reproduction with attribution on to ARMLS COPYRIGHT 2019. For questions regarding this publication contact Brand@ARMLS.com. DATA FOR FEBRUARY 2019 -
Housing Price Forecasts. Illinois and Chicago PMSA, January 2019
 Housing Price Forecasts Illinois and Chicago PMSA, January 2019 Presented To Illinois Realtors From R E A L Regional Economics Applications Laboratory, Institute of Government and Public Affairs University
DATA FOR SEPTEMBER Published October 13, Sales are down -9.7% month-over-month. The year-over-year comparison is at 0%.
 Permission is granted only to ARMLS Subscribers for reproduction with attribution on to ARMLS COPYRIGHT 2017. For questions regarding this publication contact Brand@ARMLS.com. DATA FOR SEPTEMBER 2017 -
Housing Price Forecasts. Illinois and Chicago PMSA, August 2016
 Housing Price Forecasts Illinois and Chicago PMSA, August 2016 Presented To Illinois Association of Realtors From R E A L Regional Economics Applications Laboratory, Institute of Government and Public
Released: February 8, 2011
 Released: February 8, 2011 Commentary 2 The Numbers That Drive Real Estate 3 Recent Government Action 10 Topics for Home Buyers, Sellers, and Owners 13 Brought to you by: KW Research Commentary Gradual
Housing Price Forecasts. Illinois and Chicago PMSA, March 2016
 Housing Price Forecasts Illinois and Chicago PMSA, March 2016 Presented To Illinois Association of Realtors From R E A L Regional Economics Applications Laboratory, Institute of Government and Public Affairs
California Housing Market Update. Monthly Sales and Price Statistics September 2018
 California Housing Market Update Monthly Sales and Price Statistics September 2018 Sales Had the Largest Decline since March 2014 California, September 2018 Sales: 382,550 Units, -3.3% YTD, -12.4% YTY
New year kicks off with slow sales Jan. 2019
 January 19 19 MONTHLY STATISTICS PACKAGE New year kicks off with slow sales 19, February 1, 19 As economic challenges linger into 19, housing markets remain on a sluggish pace. January sales totalled 8
Median Income and Median Home Price
 Homeownership Remains Unaffordable; Rental Affordability Showing Signs of Improvement Richard E. Taylor, Research Manager at MaineHousing MaineHousing has released the 217 Maine Homeownership and Rental
Annual Report on the Charleston Area Housing Market FOR RESIDENTIAL REAL ESTATE ACTIVITY FROM THE CHARLESTON TRIDENT ASSOCIATION OF REALTORS MLS
 Annual Report on the Charleston Area Housing Market FOR RESIDENTIAL REAL ESTATE ACTIVITY FROM THE CHARLESTON TRIDENT ASSOCIATION OF REALTORS MLS FOR RESIDENTIAL REAL ESTATE ACTIVITY FROM THE CHARLESTON
Condos or Single Family Homes?
 Condos or Single Family Homes? October 15, 2016 Considering how many actual reports I write each month in order to provide my website visitors a comprehensive look at what is really going on I find very
MONTHS OF SUPPLY AND PRICE CHANGES. Home improvement November marks a rise in sales. MONTHLY STATISTICS PACKAGE City of Calgary. Nov.
 November 17 17 Home improvement November marks a rise in sales. City of Calgary, December 1, 17 The November housing market was spurred by a rise in sales, particularly in the lower price ranges. Sales
MONTGOMERY COUNTY JANUARY 2019 MARKET IN A MINUTE A SUMMARY OF MARKET CONDITIONS FOR DECEMBER & 4TH QUARTER 2018
 STATPAK MONTGOMERY COUNTY JANUARY 2019 McEnearney.com MARKET IN A MINUTE A SUMMARY OF MARKET CONDITIONS FOR DECEMBER & 4TH QUARTER 2018 Contract activity in December 2018 was down 10.1% from December 2017
MARKET AREA UPDATE Report as of: 1Q 2Q 3Q 4Q
 MARKET AREA UPDATE Report as of: 1Q 2Q 3Q 4Q Year: 2013 Market Area (City, State): Arlington, Virginia Provided by (Company / Companies): McEnearney Associates, Inc. Realtors What are the most significant
+6.5% year-over-year -15.8% month-over-month. ARMLS STAT - December 21, 2015 MONTHLY SALES
 ARMLS STAT - December 21, 2015 MONTHLY SALES +6.5% year-over-year -15.8% month-over-month Permission is granted only to ARMLS Subscribers for reproduction with attribution to ARMLS COPYRIGHT 2015. 1 ARMLS
Provided by Keller Williams Realty Professional Partners Statistics from September 2010 MLS
 Monthly Market Watch for Maricopa County An overview of what is happening in the Maricopa County real estate market (using September 2010 statistics) Report overview: This report includes MLS data for
Dec December 2018
 December MONTHLY STATISTICS PACKAGE Job market weakness and lending restrictions a common thread in s housing market, January, 19 As oversupply continues in Calgary s housing market, December prices eased
MARKET IN A MINUTE A SUMMARY OF MARKET CONDITIONS FOR SEPTEMBER & 3rd QUARTER 2017
 STATPAK LOUDOUN COUNTY OCTOBER 2017 McEnearney.com MARKET IN A MINUTE A SUMMARY OF MARKET CONDITIONS FOR SEPTEMBER & 3rd QUARTER 2017 Contract activity in September 2017 was up just 0.6% from September
DATA FOR DECEMBER Published January 23, Sales are up.01% month-over-month. The year-over-year comparison is at +0.5%.
 Permission is granted only to ARMLS Subscribers for reproduction with attribution on to ARMLS COPYRIGHT 2017. For questions regarding this publication contact Brand@ARMLS.com. DATA FOR DECEMBER 2017 -
Contents. off the fence. It s a good life!
 I hope you enjoy the latest edition of Brian Buffini s Real Estate Report. The goal of this piece is to help you stay educated on today s market and position yourself as a true professional and your clients
ECONOMIC CURRENTS. Vol. 3, Issue 1. THE SOUTH FLORIDA ECONOMIC QUARTERLY Introduction
 ECONOMIC CURRENTS THE SOUTH FLORIDA ECONOMIC QUARTERLY Introduction Economic Currents provides an overview of the South Florida regional economy. The report contains current employment, economic and real
Summary Statistics. Closed Sales. Paid in Cash. Median Sale Price. Average Sale Price. Dollar Volume. Median Time to Sale.
 ly Market Detail - Q1 216 Summary Statistics Q1 216 Q1 215 Paid in Cash 57,913 57,742.3% 2,133 23,724-15.1% $23,5 $182, 11.8% Average Sale Price Dollar Volume $285,447 $266,453 7.1% $16.5 Billion $15.4
MARKET IN A MINUTE A SUMMARY OF MARKET CONDITIONS FOR MARCH & 1st QUARTER 2016
 STATPAK ` WASHINGTON, DC APRIL 2016 MARKET IN A MINUTE A SUMMARY OF MARKET CONDITIONS FOR MARCH & 1st QUARTER 2016 Contract activity in March 2016 was up 12.6% from March of 2015, and there were increases
2017 RESIDENTIAL REAL ESTATE MARKET REPORT
 2017 RESIDENTIAL REAL ESTATE MARKET REPORT Published January 26, 2018 Our market reports have been focused on the effects of low inventory on our housing market and for good reason. December 2017 marked
MONTHLY STATISTICS PACKAGE. City of Calgary. May creb.com
 MONTHLY STATISTICS PACKAGE City of Calgary May 1 creb.com Housing supply swells in cool spring market MONTHLY STATISTICS PACKAGE City of Calgary May 1 City of Calgary, June 1, 1 Calgary s housing inventory
Minneapolis St. Paul Residential Real Estate Index
 University of St. Thomas Minneapolis St. Paul Residential Real Estate Index Welcome to the latest edition of the UST Minneapolis St. Paul Residential Real Estate Index. The University of St Thomas Residential
O O ct ct ober 2017
 October Status Quo for Calgary's Housing Market Prices remain similar to last year, but ease in October., November 1, 17 October s housing market conditions closely echoed previous month s trends with
Single-Family Home Resales. Condominium Resales
 FOR IMMEDIATE RELEASE November 7, 2013 MEDIA CONTACT: Caroline Witherspoon Becker Communications, Inc. (808) 533-4165 HONOLULU HOME AND CONDOMINIUM SALES REMAIN STABLE, ACCORDING TO THE HONOLULU BOARD
Sell Your House in DAYS Instead of Months
 Sell Your House in DAYS Instead of Months No Agents No Fees No Commissions No Hassle Learn the secret of selling your house in days instead of months If you re trying to sell your house, you may not have
California Housing Market Update. Monthly Sales and Price Statistics December 2018
 California Housing Market Update Monthly Sales and Price Statistics December 2018 Sales Reached the Lowest Level since Jan 2015 California, December 2018 Sales: 372,260 Units, -5.2% YTD, -11.6% YTY 700,000
Commentary 2. Released: May The Numbers That Drive Real Estate 3. Special Report 9. Brought to you by: KW Research
 Released: May 2011 Commentary 2 The Numbers That Drive Real Estate 3 Special Report 9 Brought to you by: KW Research Commentary Despite lingering effects from regulatory changes in the mortgage markets,
Monthly Indicators + 7.3% + 6.6% + 8.3% Single-Family Market Overview Condo Market Overview New Listings Pending Sales.
 Monthly Indicators 2018 The three most prominent national market trends for residential real estate are the ongoing lack of abundant inventory, the steadily upward movement of home prices and year-over-year
Your home-buying team
 Your home-buying team Your team of helpers There are people who are trained to help you buy your home. It is a good idea to have a team of them. Some of the team members you must use. Others you do not
By several measures, homebuilding made a comeback in 2012 (Figure 6). After falling another 8.6 percent in 2011, single-family
. After falling another 8.6 percent in 2011, single-family") 2 Housing Markets With sales picking up, low inventories of both new and existing homes helped to firm prices and spur new single-family construction in 212. Multifamily markets posted another strong year,
2 Housing Markets With sales picking up, low inventories of both new and existing homes helped to firm prices and spur new single-family construction in 212. Multifamily markets posted another strong year,
OBSERVATION. TD Economics IS THE AMERICAN HOUSING REBOUND SUSTAINABLE?
 OBSERVATION TD Economics IS THE AMERICAN HOUSING REBOUND SUSTAINABLE? Highlights 2012 was a very good year for the U.S. housing market. Home prices were up almost 8% and housing starts by close to 30%.
MonthlyStatistics MAY 2018
 MonthlyStatistics MAY 2018 FOR IMMEDIATE RELEASE June 1, 2018 Single-Family Benchmark Price Surpasses $500,000 in May NANAIMO, BC The benchmark price of a single-family home in the VIREB area broke the