7960 Clark Road Jessup, MD
|
|
|
- Aubrie Johnson
- 6 years ago
- Views:
Transcription

1 7960 Clark Road Jessup, MD John Glover Johns Hopkins University Carey Business School Edward St. John Department of Real Estate BU Section 51 Practicum in Real Estate Development December 4, 2008 Practicum Advisor - H. Michael Schwartzman
2 7960 Clark Road Table of Contents 1.) Executive Summary 2.) Site Selection and Market Analysis 3.) Land Use and Public Policy 4.) Site Planning and Building Design 5.) Design and Construction Management Control 6.) Financial Analysis 7.) Market Strategy / Leasing 8.) Development Strategy 9.) References
3 Executive Summary Site Selection 7960 Clark Road, Jessup, Maryland (the Subject Property ) was selected as the proposed development site because of the Property s strategic location and flexible zoning. The Subject Site is a 13 acre parcel, located at the northeast quadrant of the intersection of Baltimore-Washington Parkway (I- 295) and Maryland Route 175. The property is located within one mile of Fort George G. Meade, one of the largest military bases in the United States. Fort Meade is home to the National Security Agency and it is slated to add approximately 25,000 new jobs by 2011 due to the Base Realignment and Closure (BRAC) initiative. As such, the site presents an opportunity for development that will capitalize on the expanding economy spurred by the BRAC legislation. Other major economic drivers feeding into the rapidly expanding local economy include the Baltimore-Washington International Thurgood Marshall Airport and the Arundel Mills Mall. Following the site selection a development plan, including an analysis for each aspect of the development process, was formulated. Highest and Best Use Analysis The Subject Site is currently unimproved and is zoned C-4 (Anne Arundel County), which allows for a wide variety of commercial uses, including office and retail. Additionally, the site has the potential to be up-zoned to MXD-T (Mixed-Use Transit), which would increase the permitted density and allow for residential uses on the site. Based upon the wide variety of uses allowed by the existing zoning and possibility of up-zoning to the site, the development plan that follows entails a detailed analysis of what use or combinations of uses will generate the highest and best use to take advantage of the expanding local economy. It was originally thought that a high-density/mixed-use development would yield the highest and best use. However, the available market data and detailed supply and demand analysis that follow, coupled with an analysis of the zoning and public land use policies, reveal that the highest and best use of the site is a retail development. Site Valuation and Financial Analysis Following the highest and best use analysis, the development plan outlines a determination as to the density of the proposed development, conceptual site layout, and conceptual building design. The resulting development program consists of 185,000 gross square feet of retail buildings on 4.25 acres of land and a surface parking lot with 925 spaces on approximately 6.90 acres of land. 1
4 Subsequent to formulating the development program a detailed financial analysis was conducted, along with strategies for marketing and financing the project. The financial analysis indicates that the proposed development is a viable project in the current market. The following summarizes the critical points of the financial analysis and the investment structure: Development Budget % of PSF Total Cost Land Acquisition $5,600,000 $ % Total Hard Costs $22,532,800 $ % Total Soft Costs $7,504,000 $ % Total Project Costs $35,636,800 $ Source and Uses Sources Uses Developer Equity $500,000 1% Land Acquisition $5,600,000 Equity Partner $11,973,000 34% Hard Costs $22,532,800 Debt $23,163,800 65% Soft Costs $5,054,000 Interest Carry $1,450,000 Development Fee $1,000,000 Total $35,636,800 Total $35,636,800 Debt Placement Proposed Construction Debt Loan Amount $23,163,800 Loan to Cost 65% Term 30 months; 1 option to extend 12 months Interest Rate LIBOR Current indicative rate of 4.90% Fee 1%; 1/2% for extension Recourse Full Recourse 2
5 Equity Structure Equity Investments Developer $500,000 Equity Partner $11,973,000 Total Equity Investment $12,473,000 Preferred Return to Partner 12% Investment Horizon 4 years Split 75% Projected IRR 19% Projected Multiple 2 times Preferred Return to Developer 12% Investment Horizon 4 years Split 25% Projected IRR 62% Projected Multiple 8 times Financial Performance Total Project Cost $35,636,800 $ psf Gross Potential Income $4,260,000 $23.03 psf Year One Net Operating Income $3,980,000 $21.51 psf Capitalization Rate 9% Value at Stabilization $44,222,222 $ psf Return on Cost 24% The current economic conditions and state of the capital markets are poor, and there is little enthusiasm in the marketplace for new commercial real estate development. This development is being proposed in a manner that makes it viable in the current market, despite these overall weak conditions. The development, as presented, is marketable, financeable, and provides return ratios to the equity investors at a level that the market currently requires. 3
 and Maryland Route 175.")
6 Site Selection and Market Analysis Location Overview The Subject Property is 7960 Clark Road, Jessup, Maryland, located at the northeast quadrant of the intersection of the Baltimore-Washington Parkway (I-295) and Maryland Route 175. The site is bound by Maryland Route 175 on the south, the Baltimore-Washington Parkway (I-295) on the west, Arundel Preserve (a 268-acre mixed-use community on the north), and Clark Road on the east. The property has approximately 900 feet of contiguous frontage along Clark Road and linear frontage on Maryland Route 175, as well as excellent visibility from the Baltimore-Washington Parkway. The Subject Property is centrally located within the heart of the Baltimore-Washington Corridor. It is approximately 10 miles south of Baltimore, 18 miles north of Washington, D.C., and 5 miles east of Columbia. Jessup, Maryland is located in the northeast quadrant of Anne Arundel County in an area that has been referred to as Anne Arundel County s Gold Coast. The area is currently experiencing rapid growth and development as the economy is fueled by nearby Fort George G. Meade, The National 4

7 Security Agency, BWI Thurgood Marshall Airport and the Arundel Mills Mall. The Gold Coast has become a center of defense and security technology development. The Subject Property s development potential stems from its proximity to Fort George G. Meade, which is the home to the National Security Agency (NSA) and is one of the largest military bases in the United States. The site is less than one mile from Fort Meade and the NSA, which have entrance gates on both the Baltimore-Washington Parkway and Maryland Route

8 The Subject Property consists of approximately acres and is minimally improved by the remnants of a single-story hotel known as the Parkway Inn. The hotel has been demolished; however, some asphalt parking surface and driveways remain. 6
, Fort George G.")
9 Market Analysis Anne Arundel County, Maryland Anne Arundel County is situated in central Maryland and is bordered by the Chesapeake Bay on the east, Baltimore County on the north, Howard County and Prince Georges County to the west, and Calvert County to the south. Anne Arundel County is centrally located and equidistant to Baltimore and Washington, D.C. Amenities and characteristics that define Anne Arundel County include the Maryland State Capital (in Annapolis), Fort George G. Meade, and The Baltimore-Washington International Thurgood Marshall Airport (BWI). Fort George G. Meade is one of the largest military bases in the United States, home to the National Security Agency, and is one of the nation s premier defense, intelligence and technology centers. BWI is the fastest growing airport in the region and it hosts a number of international and domestic carriers. Fort Meade and BWI are considered to be the main economic drivers of Anne Arundel County. Demographic data from the Maryland Department of Planning and the U.S. Bureau of the Census show that the total population in Anne Arundel County has grown since From 1990 to 2000 the total population grew nearly 15% and it is projected to continue growing by another 8% from 2000 to The total population growth was experienced across nearly all age groups; however, projections show that population growth will be negative in the age group. This population set is projected to shrink from 188,407 in 2000 to 178,040 in It is thought that the negative growth in this population set is part of an overall national trend and due to differing generation sizes. Despite this shrinking subset of the labor force, the overall labor force (population over 16 yrs of age) is expected to continue growing. The data shows that population grew by 4% from 2000 to 2005 and it is projected to grow at a similar pace during the remainder of this decade. Total households are experiencing growth similar to that of the total population. Total households grew nearly 20% from 1990 to 2000 and the projection is that households will grow another 8% by The average household size is declining, which is a national trend. Per capita income and household income have been rising in Anne Arundel County. The 1990 census figures showed per capita income at $28,303 and household income (mean) at $52,176. These figures rose to $36,464 and $74,100, respectively, in According to data obtained from the Anne Arundel Economic Development Corporation the income growth was driven by an increase in the number 7
10 of households earning more than $100,000 annually. There was a 215% increase in the number of households earning between $100,000 and $150,000 and a 306% increase in the number of households earning in excess of $150,0000 annually. Income on a per capita basis and on a household basis is projected to continue increasing during the remainder of this decade. The growth in incomes will be the result of a continued shift in the concentration of earners from lower income brackets to higher income brackets. In addition to wage/earnings growth, Anne Arundel County has also experienced growth in the number of jobs. According to data from the U.S. Bureau of Economic Analysis (BEA), the County had 251,726 jobs in 1990 and 297,317 in 2000 (an 18% increase). Projected totals for 2005 and 2010 are 346,900 and 378,900 respectively. The 16.7% growth in jobs from 2000 to 2005 is largely attributed to increases in government/military positions at Ft. Meade following September 11, Additional growth from 2005 to 2010 is projected based upon Ft. Meade being a net gainer of jobs following the 2005 Base Realignment and Closure (BRAC) Actions. Current estimates place the direct, indirect, and induced jobs being created in Anne Arundel County in conjunction with BRAC, in the range of 9,000 to 14,000 jobs through the next six plus years, and it must be noted that a significant percentage of them are in high technology and pay extremely well. Anne Arundel County s economic base is heavily reliant upon government and government enterprises as employers, primarily at the federal level. Over 30% of the wages earned in 2000 were from the government and government enterprises. The Anne Arundel County Economic Development Corporation indicates that the largest employer in the County is Fort Meade, which is an Army Military Base and home to the National Security Agency (NSA). Data obtained from the Maryland State Data Center show that there has been significant growth in this sector following the terrorist attacks on September 11, Government wages grew nearly 13% from 2001 to 2002 and from 2001 to 2005 wages grew 28.5% in the government sector. Other areas that experienced growth during the period from 2000 to 2005 include professional and technical services (this includes some government contractors), health care, and retail trade. According to the Anne Arundel County Economic Development Corporation, the BWI area (which includes Ft. Meade), located in the northwest section of the County, is a hub of commercial and industrial development supporting 50% of all jobs and 57% of all companies in the County. Based on data obtained on commuting characteristics of Anne Arundel County residents, nearly 60% of the residents work within Anne Arundel County and nearly 75% of the residents had a commute of 35 minutes or less. Therefore, it is assumed that much of the employee base is local to Anne Arundel County and is within a thirty-minute commute of the BWI submarket. 8
11 Due to the concentration of government/military jobs at Ft. Meade, BRAC will undoubtedly be the largest influence to the economic base of Anne Arundel County in the near future. Based upon the demographic data as presented, it appears that Anne Arundel County will continue to experience growth in population and households. The continued growth in total household coupled with a shrinking household size, will support growth in the residential market. Furthermore, as the size of the average household decreases, i the demand for smaller product types (townhomes, condominiums, and apartments) will grow. The growth in population and households will also support the commercial real estate market. As retailers generally focus on household income figures when determining whether to expand or enter into a market, the growth in income should work in concert with the growth in the number of households to support future retail development. The effects of BRAC and the related job growth should generally drive demand in the office space market too. Additionally, assuming that workers will generally maintain the characteristic of living local to their jobs, the future job growth should also be a demand driver for local housing and retail amenities. BRAC & Fort Meade Anne Arundel County is host to Fort George G. Meade, the home of NSA and a major gainer to the BRAC 2005 decision. Through the BRAC process, Fort Meade will be the site for the relocation and consolidation of several Department of Defense (DOD) organizations. The BRAC process is scheduled to be complete by September of Science Applications International Corporation prepared a report in 2006 for the Maryland Department of Business and Economic Development - Office of Military and Federal Affairs. According to the report, as a result of the BRAC Initiative, 5,695 direct jobs will be consolidated to Fort George G. Meade from around the country. The report states that the relocating organizations include the Defense Information Systems Agency (DISA), Defense Media Publications (DMA), and the Adjudication and Office of Hearing and Appeals Offices. A summary of the impact these relocating organizations will have is presented as follows: Defense Information Systems Agency (DISA) * 4,272 direct jobs relocating from Northern Virginia Military 340 jobs Federal Civilians - 2,493 jobs Embedded Contractors - 1,439 jobs * Building a $370 million, 1.1 million square foot facility; Phase I under construction and due to be completed in October of 2010; total project to be completed in February
12 Defense Media Publications (DMA) * 663 direct jobs relocating from Virginia, DC, and Texas Military 217 jobs Federal Civilians jobs Direct Contractors 132 jobs * A $61 million, 186,000 square foot facility to begin construction in 2009 with completion expected early The Adjudication and Office of Hearing and Appeals Offices * 760 direct jobs relocating from California, Ohio, Virginia, Massachusetts, and Arizona. * A $52 million, 152,000 square foot facility to begin construction in 2009 with completion expected early Other Department of Defense Growth Expected by 2015 * Fort Meade - 2,000 jobs (approximate) * National Security Agency - 4,000 jobs (approximate) * Enhanced Use Leasing - 10,000 jobs (approximate) * 1.5 million square feet of Class A and secured office space in a campus setting to attract private sector contractors supporting DISA; construction will begin in

13 BWI/Anne Arundel County Submarket The BWI/Anne Arundel County submarket is situated in the northwest quadrant of Anne Arundel County and serves as the County s largest employment center. It is home to Fort Mead, the NSA, Arundel Mills Mall and BWI Thurgood Marshall Airport. The submarket is bound by the Anne Arundel/Howard County line to the west, Belmont Road to the east, BWI to the north and the Anne Arundel/Prince George s County line to the south. BWI / Anne Arundel Submarket Map Submarket = 11
14 Office Submarket The BWI/Anne Arundel submarket is comprised of approximately 4.7 million square feet of office space. The submarket s primary office cluster is located along Route 295 just outside of Fort Meade. The National Business Park, developed by Corporate Office Properties Trust (COPT), is located at the northwest quadrant of the intersection of I-295 and Route 32. This 2.5 million square foot office park accounts for over half of the submarket s office inventory and is currently 97% occupied. Tenants within the National Business Park include companies that cater to the defense sector and the NSA, such as Lockheed Martin, Computer Sciences Corporation, Booz Allen Hamilton, and IBM. Smaller clusters of office space exist in business parks located around the Arundel Mills Mall and BWI. Submarket Statistics # Buildings: 75 % Vacant: 19.50% YTD Net Absorption: 198,147 RBA: 4,723,102 % Leased: 83.40% YTD Leasing Activity: 97,734 Avg Age (yrs): 16.5 % Available: 24.60% YTD Deliveries: 3 (Source CoStar, Inc. 10/08) Current Asking Rental Rates Direct Sublet Asking Rent # Spaces Avg Range # Spaces Avg Range Full Service Gross 30 $28.89 $21.00-$ $28.86 $25.00-$39.00 Modified Gross 7 $22.30 $4.20-$ Negotiable 99 $22.72 $12.50-$ Net 7 $30.00 $ Plus All Utilities 11 $26.01 $16.50-$ Plus Cleaning $29.00 $29.00 Plus Electric 5 $22.94 $17.00-$ TBD Triple Net 8 $19.81 $15.00-$ (Source CoStar, Inc. 10/08) Development Pipeline The development pipeline for office product within the submarket consists of several projects that have recently delivered space, projects under construction/development, and projects that are still in the planning phase. The pipeline includes the following six projects: 12


 National Business Park A")


15 Arundel Overlook Arundel Preserve Arundel Mills Corp. Park Parkside National Business Park Odenton Town Center 1.) National Business Park A 285-acre business park located at the intersection of I-295 and Route 32. The park was developed in several phases by Corporate Office Properties Trust and now consists of approximately 2.3 million square feet of office space. The final building within the park is now under construction. 300 Sentinel Drive is an 185,000 square foot building that is expected to deliver in late 2009 or early
16 2.) Arundel Preserve A 268-acre mixed-use community that is located at the intersection of I-295 and Arundel Mills Boulevard. The development will be delivered in phases over 10 years. Corporate Office Properties Trust will develop the office component of the community, which is expected to consist of 2 million square feet of space. COPT delivered the first building in the spring of 2008, and the 155,000 square foot facility is now available for occupancy. COPT is currently marketing building #2 (155,000 square feet) and building #3 (150,000 square feet). 3.) Arundel Mills Corporate Park A 20-acre mixed-used commercial office park located on Arundel Mills Boulevard as part of the Arundel Mills Mall Development. The project consists of 300,000 square feet of office space in two buildings. Building #1 was completed in 2005, totals 150,000 square feet and is currently 73% leased. Building #2 is 153,000 square feet and is currently under construction. This building is currently 45% preleased. 4.) Arundel Overlook A 68-acre project comprised of 313,000 square feet of office/flex space in eight buildings developed by St. John Properties. Arundel Overlook is located near the intersection of Route 100 and the Baltimore-Washington Parkway (I-295). Construction is complete on four buildings totaling 159,480 square feet and the occupancy level in these buildings is 46%. Construction on building #5 is underway and is expected to deliver in late 2008 or early ) Parkside A 244-acre development by Classic Community Corporation located in the southeast quadrant of the intersection of the Baltimore-Washington Parkway (I-295) and Route 175. Columbia-based Classic and the builder, Northern Virginia-based NVR, INC, are planning Parkside primarily as a residential community. It calls for 80% residential development, which equates to approximately 1,000 townhouse, condo and single-family units, with 15% office and 5% retail. This project is in planning and currently calls for approximately 410,000 square feet of office space. Groundbreaking is projected to occur in late ) Odenton Town Center A 128-acre mixed-use development located at the northeast corner of Route 32 and Route 175 in Odenton, Maryland. Odenton Town Center's campus setting will provide over 3,500,000 square feet of high-tech office space while also providing affordable residential and prime retail type space in close proximity. 14
17 Existing Supply Competitive Set National Business Park A 285-acre business park located at the intersection of I-295 and Route 32. The park was developed in several phases by Corporate Office Properties Trust and now consists of approximately 2.3 million square feet of office space. Occupancy within the park is over 95% with average rental rates ranging from $30-$35 per square foot (full service). Arundel Preserve A 268-acre mixed-use community that is located at the intersection of I-295 and Arundel Mills Boulevard. The development will be delivered in phases over 10 years. Corporate Office Properties Trust will develop the office component of the community, which is expected to consist of 2- million square feet of space. Corporate Office Properties Trust delivered the first building, located at 7740 Milestone Parkway, in the spring of The Class A facility is five stories and totals 153,000 square feet. Arundel Mills Corporate Park As noted above, the project consists of 300,000 square feet of office space in two buildings. Building #1 was completed in 2005, totals 150,000 square feet and is currently 73% leased. Building #2 is 153,000 square feet and is currently under construction. This building is currently 45% preleased. According to local office brokers asking rents within the Arundel Mills Corporate Park are currently averaging $28.50 per square foot. Arundel Overlook As noted previously, Arundel Overlook is located near the intersection of Route 100 and the Baltimore-Washington Parkway (I-295). The existing inventory within Arundel Overlook is comprised of four buildings totaling 159,480 square feet and the occupancy level in these buildings is 46%. Retail Submarket The BWI/Anne Arundel submarket is comprised of approximately 3.4 million square feet of retail space. The 1.3 million square foot super-regional outlet mall Arundel Mills dominates the retail market. The mall is located at the intersection of the Baltimore-Washington Parkway (I-295) and Maryland Route 100. The mall features tenants such as Bass Pro Shops, Best Buy, Modell s, Burlington Coat Factory, and Dave & Buster s. Additionally, the mall contains a Muvico Egyptian 24 Theater that is consistently one of the country s highest grossing boxes offices, with an estimated three million tickets sold annually. There are several big box power centers and a grocery anchored strip center surrounding the mall that 15
18 make up an additional 516,500 square feet of space. Thus, the Arundel Mills center comprises nearly two million square feet or 60% of the submarket. Submarket Statistics # Buildings: 62 % Vacant: 3.60% YTD Net Absorption: 31,903 RBA: 3,387,884 % Leased: 96.60% YTD Leasing Activity: 7,851 Avg Age (yrs): 23.6 % Available: 4.40% YTD Deliveries: 3 (Source CoStar, Inc. 10/08) Current Asking Rental Rates Direct Sublet Asking Rent # Spaces Avg Range # Spaces Avg Range Negotiable 14 $25.00 $ Triple Net 16 $16.15 $12.50-$ (Source CoStar, Inc. 10/08) 16


 Arundel Preserve A")


19 Development Pipeline The development pipeline for retail product within the submarket consists of a limited number of projects that have recently delivered space and projects that are still in the planning phase. The pipeline includes the following projects: Arundel Preserve Arundel Mills Arundel Preserve Arundel Village Parkside Corridor Marketplace 3 miles Ridgeview Plaza Odenton Town Center 1.) Arundel Preserve A 268-acre mixed-use community that is located at the intersection of I-295 and Arundel Mills Boulevard. The development will be delivered in phases over 10 years. 17
20 2.) Parkside A 244-acre development by Classic Community Corporation located in the southeast quadrant of the intersection of the Baltimore-Washington Parkway (I-295) and Route 175. This project is in planning and currently calls for approximately 135,000 square feet of retail space. Groundbreaking is projected to occur in late ) Odenton Town Center A 128-acre mixed-use development located at the northeast corner of Route 32 and Route 175 in Odenton, Maryland. Odenton Town Center's campus setting will provide over 3,500,000 square feet of high-tech office space while also providing affordable residential and prime retail type space in close proximity. Existing Supply Competitive Set The existing supply of retail space within the submarket varies greatly in age, condition, quality, and size. The following properties are deemed to be the most competitive and relevant retail centers within the submarket: 1.) Arundel Mills Mall - As noted previously, the Arundel Mills Mall is the main factor within the market. Until 2007, the 1.3 million square foot mall was the largest mall in Maryland. The mall is currently at full occupancy and features a total of 17 anchor tenants and over 225 specialty retailers. 2.) Arundel Village Arundel Village is an 86,000 square foot Safeway Grocery anchored retail center located adjacent to the Arundel Mills Mall campus. The center was built in 2004 and is currently 100% leased. 3.) Shops at Arundel Preserve - The Shops at Arundel Preserve is a 21,200 square foot retail development located at the intersection of Baltimore Washington Parkway (I-295) and Arundel Mills Boulevard and is a part of the Arundel Preserve Development. Construction of this center was completed in 2008 and the center is currently 86% leased. Rental rates range from $25 per square foot to $55 per square foot on a triple-net basis. 4.) Corridor Marketplace Corridor Marketplace is a big box power center located at the intersection of Route 198 and the Baltimore Washington Parkway (I-295). Tenants at the 370,000 square foot center include Weiss, Target, Kohls, The Party Store, Corridor Fine Wine Superstore, and Sports Authority. The center also has about 10,000 square feet of ancillary space that is currently 100% 18
21 leased. Corridor Marketplace is located at an intersection that is shared with the Russett Green Walmart & Sams Club Center. While these are two distinct projects, many shoppers and retailers view the two projects as one. 5.) Ridgeview Plaza Ridgeview Plaza is located on Route 175 at the intersection with Rockenbach Road. It is a 162,000 square foot neighborhood center anchored by Food Lion. The center is currently 54% leased. In recent years several large tenants including CVS and an antique mall vacated a large component of the center. Because it was built in 1986, the center may have some functional obsolescence. Highest and Best Uses / Demand Analysis Based upon the existing C-4 zoning designation, the Subject Property can be developed to support a variety of uses including office and retail space. Furthermore, if the site were up-zoned to the MXD-T designation the development would include a residential component. Therefore, the highest and best use analysis includes a demand analysis for each of these property classes (i.e., retail, office, and residential). Retail Demand Analysis The following analysis uses consumer spending data obtained from CoStar and sales productivity figures from the International Council of Shopping Centers (ICSC) to estimate the future demand for retail space within the Subject Property s BWI/Anne Arundel submarket. The analysis indicates that based upon actual 2007 spending data, the local market supports approximately 3.2 million square feet of retail space. Based upon projected spending data for 2012, the market is projected to support approximately 4.2 million square feet representing an increase in demand for approximately 1 million square feet during the next five years. When factoring in the existing inventory and vacancy, the analysis below indicates that the market will support the development of roughly 884,000 square feet of new retail space during the next five years (or 177,000 square feet annually). 19
22 Retail Demand Analysis 5 mile Radius (in thousands, except PSF & SF Data) Total Consumer Spending $3,139,300 Average Household Income $87,655 Groceries & Convenience Groceries Home) $163, % $192, % Reading Material (50%) $11, % $14, % Prescription Drugs $87, % $155, % Medical Supplies (50%) $3, % $4, % Total Alcoholic Home $45, % $60, % Total Groceries & Conv. $311, % $427, % Sales Productivity Requirement $450 psf $450 psf Total Sq. Footage Supported 693 sf 950 sf GAFO Apparel $268, % $339, % Furniture & Appliances $134, % $180, % Electronic Equipment $106, % $146, % Reading Material (50%) $11, % $14, % Photographic Equipment $2, % $2, % Medical Supplies (50%) $3, % $4, % Total GAFO $528, % $688, % Sales Productivity Requirement $285 psf $285 psf Total Sq. Footage Supported 1,855 sf 2,416 sf Eating & Drinking Places Food Away From Home $221, % $291, % Total Alcoholic Bev away $22, % $28, % Total Eating & Drinking Places $244, % $319, % Sales Productivity Requirement $375 psf $375 psf Total Sq. Footage Supported 652 sf 852 sf Total Retail Square Footage Supported 3,200 sf 4,218 sf Growth In Retail SF Supported 1,017 sf Less Existing Vacant Space 148 sf Plus 5% Frictional Vacancy 7 sf 5% Replacement Vacancy 7 sf Total Demand New Space 884 sf 20
23 Office Demand Analysis The following analysis shows historical and projected employment data for Anne Arundel County. The historical data was obtained from the U.S. Bureau of Economic Analysis (US BEA) while the current data and projected figures were obtained from the Maryland Department of Planning (MDP). Based upon the MDP projections, total employment in Anne Arundel County is estimated to grow by approximately 10,000 new jobs. The analysis assumes that 75% of all jobs require office space, that the each office worker creates demand for 300 square feet of office space, and that the BWI/Anne Arundel submarket will capture 45% of the job growth. While this capture rate may appear high, it is expected that BRAC and job growth at Ft. Meade will be the dominant driver of job growth within the County during the next several years. Based upon these assumptions, the submarket supports roughly 1.3 million square feet of new office development. The analysis shows that this demand can be absorbed by the existing inventory and the space currently under construction. The market and future demand for office space does not currently support additional development. Office Demand Analysis U.S. BEA U.S. BEA MDP MDP MDP Anne Arundel County Employment 251, , , , ,900 Total Nonfarm Employment 251, , , , ,180 % Nonfarm to Total Employment % 99.83% 99.87% 99.81% 99.81% % Of Nonfarm Employment using office 75% 75% 75% 75% 75% Total office using Employees 188, , , , ,635 Total Employment Growth ,073 Average SF Per Employee 300 Total Gross Market Demand 3,021,778 Submarket Capture Assumption 45% Total Submarket Gross Demand 1,359,800 Less Existing Vacant Space 922,671 Plus 5% Frictional Vacancy 46,134 5% Replacement Vacancy 46,134 Total Demand New Space 529,396 Under Construction / in Pipeline 585,000 Market Surplus (55,604) 21
24 Residential Demand Analysis The analysis below shows historical and projected household data for Anne Arundel County and the Baltimore region. The historical data was obtained from the U.S. Bureau of Economic Analysis (U.S. BEA) while the current data and projected figures were obtained from Maryland Department of Planning (MDP). As the table demonstrates, Anne Arundel County typically accounts for roughly 19% of the households within the Baltimore MSA. Based upon the MDP projections, the number of households in Anne Arundel County is estimated to grow by approximately 11,525 during the period from 2005 to U.S. BEA % Of U.S. BEA % Of MDP % Of MDP % Of 1990 Total 2000 Total 2005 Total 2010 Total BALTIMORE REGION 867, % 958, % 1,001, % 1,060, % Anne Arundel County 149,114 17% 178,670 19% 189,925 19% 201,450 19% Baltimore County 268,280 31% 299,877 31% 312,500 31% 327,575 31% Carroll County 42,248 5% 52,503 5% 58,500 6% 64,675 6% Harford County 63,193 7% 79,667 8% 87,125 9% 97,000 9% Howard County 68,337 8% 90,043 9% 97,625 10% 107,400 10% Baltimore City 276,484 32% 257,996 27% 255,825 26% 262,850 25% New housing construction data was obtained from the MDP for the period from 2005 through Assuming that 100% of these units have been absorbed, and based upon the future household growth, the future demand for housing in Anne Arundel County through 2010 totals approximately 5,785 housing units. According to the 2000 Census, the homeownership rate within Anne Arundel County is 75%. Therefore, the assumption is made that 25% of the housing demand will be for multifamily rental product. The resulting annual demand for multifamily housing within Anne Arundel County totals 472 units. Household Growth ,525 Less New Housing Units Constructed 2005 Calendar Year 2, Calendar Year 1, Calendar Year 1,831 Units needed ,785 Annual Need for Anne Arundel County 1,928 Propensity to Rent (based on 2000 Census) 25% Annual Need for Multifamily Product
25 Conclusion: Based upon the market supply and demand dynamics outlined above, a development program that contains an office component would not be successful. While there is future growth in demand for office space, the development community appears to have met this demand with the existing and proposed office development pipeline. In fact, the analysis hints towards overbuilding within this sector. Similarly, the demand for residential product within Anne Arundel County is expected to grow and remain strong; however, there is a substantial amount of single family and multifamily development in the planning stages and currently under development. The demand analysis does not trend toward any pent up market demand, so the success of residential development at the Subject Property is highly dependent upon the product arriving on the market prior to the competition. Thus, the success of delivering residential product to the market prior to the competition is highly dependent upon the entitlement process and the timing of the competition s development. The demand and supply balance is most favorable within the retail sector. The retail demand analysis is based upon historical spending data and recent macroeconomic data trends toward a slowing in the spending data. Therefore, the demand analysis above may be somewhat misleading; however, based upon the low vacancy rates and projected job growth within the submarket, it is expected that retail demand will continue to be strong enough to support a retail development at the Subject Property. 23


26 Land Use and Public Policy Existing Zoning Analysis: A review of the local zoning map indicates that the Subject Property currently carries the C-4 zoning designation. The C-4 designation is rare within Anne Arundel County and the Subject Property is one of only twenty-one parcels larger than 12 acres with C-4 zoning within the county. This zoning designation is generally intended for larger scale auto-oriented retail and service businesses along or near major traffic routes that serve local and regional residents as well as the traveling public. 24
27 Based upon the bulk regulations outlined in the following table, the Subject Property s C-4 zoning classification allows for up to 581,960 square feet of gross building space (13.36 acres at a 1.0 FAR). C-4 Zoning Bulk Regulations Subject Property Actual Minimum Lot Size 10,000 square feet 582,152 square feet Minimum Lot Depth 150 feet feet Maximum Floor Area Ratio ,152 square feet Maximum Lot Coverage by Structures and Parking 85% 85% Maximum Building Height 60 feet 60 feet Minimum Setbacks (for principal structure) Front lot Line Rear lot Line All lot lines Minimum Setbacks (for accessory structure) Front lot Line Rear lot Line All lot lines Rear Service Area 20 feet 20 feet 60 feet from right-ofway line of a divided principal arterial road 20 feet 20 feet 60 feet from right-ofway line of a divided principal arterial road Accessible by a 15-foot wide unobstructed rightof-way 25
28 Zoning Amendment Analysis: Donnie Gross, a principal of Potomac Holdings, LLC, the current owner of the Subject Property, indicated that the site has up-zoning potential. Gross and Mike Fox, a representative of the Anne Arundel County Planning and Zoning Department, have both indicated that the site could be up-zoned from C-4 to MXD-T (Mixed-Used Transit). This zoning designation is designed to promote the mixing of residential, commercial and industrial uses in varying proportions. The mixing of uses is optional and where the mixing of uses has been pursued, more intense development has been approved. Generally, the minimum site area is 10 acres. Based upon the bulk regulations outlined in the table below, if the Subject Property was up-zoned to the MXD-T zoning classification, it would support a 1,163,920 square foot mixed use development (13.36 acres at a 2.0 FAR). Bulk Regulations Maximum residential net density 22 units / acre Maximum floor area ratio 2.0 Maximum building height 150 feet Category of Use Percentage Proportion of FAR Residential 30% - 70% Retail & Service 10% - 35% Office 10% - 40% Industrial 0% Open area (% of gross area of site) 20% minimum Public activity area (% of gross area of site) 20% minimum There are two methods of rezoning property in Anne Arundel County. The first option is to submit an application for rezoning to the Zoning Division of the Office of Planning and Zoning. The Zoning Division of the Office of Planning and Zoning will then review the application and various agencies provide a written report with comments that formulate its findings and recommendations to the Administrative Hearing Officer. A public hearing is held and the Administrative Hearing Officer will render a decision within 30 days of the hearing. Rezoning is granted or denied in accordance with the appropriate zoning regulations, but a rezoning may not be granted except on the basis of an affirmative finding that there was a mistake on the zoning map or the character of the neighborhood has changed to such an extent that the zoning map should be changed. This is generally referred to as the change or mistake clause. During interviews with county zoning officials and zoning attorneys with Linowes & 26
29 Blocher, it was revealed that zoning change requests under the change or mistake clause are typically denied. It is very difficult for zoning attorneys to argue that there was a mistake in the preparation of the zoning map because the comprehensive zoning process is so lengthy and involves significant public involvement. Similarly, attorney s and property owners rarely convince the Hearing Officer that the immediate vicinity surrounding the property have changed so dramatically that the zoning map should be amended without going through the comprehensive zoning process. Brad Kotz, principal with Seneca Properties, Inc., confirmed the challenges of obtaining a zoning change through the change or mistake clause. Despite having the support of local community groups, Seneca Properties, Inc. was recently denied for a rezoning request through this process on a 44-acre parcel located in the same submarket as the Subject Property. As such, this is not the appropriate process for rezoning the Subject Property. The second, and more compatible, method of rezoning property in Anne Arundel County is through the Comprehensive Zoning Process. This is the desired method of rezoning the Subject Property. This process is generally tied to the General Development Plan Process. Anne Arundel County s General Development Plan, or GDP, is a comprehensive land use plan prepared in compliance with Ssate requirements and guidelines. The GDP is a policy document that is formally adopted by the County Council. It establishes policies and recommendations to guide land use decisions over the 10 to 20 year planning horizon. The GDP is used by the County in making decisions about growth and development, land preservation, resource protection, and the provision of infrastructure and services. Recognizing the unique character of Anne Arundel County s different communities, the General Development Plan divided the County into 16 small planning areas and recommended that a separate, more detailed land-use plan be completed for each. These Small Area Plans serve as a guide for land use, zoning, transportation improvements, open space and other capital improvements and identify opportunities for commercial revitalization and, where appropriate, mixed-use development. The Small Area Plan, includes a recommended zoning map, and property owners or others interested in the zoning process may request a change in the zoning of their property or the property of others. Any property owner, community association or other interested party, whether a property owner or not, may request a change from the zoning of a property that is shown on the recommended zoning map. Upon completion of a General Development Plan or Small Area Plan, the County undertakes a process to bring zoning into compliance with any changes in land use. This process is known as Comprehensive Zoning. An application for a zoning change through this Comprehensive Zoning process is submitted to the County and is reviewed by the county s planning staff. The planning staff then makes a recommendation to maintain or change the zoning and provides a written report to the Planning Advisory 27
30 Board, which conducts a public hearing to consider any changes to the Plan and recommended zoning map. The Planning Area Board also reviews the General Development Plan, Small Area Plans and various facility master plans such as the Solid Waste Master Plan and the Water and Sewer Master Plan. Recommendations by the Planning Area Board are made to the County Executive who then forwards the Plan to the County Council. The County Council conducts public hearings and adopts the Plan. Subsequent to adoption of the Plan, official zoning maps are prepared and submitted to the County Council. After the zoning maps are submitted to the County Council, Council members through an amendment process may consider requests for changes. Once the zoning maps and any amendments are adopted, they become the official zoning for that planning area. The existing GDP dates back to 1997 and is currently being updated. Work on the 2008 GDP update began in July 2007 and will continue through A series of public forums are planned for December 2008 at which time preliminary findings and recommendations will be presented. Completion of a Final Draft Plan is targeted for January A county planning representative indicated that the window for petitioning for a zoning change/recommendation as part of the draft plan process has expired. Furthermore, the representative indicated that a petition requesting a zoning change for the Subject Property had not been filed and will likely not be a part of the Staff-prepared draft plan. Based on information obtained from the planning staff member, the current timeline for the comprehensive is estimated as follows: Draft plan complete in early Submitted to the Planning Advisory Board for approval in spring 2009 Public hearing process complete Forward plan to county council for legislative process. Complete in late 2009 early Conclusion: Anne Arundel County Planning Staff has indicated that the current property owner has not requested a zoning change through the comprehensive planning process. The period during which property owners were to make such a request has expired. As such, any request for a zoning change via the comprehensive planning process would need to be implemented after the existing comprehensive planning process is completed. As noted previously, the planning process that is currently underway is not likely to be complete until 2010, at which time an amendment request could then be submitted to the county. According to local zoning attorneys with Linowes and Blocher, a zoning change through this 28
31 amendment process involves significant public involvement and may consume as much as 24 months of time. The timing of this process was confirmed in an interview with Brett Griffith, Principal with Fortis Development. Fortis Development is currently working through the comprehensive rezoning process on a parcel located within the Subject Property s submarket along Maryland Route 175. Given these timeframes, a zoning change through this amendment process could not be complete until 2012 or even The soft costs associated with rezoning the property, including the cost of carrying the land, through such an extended timeframe make the process financially infeasible. Furthermore, the extended timeframe allows other projects that are already in the entitlement and development pipelines to deliver product to the market prior to a time in which product could be delivered at the Subject Property. As such, those projects are likely to capture a dominant portion of the existing demand. In conclusion, based upon the market dynamics and the approval process outlined above, the added benefits of additional floor area ratio and the inclusion residential product in the development plan are not worth the costs and risks associated within the rezoning process. 29

32 Site Planning and Building Design Small Area Plan Analysis and Zoning Requirements Recognizing the unique character of Anne Arundel County s different communities, the General Development Plan divided the County into 16 small planning areas and recommended that a separate, more detailed land-use plan be completed for each. These Small Area Plans serve as a guide for land use, zoning, transportation improvements, open space and other capital improvements and identify opportunities for commercial revitalization and, where appropriate, mixed-use development. The Subject Property lies within the Severn Small Area. General Recommendations The Severn Small Area Plan addresses community history and character, land use, zoning, transportation, natural and historic resources, public utilities, community facilities, and community design. The Plan analyzes the existing conditions, establishes and makes recommendations for achieving these goals. The following is a summary of the recommendations made within the Plan that impact development on the Subject Property: The Plan recommends developers support the County s conservation efforts, in conjunction with the Forest Conservation Act, by planting more hardwood trees (e.g. oak, hickory, beech). The Plan recommends improvement of storm water management to reduce, and where possible, eliminate the negative environmental impacts of storm water runoff. Hiker/biker trail connectivity is a very important issue for the residents of Severn. The Plan states that any new development must include pedestrian and bicycle connections not only within the 30
33 development but also between new development, the community shopping areas, and the Arundel Mills Mall. Additionally, the Plan recommends establishing regular bus loop route(s) that will serve the Severn Small Area and should include connectivity to Town Centers and to air and rail service. The Plan recommends that development design for the establishment of a coffee shop, deli, or bistro with some outdoor seating, in each of several key locations along pedestrian/bicycle pathways adjacent to commercial areas. The Plan outlines a Clark Road reconfiguration to slow traffic and create a disincentive for through traffic. The Plan mandates that all development be in compliance with the Adequate Public Facilities Ordinance. Design Guidelines The Severn Small Area Plan recommends that the area surrounding the section of Maryland Route 170 and Old Donaldson Avenue, located in the northeastern section of the Severn Small Area, be redeveloped into a village. The Plan outlines design guidelines for the Severn Village, but does not have specific recommendations or guidelines for property outside of the Severn Village footprint. While the Subject Property falls outside of the Severn Village footprint, the local community groups along with the county s planning and zoning staff, agree that several of the recommendations regarding design characteristics in Severn Village be carried forward into development outside of the Severn Village footprint. While much of the recent development activity in the Severn Small Area has occurred outside of the area designated to become the Severn Village, it has incorporated some of the design standards that are discussed in the Small Area Plan. Therefore an effort will be made to conform to many of the design standards outlined for Severn Village. The guidelines and recommendations in the Severn Small Area Plan that will be adhered to are as follows: Massing Building masses should reflect a residential village character with facades not exceeding 40 feet in length unless treated with articulations to provide the perception of 40 foot or smaller facades. These articulations should include stepping of the facade and at least two of the following: 1. Change in color 2. Change in material 3. Change in window type 4. Change in entryway treatment Site Design Site design should reflect the small-scale, fine weave character of a village. Any site design containing more than three buildings should vary footprints, colors, rooflines, and/or other architectural detailing to avoid repetition. Site design and architectural design should be designed together to create buildings that define pedestrian spaces. 31
34 Sidewalks All pedestrian walkways should be distinguished from driving surfaces through the use of durable, low maintenance surface materials. Sidewalks should be set either directly against the curb or directly behind planting strips that set directly against the curb. Planting All properties should provide at least one shade tree per 40 feet of street frontage. This tree may be located in a planting strip set directly against the curb, in sidewalk tree gates or in rightof-way between the sidewalk and the front yard. Screening Areas for outdoor storage, truck parking, trash collection or compaction, loading or other such uses should either be placed out of view of public streets and spaces or screened with materials that are similar in kinds and quality to the principal materials of the building and landscape. Where parking lots and/or the rear service areas of buildings are visible from public roadway, a buffer of vegetative screening with a minimum width of ten feet, attractive brick walls not taller than three feet, and/or other screening methods should be used. Access/Circulation Circulation patterns should be designed to minimize curb cuts and should be designed to avoid problems between vehicular, bicycle and pedestrian traffic. Proposed Development Program Based upon the highest and best use analysis and the zoning analysis, the proposed use for the Subject Property is retail. The zoning regulations dictate the allowable density of the development; however, as the proposed use is a retail development, parking and lot coverage are the factors that have the greatest impact to the overall square footage of the proposed development. Brandon Weiss, a retail broker with N.A.I., indicates that retailers prefer that shopping centers have a ratio of not less than three and a half spaces per 1,000 square feet of gross building space within the center and many require a ratio of not less than four spaces per 1,000 square feet. Stephen Pugh, President of The Rappaport Companies, and Fred Wine, President of The Quantum Companies, are both retail property owners and developers that confirmed tenants desire for this parking ratio. To ensure that the proposed project is marketable, the development program outlines a parking ratio of five spaces per 1,000 square feet of space. In lieu of structured parking, surface parking will be used as it is the most cost effective type of parking and generally the most accepted by shoppers and retailers. In a typical configuration for surface parking lots, one parking stall (including a pro-rata portion of the drive aisles and landscaping) utilizes approximately 325 square feet of space. Therefore, as summarized in the table below, the optimal development program consists of 185,000 gross square feet of retail buildings on 4.25 acres of land and a surface parking lot with 925 spaces on approximately 6.90 acres of land. 32
35 Square Footage Acreage Subject Property Size 581,962 sf ac Lot Coverage Ratio 85% 85% "Buildable" Space 494,667 sf ac Proposed Retail Space 185,000 sf 4.25 Number of spaces per 1,000 square feet 5 5 Number of Spaces Required Space Required per Parking Space (includes drive aisles & landscaping) 325 sf 0.01 ac Parking lot space requirement 300,625 sf 6.90 ac Total Space used 485,625 sf ac Conceptual Site Plan and Conceptual Building Design In determining the building design for the Project, it is important to adhere to the guidelines set forth in the small area plan. Therefore, the Subject Property in its site and building design will attempt to deliver many of the desired features and concepts discussed in the Small Area Plan analysis. It is the intent to deliver a village-like shopping center, rather than the traditional suburban strip center. This entails breaking up large building masses by using multiple retail buildings, varying rooflines along longer facades, changing facade materials and color. Additionally, an attempt will be made to create small pedestrian plazas, green spaces, and other spatial amenities within the development. Similarly the site design will attempt to mimic the feel of a small-scale shopping district. As the final design includes multiple buildings, so an attempt to vary footprint size, colors, rooflines, and other architectural detailing will be made. This helps avoid the feeling of repetitious or cookie-cutter design. 33
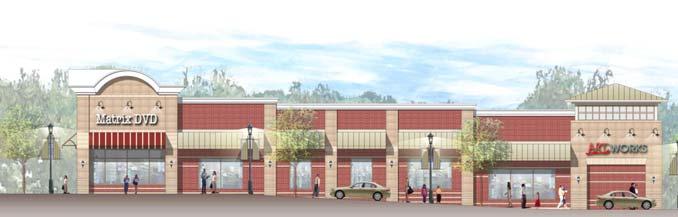

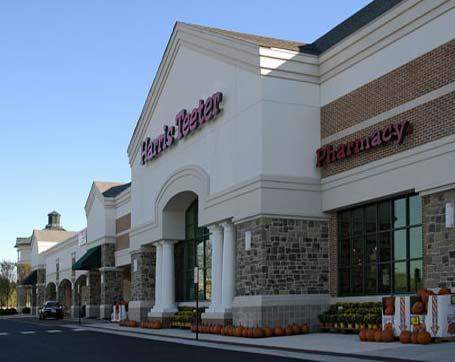
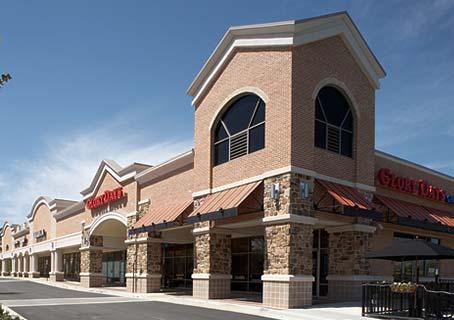

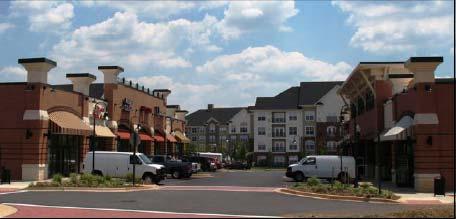
36 Illustrative Examples of Desired Architecture 34


37 The Subject Property stands to benefit greatly from its proximity to the large scale mixed-use developments that are in close proximity to the site. Arundel Preserve, located adjacent to the north side of the Subject Property, is being developed over a ten-year period and will contain over two million square feet of office space, three hotels, and approximately 1,100 housing units. To capture a large percentage of this market s retail needs, effort will be made to orient the Project towards Milestone Parkway (Arundel Preserve s main thoroughfare). As an attempt to create an environment at the Subject Property that will blend into the Arundel Preserve Development, the development team will engage, The Faux Group as the landscape architect. The Faux Group is the same landscape architect that has worked on the Arundel Preserve Development and many other projects within the Anne Arundel market. The Faux Group has a distinct advantage in determining the optimal site design to unify the Subject Property with the southern portion of the Arundel Preserve Development. Conceptual Site Plan RAMP TO 295 NORTH RETAIL BLDG 3 RETAIL BLDG 4 RETAIL BLDG 1 MD ROUTE 175 RETAIL BLDG 2 RETAIL BLDG 5 CLARK ROAD 35
Appendix A: Guide to Zoning Categories Prince George's County, Maryland
 Appendix A: Guide to Zoning Categories Prince George's County, Maryland RESIDENTIAL ZONES 1 Updated November 2010 R-O-S: Reserved Open Space - Provides for permanent maintenance of certain areas of land
TASK 2 INITIAL REVIEW AND ANALYSIS U.S. 301/GALL BOULEVARD CORRIDOR FORM-BASED CODE
 TASK 2 INITIAL REVIEW AND ANALYSIS U.S. 301/GALL BOULEVARD CORRIDOR FORM-BASED CODE INTRODUCTION Using the framework established by the U.S. 301/Gall Boulevard Corridor Regulating Plan (Regulating Plan),
PEACHTREE INDUSTRIAL BOULEVARD small area study
 PEACHTREE INDUSTRIAL BOULEVARD small area study EXECUTIVE SUMMARY: MARKET RESEARCH FINDINGS DUNWOODY CITY COUNCIL RETREAT JUNE 4, 2018 STUDY SCOPE AND GOALS Bleakly Advisory Group (BAG) was retained to
Bowie Marketplace Residential Detailed Site Plan Statement of Justification January 13, 2017 Revised February 2, 1017
 Bowie Marketplace Residential Detailed Site Plan Statement of Justification January 13, 2017 Revised February 2, 1017 Submitted on behalf of: BE Bowie LLC 5410 Edson Lane, Suite 220 Rockville, MD 20852
MIDLAND MULTIFAMILY PORTFOLIO
 MIDLAND MULTIFAMILY PORTFOLIO MIDLAND PORTFOLIO 50 UNITS EXCEPTIONAL INVESTMENT OPPORTUNITY HIGH GROWTH MARKET Town & Country Apartments 3310 Bedford Avenue Midland, Texas 79703 Simpatico Apartments 2910
Anne Arundel County General Development Plan Background Report on Land Use
 Anne Arundel County General Development Plan 2008 Background Report on Land Use June 2008 I. Introduction Decisions and policies regarding land use are one of the most important components of a local comprehensive
Industrial Real Estate Portfolio
 Industrial Real Estate Portfolio Portfolio Coverage Page 7 6565 Echo Avenue, Reno, NV Property Summary Address: Size (SF): Office Finish: HVAC Space: Year Built: 2003 Site Area: 6565 Echo Avenue Reno,
Las Vegas Valley Executive Summary
 ARROYO MARKET SQUARE Las Vegas Valley Executive Summary Retail Market 4th Quarter 2013 THE DISTRICT AT GREEN VALLEY RANCH January 23, 2014 Re: Commercial Real Estate Survey: 4th Quarter, 2013 Dear Reader,
Planning Justification Report
 Planning Justification Report Kellogg s Lands City of London E&E McLaughlin Ltd. June 14, 2017 Zelinka Priamo Ltd. Page i TABLE OF CONTENTS Page No. 1.0 2.0 2.1 2.2 3.0 4.0 5.0 5.1 5.2 5.3 5.4 5.5 5.6
Shawnee Landing TIF Project. City of Shawnee, Kansas. Need For Assistance Analysis
 Shawnee Landing TIF Project City of Shawnee, Kansas Need For Assistance Analysis December 17, 2014 Table of Contents 1 EXECUTIVE SUMMARY... 1 2 PURPOSE... 2 3 THE PROJECT... 3 4 ASSISTANCE REQUEST... 7
DRAFT. Amendment to the Master Plan Land Use Element for Block 5002, Lot Township of Teaneck, Bergen County, New Jersey.
 DRAFT Amendment to the Master Plan Land Use Element for Block 5002, Lot 18.01 Township of Teaneck, Bergen County, New Jersey Prepared for: Township of Teaneck Planning Board Prepared by: Janice Talley,
LIBERTY PLACE ELITE LIBERTY PLACE ELITE STREET LEVEL RETAIL & OFFICE SUITES. Premier Downtown Redevelopment PREPARED FOR:
 LIBERTY PLACE STREET LEVEL RETAIL & OFFICE SUITES PREPARED FOR: CASEY GODWIN Creative Office Space Requirement TBD FOR MORE INFORMATION CONTACT: HEATHER HAGERMAN 540.369.4622 hhagerman@cbecommercial.com
Provide a diversity of housing types, responsive to household size, income and age needs.
 8 The City of San Mateo is a highly desirable place to live. Housing costs are comparably high. For these reasons, there is a strong and growing need for affordable housing. This chapter addresses the
Great Elm Capital Group, Inc. An Introduction to the Fort Myers Transaction & GEC s Real Estate Strategy
 Great Elm Capital Group, Inc. An Introduction to the Fort Myers Transaction & GEC s Real Estate Strategy March 6, 2018 2018 Great Elm Capital Group, Inc. Disclaimer Statements in this presentation that
AUSTIN, TEXAS MUELLER ROSE INVESTMENT SUMMARY 181 UNIT APARTMENT COMMUNITY
 AUSTIN, TEXAS MUELLER ROSE INVESTMENT SUMMARY 181 UNIT APARTMENT COMMUNITY EXECUTIVE SUMMARY HFF has been exclusively retained to offer qualified investors the opportunity to purchase the fee simple interest
Staff Report PLANNING DIVISION COMMUNITY & ECONOMIC DEVELOPMENT. Alley Closure
 Staff Report PLANNING DIVISION COMMUNITY & ECONOMIC DEVELOPMENT To: From: Salt Lake City Planning Commission Doug Dansie, 801-535-6182, doug.dansie@slcgov.com Date: March 23, 2016 Re: PLNPCM2015-00941
P o p u l a t i o n, L a n d U s e, a n d Z o n i n g
 P o p u l a t i o n, L a n d U s e, a n d Z o n i n g The Town of Upper Marlboro is located only 15 miles southeast of the District of Columbia, in the central portion of Prince George s County in the
Miami-Dade County Retail Market Report 4Q Real Capital Partners Real Estate Services. *Data Source CoStar Miami-Dade County Retail Market Report
 Miami-Dade County Retail Market Report 4Q 216 Real Capital Partners Real Estate Services *Data Source CoStar 4Q 216 Miami-Dade County s Vacancy Decreases to 4.% Net Absorption Positive 1,155,8 SF in the
LIBERTY PLACE ELITE LIBERTY PLACE ELITE STREET LEVEL RETAIL & OFFICE LUXURY CONDOS. Premier Downtown Redevelopment FOR MORE INFORMATION CONTACT:
 LIBERTY PLACE STREET LEVEL RETAIL & OFFICE LUXURY CONDOS FOR MORE INFORMATION CONTACT: HEATHER HAGERMAN 540.369.4622 hhagerman@cbecommercial.com BEN KEDDIE 540.786.1402 bkeddie@cbecommercial.com 1201 Central
NORTHSTAR THE FALLS ON BULL CREEK CHESAPEAKE INVESTMENT SUMMARY AN EXCEPTIONALLY WELL-LOCATED PORTFOLIO IN AUSTIN, TEXAS.
 NORTHSTAR THE FALLS ON BULL CREEK CHESAPEAKE AN EXCEPTIONALLY WELL-LOCATED PORTFOLIO IN AUSTIN, TEXAS. INVESTMENT SUMMARY Holliday Fenoglio Fowler, L.P. ( HFF ) a Texas licensed real estate broker. 2 PORTFOLIO
PARHAM PROFESSIONAL PARK
 20,372 s.f. medical office building value-add and owner occupant oportunity PARHAM PROFESSIONAL PARK PARHAM PROFESSIONAL PARK a Executive Summary THE OPPORTUNITY JLL, as exclusive advisor, is pleased to
ECONOMIC CURRENTS. Vol. 3, Issue 3 SOUTH FLORIDA ECONOMIC QUARTERLY. Introduction
 ECONOMIC CURRENTS THE Introduction SOUTH FLORIDA ECONOMIC QUARTERLY Economic Currents provides an overview of the South Florida regional economy. The report presents current employment, economic and real
White Oak Science Gateway Master Plan Staff Draft AFFORDABLE HOUSING ANALYSIS. March 8, 2013
 White Oak Science Gateway Master Plan Staff Draft AFFORDABLE HOUSING ANALYSIS March 8, 2013 Executive Summary The Draft White Oak Science Gateway (WOSG) Master Plan encourages development of higher density,
AN ECONOMIC, FISCAL AND CAPITAL ASSET IMPACT ANALYSIS OF THIRTEEN PROPOSED NEW DEVELOPMENTS ON THE TOWN OF DENTON, MARYLAND.
 AN ECONOMIC, FISCAL AND CAPITAL ASSET IMPACT ANALYSIS OF THIRTEEN PROPOSED NEW DEVELOPMENTS ON THE TOWN OF DENTON, MARYLAND Prepared for The Denton Town Council Denton, Maryland by Dean D. Bellas, Ph.D.
Shopping Center Occupancy Study of the Greater Hagerstown Area
 Shopping Occupancy Study of the Greater Hagerstown 2015 Prepared By City of Hagerstown Planning & Code Administration Department November 2015 Shopping Occupancy Study of the Greater Hagerstown - 2015
TO MEMBERS OF THE FINANCE AND CAPITAL STRATEGIES COMMITTEE: DISCUSSION ITEM
 F13 Office of the President TO MEMBERS OF THE FINANCE AND CAPITAL STRATEGIES : For Meeting of DISCUSSION ITEM ORCHARD PARK FAMILY HOUSING AND GRADUATE STUDENT HOUSING REDEVELOPMENT PROJECT AND WEST VILLAGE
Generic Environmental Impact Statement. Build-Out Analysis. City of Buffalo, New York. Prepared by:
 Generic Environmental Impact Statement Build-Out Analysis City of Buffalo, New York 2015 Prepared by: TABLE OF CONTENTS 1.0 INTRODUCTION 1 2.0 METHODOLOGY 2 3.0 EXISTING LAND USE 3 4.0 EXISTING ZONING
LAND USE AMENDMENT ITEM NO: 05
 REPORT TO CALGARY PLANNING COMMISSION LAND USE AMENDMENT ITEM NO: 05 FILE NO: LOC2012-0069 CPC DATE: 2013 February 14 COUNCIL DATE: BYLAW NO: HILLHURST (Ward 7 - Alderman Farrell) ISC: Protected Page 1
Wheaton Sector Plan. Preliminary. Recommendations. Montgomery County Planning Board
 Sector Plan Preliminary Recommendations Montgomery County Planning Board 12-03-09 Scope of Work September 2008 Status Report June 2009 Preliminary Recommendations December 2009 1952 Process Today Community
ECONOMIC CURRENTS. Vol. 5 Issue 2 SOUTH FLORIDA ECONOMIC QUARTERLY. Key Findings, 2 nd Quarter, 2015
 ECONOMIC CURRENTS THE Introduction SOUTH FLORIDA ECONOMIC QUARTERLY Economic Currents provides an overview of the South Florida regional economy. The report presents current employment, economic and real
Federal Spending: The Road to Recovery
 MARKET REPORT NORTHERN VIRGINIA OFFICE First Quarter 2017 Federal Spending: The Road to Recovery As federal spending growth and the Northern Virginia economy generates new jobs, the office market continued
Lee Blvd & Waverley St Winnipeg, Manitoba
 Lee Blvd & Waverley St Winnipeg, Manitoba Executive Summary A city that mixes business with pleasure, creativity with capability, and opportunity with productivity, Winnipeg has been known as Canada s
ECONOMIC CURRENTS. Vol. 4, Issue 3. THE Introduction SOUTH FLORIDA ECONOMIC QUARTERLY
 ECONOMIC CURRENTS THE Introduction SOUTH FLORIDA ECONOMIC QUARTERLY Vol. 4, Issue 3 Economic Currents provides an overview of the South Florida regional economy. The report presents current employment,
Transit-Oriented Development Specialized Real Estate Services
 COLLIERS INTERNATIONAL Transit-Oriented Development Specialized Real Estate Services Accelerating success. Colliers International transit-oriented development GROUP P. 1 2 transit-oriented development
PC Staff Report 11/18/2013 Z Item No. 1-1
 Z-13-00401 Item No. 1-1 PLANNING COMMISSION REPORT Regular Agenda - Public Hearing Item PC Staff Report 11/18/2013 ITEM NO. 1: Z-13-00401 IG (General Industrial) District TO CS (Strip Commercial) District;
NET LEASE INVESTMENT OFFERING. 7-ELEVEN (Corporate) 8211 Old Centreville Road Manassas, VA (Washington, D.C. MSA)
 8211 Old Centreville Road Manassas, VA (Washington, D.C. MSA)") 7-ELEVEN (Corporate) 8211 Old Centreville Road Manassas, VA 20111 (Washington, D.C. MSA) TABLE OF CONTENTS TABLE OF CONTENTS I. Executive Profile Executive Summary Investment Highlights Property Overview
7-ELEVEN (Corporate) 8211 Old Centreville Road Manassas, VA 20111 (Washington, D.C. MSA) TABLE OF CONTENTS TABLE OF CONTENTS I. Executive Profile Executive Summary Investment Highlights Property Overview
WASHINGTON TOWNSHIP ECONOMIC PROFILE
 WASHINGTON TOWNSHIP ECONOMIC PROFILE SECTION 5.0 INTRODUCTION Understanding the characteristics of a community s economy is important in the comprehensive planning process. The amount of land being used
EXECUTIVE SUMMARY. Executive Summary Donald L Tucker Civic Center District Economic Development Study
 EXECUTIVE SUMMARY The overall Tallahassee/Leon County economy was not as negatively impacted by the Great Recession as was the State of Florida as a whole, because its economy is largely driven by State
4359 SADLER ROAD GLEN ALLEN, VA
 INNSBROOK LAND MIXED USE DEVELOPMENT OPPORTUNITY 4359 SADLER ROAD GLEN ALLEN, VA 23060 Part of the CBRE affiliate network I-64 4359 Sadler Road West Broad Street Dominion Boulevard INNSBROOK SHOPPES LOCATION
R E S O L U T I O N. 1. Request: A Departure from Parking and Loading Standards (DPLS-449) for 32 parking spaces.
 for 32 parking spaces.") R E S O L U T I O N WHEREAS, the Prince George s County Planning Board has reviewed Departure from Parking and Loading Standards No. DPLS-449 requesting a departure to allow a reduction of 32 parking spaces
R E S O L U T I O N WHEREAS, the Prince George s County Planning Board has reviewed Departure from Parking and Loading Standards No. DPLS-449 requesting a departure to allow a reduction of 32 parking spaces
Economic Impact Analysis Grand Oaks St. Johns County, Florida
 Economic Impact Analysis Grand Oaks St. Johns County, Florida December 2016 Prepared for Southeast Development Partners, LLC Ponte Vedra Beach, Florida By URBANOMICS, Inc Urban and Real Estate Economics
Approval of Takoma Amended Joint Development Agreement
 Planning, Program Development and Real Estate Committee Item IV- A October 10, 2013 Approval of Takoma Amended Joint Development Agreement Washington Metropolitan Area Transit Authority Board Action/Information
MONTGOMERY COUNTY RENTAL HOUSING STUDY. NEIGHBORHOOD ASSESSMENT June 2016
 MONTGOMERY COUNTY RENTAL HOUSING STUDY NEIGHBORHOOD ASSESSMENT June 2016 AGENDA Model Neighborhood Presentation Neighborhood Discussion Timeline Discussion Next Steps 2 WORK COMPLETED Socioeconomic Analysis
San Francisco Bay Area to Marin, San Francisco, and San Mateo Counties Housing and Economic Outlook
 San Francisco Bay Area to 019 Marin, San Francisco, and San Mateo Counties Housing and Economic Outlook Bay Area Economic Forecast Summary Presented by Pacific Union International, Inc. and John Burns
RETAIL MARKET ANALYSIS
 RETAIL MARKET ANALYSIS Portland State University Despite the doom and gloom warnings of a retail apocalypse, the national story for retail is that things are stable. Nationwide vacancy is at 5.2 percent
Washington DC Market Office Report
 Washington DC Market Office Report Market Overview The Office Market The Washington Office Market includes the District of Columbia and adjacent suburban submarkets in Maryland and Virginia. The Washington
Indianapolis MARKETBEAT. Office Q Economy. Market Overview INDIANAPOLIS OFFICE
 INDIANAPOLIS OFFICE Economic Indicators Q2 17 Q2 18 MSA Employment 1.1M 1.1M MSA Unemployment 3.3% 3.0% U.S. Unemployment 4.3% 3. Market Indicators (Direct, All Classes) Q2 17 Q2 18 Total Market Vacancy
NAI REOC San Antonio San Antonio Retail Market I Third Quarter 2011
 MEDIA RELEASE Contact: Kim Gatley Senior Vice President & Director of Research NAI REOC San Antonio P 210 524 4000 I F 210 524 4029 kgatley@naireocsanantonio.com www.naireocsanantonioblog.com SAN ANTONIO
National Presence. Local Focus
 Metropolitan DC Market Overview 4Q 214 Overall Market Summary The Washington, DC Metropolitan commercial real estate market is comprised of approximately 41.9 million square feet of rentable office space
CBCELITE.COM. Exclusively Listed By. Donny Self, CCIM. O: C:
 Exclusively Listed By Donny Self, CCIM dself@cbecommercial.com O: 540.548.1023 C: 540.842.6202 OVERVIEW Total Land Size 29.2 Acres Parcel ID 46-4 & 46-2 Zoning M1 Light Industrial (owners have applied
VILLAGE OF DOWNERS GROVE PLAN COMMISSION VILLAGE HALL COUNCIL CHAMBERS 801 BURLINGTON AVENUE. June 2, :00 p.m. AGENDA
 VILLAGE OF DOWNERS GROVE PLAN COMMISSION VILLAGE HALL COUNCIL CHAMBERS 801 BURLINGTON AVENUE June 2, 2014 7:00 p.m. AGENDA 1. Call to Order 2. Roll Call a. Pledge of Allegiance 3. Approval of Minutes April
IPS REAL ESTATE STRATEGY
 IPS REAL ESTATE STRATEGY BROAD RIPPLE HIGH SCHOOL Joe Gramelspacher, Special Projects Director March 26, 2018 overview 2 1 2 3 4 real estate strategy 3 overview 12 properties have been sold, resulting
Coomber Hall at McMillen Farm 1521 Dranesville Road Herndon, VA
 Coomber Hall at McMillen Farm 1521 Dranesville Road Herndon, VA OFFERING MEMORANDUM Prime Infill Single Family Lot Opportunity CONTENTS Offering Terms 3 Executive Summary 4 Property Summary 5 Investment
Key Findings: Market Analysis
 Key Findings: Market Analysis Prepared by: WTL+a Washington, DC On behalf of: HDR, Inc. & Why a Market Study? Evaluate factors affecting demand for new development Analyze market drivers for new investment
FOR SALE: ACRE COMMERCIAL SHOPPING CENTER SITE
 HAGEMAN AND ALLEN ROADS, NORTHWEST BAKERSFIELD CA, 93312 ALLEN RD. SHOPPING CENTER SITE CRAIG A. HUMMEL BROKER/APPRAISER LICENSE # 01108671 P 661-444-1602 F 661-449-3322 ca@hummelandassociates.com CRAIG
2012 Profile of Home Buyers and Sellers New Jersey Report
 Prepared for: New Jersey Association of REALTORS Prepared by: Research Division December 2012 Table of Contents Introduction... 2 Highlights... 4 Conclusion... 7 Report Prepared by: Jessica Lautz 202-383-1155
PLANNING COMMISSION WILLIAMSBURG, VIRGINIA WORK SESSION AGENDA Wednesday, May 23, 2012
 PLANNING COMMISSION WILLIAMSBURG, VIRGINIA WORK SESSION AGENDA Wednesday, May 23, 2012 The meeting will be called to order in the third floor Conference Room (Room 310), Williamsburg Municipal Building,
Summary Report on the Economic Impact of the State Center Project Baltimore, MD
 Summary Report on the Economic Impact of the State Center Project Baltimore, MD Prepared for: Maryland Department of Transportation Prepared by: BAE Urban Economics March 2011 Summary of Key Findings Phase
Planning Board Worksession No.4: Parklawn South District and Randolph Hills District
 Planning Board Worksession No.4: Parklawn South District and Randolph Hills District Prior Worksessions January 27: Focused on transportation analysis and staging recommendations in the Draft Plan. February
RESEARCH MARKET REPORT NORTHERN VIRGINIA OFFICE Q IN THIS ISSUE. State of the Economy. Leasing Activity. Development Pipeline.
 RESEARCH MARKET REPORT NORTHERN VIRGINIA OFFICE IN THIS ISSUE State of the Economy p.2 Leasing Activity p.3 Development Pipeline p.4 Market Breakdown p.5 Northern Virginia in Recovery... For Now Recovery
25700 i-45 North, Spring, Texas 77386
 Office Park 25700 i-45 North, Spring, Texas 77386 Office Park Overview EXECUTIVE OVERVIEW The 4-story, tilt wall and glass office building is an attractive, Class A facility with a major presence along
Signs of Recovery Ahead
 Research & Forecast Report Northern Virginia Office Market Fourth Quarter 2015 Signs of Recovery Ahead Audrey Hinkle Research Analyst Northern Virginia In recent years, fiscal uncertainty has created softness
Article 3. SUBURBAN (S-) NEIGHBORHOOD CONTEXT
 NEIGHBORHOOD CONTEXT") Article 3. SUBURBAN (S-) NEIGHBORHOOD CONTEXT this page left intentionally blank Contents ARTICLE 3. SUBURBAN (S-) NEIGHBORHOOD CONTEXT DIVISION 3.1 NEIGHBORHOOD CONTEXT DESCRIPTION...3.1-1 Section 3.1.1
Article 3. SUBURBAN (S-) NEIGHBORHOOD CONTEXT this page left intentionally blank Contents ARTICLE 3. SUBURBAN (S-) NEIGHBORHOOD CONTEXT DIVISION 3.1 NEIGHBORHOOD CONTEXT DESCRIPTION...3.1-1 Section 3.1.1
Indianapolis MARKETBEAT. Office Q Economy. Market Overview INDIANAPOLIS OFFICE
 INDIANAPOLIS OFFICE Economic Indicators Market Indicators (Direct, All Classes) Direct Net Absorption/Direct Asking Rent 4-QTR TRAILING AVERAGE Direct Vacancy Q3 17 Q3 18 MSA Employment 1.05M 1.07M MSA
151 TECHNOLOGY CENTER
 151 TECHNOLOGY CENTER SAN ANTONIO, TEXAS INVESTMENT SUMMARY THE OFFERING As exclusive advisor to Owner, HFF is pleased to present the opportunity to purchase 151 Technology Center (the Property ), a recently
Economic and Fiscal Impact Analysis of Future Station Transit Oriented Development
 Florida Department of Transportation Central Florida Commuter Rail Transit Project Economic and Fiscal Impact Analysis of Future Station Transit Oriented Development Seminole County Summary Report Revised
DISTRICT OF COLUMBIA IN THIS ISSUE OFFICE Q RESEARCH MARKET REPORT. State of the Economy. Leasing Activity. Development Pipeline.
 RESEARCH MARKET REPORT DISTRICT OF COLUMBIA OFFICE IN THIS ISSUE State of the Economy p.2 Leasing Activity p.3 Development Pipeline p.4 Market Outlook p.5 Market Breakdown p.6 DC Development: No Signs
MARKET WATCH SOUTHERN CALIFORNIA & PHOENIX
 SOUTHERN CALIFORNIA & PHOENIX COMMERCIAL REAL ESTATE MARKET FOURTH QUARTER 217 MARKET WATCH SOUTHERN CALIFORNIA & PHOENIX 1.888.659.DAUM WWW.DAUMCOMMERCIAL.COM D/AQ Corp. # 1129558 DAUM TABLE OF CONTENTS
Stronger Office Market Looking Into Future
 Research & Forecast Report Long Island OFFICE MARKET Q2 2015 Stronger Office Market Looking Into Future Rose Liu Research & Financial Analyst Long Island Takeaways Class A & B Long Island economic and
101,766 SF GROCERY ANCHORED RETAIL CENTER
 P L A Z A T E M E C U L A, C A L I F O R N I A 101,766 SF GROCERY ANCHORED RETAIL CENTER Holliday Fenoglio Fowler, L.P. acting by and through Holliday GP Corp., a real estate broker licensed with the California
The Upstate, South Carolina
 The Upstate, South Carolina Investment Progressing with Infrastructure and Manufacturing Expansions Following a trend started in 2015, net absorption remains positive, but has slowed pace in the last two
CHAPTER 7 HOUSING. Housing May
 CHAPTER 7 HOUSING Housing has been identified as an important or very important topic to be discussed within the master plan by 74% of the survey respondents in Shelburne and 65% of the respondents in
TAMARAC SHOPPING CENTER DENVER, CO A RETAIL OPPORTUNITY IN THE HEART OF DENVER S CENTRAL SUBMARKET
 TAMARAC SHOPPING CENTER DENVER, CO A RETAIL OPPORTUNITY IN THE HEART OF DENVER S CENTRAL SUBMARKET E. HAMPDEN AVE (47,400 VPD) E X E C U T I V E S U M M A R Y S. TAMARAC DRIVE (14,300 VPD) Holliday, Fenoglio,
100 Hegenberger Road Oakland, CA
 Owner User / Investment Opportunity 100 Hegenberger Road Oakland, CA Oakland Coliseum-Airport Investment Contacts: John Dolby Executive Director +1 510 267 6027 john.dolby@cushwake.com LIC #00670630 Dane
4.0. Residential. 4.1 Context
 4. 0Residential 4.1 Context In 1986, around the time of Burnaby s last Official Community Plan, the City had a population of 145,000 living in 58,300 residential units. By 1996, there were 179,000 people
FOURTH PLAIN CENTER. 117,143 RSF Value-Add Shopping Center in the Portland MSA VANCOUVER, WASHINGTON
 FOURTH PLAIN CENTER VANCOUVER, WASHINGTON Nick Kassab, a licensed real estate broker in the state of Washington, along with Holliday Fenoglio Fowler, L.P. (collectively HFF ). 117,143 RSF Value-Add Shopping
DRAFT Plan Incentives. Part A: Basic Discount
 DRAFT 2030 Plan Incentives July 26, 2006 Part A: Basic Discount In order for a development to be eligible for any 2030 Land Resource Management Plan Discounts it must be located in the Urban Corridor and
The New Starts Grant and Affordable Housing A Roadmap for Austin s Project Connect
 The New Starts Grant and Affordable Housing A Roadmap for Austin s Project Connect Created for Housing Works by the Entrepreneurship and Community Development Clinic at the University of Texas School of
Has The Office Market Reached A Peak? Vacancy. Rental Rate. Net Absorption. Construction. *Projected $3.65 $3.50 $3.35 $3.20 $3.05 $2.90 $2.
 Research & Forecast Report OAKLAND METROPOLITAN AREA OFFICE Q1 Has The Office Market Reached A Peak? > > Vacancy remained low at 5. > > Net Absorption was positive 8,399 in the first quarter > > Gross
Ann Arbor Downtown Market Scan
 2018 Market Scan Market Scan July 2018 OVERVIEW 2 POPULATION & HOUSEHOLDS 5 MULTI-FAMILY 9 RETAIL & RESTAURANT 14 EMPLOYMENT & OFFICE 18 CONSTRUCTION COSTS 22 4WARD PLANNING INC. 1 2018 Market Scan OVERVIEW
Existing Land Use. Typical densities for single-family detached residential development in Cumberland County: 1
 Existing Land Use A description of existing land use in Cumberland County is fundamental to understanding the character of the County and its development related issues. Economic factors, development trends,
Approval of Takoma Amended Joint Development Agreement and Compact Public Hearing
 Planning, Program Development and Real Estate Committee Item IV - B March 13, 2014 Approval of Takoma Amended Joint Development Agreement and Compact Public Hearing Washington Metropolitan Area Transit
Second Quarter: Suburban Maryland s Uptick in Leasing has yet to be Realized in Absorption Numbers
 Q2 2013 OFFICE SUBURBAN MARYLAND SUBURBAN MARYLAND MARKET REPORT Second Quarter: Suburban Maryland s Uptick in has yet to be Realized in Numbers Updated May 2012 MARKET INDICATIONS Q2 2013 Q3 2013 (p)
The Cannery Marketplace Narrative. Purpose: Site Design Approach: Cannery Commerce District 10/18/2017
 The Cannery Marketplace Narrative Cannery Commerce District 10/18/2017 Purpose: A number of entitlements are being requested for the Cannery Marketplace inclusive of a Master Conditional Use Permit (Master
Real Estate Market Analysis
 One of the challenges facing the West Berkeley shuttle is to consider whether to expand the service beyond the current operations serving major employers, to a system that provides access to a more diverse
STAFF REPORT. January 25, North York Community Council. Director, Community Planning, North District
 STAFF REPORT January 25, 2005 To: From: Subject: Purpose: North York Community Council Director, Community Planning, North District Refusal Report OPA & Rezoning Application 04 194214 NNY 33 OZ Applicant:
250-UNIT, VALUE-ADD MULTI-HOUSING COMMUNITY IN PHOENIX, ARIZONA
 hfflp.com 250-UNIT, VALUE-ADD COMMUNITY IN, ARIZONA Holliday Fenoglio Fowler, L.P. ( HFF ), a licensed Arizona real estate broker. 2 SEDONA RIDGE APARTMENT HOMES SEDONA RIDGE APARTMENT HOMES 3 THE OFFERING
Existing Conditions: Economic Market Assessment
 Existing Conditions: Economic Market Assessment Introduction The US 24/40 Corridor Study examined existing conditions as they related to economic and commercial market assessments, existing land use, and
Impact Analysis: The Atlanta Braves new Stadium Project. March A Cushman & Wakefield Research Publication
 Impact : The new Stadium Project A Cushman & Wakefield Research Publication March 2014 1 Executive Summary The new baseball stadium project will dramatically transform the Cumberland/Galleria area of Northwest
Caution: Vacancy Increases Ahead
 MARKET REPORT DISTRICT OF COLUMBIA OFFICE Fourth Quarter 2016 Caution: Vacancy Increases Ahead Market Indicators Q4 2016 2017 (Projected) NET Despite year-to-date negative absorption, the Washington, DC
SHOPPING PLAZA. Fairless Hills, Pennsylvania
 Fairless Hills, Pennsylvania Executive Summary The Opportunity Holliday Fenoglio Fowler, L.P. ( HFF ) has been retained to arrange the sale of Fairless Hills Shopping Plaza (the Property ), an 89,489 SF
Detroit Inclusionary Housing Plan & Market Study Preliminary Inclusionary Housing Feasibility Study Executive Summary August, 2016
 Detroit Inclusionary Housing Plan & Market Study Preliminary Inclusionary Housing Feasibility Study Executive Summary August, 2016 Inclusionary Housing Plan & Market Study Objectives 1 Evaluate the citywide
METHODOLOGY GUIDE VALUING LANDS IN TRANSITION IN ONTARIO. Valuation Date: January 1, 2016
 METHODOLOGY GUIDE VALUING LANDS IN TRANSITION IN ONTARIO Valuation Date: January 1, 2016 August 2017 August 22, 2017 The Municipal Property Assessment Corporation (MPAC) is responsible for accurately assessing
HISTORIC-DOWNTOWN BUILDINGS FOR LEASE ELITE ELITE HISTORIC & EXCLUSIVE DOWNTOWN PROPERTIES 17,236 SF FOR LEASE- SEEKING UNIQUE USES
 HISTORIC-DOWNTOWN BUILDINGS FOR LEASE 1001 PRINCESS ANNE ST. & 215 WILLIAM ST. FREDERICKSBURG, VA 22401 FOR MORE INFORMATION CONTACT: CAMERON COLEMAN O: 540.785.3368 M: 443.340.5966 ccoleman@cbecommercial.com
TRANSWESTERN OUTLOOK DC AT Q1O8
 TRANSWESTERN OUTLOOK DC AT Q1O8 Even With Soft Office Absorption, Vacancy Remains Low; Rents Continue to Edge Up The District of Columbia s office market experienced steady conditions during the 1st quarter
High-priced homes have a unique place in the
 Livin' Large Texas' Robust Luxury Home Market Joshua G. Roberson December 3, 218 Publication 2217 High-priced homes have a unique place in the overall housing market. Their buyer pool, home characteristics,
MARKET REPORT FIRST QUARTER Creative Reuse of Office Space in Virginia Market Recovery to Occur with New Federal Spending
 Q1 2015 NORTHERN VIRGINIA OFFICE NORTHERN MARKET REPORT VIRGINIA Q1 OFFICE 2015 NORTHERN VIRGINIA OFFICE MARKET REPORT FIRST QUARTER 2015 Creative Reuse of Office Space in Virginia Market Recovery to Occur
INDUSTRIAL QUICK STATS SUMMARY & OUTLOOK MARKET TRENDS VACANCY & NET ABSORPTION ECONOMIC STATS
 PHOENIX, ARIZONA INDUSTRIAL THIRD QUARTER 217 QUICK STATS Direct Vacancy 8.7% Overall Vacancy 9.% Lease Rate NNN $.54 Gross Absorption Under Construction MARKET TRENDS Current Quarter 5,991,128 SF 4,751,494
Monthly Market Snapshot
 SEPTEMBER 2018 Vacancy continues to fall. Nearing the end of the third quarter, the vacancy rate dropped 10 basis points to 6.4%, compared to this time last month at 6.5%. Occupancy of the 1.1 million
Appendix B: Housing Element Sites Inventory and Detailed Analysis
 Appendix B: 2015-2023 Housing Element Sites Inventory and Detailed Analysis Redwood City General This page intentionally left blank. Redwood City General Site Identifier Assessor Parcel Number General