SAMPLE REPORT CORELOGIC NEW ZEALAND MONTHLY PROPERTY MARKET & ECONOMIC UPDATE
|
|
|
- Evelyn Cross
- 6 years ago
- Views:
Transcription

1 CORELOGIC NEW ZEALAND MONTHLY PROPERTY MARKET & ECONOMIC UPDATE JANUARY FEBRUARY 2017

2

3 About CoreLogic 4 CoreLogic Data and Analytics 6 Legal Disclaimer 7 Macro Economic and Demographic Indicators 8 New Zealand Asset Classes 9 New Zealand Population 10 Migration 11 Regional Building Consents 12 Population Growth Compared to Building 13 Consents Buyer Confidence 14 Employment 15 Interest Rates and Mortgage Debt 16 Housing Overview 18 Values 19 Sales Volumes 20 Rent 21 Market Activity 22 Valuations Completed 23 Listings 24 Buyer Classification 26 House Price Index 27 Main Cities Housing Market Indicators 30 Auckland Values 32 Current Auckland Suburb Values 33 Auckland Suburb Value Change 34 Buyer Classification - Auckland 36 Hamilton Values 38 Buyer Classification - Hamilton 39 Tauranga Values 40 Buyer Classification - Tauranga 41 Wellington Values 42 Buyer Classification - Wellington 43 Christchurch Values 44 Buyer Classification - Christchurch 45 Dunedin Values 46 Buyer Classification - Dunedin 47

4 About CoreLogic CoreLogic is a leading property information, analytics and services provider in the United States, Australia and New Zealand. CoreLogic helps clients identify and manage growth opportunities, improve performance and mitigate risk, by providing clients with innovative, technology-based services and access to rich data and analytics. Whilst all reasonable effort is made to ensure the information in this publication is current, CoreLogic does not warrant the accuracy, currency or completeness of the data and commentary contained in this publication and to the full extent not prohibited by law excludes all loss or damage arising in connection with the data and commentary contained in this publication. 4

5 5
6 CoreLogic Data and Analytics CoreLogic Buyer Classification A unique and flagship product to CoreLogic, Buyer Classification determines the type of buyer for every purchase of property based on their current and previous ownership of NZ property. Created at a record level, this can be matched to other datasets or summarised at any geographic area. Our buyer classification is used by financial institutions and Government agencies at both record and summary level and overlaid with their own data to assist strategic, policy, compliance, risk management and marketing decisions. CoreLogic value measures CoreLogic has a suite of products to measure property prices. This ranges from simple market measurements such as median or average sales prices through to stratified medians, various house price indices, and valuing groups of properties using Automated Valuation Models such as E-valuer. The house price indices are available both quarterly for completeness and monthly for reactivity. The Quarterly CoreLogic House Price Index has been specifically designed to track the value of a portfolio of properties over time and is relied upon by New Zealand regulators and industry as the most accurate measurement of housing market performance. These value measures are available for long time series and for either standard or custom geographic areas and property types. Suburb scorecard Detailed housing market indicators at suburb level, with data either in time series or current snapshot, and segmented across houses, flats and apartments. The Suburb Scorecard data includes key housing market metrics such as median prices, median values, transaction volumes, rental statistics and market metrics such as median selling time. If you would like to know more or obtain tailored data, analytics and insights for your business, please us at reports@corelogic.co.nz. 6
7 Legal Disclaimer Copyright Copyright CoreLogic NZ Limited (CoreLogic) and its licensors are the sole and exclusive owners of all rights, title and interest (including intellectual property rights) subsisting in this publication, including any data, analytics, statistics and other information contained in this publication (Data). All rights reserved. Data & Research publications Whilst all reasonable effort is made to ensure the information in this publication is current, CoreLogic does not warrant the accuracy, currency or completeness of the Data and commentary contained in this publication and to the full extent not prohibited by law excludes all loss or damage arising in connection with the Data and commentary contained in this publication. You acknowledge and agree that CoreLogic does not provide any investment, legal, financial or taxation advice as to the suitability of any property and this publication should not be relied upon in lieu of appropriate professional advice. Published date: 30 January 2017 Contact Call us Wellington office Level Cuba Street PO Box 4072 Wellington 6140 Auckland office Level Queen Street Auckland

8 Macro Economic and Demographic Indicators 8
9 New Zealand Asset Classes The value of Residential property continues to grow beyond one trillion dollars, dwarfing the value of other asset classes. Listed stocks peaked last September, dropped through until the US presidential election in November, then rebounded, but have been flat for the past few weeks. Residential Real Estate $1.01 trillion ($229 billion in home loans) Commercial/Industrial Real Estate $161 billion NZ Listed Stocks $117 billion NZ Super and KiwiSaver $65.7 billion Source: CoreLogic NZ, Reserve Bank of NZ, NZX, NZ Superfund, Financial Markets Authority 9
10 New Zealand Population Quarterly Change in National Population New Zealand s population continues to grow strongly, fuelled by continuing strong net migration. Auckland s population accounted for nearly half of the national growth over the past year, but all the other main centres also saw population increases, putting pressure on housing supply. Population Change Composition Annual Change in Population Source: Statistics New Zealand 10
11 Migration Net migration has continued to surge away at record high levels. The projected slowdown in mid-2016 failed to materialise and we are once again seeing record arrivals combined with comparatively low numbers of departures. Likewise we are continuing to see a net gain in people from Australia as Kiwis either return home or are not heading over the ditch for jobs and lifestyle in the numbers they used to. While Auckland is the main beneficiary of this strong net migration, there were also significant gains in Wellington and Christchurch over the past year. Long Term Migration Monthly Net Migration Between New Zealand and Australia Net Gain Last Year % Change TOTAL ALL AREAS 69, % Auckland Region 32, % Hamilton City 1, % Tauranga City 1, % Wellington 3, % Christchurch City 5, % Dunedin City % Main Urban Area (Other) 5, % Rural Centres 4, % Not applicable/not stated 15, % Source: Statistics New Zealand 11
12 Regional Building Consents The trend for new building consents in Auckland continues to be strongly positive. It is likely that once the December stats come through that they will show building consents in Auckland to be the strongest since However bear in mind that it takes some time for these consents to translate into new dwellings built. Consent activity is also up across most of the rest of the country, with the exception of Canterbury. New Dwelling Consents Trend Source: Statistics New Zealand In order to build enough houses in Auckland to meet current and future demand, the high level of current activity needs to increase further, then hold for several years. A shortage of skilled workers, increasing costs, time delays, and quality issues are however already starting to emerge in the Auckland market, so there are clearly challenges to be overcome in order to step up the rate of building. 12
13 Population Growth Compared to Building Consents The increase in building consents for new dwellings has meant that the gap between population growth and housing supply may begin to close. The time lag between a consent being issued and the dwelling being finished means that it still may be many months or even years before this translates into a physical closing of the gap. Quarterly Population Change and Building Consents Nationwide Source: Statistics New Zealand, MBIE The above calculation assumes 80% of dwellings consented are completed and will house the current average number of people (2.7 people per house). For example, over the year to July 2016 there were 31,185 dwellings consented (able to house 67,360 people), and an increase in population of 97,300, leaving a difference of around 30,000 too many people for dwellings. 13
14 Buyer Confidence Consumer confidence is still strongly optimistic. This positivity not only reflects views of the current state, but also of future expectations. Confidence has risen outside of Auckland on the back of much stronger dairy prices and strong regional economies. People s expectations of house price increases have eased a little. The gap between New Zealand and Australian consumer confidence continues to widen. This could be part of the explanation for the continued positive net migration between Australia and New Zealand as people see better prospects here than across the Tasman for the time being. ANZ Roy Morgan Consumer Confidence Source: ANZ NZ, Roy Morgan Trans-Tasman Consumer Confidence Index 14 New Zealand Australia Source: Westpac NZ, McDermott Miller
15 Employment Full and part-time employment both remain up on last year. This along with an increased labour force participation rate and dropping unemployment indicate a healthy employment landscape. While employment remains strong people can continue to get and pay home loans and so contribute to a strong housing market. A significant weakening of the labour market would flow through to housing, but there is no sign of that yet. Annual Change in Employment, Full-time and Part-time Labour Force Participation Rate Unemployment Rate Source: Statistics New Zealand 15
16 Interest Rates and Mortgage Debt Retail mortgage interest rates are now past their historic lows and beginning to creep upwards as the cost of offshore funding increases. The Official Cash Rate (OCR) set by the Reserve Bank is unlikely to change in the medium term, so it will be this offshore funding alone pushing up rates. As a result mortgage interest rates look set to remain low for some time yet. These low interest rates continue to make the record high level total household debt manageable, a situation only likely to change when interest rates rise significantly. That would appear to be some years off yet under current expected global financial conditions. Projected Official Cash Rate Mortgage Interest Rates Debt Level and Serviceability Source: Reserve Bank of New Zealand 16

17 17

18 Housing Overview 18
19 Values Average Value of Housing Stock - New Zealand Nationwide values are still increasing according to the latest monthly QV house price index. The rate of quarterly growth has slowed to only 1.3% but the annual rate of increase holds steady at 12%. The previous round of LVR restrictions in October 2015 saw a similar slowdown in value increases, but they were very short-lived. That remains our expectation with the latest restrictions that came into force late last year, and while values may drop a little further in coming months they will likely begin to increase again by mid-year. Annual and Quarterly Change in Value 19


20 Sales Volumes Sales volumes dropped throughout most of 2016, and by mid-year had begun to drop below the same month a year earlier. This downward trend in sales volumes was already well in play by the time the latest restrictions kicked in. The previously hot markets of Hamilton and Tauranga saw the biggest annual drop in sales activity, while Auckland and Wellington had a more modest drop. Christchurch and Dunedin were more or less steady year on year. Nationwide Sales Volumes Nationwide Annual Change in Sales Volumes Regional Sales Volumes Year-on-Year 20

21 Rent While the pace of value increase has slowed, the rate of rent increases has gradually been picking up. This could be landlords seeking to offset the increased cost of lending from the latest round of restrictions imposed by the Reserve Bank. As a result of the increasing rents, nationwide gross yield has been flat for the past few months, a change from the decline in yields which began in All the main centres have lower yields than this time last year as value increases have still outstripped rent increases. National Annual Change in Value and Rent Gross Rental Yield - National Gross Rental Yield - Main Centres Source: MBIE, CoreLogic NZ 21
22 Market Activity There has been a significant decline in market activity in Auckland since November. The first few weeks of the New Year have been well below the same time last year. This suggests that the latest round of lending restrictions are particularly impacting Auckland buyers. The rest of the country has rebounded to pre-christmas levels, but this does vary in places. Market Activity Relative to pre-christmas 2015 Latest 3 Weeks Year-on-Year Auckland 82% Hamilton City 88% Tauranga City 88% Wellington Region 106% Christchurch City 88% Dunedin City 124% This market activity is based on the number of automated valuations run by bank staff using our systems each week. This number of valuations correlates very closely to the number of sales that will subsequently occur so this is an extremely timely measure of buyer demand, more than any measure of sales. We can also track across any geographic area. 22

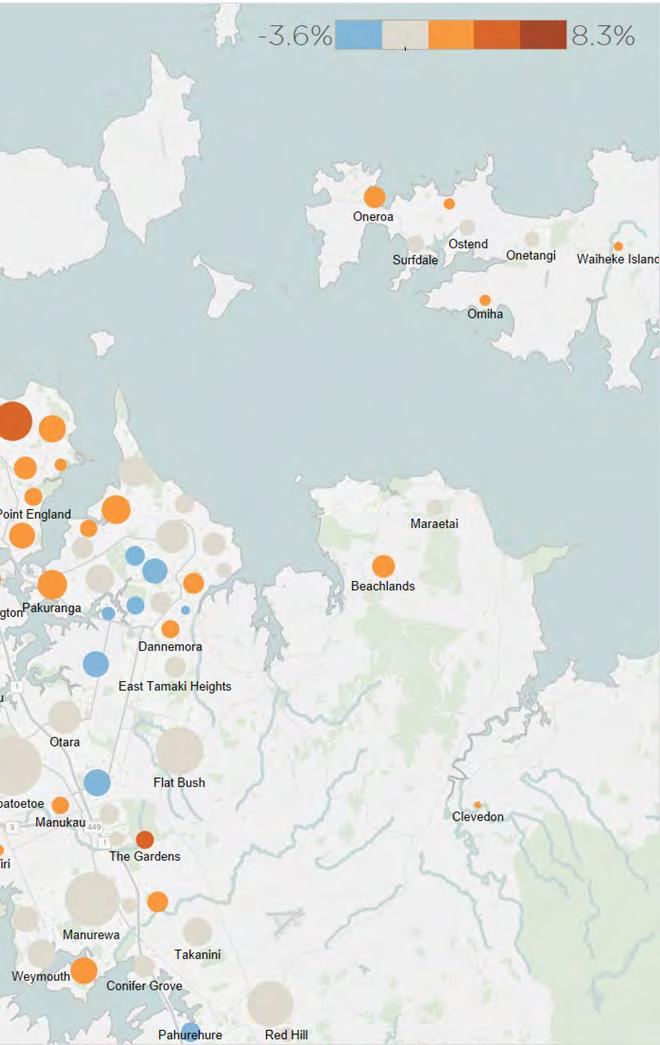
23 Valuations Completed Market Activity This map shows activity in the latest three weeks compared to the same three weeks last year. Compared to a year ago activity is down in Auckland, steady in the middle of the North Island, and up year on year in the lower part. In the South Island activity is steady in many areas, but up in Marlborough, Nelson, and much of Otago and Southland. * Size of bubble represents the level of activity for the period 2 January January
24 Listings New Listings New listings have begun to pick up again after the Christmas break. It is still too early to get a decent read on how the year has started, but in both Auckland and the rest of the country the number of new listings appears to be at expected levels. New Listings Average last 3 weeks 1 month change 1 year change New Zealand 1,370-18% -5% Auckland % -4% Waikato % 12% Bay of Plenty % -8% Wellington % -6% Canterbury % -12% Otago 50-35% -23% 24
25 The total number of listings typically drops away at this time of year as the sales activity that carries on over December and January outstrips the number of new listings coming to market. From about late January onwards the total number of listings begins to pick up again with the seasonal surge in new listings. The total number of listings in Auckland is similar to last year. But that is no good thing as total listings have been low for several years in Auckland, making it tough for buyers. Across the rest of the country total listings continue to drop because there have been more sales than new listings. Total Listings Total Listings Latest week 1 month change 1 year change New Zealand 25,848-9% -16% Auckland 6,680-15% 11% Waikato 2,614-6% -20% Bay of Plenty 1,835-5% -3% Wellington 1,476-12% -31% Canterbury 4,297-7% -11% Otago 1,025-8% -41% 25
26 Buyer Classification The data for Q4 is now complete and we are beginning to see the first signs of a weakening in investor activity in response to the latest lending restrictions. Mover activity continues to be under par, while first home buyers are now back at the same level they were before the first round of LVR restrictions came in to force in late Buyer Classification - New Zealand 26
27 House Price Index Values in Auckland dropped in December, as they did briefly in response to previous lending restrictions. Hamilton has also levelled off, and the latest data we have suggests that Tauranga is doing likewise. That is a big change from the rapid growth both of those cities experienced last year. The rate of growth has also slowed in Wellington, but in Dunedin the steady increases in value seem to be continuing. Average Dwelling Value December 2016 Current Value 3 months 12 months Since Peak New Zealand $627, % 12% 52% Auckland $1,047, % 12% 92% Hamilton $534, % 20% 48% Tauranga $672, % 24% 40% Wellington $574, % 21% 26% Christchurch $494, % 3% 30% Dunedin $354, % 15% 24% Source: CoreLogic NZ QV Monthly House price index 27

28 House Price Index Annual Value Change Over the past year values have been increasing in almost every town and city, the notable exception being Canterbury. There was particularly strong growth in the areas surrounding Auckland, the lower North Island, and in Queenstown Lakes District. 28 *Size of bubble represents the number of properties in the Territorial Authority

29 The three month change in values begins to show a patchier picture. Parts of Auckland are no longer increasing, along with Hamilton and parts of the central North Island. For the time being there is continuing strength in most other areas but we expect that to moderate over the next couple of months. Three Month Value Change *Size of bubble represents the number of properties in the Territorial Authority 29

30 Main Cities Housing Market Indicators 30

31 31
32 The house price index for December dropped from November, and as a result the change in values over the past three and twelve months has slowed considerably across Auckland. The previous round of LVR restrictions in October 2015 targeted at Auckland caused a short term drop in values and we expect that over the coming months values will continue to drop. Beyond that the upward forces of low interest rates, high migration and a housing shortage are likely to once again see values in Auckland begin to rise from mid-year, although at a more modest pace than we have seen in recent years. Auckland Values Average Value of Housing Stock - Auckland Annual and Quarterly Value Change - Auckland December 2016 Current Value 3 months 12 months Since Peak Rodney $929, % 14% 58% North Shore $1,218, % 12% 89% Waitakere $840, % 12% 98% Auckland City $1,218, % 11% 96% Manukau $904, % 14% 98% Papakura $681, % 13% 90% Franklin $659, % 14% 67% 32

33 As a result of increasing values there are now no suburbs in Auckland where the average value is less than $500k. These may briefly return if values continue to drop in Auckland. 104 Auckland suburbs have an average value of over $1m. Current Auckland Suburb Values Median Value of Housing Stock 20 km 10 km *Based on CoreLogic Median E-valuer 33

34 Auckland Suburb Value Change While all Auckland suburbs are showing an increase in value over the past year, the fastest percentage growth has been across Manukau and in the CBD apartment market. Three Month Value Change *Size of bubble represents the number of properties in the suburb. Based on CoreLogic Median E-valuer 34
35 35
36 Buyer Classification - Auckland Auckland investor activity has begun to tail off in response to the latest lending restrictions. First home buyers picked up in Q4 after gradually sliding during 2016 and are now nearly back at the same level they were before the first round of LVR restrictions were imposed in

37 37
38 There has been a significant turnaround in value increases in Hamilton. From increasing at 30% year on year during 2016, the house price index for December shows values dropping slightly. The slowdown is particularly evident in the Central and North West of Hamilton where quarterly growth has now dropped to under 1%. Hamilton Values Average Value of Housing Stock - Hamilton Annual and Quarterly Change in Value - Hamilton Hamilton Central & North West December 2016 Current Value 3 months 12 months Since Peak $499, % 20% 40% Hamilton North East $681, % 21% 52% Hamilton South East $484, % 19% 39% Hamilton South West $467, % 19% 37% 38
39 Buyer Classification - Hamilton There has been a change in mix of the type of investors active in the Hamilton market. The latest quarter has seen a significant drop in activity from Auckland based investors. That slack has been picked up by local investors who were missing out during the time the Aucklanders were most active. First home buyers and movers don t appear to have been impacted by the latest lending restrictions. 39
40 The latest house price index appears to show values in Tauranga continuing to rise at the same pace. However other measures of value we have suggest that values have begun to flatten so we would expect the house price index to reflect that in coming months. Tauranga Values Average Value of Housing Stock - Tauranga Annual and Quarterly Change in Value - Tauranga 40
41 The most significant change in the mix of buyers in Tauranga has been the continued increase of activity by Auckland investors. They now make up 10% of the activity there. Buyer Classification - Tauranga 41
42 The rapid increase in Wellington values during 2016 has eased off in recent months, with the quarterly increase slowing to less than 4%. Porirua and Upper Hutt both increased by more than 5% over the three months, while Lower Hutt was just under 4%. Wellington Values Average Value of Housing Stock - Wellington Annual and Quarterly Change in Value - Wellington December 2016 Current Value 3 months 12 months Since Peak Porirua $477, % 20% 25% Upper Hutt $422, % 22% 20% Lower Hutt $470, % 21% 20% Wellington City $693, % 22% 30% 42
43 There was a distinct drop in investor activity in Q4 after a flurry of activity in Q3, potentially in advance of new lending restrictions on investors. Meanwhile first home buyer activity has surged to record high levels at 30% of all sales. Movers are still less active than usual, with those lending restrictions making it harder for people to upgrade. Buyer Classification - Wellington 43
44 Values have been increasing at only 2% to 3% per year during much of 2015 and 2016, but sped up to nearer 5% in late In December the house price index dropped slightly in what may be a response to the latest lending restrictions. The Christchurch Hills area dropped significantly in the previous three months, while the southwest area picked up a little. Christchurch Values Average Value of Housing Stock - Christchurch Annual and Quarterly Change in Value - Christchurch December 2016 Current Value 3 months 12 months Since Peak Banks Peninsula $513, % 5% 7% Christchurch Hills $656, % 0% 19% Christchurch Central & North $585, % 3% 32% Christchurch East $368, % 1% 19% Christchurch Southwest $474, % 4% 40% 44
45 Buyer Classification - Christchurch There was some volatility in the share of buyers throughout 2016 but the year ended with investors bouncing up to 39%, mostly at the expense of movers. First home buyers did dip slightly at the end of the year but their share of sales is still back at 2013 levels having recovered from the drop caused by the introduction of the first round of LVR restrictions. 45
46 Unlike the other main centres there is no sign of a slowdown in value increases in Dunedin. In contrast the latest house price index has ticked upwards. As a result the quarterly and annual increase in values has also risen. Taieri and Dunedin South appear to be leading the charge. Dunedin Values Average Value of Housing Stock - Dunedin Annual and Quarterly Change in Value - Dunedin December 2016 Current Value 3 months 12 months Since Peak Dunedin Central & North $368, % 13% 22% Dunedin South $338, % 16% 18% Peninsula & Coastal $308, % 11% 14% Taieri $371, % 16% 26% 46
47 Buyer Classification - Dunedin While investor activity bounced back up at the end of the year, there was a much more significant increase in the share of sales to first home buyers. First home buyers are now the most active they have been since at least 2005, apparently not put off through lack of confidence or lending restrictions that might be hurting other buyer groups. First home buyers have maintained their share, while movers have dropped dramatically. Auckland multiple property owners remain an increased, but relatively small presence in the market. 47

48 CoreLogic, Except as provided by the Copyright Act 1994, no part of this publication may be reproduced or stored in a retrieval system in any form or by any means without the prior written permission of the copyright owner. CoreLogic and the CoreLogic logo are trade marks of CoreLogic Solutions LLC and are registered trade marks in various countries including New Zealand and Australia. All solution names in this publication are trade marks or registered trade marks of CoreLogic Solutions LLC or are used with the permission of their respective owners.
Quarterly Property Market & Economic Update
 Quarterly Property Market & Economic Update New Zealand Quarter 2, 2018 Contents About CoreLogic 3 CoreLogic Data and Analytics... 3 Legal Disclaimer... 3 Executive Summary... 4 Macro Economic and Demographic
NZ property report OCTOBER 2016
 NZ property report OCTOBER 2016 Report Definitions Sales by registration type; rolling three month, year-on-year growth This data set provides an insight into who is active in the market compared to the
Rents leap to end 2016 on a record high
 Media Release 16 January 2017 Rents leap to end 2016 on a record high December was another tough month for tenants in New Zealand with the national median weekly rent jumping to a record $450, according
Domain.com.au House Price Report December Quarter 2015
 Domain.com.au House Price Report December Quarter 2015 Dr Andrew Wilson Senior Economist for Domain.com.au Key findings Record drop in Sydney median house prices over the December quarter Melbourne and
Housing and Construction Quarterly
 New Zealand Housing and Construction Quarterly March 2015 Contents 2 Quarterly Highlights Housing Market 3 House Values by Region 4 Rents by Region 5 Rents by Bedroom and Region 6 Price and Rent Comparisons
Auckland rents kick back into gear
 Media Release 24 May 2016 Auckland rents kick back into gear The New Zealand rental market kicked back into gear in April as the median weekly asking rent increased by $10 according to the latest Trade
Hamilton s Housing Market and Economy
 Hamilton s Housing Market and Economy Growth Indicator Report December 217 hamiltoninvest.co.nz Contents 3. Introduction 4. New Residential Building Consents 5. New Residential Sections and Titles (224c)
Sellers set a new record high asking price, as inventory drops to near record low
 1st May 2013 Sellers set a new record high asking price, as inventory drops to near record low Asking prices reach new high The seasonally adjusted asking price rose in April to a new record high of $447,275
Lowest sales volumes in 8 months a result of extremely low listings in July says REINZ
 11 October 2018 For immediate release Lowest sales volumes in 8 months a result of extremely low listings in July says REINZ The low number of new listings in July has meant that the number of houses sold
Record Supply Still Not Enough
 Market Indicators Report Second Half 2017 AUCKLAND RESIDENTIAL DEVELOPMENT REPORT Record Supply Still Not Enough SOTO Meadowbank, Auckland Architect: Monk Mackenzie Developer: Southside Group Accelerating
Hamilton s Housing Market and Economy
 Hamilton s Housing Market and Economy Growth Indicator Report November 2016 hamilton.govt.nz Contents 3. 4. 5. 6. 7. 7. 8. 9. 10. 11. Introduction New Residential Building Consents New Residential Sections
House prices rise 6.9% across New Zealand according to latest REINZ figures
 14 March 2018 For immediate release House prices rise 6.9% across New Zealand according to latest REINZ figures The median house price for New Zealand rose 6.9% in February to $530,000 up from $496,000
Quarterly Review The Australian Residential Property Market and Economy
 Quarterly Review The Australian Residential Property Released January 2018 Contents Introduction 3 Housing Market 4 Mortgage Lending 11 Housing Supply 17 Demographic Overview 20 Household Finances 22 National
Record house prices an early Christmas present to vendors, says REINZ
 14 December 2018 For immediate release Record house prices an early Christmas present to vendors, says REINZ Vendors from around the country have been delivered an early Christmas present with record median
NEW ZEALAND PROPERTY SURVEY SEPTEMBER 2015
 NEW ZEALAND PROPERTY SURVEY SEPTEMBER 2015 We asked New Zealanders what they really thought about property. What challenges Kiwis faced when selling or buying and how they felt about the property market.
$27k price increase sees NZ hit new record median price in May says REINZ
 14 June 2018 For immediate release $27k price increase sees NZ hit new record median price in May says REINZ A year-on-year price increase of $27,000 has seen New Zealand achieve a new record median house
Housing and Construction Quarterly
 New Zealand Housing and Construction Quarterly September 2014 Contents Housing Market 2 House Values by Region 3 Rents by Region 4 Rents by Bedroom and Region 5 Price and Rent Comparisons 6 Housing Affordability
NZ house price index relative to peak
 Media release 11 th July 2011 Nationwide property values edge upwards The QV residential property index shows that nationwide values increased in June, driven largely by the Auckland market. Nationwide
Renters in Auckland $12,500 p.a better off than homeowners
 Media Release 19 November 2015 Renters in Auckland $12,500 p.a better off than homeowners It is cheaper to rent a house than buy a house across New Zealand, but the disparity is most pronounced in Auckland
RP Data chart pack. November 2014
 RP Data chart pack November 2014 Macro housing market indicators 2 Residential real estate underpins Australia's wealth Residential Real Estate $5.6 Trillion Australian Superannuation $1.8 Trillion Australian
Rental report. December Quarter Dr Andrew Wilson Senior Economist for the Domain Group
 Rental report December Quarter 2014 Dr Andrew Wilson Senior Economist for the Domain Group Key findings Rents remain at or near record levels in most capitals rents surge to peak levels despite record
Inventory of unsold houses drops to 6 year low
 1st July 2013 Inventory of unsold houses drops to 6 year low New listings stall After witnessing a surge of fresh listings in May, June saw listings stall, with just 9,082 listings coming to the market.
Strong end to 2017, with house prices up 5.8% in December says REINZ
 18 January 2018 Strong end to 2017, with house prices up 5.8% in December says REINZ Median house prices across New Zealand rose by 5.8% year-on-year to $550,000 up from $520,000 in December 2016 and median
Residential Commentary Sydney Apartment Market
 Residential Commentary Sydney Apartment Market April 2017 Executive Summary Sydney Apartment Market: Key Indicators 14,200 units are currently under construction in Inner Sydney with completion expected
RP Data chart pack. September 2014
 RP Data chart pack September 2014 Macro housing market indicators 2 Residential real estate absolutely underpins Australia s wealth position Residential Real Estate $5.5 Trillion Australian Superannuation
mymarket Report How is the market?
 How is the market? Otago Summer 2015 The latest property market update for the Otago region. Helping you with your property decisions. Queenstown Lakes District values continue to grow steadily, while
CoreLogic RP Data November Rental Index Results
 Rental Review Snapshot Released: December 3, 2015 Capital city rental growth lowest on record over the past twelve months Weekly rents across the combined capital city measure were unchanged in November
Residential Commentary - Perth Apartment Market
 Residential Commentary - Perth Apartment Market March 2016 Executive Summary The Greater Perth apartment market has attracted considerable interest from local and offshore developers. Projects under construction
report New Zealand property
 report New Zealand property April 2018 issued 1 May 2018 overview A rise in new property listings nationally is strongly underpinned by the Canterbury and Wellington regions Real-time data from realestate.co.nz
HOUSING MARKET OUTLOOK Calgary CMA
 H o u s i n g M a r k e t I n f o r m a t i o n HOUSING MARKET OUTLOOK Calgary CMA C a n a d a M o r t g a g e a n d H o u s i n g C o r p o r a t i o n Date Released: Fall 2011 NEW HOME MARKET Total housing
CoreLogic RP Data June Rental Index Results
 Rental Review Snapshot Released: July 10, 2015 & recorded the greatest annual increases in weekly rents while rents in, & continue to decline. capital city rental rates fell by -0.2% in June The rate of
Real estate industry sees highest annual volume increase in 23 months
 11 May 2018 For immediate release Real estate industry sees highest annual volume increase in 23 months The number of properties sold in April 2018 across New Zealand increased by 6.6% compared to the
REINZ statistics: Auckland price growth slowing, regional strong growth continues
 13 July 2017 For immediate release REINZ statistics: price growth slowing, regional strong growth continues New Zealand s property market is showing all the signs of being a two-tier market with median
Report ER5 Can Work, Cannot Afford to Buy the Intermediate Housing Market
 External Research Report Issue Date: 31/08/2015 ISSN: 2423-0839 Report ER5 Can Work, Cannot Afford to Buy the Intermediate Housing Market Ian Mitchell Project LR0484 Livingston and Associates Ltd funded
House price report. September quarter Dr Andrew Wilson Senior Economist for the Domain Group
 September quarter 2014 Dr Andrew Wilson Senior Economist for the Domain Group Key findings Most capital city housing markets recorded falls in house prices over the September quarter September quarter
Sales volumes see seasonal drop in January as Auckland & National median house prices rise year-on-year
 REINZ Real Estate Institute of New Zealand February 2017 Sales volumes see seasonal drop in January as & median house prices rise year-on-year Bindi Norwell, REINZ CEO ers are once again starting to put
National Policy Statement on Urban Development Capacity Price efficiency indicators technical report: Price-cost ratios
 National Policy Statement on Urban Development Capacity Price efficiency indicators technical report: Price-cost ratios Acknowledgements: SensePartners is acknowledged for the development of this technical
report New Zealand property
 report New Zealand property July 2018 issued 1 August 2018 overview Interest in homes for sale warms in July. Search for properties back to summertime levels. Searches for properties in July on realestate.co.nz
Appendix 1: Gisborne District Quarterly Market Indicators Report April National Policy Statement on Urban Development Capacity
 Appendix 1: Gisborne District Quarterly Market Indicators Report April 2018 National Policy Statement on Urban Development Capacity Quarterly Market Indicators Report April 2018 1 Executive Summary This
Domain Rental Report June Quarter 2015
 Domain Rental Report June Quarter 2015 Dr Andrew Wilson Senior Economist for the Domain Group Key findings Rents remain at or near record levels in most Australian capital cities house rents surge 1.9
CoreLogic Quarterly Rental Review
 CoreLogic Quarterly Rental Review December Quarter 2018 Copyright 2019 RP Data Pty Ltd trading as CoreLogic Asia Pacific (CoreLogic) and its licensors are the sole and exclusive owners of all rights, title
Auckland Council Quarterly Monitoring Report
 Auckland Council Quarterly Monitoring Report for the National Policy Statement on Urban Development Capacity June 2018 2018 Auckland Council Prepared by the Land Use, Infrastructure Research and Evaluation
BNZ-REINZ Residential Market Survey ISSN
 ISSN 2253-3656 13 2012 Mission Statement To help Kiwi businesspeople and householders make informed financial decisions by discussing the economy in a language they can understand. Market Strength Continues
Trends in Scottish Residential Lettings
 The Citylets Report Issue 1 Spring 2007 Trends in Scottish Residential tings A Tale of Three Cities Introduction citylets.co.uk is Scotland s original residential lettings portal advertising over 45,000
House price report. December quarter Dr Andrew Wilson Senior Economist for the Domain Group
 December quarter 2014 Dr Andrew Wilson Senior Economist for the Domain Group Key findings Capital city house prices increased over the December quarter with remaining the runaway leader December quarter
Domain Rental Report September Quarter 2016
 Domain Rental Report September Quarter 2016 Dr Andrew Wilson Chief Economist for Domain.com.au Key findings House rents in Sydney, Melbourne, Brisbane, Adelaide and Darwin all remain steady Canberra is
Suburb Profile Report. Paddington, 2021 NSW
 Suburb Profile Report Paddington, 2021 NSW October 2018 About Sound Property Group Sound Property Group is a property investment and education company specialised in sourcing strategic real estate opportunities,
RP Data Housing market update. October 2014
 RP Data Housing market update October 2014 Residential real estate absolutely underpins Australia s wealth position Residential Real Estate $5.6 Trillion Australian Superannuation $1.5 Trillion $1.8 Trillion
NAB COMMERCIAL PROPERTY SURVEY Q4 2017
 EMBARGOED UNTIL 11.30 AM WEDNESDAY 21 FEBRUARY 2018 NAB COMMERCIAL PROPERTY SURVEY Q4 2017 Date February 2018 NAB Behavioural & Industry Economics KEY FINDINGS The NAB Commercial Property Index (a measure
Quarterly Review The Australian Residential Property Market and Economy
 Quarterly Review The Australian Residential Property Released January 2018 Contents Introduction 3 Housing Market 4 Mortgage Lending 11 Housing Supply 17 Demographic Overview 20 Household Finances 22 National
Individual Property Report. Cambooya Toowoomba, QLD 4358, Australia
 Individual Property Report Address: Cambooya Toowoomba, QLD 4358, Australia Contents Your Property Risk Summary Property Details Suburb Metrics Market Overview Equity Risk Factors Cash Flow Risk Rating
Property Report. South Australia
 Property Report South Australia National overview Looking back over 2011 it s clear that the Australian property market was and in early 2012, still is far from homogenous. Cooler market conditions in
Housing market report
 Capital city market report Prepared August Dr Andrew Wilson, Senior Economist Australian Property Monitors Buyer momentum rises through mid-winter housing markets National overview Buyer and seller momentum
1 February FNB House Price Index - Real and Nominal Growth
 1 February 2017 MARKET ANALYTICS AND SCENARIO FORECASTING UNIT JOHN LOOS: HOUSEHOLD AND PROPERTY SECTOR STRATEGIST 087-328 0151 john.loos@fnb.co.za THEO SWANEPOEL: PROPERTY MARKET ANALYST 087-328 0157
Domain House Price Report
 Domain House Price Report June Quarter 2016 Dr Andrew Wilson Chief Economist for Domain Key findings median house price back up over $1 million Median house prices hit new record in Melbourne, and, with
Auckland property cools further as summer rolls on
 Media Release 22 February 2017 Auckland property cools further as summer rolls on The Auckland property market continues to cool, with the Trade Me Property Price Index reporting the average asking price
Housing market report
 Capital city market report Prepared September Dr Andrew Wilson, Senior Economist Australian Property Monitors No sign of winter pause as housing markets gather strength into spring National overview Buyer
BRISBANE HOUSING MARKET STUDY
 BRISBANE HOUSING MARKET 2018 STUDY Executive Summary Brisbane s residential market, especially the detached houses segment has risen steadily over the last year due to the rise in population, falling unemployment
Has The Office Market Reached A Peak? Vacancy. Rental Rate. Net Absorption. Construction. *Projected $3.65 $3.50 $3.35 $3.20 $3.05 $2.90 $2.
 Research & Forecast Report OAKLAND METROPOLITAN AREA OFFICE Q1 Has The Office Market Reached A Peak? > > Vacancy remained low at 5. > > Net Absorption was positive 8,399 in the first quarter > > Gross
6 April 2018 KEY POINTS
 6 April 2018 MARKET ANALYTICS AND SCENARIO FORECASTING UNIT JOHN LOOS: HOUSEHOLD AND PROPERTY SECTOR STRATEGIST 087-328 0151 john.loos@fnb.co.za THULANI LUVUNO: STATISTICIAN 087-730 2254 thulani.luvuno@fnb.co.za
Buy-to-Let Index Scotland
 Buy-to-Let Index Scotland Under embargo until 00:01 Wednesday 24 th February 2016 January 2016 Scotland s tenants move back into the black Six-month low for late rent, with only 11.1% of January rent falling
MANHATTAN MARKET REPORT. 2nd Quarter 2017 RESALE
 MANHATTAN MARKET REPORT 2nd Quarter 2017 RESALE LETTER FROM THE PRESIDENT We are pleased to introduce the very first Berkshire Hathaway HomeServices New York Properties Manhattan Market Report, featuring
New Zealand Property Report. June
 New Zealand Property Report June 2016 The Overview Scarcity of houses for sale nationally creates sellers market. Realestate.co.nz statistics show demand and prices up, supply down. The average asking
Volume II Edition III Mid Summer update
 The Realtors Canadians Trust www.arizonaforcanadians.com Volume II Edition III Mid Summer update In This Edition What is happening in the market today? Where is the market heading? The Buying Process Our
Signs that the housing market may be peaking
 National Media Release: 21 October, 2015 Market movement s data released today show which markets are moving out of peak cycles. Signs suggesting that Australia s housing market may be moving through the
The Coldwell Banker Carlson Real Estate Market Report
 The Coldwell Banker Carlson Real Estate Market Report 2017 Year-End Stowe Area Report Our 2017 Year-End Market Report uses market-wide data, based on transactions that closed in 2017 in the Multiple Listing
Performance of the Private Rental Market in Northern Ireland
 Summary Research Report July - December Performance of the Private Rental Market in Northern Ireland Research Report July - December 1 Northern Ireland Rental Index: Issue No. 8 Disclaimer This report
KIWIBUILD: 100,000 MODERN AFFORDABLE HOMES FACTSHEET
 KIWIBUILD: 100,000 MODERN AFFORDABLE HOMES FACTSHEET HIGHLIGHTS Labour will: Help Kiwis into their first home by building 100,000 modern affordable homes. Create a significant number of skilled jobs by
MONTHLY RESEARCH BULLETIN SEPTEMBER 2016
 MONTHLY RESEARCH BULLETIN SEPTEMBER 2016 ABOUT REIV The Real Estate Institute of Victoria has been the peak professional association for the Victorian real estate industry since 1936. Over 2,000 real estate
report New Zealand property
 report New Zealand property June 2018 issued 3 July 2018 overview New property listings drop significantly in June, while asking prices and buyer interest hold steady. The Auckland region records a fall
Property Report. Western Australia
 Property Report Western Australia National overview Taken as a whole, the Australian property market has cooled over recent months though in a market as diverse as ours, there are pockets of growth even
MANHATTAN MARKET REPORT
 MANHATTAN MARKET REPORT Q1 MANHATTAN MARKET REPORT 1Q 2017 Manhattan s residential market is showing signs of improvement after a period of uncertainty leading up to the Presidential election, as it does
Single Family Sales Maine: Units
 Maine Home Connection 19 Commercial St Portland, Maine 04101 MaineHomeConnection.com Office: (207) 517-3100 Email: Info@MaineHomeConnection.com For the fourth consecutive year, Maine home sales set a new
Vesteda Market Watch Q
 Vesteda Market Watch Q1 2018 7.6 Housing Market Indicator 1 Housing Market Indicator The Housing Market Indicator in the first quarter of 2018 hits a level of 7.6. This score clearly reflects the positive
2013 Arizona Housing Market Mid-Year Report
 2013 Arizona Housing Market Mid-Year Report This mid-year market report outlines the latest trends in Arizona real estate. The housing market hit bottom in mid to late 2011, and has been in recovery mode
Domain House Price Report March Quarter 2016
 Domain House Price Report March Quarter 2016 Dr Andrew Wilson Chief Economist for Domain Key findings Sydney median house price drops below $1 million House and unit prices are down in Sydney, Brisbane,
MICRO-POCKETS OF GROWTH
 MICRO-POCKETS OF GROWTH (AND HOW TO FIND THEM) The Auckland Effect Over the past few years, the Auckland real estate market has been splashed across national (and even global) headlines and for good reason.
mymarket Report How is the market?
 mymarket Report How is the market? Lower North Island Autumn 2016 The latest property market update for the Lower North Island region. Helping you with your property decisions. mymarket Report Median property
Housing Watch Ireland
 Strong momentum in the market Housing has been front and centre of the national discourse in recent years and with prices and rents currently experiencing strong growth will remain so for some time to
mymarket Report How is the market?
 mymarket Report How is the market? Lower North Island Autumn 2016 The latest property market update for the Lower North Island region. Helping you with your property decisions. mymarket Report Median property
Nothing Draws a Crowd Like a Crowd: The Outlook for Home Sales
 APRIL 2018 Nothing Draws a Crowd Like a Crowd: The Outlook for Home Sales The U.S. economy posted strong growth with fourth quarter 2017 Real Gross Domestic Product (real GDP) growth revised upwards to
report New Zealand property
 report New Zealand property February 2018 issued 1 March 2018 Lifestyle property a potential option in a relatively static housing market A surge in the number of lifestyle properties listed for sale nationally
STRENGTHENING RENTER DEMAND
 5 Rental Housing Rental housing markets experienced another strong year in 2012, with the number of renter households rising by over 1.1 million and marking a decade of unprecedented growth. New construction
Economy. Denmark Market Report Q Weak economic growth. Annual real GDP growth
 Denmark Market Report Q 1 Economy Weak economic growth In 13, the economic growth in Denmark ended with a modest growth of. % after a weak fourth quarter with a decrease in the activity. So Denmark is
Summary. Houston. Dallas. The Take Away
 Page Summary The Take Away The first quarter of 2017 was marked by continued optimism through multiple Texas metros as job growth remained positive and any negatives associated with declining oil prices
Rapid recovery from the Great Recession, buoyed
 Game of Homes The Supply-Demand Struggle Laila Assanie, Sarah Greer, and Luis B. Torres October 4, 2016 Publication 2143 Rapid recovery from the Great Recession, buoyed by the shale oil boom, has fueled
Building Consents Issued: June 2013
 Building Consents Issued: June 2013 Embargoed until 10:45am 30 July 2013 Key facts In June 2013, building consents were issued for: 1,487 new dwellings, including apartments 160 apartments, including 39
3 November rd QUARTER FNB SEGMENT HOUSE PRICE REVIEW. Affordability of housing
 3 November 2011 3 rd QUARTER FNB SEGMENT HOUSE PRICE REVIEW JOHN LOOS: HOUSEHOLD AND PROPERTY SECTOR STRATEGIST 011-6490125 John.loos@fnb.co.za EWALD KELLERMAN: PROPERTY MARKET ANALYST 011-6320021 ekellerman@fnb.co.za
Focus article: Metropolitan and rural housing market developments
 Focus article: Metropolitan and rural housing market developments Introduction The upswing in the South African residential property market which started around was driven by a wide range of economic,
Housing and. Construction. Quarterly. Contents 2 Quarterly Highlights. New Zealand. June Key Issues. A Tale of Two Housing Markets.
 New Zealand Housing and Construction Quarterly June 2014 Contents 2 Quarterly Highlights Housing Market 3 House Values by Region 4 Rents by Region 5 Rents by Bedroom and Price by TA 6 Price and Rent Comparisons
Commentary. Regional Summary Asking Price
 Inventory recovers slightly as national asking prices ease Asking prices ease Nationally average asking prices of new listings eased in April. The seasonally adjusted asking price fell by 1.4% to $477,460,
New House Owners Satisfaction Survey
 Study Report SR374 [2017] New House Owners Satisfaction Survey Matthew Curtis 1222 Moonshine Rd RD1, Porirua 5381 Private Bag 50 908 Porirua 5240 New Zealand branz.nz The work reported here was funded
HOULIHAN LAWRENCE COMMERCIAL GROUP
 HOULIHAN LAWRENCE COMMERCIAL GROUP TH QUARTER EXECUTIVE SUMMARY FOURTH QUARTER Dear Clients, With behind us and the new year in full swing, we can now reflect, summarize and gain insight from the past
report New Zealand property
 report New Zealand property January 2018 issued 1 February 2018 overview New Zealand property market in major centres stays cool over hot summer, while regions are pumping Real-time statistics from realestate.co.nz
ECONOMIC CURRENTS. Vol. 5 Issue 2 SOUTH FLORIDA ECONOMIC QUARTERLY. Key Findings, 2 nd Quarter, 2015
 ECONOMIC CURRENTS THE Introduction SOUTH FLORIDA ECONOMIC QUARTERLY Economic Currents provides an overview of the South Florida regional economy. The report presents current employment, economic and real
Residential December 2009
 Residential December 2009 Karl L. Guntermann Fred E. Taylor Professor of Real Estate Adam Nowak Research Associate Year End Review The dramatic decline in Phoenix house prices caused by an unprecedented
Top Performing Suburbs National July 2018
 Top Performing Suburbs National July 2018 Welcome Welcome to the National Top Performing Suburbs Report for July 2018. The CoreLogic Top Performing Suburbs Report identifies those suburbs and towns that
Queenstown-Lakes Data REINZ SLIDE 1
 Queenstown-Lakes Data REINZ SLIDE 1 OTAGO REGION SCORECARD Net Migration (year to) Unemployment (Q3) Weekly Earnings (Median) House Prices (Median) Sep 16: 1,954 Q3 2016: 3.7% 2016: $1,054 YE Sep 16: $337k
ARLA Members Survey of the Private Rented Sector
 Prepared for The Association of Residential Letting Agents ARLA Members Survey of the Private Rented Sector Second Quarter 2014 Prepared by: O M Carey Jones 5 Henshaw Lane Yeadon Leeds LS19 7RW June, 2014
FNB-TPN RESIDENTIAL YIELDS REVIEW
 FNB-TPN RESIDENTIAL YIELDS REVIEW 17 November 2015 John Loos, Household and Property Sector Strategist Tel: (087) 328 0151 Cell:083-453 8096 E-mail: john.loos@fnb.co.za Website: http://blog.fnb.co.za/category/economics/