Analysis of Impediments to Fair Housing Choice. Contra Costa County Consortium
|
|
|
- Marjory McDowell
- 6 years ago
- Views:
Transcription

1 Analysis of Impediments to Fair Housing Choice Contra Costa County Consortium 2017
2 Contents I. Executive Summary... 1 What Is Fair Housing?... 2 What Is an Impediment to Fair Housing Choice?... 2 Purpose of the Analysis of Impediments... 3 Impediments Identified... 4 Recommendations... 5 II. Methodology... 7 III. Past Impediments and Actions Taken... 9 IV. Background POPULATION POPULATION BY AGE RACE/ETHNICITY INCOME POVERTY EDUCATION EMPLOYMENT HOUSEHOLDS SPECIAL NEEDS POPULATIONS NON-HOMELESS HOUSING CHARACTERISTICS V. Mortgage Lending (Home Mortgage Disclosure Act Data) Lending Practices Contra Costa County s Single Family Lending Market, VI. Laws, Policies and Furthering Fair Housing Overview of Federal Fair Housing Laws and Executive Orders Review of State Laws HUD Office of General Counsel Guidance VII. Private Sector Analysis Real Estate Sales Practices Rental and Property Management Public Outreach... 96
3 Public Survey Stakeholder Interviews VIII. Government Barriers to Fair Housing Housing Element Law and Compliance Housing for Persons with Special Needs Housing for the Homeless Building Code Resources and Incentives for Affordable Housing IX. Findings, Impediments, and Recommendations Findings Impediments Recommendations X. Fair Housing Action Plan Appendix 1 List of Stakeholder Interviews Appendix 2 Past Impediments and Actions Appendix 3 Maps Appendix 4 Comprehensive Housing Affordability Strategy (CHAS) Tables Appendix 5 Survey Questionnaires Appendix 6 Local Building Codes Appendix 7 Affordable Housing Resources
4 I. Executive Summary As recipients of funds from the U.S. Department of Housing and Urban Development (HUD), the members of the Contra Costa HOME Consortium are required to conduct an Analysis of Impediments to Fair Housing Choice (AI) and to periodically review that analysis and update it as necessary. Further, each AI is reassessed and reevaluated with each Consolidated Plan. Together, the Community Development Block Grant (CDBG) program entitlement communities of Contra Costa County and the Urban County have formed the Contra Costa Consortium (Consortium) to jointly plan for the housing and community development needs of the County. The City of Richmond has partnered with the Consortium in the development of this AI. The Consortium and the City of Richmond (City) develop five year Consolidated Plans and have established processes to request funding and to evaluate requests for funds. The creation of a Consolidated Plan maximizes the impact of available resources and assures a more efficient distribution of funds. This is most notable in the provision of countywide services and the ability to fund large housing projects (using HOME funds) that would be beyond the capacity of any single member. This AI is one of several ways in which the jurisdictions are fulfilling their obligation to affirmatively further fair housing. This document includes an analysis of local factors that may impact fair housing choice, the identification of specific impediments to fair housing choice, and a plan to address those impediments. The Consortium must also assure equal access to services and programs it provides or assists. Please note that each member jurisdiction prepares its own annual Action Plan as well as its own Consolidated Annual Performance Evaluation Report (CAPER). These Action Plans and CAPERs include a description of the efforts made each year to affirmatively further fair housing. These documents may be consulted for an evaluation of actions taken by individual jurisdictions. 1
5 What Is Fair Housing? Federal law prohibits discrimination in the provision of housing or access to housing based on membership in certain protected classes of persons or personal status. These protections apply to race, color, national origin or ancestry, sex, religion, familial status, and mental and physical handicap (disability). California state law codifies the federal protections and adds sexual orientation, marital status, use of language, source of income, HIV/AIDS, and medical condition. State law also prohibits discrimination based on any arbitrary status (the Unruh Act). Equal access to housing is fundamental to each person in meeting essential needs and pursuing personal, education, employment, or other goals. Federal and State fair housing laws prohibit discrimination in the sale, rental, lease, or negotiation for real property based on a person s protected status. Fair housing is a condition in which individuals of similar income levels in the same housing market have a like range of choice available to them, regardless of personal status. What Is an Impediment to Fair Housing Choice? As defined by HUD Fair Housing Planning Guide (1996), impediments to fair housing choice are: Any actions, omissions, or decisions taken because of race, color, ancestry, national origin, religion, sex, disability, marital status, familial status, or any other arbitrary factor which restrict housing choices or the availability of housing choices; or any actions, omissions, or decisions which have the effect of restricting housing choices or the availability of housing choices on the basis of race, color, ancestry, national origin, religion, sex, disability, marital status, familial status, or any other arbitrary factor. To affirmatively further fair housing, a community must work to remove impediments to fair housing choice. 2
6 Purpose of the Analysis of Impediments The purpose of an AI is to review conditions in the jurisdictions that may impact the ability of households to freely choose housing and to be treated without regard to race, ethnicity, religion, gender, national origin, source of income, age, disability, or other protected status. The AI reviews the general state of fair housing, the enforcement of fair housing law, efforts to promote fair housing, access to credit for the purpose of housing, and general constraints to the availability of a full range of housing types. An AI examines the affordability of housing in the jurisdiction with an emphasis on housing affordable to households with annual incomes classified as low income and less. (Low income is defined as equal to or less than 80 percent of the adjusted Area Median Income as most recently published by HUD.) The document has three major goals: To provide an overview of the current conditions as they impact fair housing choice. To review policies and practices as they impact fair housing choice and the provision of housing, specifically affordable housing and housing for special needs households. To identify impediments to fair housing choice and actions that will take to remove those impediments or to mitigate the impact those impediments have on fair housing choice. Fulfilling these goals includes the following: A review of the laws, regulations, and administrative policies, procedures, and practices of the Consortium and the City. An assessment of how those laws affect the location, availability, and accessibility of housing. An assessment of conditions, both public and private, affecting fair housing choice. 3
7 Impediments Identified This analysis has identified the following impediments and actions to address those impediments. 1. Education and public perception. Inadequate information on fair housing issues and a lack of understanding about the potential extent of housing discrimination exists. 2. Housing affordability. The high cost of housing and extreme burden those costs place, particularly on renters, present a barrier to fair housing choice. Also, low vacancies and lack of affordable housing options contribute to these issues. Concentration of the limited affordable housing supply is also a fair housing concern. 3. Home purchase loan denials. Significant disparity between races and ethnicities in loan denial rates exists. Minorities are more likely to be denied loans than whites, even in high income categories. 4. Disability and elder care issues. Availability and access to housing for individuals with physical and mental disabilities is a rapidly emerging impediment to fair housing. Further, insufficient education and enforcement around issues of reasonable accommodations results in discrimination against individuals with disabilities. 5. Local Building Approvals. Lengthy, complex, and extensive local review and approval processes discourage construction of affordable housing. Local governments sometimes require separate approvals for every aspect of the development process and sometimes stipulate public hearings that invite community opposition, which can have the same effect as exclusionary zoning. 4
8 Recommendations The following recommendations are made to address the impediments stated above. The Action Plan provides steps for implementing these recommendations. Recommendation # 1: Increase Public Awareness of Fair Housing Rights The Contra Costa County Consortium could strengthen efforts to make the public aware of fair housing rights and further emphasize how reporting fair housing violations can have positive outcomes. This would include providing communities information on fair housing laws and policies, model zoning ordinances, and advice from other communities that have succeeded in overcoming regulatory impediments to fair housing choice. Recommendation #2: Improve Financial Assistance for Housing High housing costs and cost burden to both buyers and renters may be reduced through direct and indirect financial assistance programs. There is a variety and volume of programs available to low/moderate-income people. Real estate professionals, lenders and rental property owners often do not know what is available and what qualifications are for the various programs. All could benefit from more information on the availability of home finance and rental subsidy programs (including both tenant-based and project-based subsidies). In order to increase the number of households who are served by these programs, there needs to be additional funding and increased efficiencies in program delivery. Members of the Contra Costa County Consortium could support efforts to increase funding through local, State and federal initiatives; lower development costs of new affordable housing; and allow for innovative housing options such as tiny homes and accessory dwelling units. Recommendation # 3: Review Home Purchase Loan Denial Figures with Local Lenders Significant disparity between races and ethnicities in loan denial rates exists. Minorities are more likely to be denied loans than Whites, even in high income categories. The Contra Costa County Consortium should further research the extent of these issues and review this 5
9 information with Fair Housing Organizations and local lenders. Both members of the Consortium and the Fair Housing Organizations should report the disparate impact to lenders, encourage them to examine loan approval policies and procedures within that context and indicate what affirmative steps, as appropriate, that they might take to address this apparent issue. Members of the Consortium have some established networks such as the Home Equity Preservation Alliance and lists of preferred lenders that may be able to serve as a base for growing outreach on these issues. Recommendation # 4: Increase Access to Special Needs Housing The Contra Costa County Consortium should gather more information of this emerging impediment and determine the extent to which the available supply of supportive housing is limited particularly for individuals with physical and mental disabilities. Members of the Consortium should examine and develop more formal policies and procedures regarding reasonable accommodation and better inform landlords, especially small rental property owners. Promoting best practices for alternative types of special needs/elderly housing and considering policy changes may be in order. Shaping community attitudes as described in the first recommendation may also be necessary to confront this barrier. Recommendation #5: Review Municipalities Planning Code and Offer Incentives The Contra Costa County Consortium should encourage local governments to examine the review and approval processes that discourage construction of affordable housing with respect to elements that have the unintended consequence of impeding such development. As observed in the findings, local governments sometimes require separate approvals for every aspect of the development process and sometimes stipulate public hearings that result in community opposition, which can have the same effect as exclusionary zoning. Local building and zoning codes could be modified to simplify local processes for building approvals and more effectively encourage construction of affordable housing as well as special needs housing. 6
10 II. Methodology To gain pertinent information on fair housing needs and activities in Contra Costa County (County), the County collected and analyzed demographic and housing data; conducted and analyzed Fair Housing Surveys completed by community residents, jurisdictions, and stakeholder organizations across the County and interviewed key stakeholders including advocacy organizations and government officials; and conducted a literature review. Fair Housing Surveys - Three written surveys were developed to collect perspectives of residents, jurisdictions, and stakeholder groups. The resident survey was also made available in Spanish. The purpose for conducting the survey was to obtain information and insights about fair housing choice in the County. The surveys were posted online and promoted through the member jurisdictions. Advocacy groups and community-based organizations were asked to share the survey links as well. A total of 225 residents, 76 individuals representing jurisdictions, and 177 stakeholder organizations completed the surveys. Stakeholder Interviews Stakeholders were interviewed to gain specific views on topics from experts and to further explore areas of concern. The list of stakeholders interviewed is included as Appendix 1. Analysis of Impediments - HUD requires its CDBG entitlement communities to conduct a Fair Housing Analysis. In the analysis, each entitlement community is required to identify fair housing problems and impediments, courses of action intended to address the impediments, and a schedule to resolve those problems identified. To gain relevant data on both statewide and regional housing impediments, a scan of the reports was completed to determine the most prevalent housing impediments, and the courses of action most commonly used by communities to combat housing problems. 7
11 Housing Data - This report uses American Community Survey (ACS) data, Census data, and the Home Mortgage Disclosure Act Reporting (HMDA) data to review and analyze state demographics, housing needs, and housing and lending activity. Literature Review - In order to gain pertinent information on fair housing and related issues, the team conducted a thorough literature review of relevant publications and periodicals. Information gained from the literature review was incorporated in the findings section and was used to support recommendations offered by the team in this report. Throughout this document the following geographic terms will be used. To assist the reader, below is an explanation of each. Contra Costa County County (countywide): Includes all 19 jurisdictions within the County (Antioch, Brentwood, Clayton, Concord, Danville, El Cerrito, Hercules, Lafayette, Martinez, Moraga, Oakley, Orinda, Pinole, Pleasant Hill, Pittsburg, Richmond, San Pablo, San Ramon, and Walnut Creek), as well as the unincorporated area of the County. Urban County: Includes all jurisdictions which are not entitlement jurisdictions (Brentwood, Clayton, Danville, El Cerrito, Hercules, Lafayette, Martinez, Moraga, Oakley, Orinda, Pinole, Pleasant Hill, San Pablo, San Ramon, Richmond, and the unincorporated area of the County). Unincorporated County: This includes areas of the County that are not a part of any municipality. Entitlement Cities: The CDBG entitlement cities in the County are Antioch, Concord, Pittsburg, and Walnut Creek. HOME Consortium: The members of the HOME Consortium are the Urban County and the entire cities of Antioch, Concord, Pittsburg, and Walnut Creek. 8
12 III. Past Impediments and Actions Taken The impediments listed below were identified as obstacles to fair housing in the County s previous Analysis of Impediments to Fair Housing report in Appendix 2 provides a summary of actions taken to address these concerns. Affordable Housing 1. IMPEDIMENT: Lack of sufficient affordable housing supply Action: Provide assistance to preserve existing affordable housing and to create new affordable housing. Assistance will be provided through the Consolidated Plan programs of the Consortium member jurisdictions. These include CDBG, HOME, and HOPWA Action: Offer regulatory relief and incentives for the development of affordable housing. Such relief includes that offered under state density bonus provisions Action: Assure the availability of adequate sites for the development of affordable housing. 2. IMPEDIMENT: Concentration of affordable housing Action: Housing Authorities within the County (Contra Costa County, Richmond and Pittsburg) will be encouraged to promote wide acceptance of Housing Choice Vouchers, and will monitor the use of Housing Choice Vouchers to avoid geographic concentration Action: Consortium member jurisdictions will collaborate to expand affordable housing opportunities in communities in which they are currently limited Action: A higher priority for the allocation of financial and administrative resources may be given to projects and programs which expand affordable housing opportunities in communities in which they are currently limited. 9
13 2.4. Action: Member jurisdictions will report on the location of new affordable housing in relation to the location of existing affordable housing and areas of low income, poverty and minority concentration. Mortgage Lending 3. IMPEDIMENT: Differential origination rates based on race, ethnicity and location Action: Member jurisdictions will periodically monitor Home Mortgage Disclosure Act (HMDA) data and report significant trends in mortgage lending by race, ethnicity and location Action: When selecting lending institutions for contracts and participation in local programs, member jurisdictions may prefer those with a Community Reinvestment Act (CRA) rating of Outstanding. Member jurisdictions may exclude those with a rating of Needs to Improve, or Substantial Noncompliance according to the most recent examination period published by the Federal Financial Institutions Examination Council (FFIEC). In addition, member jurisdictions may review an individual institution s most recent HMDA reporting as most recently published by the FFIEC. 4. IMPEDIMENT: Lack of knowledge about the requirements of mortgage lenders and the mortgage lending and home purchase process, particularly among lower income and minority households Action: Member jurisdictions will support pre purchase counseling and home buyer education programs Action: Member jurisdictions will support home purchase programs targeted to lower income (low and very low), immigrant, and minority households. Minority households include Hispanic households. 10
14 4.3. Action: Member jurisdictions will encourage mortgage lenders to responsibly market loan products to lower income (low and very low), immigrant, and minority households. Minority households include Hispanic households. 5. IMPEDIMENT: Lower mortgage approval rates in areas of minority concentration and lowincome concentration Action: Member jurisdictions will support home purchase programs targeted to households who wish to purchase homes in Census Tracts with loan origination rates under 50 percent according to the most recently published HMDA data Action: Member jurisdictions will encourage mortgage lenders to responsibly market loan products to households who wish to purchase homes in Census Tracts with loan origination rates under 50 percent according to the most recently published HMDA data. 6. IMPEDIMENT: Lack of knowledge of fair housing rights Action: Support efforts to educate tenants, owners, and agents of rental properties regarding their fair housing rights and responsibilities. 7. IMPEDIMENT: Discrimination in rental housing Action: Support efforts to enforce fair housing rights and to provide redress to persons who have been discriminated against Action: Support efforts to increase the awareness of discrimination against persons based on sexual orientation. 8. IMPEDIMENT: Failure to provide reasonable accommodation to persons with disabilities Action: Support efforts to educate tenants, owners,agents of rental properties regarding the right of persons with disabilities to reasonable accommodation. 11
15 8.2. Action: Support efforts to enforce the right of persons with disabilities to reasonable accommodation and to provide redress to persons with disabilities who have been refused reasonable accommodation. 9. IMPEDIMENT: Lack of information on the nature and basis of housing discrimination Action: Monitor the incidence of housing discrimination complaints and report trends annually in the CAPER Action: Improve the consistency in reporting of housing discrimination complaints. All agencies who provide this information should do so in the same format with the same level of detail. Information should be available by the quarter year Action: Improve collection and reporting information on discrimination based on sexual orientation and failure to provide reasonable accommodation to persons with disabilities. Government Barriers 10. IMPEDIMENT: Lack of formal policies and procedures regarding reasonable accommodation Action: Jurisdictions which have not done so will adopt formal policies and procedures for persons with disabilities to request reasonable accommodations to local planning and development standards. 11. IMPEDIMENT: Transitional and supportive housing is not treated as a residential use subject only to those restrictions that apply to other residential uses of the same type in the same zone, and is not explicitly permitted in the zoning code Action: Jurisdictions which have not done so will amend their zoning codes to treat transitional and supportive housing types as a residential use subject only to those 12
16 restrictions that apply to other residential uses of the same type in the same zone, and to explicitly permit both transitional and supportive housing types in the zoning code. 12. IMPEDIMENT: Permanent emergency shelter is not permitted by right in at least one appropriate zoning district Action: Jurisdictions which have not done so will amend their zoning codes to permit transitional and supportive housing by right in at least one residential zoning district. 13
17 IV. Background This section presents a summary of the demographic profile, economic, income distribution, and housing characteristics for the County. POPULATION Tables 1 and 2 demonstrate a few notable growth trends in the Bay Area and the County and its cities. The growth rate from 2000 to 2010 increased 10.6 percent according to Census reports in the County as a whole. With projected growth patterns from the Association of Bay Area Governments (ABAG), the population in the County was expected to grow 7.1 percent from 2010 to From 2010 to 2020, the growth percentage rates in Hercules (20.1 percent), Oakley (17.4 percent), Pittsburg (13.8 percent), and Richmond (10.5 percent) exceed the percentage growth for the Bay Area (8.9 percent) as a whole. According to ABAG s latest Projections from 2013, the population in the County is expected to reach 1,085,700 by 2015 and grow to 1,123,500 by Between 2015 and 2020 the County s population is estimated to grow by 3.5 percent. 14
18 Table 1 Current and Projected Population Jurisdiction Bay Area 7,150,739 7,461,400 7,786,800 8,134,000 8,496,800 Urban County Brentwood 51,481 52,700 54,000 55,400 56,800 Clayton 10,897 10,900 11,100 11,400 11,400 Danville 42,039 42,700 43,500 44,400 45,100 El Cerrito 23,549 24,100 24,700 25,300 26,000 Hercules 24,060 26,500 28,900 31,300 34,000 Lafayette 23,893 24,500 25,100 25,700 26,400 Martinez 35,824 36,500 37,100 38,000 38,800 Moraga 16,016 16,400 16,900 17,300 17,800 Oakley 35,432 38,500 41,600 44,700 48,200 Orinda 17,643 18,000 18,400 18,800 19,200 Pinole 18,390 18,900 19,500 20,100 20,700 Pleasant Hill 33,152 33,800 34,400 35,100 35,900 San Pablo 29,139 30,300 31,500 32,800 34,200 San Ramon 72,148 74,400 76,800 79,400 82,300 Unincorporated County 159, , , , ,500 Urban County Subtotal 593, , , , ,300 Entitlement Jurisdictions Antioch 102, , , , ,200 Concord 122, , , , ,000 Pittsburg 63,264 67,600 72,000 76,500 81,300 Richmond 103, , , , ,500 Walnut Creek 64,173 67,000 69,900 72,900 76,100 Contra Costa County Total 1,049,025 1,085,700 1,123,500 1,172,600 1,224,400 Data Source: 2010 Census P1, Association of Bay Area Governments Projections 2013 ( ) 15
19 Table 2 Rate of Change in Current and Projected Population Jurisdiction 2000 to to to 2030 Bay Area 5.4% 8.9% 9.1% Urban County Brentwood 121.0% 4.9% 5.2% Clayton 1.3% 1.9% 2.7% Danville 0.8% 3.5% 3.7% El Cerrito 1.6% 4.9% 5.3% Hercules 23.5% 20.1% 17.7% Lafayette -0.1% 5.0% 5.2% Martinez -0.1% 3.5% 4.6% Moraga -1.7% 5.5% 5.3% Oakley 38.3% 17.4% 15.9% Orinda 0.3% 4.3% 4.4% Pinole -3.4% 6.0% 6.2% Pleasant Hill 1.0% 3.7% 4.4% San Pablo -3.6% 8.1% 8.6% San Ramon 61.3% 6.5% 7.2% Unincorporated County 5.3% 4.0% 4.5% Urban County Total 15.0% 6.1% 6.5% Entitlement Jurisdictions Antioch 13.1% 6.4% 6.7% Concord 0.2% 5.3% 19.8% Pittsburg 11.4% 13.8% 12.9% Richmond 4.5% 10.5% 10.4% Walnut Creek -0.2% 8.9% 8.9% Contra Costa County Total 10.6% 7.1% 9.0% Data Source: 2000 Census, 2010 Census, Association of Bay Area Governments Projections 2013 ( ) 16
20 POPULATION BY AGE Table 3 shows population by age group. Of the jurisdictions in the County, Walnut Creek had the largest share of persons over 65 (27.2 percent), followed by Orinda (20.1 percent) and Moraga (19.6 percent). San Ramon had the largest percentage of persons under the age of 18 (30 percent), followed by Brentwood (29.5 percent) and Oakley (28 percent). The County had a total of 24.1 percent of persons under 18 and 13.4 percent of persons over
21 Table 3 Population by Age Jurisdiction % Under 18 % Over 18 % Age % Over 65 Urban County Brentwood 29.5% 70.5% 55.0% 12.8% Clayton 23.4% 76.6% 56.8% 16.6% Danville 27.3% 72.7% 54.8% 15.8% El Cerrito 16.4% 83.6% 62.8% 18.7% Hercules 22.8% 77.2% 64.0% 10.9% Lafayette 25.5% 74.5% 55.4% 17.6% Martinez 20.2% 79.8% 64.2% 13.1% Moraga 20.6% 79.4% 51.6% 19.6% Oakley 28.0% 72.0% 61.0% 8.2% Orinda 24.7% 75.3% 53.7% 20.1% Pinole 19.6% 80.4% 62.2% 16.7% Pleasant Hill 19.0% 81.0% 64.4% 14.5% San Pablo 26.1% 73.9% 61.3% 9.6% San Ramon 30.0% 70.0% 59.7% 8.5% Unincorporated County 23.6% 76.4% 60.2% 13.8% Urban County Total 24.7% 75.3% 59.5% 13.4% Entitlement Jurisdictions Antioch 26.5% 73.5% 60.3% 9.8% Concord 22.6% 77.4% 62.5% 12.6% Pittsburg 25.4% 74.6% 61.7% 9.6% Richmond 24.3% 75.7% 62.8% 10.8% Walnut Creek 16.6% 83.4% 54.6% 27.2% Contra Costa County Total 24.1% 75.9% 60.1% 13.4% Data Source: ACS 5-Year Estimates (DP05) 18
22 RACE/ETHNICITY Although the County is generally diverse, the particular racial and ethnic composition varies by community. Please see Tables 4 and 5. Of the nineteen cities in the County, there are three with a White population of over 80 percent (Clayton, Danville, and Lafayette), and six with a minority population near or greater than 50 percent (Hercules, Pinole, San Ramon, Antioch, Pittsburg, and Richmond). In a similar fashion, seven communities have a Hispanic or Latino population over 25 percent (Brentwood, Oakley, San Pablo, Antioch, Concord, Pittsburg and Richmond), and six have a Hispanic or Latino population of less than 10 percent (Clayton, Danville, Lafayette, Moraga, Orinda and San Ramon). The communities that are predominantly White tend to be those located in the central portion of the County, in the Interstate Highway 680 corridor. The predominantly minority and Hispanic or Latino communities tend to be in the industrial and agricultural areas of the eastern and western regions of the County. Areas of Minority Concentration Concentration is defined as the existence of racial or ethnic minorities in a Census Tract at a rate of 10 percent or higher than the jurisdiction as a whole. Data on race and ethnicity were examined to determine areas of minority and ethnic concentration from ACS 5-Year Estimates. For the purpose of this analysis, 38 percent of the County s population is non-white. Please see Maps 1 through 5 in Appendix 3. (Please note that Census Tract area boundaries may not be contiguous with current city boundaries.) Of all the entitlement jurisdictions, Walnut Creek does not have any areas of minority (non-white) concentration; therefore, a map was not included. It should be noted that in all areas that show an overall minority concentration, the predominant minority groups are Asians and/or Blacks and African Americans. 19
23 Since the U.S. Census enumerates Hispanic as a distinct ethnic category, this characteristic was examined separately. Census Tract areas where the percentage of total Hispanic population exceeds the countywide percentage by at least 10 percentage points are considered to be areas of Hispanic concentration. The average countywide percentage of Hispanic population is 24.8 percent according to the ACS 5-Year Estimates. Note that of all the entitlement jurisdictions, Walnut Creek does not have any areas of Hispanic concentration; therefore, a map was not included. Please see Maps 6 through 10 in Appendix 3. 20
24 Table 4 Race as Percentage of Total Population Jurisdiction Urban County White Black or African American American Indian Alaskan Native Asian Native Hawaiian Pacific Islander Some other race Two or more races Brentwood 74.5% 5.1% 0.5% 8.3% 0.2% 4.8% 6.7% Clayton 84.0% 2.0% 1.2% 6.9% 0.2% 1.0% 4.6% Danville 83.4% 1.1% 0.2% 11.5% 0.1% 0.4% 3.4% El Cerrito 57.4% 6.7% 0.3% 25.0% 0.2% 3.6% 6.9% Hercules 27.1% 18.0% 0.3% 43.7% 0.5% 2.7% 7.6% Lafayette 84.2% 1.2% 0.0% 9.0% 0.0% 0.6% 4.9% Martinez 79.3% 3.0% 0.8% 7.3% 0.4% 3.6% 5.5% Moraga 75.6% 4.2% 0.1% 14.9% 0.3% 0.6% 4.3% Oakley 67.4% 8.1% 1.5% 8.7% 0.2% 7.6% 6.6% Orinda 79.8% 1.5% 0.6% 10.4% 0.0% 2.0% 5.6% Pinole 50.2% 10.7% 0.8% 23.1% 0.0% 10.7% 3.3% Pleasant Hill 76.6% 1.8% 0.3% 13.5% 0.2% 5.7% 0.5% San Pablo 53.7% 16.1% 0.6% 14.7% 0.3% 3.9% 0.8% San Ramon 49.3% 2.3% 0.3% 40.5% 0.4% 5.5% 0.4% Unincorporated County 68.7% 6.3% 0.3% 12.3% 0.3% 6.4% 5.6% Urban County Total 66.9% 5.6% 0.5% 16.9% 0.3% 4.2% 5.7% Entitlement Jurisdictions Antioch 49.7% 17.9% 0.9% 10.4% 0.8% 12.0% 8.3% Concord 69.5% 4.2% 0.6% 11.0% 0.7% 8.1% 5.8% Pittsburg 36.3% 18.4% 0.4% 16.4% 1.7% 20.4% 6.5% Richmond 41.8% 23.7% 0.4% 14.0% 0.5% 13.9% 5.7% Walnut Creek 79.9% 1.8% 0.3% 13.0% 0.2% 1.3% 3.5% Contra Costa County Total 62.1% 9.0% 0.5% 14.9% 0.5% 7.2% 5.9% Data Source: ACS 5-Year Estimates (DP05) 21
25 Table 5 Hispanic Origin as a Percentage of Total Population Jurisdiction Hispanic or Hispanic or Not Hispanic Not Hispanic Latino # of Latino (%) or Latino or Latino (%) Persons Urban County Brentwood 13, % 40, % Clayton % 10, % Danville 2, % 40, % El Cerrito 2, % 21, % Hercules 3, % 20, % Lafayette 2, % 22, % Martinez 6, % 30, % Moraga 1, % 15, % Oakley 13, % 23, % Orinda 1, % 17, % Pinole 4, % 14, % Pleasant Hill 4, % 28, % San Pablo 16, % 13, % San Ramon 6, % 67, % Unincorporated County 38, % 127, % Urban County Total 117, % 494, % Entitlement Jurisdictions Antioch 35, % 69, % Concord 37, % 87, % Pittsburg 26, % 39, % Richmond 43, % 63, % Walnut Creek 6, % 59, % Contra Costa County Total 267, % 813, % Data Source: ACS 5-Year Estimates (DP05) 22
26 INCOME In this plan, income will be discussed using the terms as defined in Table 6 below. These terms correspond to the income limits published annually by HUD. HUD bases these income categories on the Decennial Census with adjustment factors applied using the annual ACS. Income categories take into consideration family size. The income limit for a family of four is shown for illustration. Table 6 Income Categories Term Percentage AMI 2015 Income Limit (family of 4) Extremely Low Income 30% $27,850 Very Low Income 50% $46,450 Low Income 80% $71,600 Data Source: HUD FY 2015 Income Limits Documentation System, Contra Costa County Table 7 provides a summary of income statistics as reported by the ACS 5-Year Estimates for all jurisdictions within the County except the unincorporated area of the County. The ACS does not provide information for the unincorporated area but does include data for a Census designated place (CDP). A CDP comprises a densely-settled concentration of population that is not within an incorporated place but is locally identified by a name. Contra Costa County has 34 different CDPs. To get a better idea of the incomes for the unincorporated area, Table 8 provides data for each CDP in the unincorporated County. The communities of Contra Costa County have a significant disparity of household income between them. Seven cities and thirteen CDPs have annual median household incomes above $100,000 (Clayton, Danville, Hercules, Lafayette, Moraga, Orinda, San Ramon, Acalanes Ridge, Alamo, Blackhawk, Camino Tassajara, Castle Hill, Diablo, Discovery Bay, Kensington, Norris 23
27 Canyon, Reliez Valley, San Miguel, Saranap and Shell Ridge). None of these communities are CDBG entitlement jurisdictions. Two cities and seven CDPs have annual median household incomes (MHI) near or below $50,000 (San Pablo, Richmond, Bay Point, Bethel Island, Clyde, Mountain View, Pacheco, North Richmond and Rollingwood). Higher income communities in the County tend to be in the central region, and lower income communities are more likely to be in the industrial and agricultural communities of the eastern, northern and western regions. 24
28 Table 7 Income Characteristics for Incorporated Jurisdictions Jurisdiction Median Household Income Per Capita Income Urban County Brentwood $88,697 $33,357 Clayton $131,136 $54,740 Danville $140,616 $65,783 El Cerrito $88,380 $45,190 Hercules $100,267 $37,978 Lafayette $138,073 $67,896 Martinez $85,736 $39,701 Moraga $132,651 $60,576 Oakley $78,597 $27,993 Orinda $166,866 $84,985 Pinole $74,379 $34,219 Pleasant Hill $81,556 $43,580 San Pablo $42,746 $16,874 San Ramon $129,062 $51,569 Entitlement Jurisdictions Antioch $65,770 $25,499 Concord $67,122 $31,404 Pittsburg $60,376 $23,330 Richmond $54,857 $25,769 Walnut Creek $80,399 $51,998 Contra Costa County Total $79,799 $38,770 Data Source: ACS 5-Year Estimates (DP03) 25
29 Table 8 Income Characteristics for Unincorporated Areas Census Designated Place Median Household Per Capita Income Income Acalanes Ridge $160,000 $62,314 Alamo $163,151 $77,281 Alhambra Valley $62,000 $41,738 Bay Point $41,749 $17,385 Bayview $82,431 $29,636 Bethel Island $36,845 $30,388 Blackhawk $167,875 $85,049 Byron $75,673 $29,962 Camino Tassajara $142,371 $64,980 Castle Hill $113,952 $54,105 Clyde $41,382 $27,403 Contra Costa Centre (Waldon) $87,721 $57,385 Crockett $81,667 $42,310 Diablo $167,188 $113,989 Discovery Bay $112,063 $43,649 East Richmond Heights $68,185 $32,733 El Sobrante $60,732 $30,822 Kensington $136,625 $67,369 Knightsen $78,672 $29,127 Montalvin Manor $64,778 $22,652 Mountain View $43,077 $27,903 Norris Canyon $196,726 $59,374 North Gate $96,333 $52,891 North Richmond $35,288 $16,194 Pacheco $48,024 $30,011 Port Costa $94,018 $54,767 Reliez Valley $126,458 $77,832 Rodeo $68,701 $27,318 Rollingwood $48,974 $14,782 San Miguel $136,346 $57,644 Saranap $102,054 $49,107 Shell Ridge $120,163 $54,179 Tara Hills $57,708 $23,890 Vine Hill $62,857 $21,948 Data Source: ACS 5-Year Estimates (DP03) 26
30 Areas of Low- and Very Low-Income Concentration Data on income were examined at the Census Tract level to determine areas of low (80 percent AMI) and very low (50 percent AMI) income concentration. Low income areas are those that have 80 percent or more low income persons. In those communities, the HUD income limits were used to determine low income areas. Please see Maps 11 through 16 in Appendix 3. Very low income areas are those that have 50 percent or more very low income persons or a percentage of very low income persons that exceeds the applicable exception threshold. POVERTY In addition to reporting income, the ACS 5-Year Estimates reports the number of persons and families that have incomes that fall below the federal poverty level. The poverty level is adjusted for family size and composition making it a more relative measure than household income. Persons and families that are below the poverty level are generally very poor. Please see Table 9 for data on persons and families who fall below the poverty line. The table also shows persons under 18 years old who are below the poverty line. The cities of San Pablo, Pittsburg and Richmond are notable for the level of poverty (over 17 percent) as compared to the rest of the County. San Pablo, Antioch, Pittsburg and Richmond are all notable for having a poverty level over 20 percent for persons under the age of 18 years. 27
31 Table 9 Share of Population Below Poverty Jurisdiction Persons (%) Persons Under 18 Years Old (%) Families (%) Urban County Brentwood 6.3% 6.9% 3.7% Clayton 3.9% 6.4% 2.3% Danville 4.2% 4.4% 2.6% El Cerrito 8.2% 5.5% 4.6% Hercules 6.1% 7.6% 4.1% Lafayette 4.7% 2.0% 1.6% Martinez 6.0% 4.9% 5.0% Moraga 4.7% 2.7% 2.4% Oakley 9.4% 7.4% 7.3% Orinda 1.4% 0.7% 0.8% Pinole 8.8% 10.0% 5.7% Pleasant Hill 9.5% 5.3% 4.3% San Pablo 20.7% 24.5% 18.2% San Ramon 3.6% 3.5% 2.8% Unincorporated County 11.2% 16.4% 8.4% Urban County Total 7.9% 8.8% 5.8% Entitlement Jurisdictions Antioch 14.7% 21.0% 10.5% Concord 13.1% 17.9% 9.9% Pittsburg 18.1% 26.9% 14.6% Richmond 17.1% 25.3% 14.6% Walnut Creek 6.0% 6.0% 3.5% Contra Costa County Total 10.7% 13.9% 7.7% Data Source: ACS 5-Year Estimates (S1701, S1702) 28
32 EDUCATION Education level plays a critical role in determining the income level of a household. Table 10 provides a summary of educational attainment for persons aged 25 years and older for the share of the population in the state and in each jurisdiction. Eight cities (Clayton, Danville, Lafayette, Moraga, Orinda, Pleasant Hill, San Ramon and Walnut Creek) reported more than 95 percent of persons aged 25 years and older as having at least a high school diploma. San Pablo (24.4 percent), Pittsburg (11.6 percent) and Richmond (12.9 percent) had the greatest number of persons who reported as having less than a 9 th grade education. For the share of persons having a bachelor s degree or higher, 6 of the 19 jurisdictions in the County (Brentwod, Oakley, San Pablo, Antioch, Pittsburg, and Richmond) were below the State percentage (31 percent). 29
33 Table 10 Education Attainment for Persons Aged 25 Years and Over Jurisdiction Less than 9 th grade (%) 9 th to 12 th grade, no diploma (%) High School Graduate, equivalent Some college, no degree (%) Associate s Degree (%) Bachelor s Degree (%) Graduate Degree (%) California (State) 10.1% 8.4% 20.7% 22.0% 7.8% 19.6% 11.4% Urban County Brentwood 4.9% 5.3% 20.2% 28.1% 12.6% 21.8% 7.3% Clayton 0.4% 0.7% 14.6% 23.1% 10.2% 33.6% 17.3% Danville 0.9% 1.5% 9.0% 17.0% 7.5% 41.0% 23.2% El Cerrito 2.9% 3.6% 11.3% 17.5% 5.7% 29.8% 29.2% Hercules 3.8% 2.6% 14.6% 26.5% 10.3% 32.3% 9.9% Lafayette 0.9% 1.3% 6.2% 12.5% 5.1% 38.2% 35.8% Martinez 2.6% 4.0% 18.2% 28.0% 9.9% 25.5% 11.8% Moraga 0.3% 1.3% 5.6% 12.1% 6.1% 37.6% 36.9% Oakley 7.8% 7.3% 31.3% 29.9% 8.3% 11.7% 3.8% Orinda 0.8% 1.2% 4.8% 11.2% 3.9% 44.0% 34.2% Pinole 5.3% 5.5% 20.0% 25.1% 10.2% 22.2% 11.6% Pleasant Hill 1.6% 2.4% 13.8% 22.2% 8.3% 35.2% 16.4% San Pablo 24.4% 12.9% 24.2% 20.4% 5.6% 9.4% 3.2% San Ramon 1.1% 1.4% 8.7% 15.7% 8.1% 39.5% 25.5% Unincorporated County 5.7% 5.1% 19.8% 21.5% 7.6% 25.4% 14.9% Urban County Total 4.5% 4.0% 16.0% 19.6% 8.1% 28.9% 17.3% Entitlement Jurisdictions Antioch 5.8% 7.2% 28.7% 29.0% 9.1% 15.0% 5.2% Concord 6.2% 6.3% 23.5% 24.3% 8.8% 21.6% 9.4% Pittsburg 11.6% 8.6% 26.3% 26.6% 8.7% 13.1% 5.1% Richmond 12.9% 10.2% 21.4% 22.0% 7.8% 16.4% 9.3% Walnut Creek 0.9% 1.8% 10.5% 17.8% 7.1% 37.0% 24.9% Contra Costa County Total 5.7% 5.3% 18.9% 22.4% 8.2% 25.2% 14.3% Data Source: ACS 5-Year Estimates (S1501) 30
34 EMPLOYMENT Table 11 provides a summary of the civilian labor force for individuals 16 years and over, the percent in the labor force, employment (percent employed), and the unemployment rate for 2014 for all jurisdictions in the County. Data were collected through the and ACS 5-Year Estimates. When comparing the 2009 data to the 2014 data for the County as a whole, the unemployment rate has increased dramatically from 7.2 percent in 2009 to 9.8 percent in 2014 an increase of 36 percent. This increased unemployment rate is the trend for all but two jurisdictions in the County (Hercules and Pleasant Hill). The jurisdiction that had the greatest increase in unemployment rate was Moraga (268 percent increase) going from 2.2 percent in 2009 to 8.1 percent in As shown in Table 12, management, business, science and art occupations represent the largest share of occupations for the Urban County jurisdictions and entitlement jurisdictions, followed by sales and office occupations. People employed in farming, fishing, and forestry make up the smallest share of the workforce. 31
35 Table 11 Employment Statistics Jurisdiction Population 16 years Labor Force (%) Employed (%) Population 16 years Labor Force (%) Employed (%) Unemployed Unemployed and over (%) and over (%) Urban County Brentwood 32, % 60.3% 5.8% 40, % 58.2% 8.8% Clayton 8, % 64.3% 5.0% 9, % 56.7% 9.3% Danville 30, % 60.4% 5.6% 32, % 59.4% 6.4% El Cerrito 18, % 61.1% 6.2% 20, % 60.5% 9.1% Hercules 19, % 67.0% 7.1% 19, % 64.4% 5.7% Lafayette 19, % 60.6% 4.4% 19, % 58.0% 5.9% Martinez 28, % 62.9% 7.1% 30, % 62.4% 8.5% Moraga 13, % 58.6% 2.2% 13, % 49.4% 8.1% Oakley 21, % 62.8% 7.3% 28, % 60.4% 10.7% Orinda 14, % 59.1% 2.7% 14, % 56.9% 4.9% Pinole 14, % 60.8% 5.6% 15, % 57.0% 8.3% Pleasant Hill 26, % 64.0% 7.1% 28, % 59.8% 6.9% San Pablo 22, % 56.5% 10.5% 22, % 55.7% 14.1% San Ramon 36, % 70.8% 5.4% 54, % 67.6% 6.0% Entitlement Jurisdictions Antioch 72, % 59.9% 8.9% 81, % 56.0% 13.4% Concord 95, % 64.2% 6.7% 99, % 60.1% 10.8% Pittsburg 46, % 59.6% 8.2% 50, % 57.3% 13.1% Richmond 78, % 57.8% 11.3% 83, % 58.0% 11.8% Walnut Creek 53, % 55.8% 5.1% 56, % 54.5% 7.1% Contra Costa County Total 788, % 61.0% 7.2% 851, % 58.7% 9.8% Data Source: ACS 5-Year Estimates (S2301) 32
36 Table 12 Occupation Jurisdiction Civilians Management Service Sales and National Production, Farming, Employed Business, Office Resources, Transportation Fisheries, Over 16 Science &Art Construction Material Moving & Forestry Years Old Maintenance Urban County Brentwood 23, % 16.7% 28.2% 11.2% 6.6% 0.7% Clayton 5, % 10.9% 23.2% 2.3% 5.2% 0.0% Danville 19, % 8.2% 23.6% 2.4% 2.5% 0.0% El Cerrito 12, % 13.0% 19.6% 4.2% 3.9% 0.1% Hercules 12, % 13.9% 28.2% 4.1% 7.1% 0.2% Lafayette 11, % 8.6% 18.3% 2.8% 2.9% 0.1% Martinez 18, % 16.0% 25.3% 8.5% 5.5% 0.0% Moraga 6, % 8.6% 20.5% 1.5% 2.2% 0.0% Oakley 17, % 22.1% 26.1% 13.5% 11.3% 1.0% Orinda 8, % 7.1% 18.6% 2.6% 1.8% 0.0% Pinole 8, % 17.2% 26.7% 6.3% 10.2% 0.3% Pleasant Hill 16, % 12.7% 24.5% 6.7% 3.8% 0.0% San Pablo 12, % 28.7% 21.1% 13.8% 15.9% 2.5% San Ramon 36, % 9.1% 20.9% 3.9% 3.5% 0.0% Unincorporated County 72, % 16.7% 23.9% 8.3% 8.3% 0.2% Urban County Total 282, % 14.5% 23.6% 7.2% 6.4% 0.3% Entitlement Jurisdictions Antioch 45, % 21.2% 28.1% 9.7% 11.2% 0.3% Concord 59, % 21.8% 24.3% 9.5% 8.3% 0.2% Pittsburg 29, % 26.0% 26.3% 11.7% 10.0% 0.2% Richmond 48, % 25.1% 20.8% 11.2% 11.2% 0.8% Walnut Creek 30, % 11.7% 21.8% 3.8% 4.2% 0.0% Contra Costa County 499, % 17.5% 23.9% 8.1% 7.6% 0.4% Data Source: ACS 5-Year Estimates (DP03, S2401) 33
37 HOUSEHOLDS The type, size, and composition of a household can affect the type of housing and services that are needed. The following section provides an analysis of the household profiles in the County. Table 13 presents household size, percentage of persons living alone, and percentage of persons over age 65. Oakley had the largest average household size (3.4 persons) of all the jurisdictions, with the second largest household size (3.3 persons) reported in Pittsburg. Based on the ACS 5-Year Estimates, Walnut Creek had the largest share of persons living alone (37.6 percent) and householders over the age of 65 (20.3 percent). 34
38 Table 13 Household Composition 2016 Jurisdiction Avg Household Size (persons) Householder Living Alone (%) Householder Living Alone 65 Years & over (%) Urban County Brentwood % 7.3% Clayton % 7.6% Danville % 10.6% El Cerrito % 10.8% Hercules % 6.3% Lafayette % 8.1% Martinez % 8.0% Moraga % 12.4% Oakley % 5.7% Orinda % 10.8% Pinole % 9.5% Pleasant Hill % 12.2% San Pablo % 6.8% San Ramon % 5.1% Unincorporated County % 8.5% Urban County Total % 8.3% Entitlement Jurisdictions Antioch % 6.1% Concord % 8.8% Pittsburg % 5.8% Richmond % 7.9% Walnut Creek % 20.3% Contra Costa County Total % 9.0% Data Source: ACS 5-Year Estimates (S1101) 35
39 Table 14 presents the number of family households and the share of family households that are married, single parents, and have children under 18 years of age for all jurisdictions in the County. Of the 380,183 households in the County, 269,678 (70.9 percent) were family households. Of the family households, 76 percent were married, 36.4 percent were with children under 18 years old and 24 percent were single parent households. When looking closer at the jurisdictions in the County, Orinda (92.5 percent) and San Ramon (88.3 percent) had the largest share of families that were married; San Ramon (49.4 percent) and Oakley (47.1 percent) had the largest share of households with children under 18 years old; and Richmond (40.6 percent) and San Pablo (39.6 percent) had the largest share of single parents. 36
40 Table 14 Family Household Composition Jurisdiction Family Married (%) W/ Children Single Parent Households under 18yrs old (%) Urban County Brentwood 13, % 46.2% 19.8% Clayton 3, % 33.7% 14.2% Danville 11, % 38.6% 12.2% El Cerrito 6, % 25.2% 20.7% Hercules 6, % 39.7% 23.2% Lafayette 6, % 38.4% 12.2% Martinez 9, % 30.2% 22.8% Moraga 4, % 32.8% 12.8% Oakley 8, % 47.1% 28.8% Orinda 5, % 34.5% 7.5% Pinole 4, % 29.5% 25.5% Pleasant Hill 8, % 27.7% 19.1% San Pablo 6, % 44.8% 39.6% San Ramon 19, % 49.4% 11.7% Unincorporated County 42, % 36.5% 22.5% Urban County Total 157, % 38.6% 19.7% Entitlement Jurisdictions Antioch 25, % 41.3% 30.9% Concord 30, % 34.6% 26.2% Pittsburg 14, % 44.0% 34.4% Richmond 24, % 35.9% 40.6% Walnut Creek 16, % 21.7% 16.7% Contra Costa County Total 269, % 36.4% 24.0% Data Source: ACS 5-Year Estimates (S1101, S2501) 37
41 SPECIAL NEEDS POPULATIONS NON-HOMELESS Certain groups may have more difficulty finding housing and may require specialized services or assistance. Owing to their special circumstances, they are more likely to have extremely low, very low, low, or moderate incomes. These groups include the elderly, frail elderly, persons with disabilities (mental, physical, developmental), persons with alcohol or other drug addiction, victims of domestic violence, large households (i.e. households of five or more who are related), and single-parent headed (female and male) households. Elderly and Frail Elderly The three jurisdictions with the largest share of senior households were Walnut Creek (27.2 percent), Orinda (20.1 percent), and Moraga (19.6 percent). Please see Table 15. San Pablo (48.2 percent) and Pittsburg (49.4 percent) had almost half of their senior population reporting a disability, compared to the total County with 34.1 percent of the senior population reporting a disability. Seniors are among several groups especially adversely impacted by the increase in evictions beginning in 2008 and 2009 that resulted from property owners being foreclosed upon. There is little legal recourse for tenants who are evicted during foreclosure. Seniors are more likely to be on fixed incomes and fall into a low income category, making it more difficult to find new housing that they can afford. 1 1 Bay Area Legal Aid, Contra Costa County, September 17 and 18, 2009; Contra Costa Senior Legal Services, September 17 and 18, 2009; Loaves and Fishes of Contra Costa County, September 17 and 18,
42 Table 15 Senior Households Jurisdiction Senior Population 65 over (%) Senior Households (%) Owner Households (%) Renter Households (%) With a Disability (%) Urban County Brentwood 12.8% 20.9% 24.4% 11.2% 35.8% Clayton 16.6% 27.0% 26.3% 34.0% 19.8% Danville 15.8% 26.0% 25.5% 29.5% 31.3% El Cerrito 18.7% 28.1% 37.2% 14.2% 33.6% Hercules 10.9% 16.8% 17.2% 15.3% 29.3% Lafayette 17.6% 27.7% 34.0% 8.8% 18.2% Martinez 13.1% 19.6% 25.0% 9.0% 25.9% Moraga 19.6% 34.5% 38.8% 15.1% 21.7% Oakley 8.2% 14.1% 13.7% 15.2% 44.9% Orinda 20.1% 33.5% 35.3% 20.0% 25.6% Pinole 16.7% 26.7% 32.0% 12.3% 40.0% Pleasant Hill 14.5% 22.3% 25.4% 18.1% 41.5% San Pablo 9.6% 16.3% 24.2% 10.5% 48.2% San Ramon 8.5% 12.8% 13.8% 10.2% 28.1% Unincorporated County 13.8% 23.1% 28.8% 10.6% 30.0% Urban County Total 13.4% 21.9% 25.7% 12.8% 31.2% Entitlement Jurisdictions Antioch 9.8% 17.1% 21.0% 10.9% 41.4% Concord 12.6% 21.2% 27.4% 12.1% 37.4% Pittsburg 9.6% 16.9% 21.7% 10.5% 49.4% Richmond 10.8% 18.9% 29.7% 8.5% 37.4% Walnut Creek 27.2% 39.0% 48.3% 22.1% 33.4% Contra Costa County Total 13.4% 22.3% 27.4% 12.6% 34.1% Data Source: ACS 5-Year Estimates (DP05, S2501, S1810) 39
43 Persons with Disabilities Table 16 presents data from the ACS 5-Year Estimates for persons with disabilities in the State, in the Urban County (all non entitlement jurisdictions), and in the entitlement jurisdictions. Of the jurisdictions in the County, Pinole (14.3 percent) had the greatest share of the persons with a disability for all persons, followed by Pittsburg (14.1 percent). The smallest share of persons with a disability is in San Ramon (5.0 percent), followed by Lafayette (5.8 percent) and Moraga (6.5 percent). Of the disabled persons in the County, 26.4 percent reported a physical disability that involved hearing and 16.9 percent reported a physical disability that involved vision. Over one-third of the disabled population reported a cognitive disability and over half of the disabled population reported an ambulatory disability. Approximately 36.3 percent of the disabled population over 16 years old in the County was employed. County percentages were generally consistent with the State as a whole. Disabled persons are among several groups especially adversely impacted by the increase in evictions beginning in 2008 and 2009 that resulted from property owners being foreclosed upon. There is little legal recourse for tenants who are evicted as a result of foreclosure. Disabled persons find it more difficult to find housing that can accommodate their needs than nondisabled persons and are more likely to fall into a low income category, making it more difficult to find new housing that meets their needs and that they can afford. 2 2 Bay Area Legal Aid, Contra Costa County, September 17 and 18, 2009; Contra Costa Senior Legal Services, September 17 and 18, 2009; Loaves and Fishes of Contra Costa County, September 17 and 18,
44 Table 16 Disability Status Jurisdiction Number of Disabled (persons) Percent Disabled Persons Disabled Type Hearing (all ages) Disabled Type Vision (all ages) Disabled Type Cognitive (5yrs +) Disabled Type Ambulato ry (5 yrs+) Disabled Type Self-care (5 yrs +) Disabled Type Independ ent living (18 yrs +) California (State) 3,851, % 27.8% 18.8% 38.3% 52.7% 22.0% 39.6% 32.7% Urban County Brentwood 4, % 27.9% 14.7% 32.6% 52.8% 21.8% 40.4% 36.3% Clayton % 37.2% 7.4% 33.8% 36.0% 13.7% 20.4% 47.3% Danville 3, % 38.5% 10.2% 42.5% 43.9% 23.2% 43.0% 57.3% El Cerrito 2, % 35.5% 11.9% 33.7% 55.3% 26.9% 44.0% 36.8% Hercules 1, % 25.3% 16.6% 36.6% 46.3% 22.6% 47.8% 43.2% Lafayette 1, % 33.4% 12.6% 30.9% 49.2% 23.6% 36.9% 43.8% Martinez 3, % 20.8% 19.1% 32.7% 54.6% 19.7% 28.5% 41.1% Moraga 1, % 27.3% 14.7% 30.0% 54.0% 27.7% 38.5% 27.8% Oakley 3, % 30.3% 16.7% 36.0% 56.4% 25.1% 41.7% 32.8% Orinda 1, % 35.7% 12.8% 40.5% 41.3% 24.1% 37.2% 33.6% Pinole 2, % 24.8% 11.7% 49.1% 45.1% 28.6% 50.1% 38.0% Pleasant Hill 4, % 19.5% 18.8% 43.9% 51.9% 22.6% 43.5% 34.7% San Pablo 3, % 24.1% 20.2% 45.9% 48.3% 19.1% 36.3% 31.1% San Ramon 3, % 31.5% 19.2% 32.3% 46.9% 16.5% 32.1% 52.0% Unincorporated County 16, % 27.0% 17.3% 37.3% 48.4% 21.4% 36.1% 36.4% Urban County Total 55, % 27.9% 16.1% 37.6% 49.5% 22.1% 38.4% 38.9% Entitlement Antioch 14, % 21.8% 18.5% 39.7% 51.2% 19.0% 35.3% 29.2% Concord 14, % 28.4% 17.9% 37.4% 51.1% 17.5% 32.6% 42.8% Pittsburg 9, % 19.9% 19.0% 42.6% 53.6% 21.4% 35.0% 31.8% Richmond 11, % 20.4% 15.8% 38.5% 58.4% 23.0% 40.1% 29.8% % of Disabled Population over 16 yrs Employed Walnut Creek 8, % 34.9% 15.7% 28.5% 55.5% 18.7% 37.7% 49.6% County Total 112, % 26.4% 16.9% 37.6% 51.6% 19.4% 37.0% 36.3% Data Source: ACS 5-Year Estimates (S1810, S2301) Note: Survey participants may have reported multiple disabilities, resulting in percentages over 100% for each geographic region 41
45 Large Households Large family households are defined as households of five or more persons who are related. Large family households are considered a special needs group because there is a limited supply of adequately sized housing to accommodate their needs. Table 17 provides data for large households for all jurisdictions in the County. The jurisdictions with the greatest share of large households (households with five or more persons) were Pittsburg (21.5 percent), Oakley (20.4 percent), and Brentwood (18.9 percent). Walnut Creek had the smallest share of large households (3.9 percent) followed by El Cerrito (4.4 percent). As shown in Table 17, housing units with three or more bedrooms make up 82.8 percent of all owneroccupied housing units and 35.3 percent of all renter-occupied housing units. The supply of housing units with three or more bedrooms available for ownership and rental is greater than the number of large owner and rental households. This suggests that there is not a numerical shortage of available housing units to meet the needs of large households. However, lower income large households may be priced out of the larger housing units. Some service providers noted that there has been growth in large households, as households have been adversely financially impacted by job loss and reduction in work hours. Increasingly, multigenerational family members are living together as large households to reduce housing costs. Large households are also among several groups impacted by the increase in evictions during 2008 and 2009 that resulted from property owners being foreclosed upon. There is little legal recourse for tenants who are evicted as a result of foreclosure. Large households find it more difficult to find housing that can accommodate their household size and are more likely to fall into a low income category, making it more difficult to find new housing that meets their needs and that they can afford. 3 3 Bay Area Legal Aid, Contra Costa County, September 17 and 18, 2009; Contra Costa Senior Legal Services, September 17 and 18, 2009; Loaves and Fishes of Contra Costa County, September 17 and 18,
46 Table 17 Large Households Jurisdiction Large Large Owner- Renter- % of Total % of Total Households Households Occupied Occupied Owner- Renter- (estimate) (%) Households Households Occupied Occupied (%) (%) Housing units Housing units w/ 3+ w/ 3+ bedrooms bedrooms Urban County Brentwood 3, % 12.6% 6.3% 81.8% 69.8% Clayton % 8.2% 2.1% 93.8% 52.2% Danville 1, % 7.9% 1.7% 91.7% 55.7% El Cerrito % 2.6% 1.8% 69.1% 20.5% Hercules 1, % 10.2% 4.5% 82.4% 46.5% Lafayette % 6.5% 2.4% 91.2% 29.7% Martinez 1, % 4.8% 2.1% 80.8% 36.6% Moraga % 5.5% 1.2% 88.3% 32.2% Oakley 2, % 15.2% 5.2% 93.1% 60.4% Orinda % 11.6% 1.1% 90.7% 69.6% Pinole % 8.1% 3.0% 88.8% 35.5% Pleasant Hill % 4.0% 1.7% 82.5% 26.9% San Pablo 1, % 8.8% 8.9% 62.3% 20.8% San Ramon 2, % 7.1% 1.8% 89.5% 26.3% Unincorporated County 6, % 7.4% 4.6% 83.3% 39.8% Urban County Total 24, % 7.9% 3.5% 85.1% 37.6% Entitlement Jurisdictions Antioch 5, % 9.1% 8.5% 92.8% 51.4% Concord 4, % 5.1% 5.7% 83.1% 31.3% Pittsburg 4, % 12.2% 9.3% 89.2% 43.9% Richmond 5, % 6.1% 7.9% 69.4% 28.1% Walnut Creek 1, % 2.8% 1.1% 63.8% 16.5% Contra Costa County Total 45, % 7.3% 4.7% 82.8% 35.3% 43
47 Data Source: ACS 5-Year Estimates (B25124, B25042) 44
48 Single-Parent Households Approximately 17.1 percent of the total family households in the County are single femaleheaded households. As shown in Table 18, single female-headed households have a higher poverty rate than family households as a whole in the County. The poverty rate for single maleheaded households was not available through the ACS 5-Year Estimates. Of the entitlement jurisdictions, all but Walnut Creek have a poverty rate for single headedfemale households higher than the countywide rate of 21.5 percent with Richmond the highest at 28.3 percent. When compared to the State, the share of single female-headed households at or below the poverty level in California (27.9 percent) is higher than in the County. Of the entitlement jurisdictions, only Richmond has a higher poverty rate for single female-headed households than the State as a whole. Table 18 Single-Parent Households Jurisdiction Total Families Percent in Poverty Single Male Headed Single Male Headed in Poverty (%) Single Female Headed Single Female Headed in Poverty (%) Antioch 25, % 1,919 n/a 5, % Concord 30, % 2,560 n/a 5, % Pittsburg 14, % 1,500 n/a 3, % Richmond 24, % 2,238 n/a 7, % Walnut Creek 16, % 988 n/a 1, % Contra Costa County Total 269, % 18,724 n/a 46, % California (State) 8,666, % 751,106 n/a 1,719, % Data Source: ACS 5-Year Estimates (S1702) 45
49 HOUSING CHARACTERISTICS The most significant trend in the County housing market, as with many other jurisdictions throughout the State, has been the decrease in single family home sales prices and the corresponding decrease in the value of single family housing. Between 2006 and 2011, the median sale price of a residential home dropped from $566,000 to $241,093. Since then, there has been a steady increase in the median sale price but it has not returned to 2006 levels. The value of owner-occupied homes has followed a similar pattern, in 2009 the median value was $574,000 and in 2014 it was $417,400. Combined with an environment of historically low interest rates, this has reduced the gap between the cost to buy a home and the price which households at the lower end of the range of incomes can afford. Although this affordability gap has been reduced when it comes to home purchase, the combination of instability in the job market, stagnating real wages, and the general tightening of credit has not necessarily made home purchase easier for lower income households. The rental market has seen continued low vacancy rates and rents have been trending upward. The following discussion identifies housing characteristics, trends, and needs for County jurisdictions. Housing Growth Between 2000 and 2014 the number of housing units in the State increased percent. Table 19 displays housing growth in all jurisdictions in the County. Of all the jurisdictions in the County, Brentwood had the largest increase in housing units (131.1 percent). Second to that was San Ramon with an increase of 47.9 percent. Of the entitlement cities, Antioch had the largest increase with 18.5 percent. Tenure Housing tenure refers to whether a unit is owner occupied or renter occupied. Table 20 provides a summary of housing tenure for all jurisdictions in the County. As shown, Clayton had 46
50 the greatest share of owner occupied households and San Pablo had the greatest share of renter occupied housing units. It is important to note that the level of single family foreclosures may have significantly shifted the owner/renter distribution as more families have moved into rental housing since Table 19 Housing Units, Jurisdiction Urban County 2000 Housing Units 2014 Housing Units Percentage Change Brentwood 7,788 18, % Clayton 3,924 4, % Danville 15,130 16, % El Cerrito 10,462 10, % Hercules 6,546 8, % Lafayette 9,334 9, % Martinez 14,597 14, % Moraga 5,760 5, % Oakley 7,946 11, % Orinda 6,744 6, % Pinole 6,828 7, % Pleasant Hill 14,034 14, % San Pablo 9,340 9, % San Ramon 17,552 25, % Unincorporated County 57,609 63, % Urban County Total 193, , % Entitlement Jurisdictions Antioch 30,116 35, % Concord 45,084 47, % Pittsburg 18,300 20, % Richmond 36,044 39, % Walnut Creek 31,425 32, % Contra Costa County Total 354, , % Source: 2000 Census, ACS 5-Year Estimate 47
51 Table 20 Housing Table Jurisdiction Owner-Occupied Renter-Occupied Urban County Brentwood 73.5% 26.5% Clayton 91.4% 8.6% Danville 84.3% 15.7% El Cerrito 60.2% 39.8% Hercules 78.0% 22.0% Lafayette 74.8% 25.2% Martinez 65.5% 34.5% Moraga 81.7% 18.3% Oakley 74.7% 25.3% Orinda 89.2% 10.8% Pinole 73.5% 26.5% Pleasant Hill 57.5% 42.5% San Pablo 42.4% 57.6% San Ramon 68.5% 31.5% Unincorporated County 68.5% 31.5% Urban County Total 70.2% 29.8% Entitlement Jurisdictions Antioch 61.0% 39.0% Concord 59.0% 41.0% Pittsburg 57.5% 42.5% Richmond 49.4% 50.6% Walnut Creek 64.6% 35.4% Contra Costa County Total 65.0% 35.0% Source: ACS 5-Year Estimate, DP04 48
52 Housing Type Table 21 exhibits the percentage of housing units by type as a share of total housing units for all jurisdictions in the County. The table separates the Urban County jurisdictions and entitlement jurisdictions. Demand for owner occupied housing is primarily met through the supply of single family housing, while renter occupied housing demand is primarily met through a combination of singlefamily housing and multi family units. Table 21 Tenure By Units In Structure Jurisdiction Owner-Occupied Renter-Occupied Urban County Single- Family Homes Multi- Family (2-4 units) Multifamily (>5 units) Mobile Homes Boat, RV, Van, etc. Single- Family Homes Multi- Family (2-4 units) Multifamily (>5 units) Mobile Homes Brentwood 98.9% 0.1% 0.2% 0.9% 0.0% 82.2% 6.4% 11.4% 0.1% 0.0% Clayton 98.5% 0.7% 0.0% 0.8% 0.0% 79.2% 5.6% 14.9% 0.0% 0.0% Danville 97.9% 0.9% 1.0% 0.1% 0.0% 80.1% 4.0% 15.9% 0.0% 0.0% El Cerrito 98.0% 1.2% 0.6% 0.1% 0.1% 44.7% 24.0% 31.3% 0.0% 0.0% Hercules 93.9% 2.6% 3.3% 0.2% 0.1% 68.5% 8.9% 22.5% 0.1% 0.1% Lafayette 99.5% 0.3% 0.1% 0.1% 0.0% 47.3% 13.0% 39.7% 0.0% 0.0% Martinez 97.6% 1.4% 0.8% 0.1% 0.0% 60.0% 13.8% 26.2% 0.0% 0.0% Moraga 95.0% 1.5% 3.5% 0.0% 0.0% 42.5% 26.4% 31.1% 0.0% 0.0% Oakley 97.8% 0.1% 0.0% 2.1% 0.0% 74.2% 6.8% 12.2% 6.6% 0.2% Orinda 99.7% 0.1% 0.2% 0.0% 0.0% 86.1% 2.9% 11.0% 0.0% 0.0% Pinole 97.0% 1.5% 1.5% 0.0% 0.0% 52.9% 9.6% 37.5% 0.0% 0.0% Pleasant Hill 96.3% 0.1% 2.3% 0.2% 0.0% 42.2% 14.8% 43.0% 0.0% 0.0% San Pablo 88.0% 3.0% 4.4% 4.2% 0.4% 45.4% 16.9% 36.8% 1.0% 0.0% San Ramon 95.7% 2.0% 2.3% 0.1% 0.0% 37.5% 8.5% 54.0% 0.0% 0.0% Unincorporated 94.6% 0.4% 1.0% 43.9% 0.1% 62.1% 10.0% 24.7% 3.2% 0.1% County Urban County Total 96.3% 1.0% 1.3% 1.4% 0.1% 57.7% 11.4% 29.6% 1.4% 0.1% Entitlement Jurisdictions Antioch 98.2% 0.4% 0.2% 1.1% 0.1% 71.8% 8.9% 18.9% 0.3% 0.1% Concord 91.9% 1.9% 3.9% 2.2% 0.2% 40.6% 12.6% 45.0% 1.6% 0.1% Pittsburg 96.5% 0.1% 0.4% 3.0% 0.1% 62.2% 14.6% 22.0% 1.2% 0.0% Richmond 95.2% 2.0% 1.9% 0.8% 0.1% 47.8% 26.9% 25.0% 0.2% 0.1% Walnut Creek 82.0% 6.6% 11.3% 0.1% 0.0% 28.7% 13.0% 43.6% 0.2% 0.3% Contra Costa County Total 95.1% 1.4% 2.1% 1.4% 0.1% 54.1% 14.0% 30.8% 1.0% 0.1% Boat, RV, Van, etc. Source: ACS 5-Year Estimate B
53 Vacancy Rate Vacancy trends in housing are analyzed using a vacancy rate which establishes the relationship between housing supply and demand. For example, if the demand for housing is greater than the available supply, then the vacancy rate is low and the price of housing will most likely increase. Additionally, the vacancy rate indicates whether or not the community has an adequate housing supply to provide choice and mobility. HUD standards indicate that a vacancy rate of 5 percent is sufficient to provide choice and mobility. Table 22 provides the total number of vacant housing units as well as the percentage of vacant housing units in 2014 for all of the jurisdictions in the County, separating out the Urban County jurisdictions and the entitlement jurisdictions. Please note the State Department of Finance (DOF) estimate is for all housing unit types and does not exclude seasonal, recreational, or occasional use and all other vacant units. The DOF also does not provide vacancy by tenure. To provide vacancy by reason for vacancy, 2010 Census data was used (see Table 23). Overall, the 2014 data (Table 22) indicate that the County has a very low vacancy rate. All but three of the communities in the Urban County have vacancy rates below 5 percent, which is extremely low. Historical data from the 2010 Census (Table 23) indicate that in eight communities (El Cerrito, Pinole, Pleasant Hill, San Pablo, Antioch, Concord, Pittsburg, and Richmond) the share of vacant units that are for rent is above the overall County total (36.3 percent). 50
54 Table 22 Vacancy Status, 2014 Jurisdiction Urban County Total Vacant Housing Units % of Total Housing Units Vacant Brentwood % Clayton % Danville % El Cerrito % Hercules % Lafayette % Martinez % Moraga % Oakley % Orinda % Pinole % Pleasant Hill % San Pablo % San Ramon % Unincorporated County 4, % Urban County Total 10, % Entitlement Jurisdictions Antioch 2, % Concord 2, % Pittsburg 1, % Richmond 3, % Walnut Creek 2, % Contra Costa County Total 23, % Source: ACS 5-Year Estimates B
55 Table 23 Vacancy Status, 2010 Jurisdiction Urban County Total Vacant Housing Units % of Total Housing Units Vacant % of Total Vacant Units That Are for Rent % of Total Vacant Units That Are for Sale % of Total Vacant Units that Are Rented/Sold, Not Occupied % of Total Vacant Units that Are Vacant for Other Reasons Brentwood 1, % 24.6% 34.1% 5.3% 30.2% Clayton % 18.8% 31.3% 4.7% 26.3% Danville % 26.3% 20.6% 15.0% 21.0% El Cerrito % 40.1% 11.8% 7.8% 31.7% Hercules % 25.1% 34.7% 7.3% 25.1% Lafayette % 32.5% 12.9% 8.9% 30.8% Martinez % 35.1% 20.0% 5.2% 32.9% Moraga % 20.7% 18.5% 8.2% 38.0% Oakley % 19.9% 38.6% 8.5% 26.9% Orinda % 12.0% 27.5% 8.4% 30.7% Pinole % 43.9% 19.1% 7.3% 26.1% Pleasant Hill % 46.0% 18.1% 6.0% 23.3% San Pablo % 52.0% 16.5% 4.6% 23.5% San Ramon % 32.1% 26.0% 13.3% 19.6% Unincorporated 4, % 27.8% 19.9% 6.0% 46.3% County Urban County Total 12, % 31.0% 22.6% 7.3% 39.1% Entitlement Jurisdictions Antioch 2, % 39.5% 22.3% 6.4% 28.5% Concord 2, % 45.7% 18.8% 5.8% 24.4% Pittsburg 1, % 36.8% 28.4% 5.4% 25.6% Richmond 3, % 47.7% 14.8% 4.5% 29.1% Walnut Creek 2, % 33.0% 22.8% 8.4% 19.3% Contra Costa County Total 24, % 36.3% 21.3% 6.6% 26.1% Source: 2010 US Census Vacant Housing Units 52
56 Age of Housing Stock Table 24 displays the share of housing units constructed by age and tenure for the State and for all jurisdictions in the County. With the exception of El Cerrito, Lafayette and Orinda, most of the housing in each jurisdiction was built after Table 24 Age Of Housing By Tenure Jurisdiction 1939 or earlier 1940 to to to or later Total Renter Owner Total Renter Owner Total Renter Owner Total Renter Owner Total Renter Owner State of California 9.3% 4.9% 4.4% 20.4% 8.6% 11.8% 31.8% 15.5% 16.3% 26.0% 11.3% 14.7% 12.5% 4.9% 7.6% Urban County Brentwood 0.9% 0.4% 0.5% 2.0% 0.7% 1.3% 6.3% 2.4% 3.9% 36.5% 10.2% 26.3% 54.3% 12.8% 41.5% Clayton 0.2% 0.0% 0.3% 3.5% 0.3% 3.2% 41.5% 2.8% 38.7% 48.0% 4.6% 43.4% 6.7% 0.8% 5.9% Danville 0.6% 0.1% 0.5% 8.9% 1.3% 7.6% 46.3% 6.1% 40.2% 38.0% 6.4% 31.6% 6.2% 1.8% 4.4% El Cerrito 12.8% 2.9% 9.9% 51.7% 15.5% 36.2% 25.3% 14.7% 10.6% 7.6% 4.6% 3.0% 2.7% 2.2% 0.5% Hercules 0.5% 0.0% 0.5% 1.7% 0.2% 1.5% 18.3% 4.4% 13.9% 56.9% 12.9% 44.0% 22.5% 4.6% 17.9% Lafayette 3.4% 0.4% 3.0% 46.7% 8.6% 38.1% 36.9% 11.9% 25.0% 10.0% 3.5% 6.5% 3.1% 0.8% 2.3% Martinez 10.7% 4.4% 6.3% 13.5% 6.3% 7.2% 40.0% 12.1% 27.9% 32.2% 10.7% 21.5% 3.8% 1.1% 2.7% Moraga 1.0% 0.1% 0.9% 7.0% 1.0% 6.0% 75.0% 12.5% 62.5% 15.1% 3.9% 11.2% 1.7% 0.7% 1.0% Oakley 1.5% 0.8% 0.7% 3.1% 1.0% 2.1% 14.9% 5.3% 9.6% 50.4% 10.5% 39.9% 30.2% 7.8% 22.4% Orinda 5.7% 0.7% 5.0% 49.2% 3.8% 45.4% 26.1% 2.4% 23.7% 13.5% 3.1% 10.4% 5.5% 0.9% 4.6% Pinole 4.3% 2.1% 2.2% 18.7% 4.7% 14.0% 42.8% 9.2% 33.6% 29.8% 8.3% 21.5% 4.4% 2.3% 2.1% Pleasant Hill 0.6% 0.3% 0.3% 28.9% 5.5% 23.4% 35.0% 19.1% 15.9% 31.0% 15.0% 16.0% 4.5% 2.7% 1.8% San Pablo 6.1% 3.0% 3.1% 36.0% 18.5% 17.5% 26.8% 19.1% 7.7% 22.0% 13.2% 8.8% 9.3% 3.8% 5.5% San Ramon 0.5% 0.2% 0.3% 0.9% 0.3% 0.6% 25.5% 5.3% 20.2% 37.5% 14.0% 23.5% 35.6% 11.6% 24.0% Unincorporated County 6.6% 2.4% 4.2% 26.2% 7.6% 18.6% 25.6% 7.6% 18.0% 30.9% 10.2% 20.7% 10.8% 3.7% 7.1% Urban County Total 4.1% 1.4% 2.7% 19.1% 5.2% 13.9% 29.0% 8.5% 20.5% 31.7% 9.8% 21.9% 16.0% 4.8% 11.2% Entitlement Jurisdictions Antioch 3.4% 2.3% 1.1% 12.9% 6.7% 6.2% 26.6% 10.3% 16.3% 39.5% 13.9% 25.6% 17.6% 5.7% 11.9% Concord 1.5% 0.7% 0.8% 25.2% 7.3% 17.9% 50.0% 21.1% 28.9% 18.3% 9.9% 8.4% 4.9% 2.0% 2.9% Pittsburg 3.2% 1.1% 2.1% 13.9% 6.4% 7.5% 31.1% 12.0% 19.1% 30.5% 13.9% 16.6% 21.3% 9.1% 12.2% Richmond 11.5% 5.8% 5.7% 34.8% 14.5% 20.3% 23.3% 14.1% 9.2% 20.1% 10.4% 9.7% 10.2% 5.7% 4.5% Walnut Creek 1.4% 0.5% 0.9% 14.6% 4.1% 10.5% 58.7% 20.3% 38.4% 19.8% 8.2% 11.6% 5.5% 2.3% 3.2% Contra Costa County Total 4.5% 1.7% 2.5% 20.3% 6.5% 13.8% 33.3% 11.9% 21.4% 28.6% 10.3% 18.3% 13.7% 4.6% 9.1% Source: ACS 5-Year Estimates B
57 Housing Cost Table 25 provides a summary of home sales prices for all jurisdictions. The County has experienced an increase in the median sales price for homes over the last year. The two exceptions are Clayton and Orinda, which have both seen a year to year decrease in median sales price. It is important to note that as a measure of central tendency, median sales price is sensitive to sales volume in market sub sectors as much as it is to overall price trends. An increase in the volume of sales of higher priced homes relative to overall sales volume can lead to an increase in median sales price even though overall prices remain low. As of March 2016, San Pablo had the lowest median sales price ($314,000) and Lafayette the highest ($1,370,750). Table 26 presents the average rent in the region. According to ACS 5-Year Estimates, average rental rates in San Ramon are the most expensive at $1,678, followed by Lafayette at $1,598 and Pleasant Hill at $1,448. The most expensive rents occur in the central portion of the County. HUD publishes annual Fair Market Rents (FMR), which include an estimated utility cost, and the annual income required to afford them. Table 27 shows the Fair Market Rents for 2015 for the County. 54
58 Table 25 Median Home Sale Listings Jurisdiction Urban County Three Month Median Sales Price (Dec 2015 Mar 2016) Year-to-Year Change (March 2015 March 2016) Dollars Percentage Number of Homes for Sale (February 2016) Brentwood $490,000 $11,000 2% 164 Clayton $575,000 -$88,250-13% 32 Danville $1,100,000 $130,000 13% 154 El Cerrito $750,000 $102,000 16% 50 Hercules $485,000 $60,000 14% 65 Lafayette $1,370,750 $ % 58 Martinez $499,500 $29,500 6% 113 Moraga $1,050,000 $120,000 13% 24 Oakley $385,000 $35,000 10% 125 Orinda $1,180,000 -$49,000-4% 33 Pinole $430,000 $60,000 16% 46 Pleasant Hill $621,000 $87,000 16% 99 San Pablo $314,000 $34,000 12% 66 San Ramon $832,500 $39,250 5% 177 Entitlement Jurisdictions Antioch $348,500 $47,000 16% 343 Concord $440,000 $20,000 5% 355 Pittsburg $345,000 $50,000 17% 122 Richmond $367,750 $44,000 14% 277 Walnut Creek $682,500 $71,500 12% 241 Source: Trulia.com, Accessed March 17,
59 Table 26 Median Rental Listings Jurisdiction Median Rent East Antioch $1,213 Bay Point $1,047 Pittsburg $1,197 Central Concord $1,218 Lafayette $1,598 Martinez $1,345 Pleasant Hill $1,448 San Ramon $1,678 Walnut Creek $1,442 West El Cerrito $1,380 El Sobrante $1,152 Pinole $1,292 Richmond $1,099 San Pablo $989 Contra Costa County $1,289 Table 27 Fair Market Rents (Fmr), 2014 Unit Size FMR Annual Income to Afford Studio $1,039 $41,560 1-bedroom $1,260 $50,400 2-bedroom $1,585 $63,400 3-bedoom $2,213 $88,520 4-bedroom $2,716 $108,640 Source: U.S. Dept. Housing and Urban Development, 2015 FMR; 56
60 Housing Affordability by Tenure and Household Type The assessment of the County s housing needs relies on custom tabulations of U.S. ACS by HUD. These tabulations are referred to as the CHAS tables obtained using HUD s State of the Cities Data System (SOCDS). These data are presented in two main tables, one presenting housing problems by households and the other presenting affordability mismatch by housing units. Tables 28 and 29 provide a summary, and the full tables can be found in Appendix 4. The needs of renter and owner households are examined separately. The CHAS housing problems table presents the number of households paying more than 30 percent and 50 percent of gross income for housing by tenure, household type, and income category. This cost of housing as a percentage of gross income is referred to as the housing cost burden. According to HUD, a household which has a housing cost burden over 30 percent has a high housing cost burden. Those with a cost burden over 50 percent have a severe cost burden. Overpayment is a concern for low income households since they may be forced to live in overcrowded situations or cut other necessary expenditures, such as health care, in order to afford housing. The HUD definition of housing cost includes not only monthly rent and mortgage payments but an estimate of utilities. Renter Households Household Type Overall, approximately 45 percent of renter households in the County have a high cost burden. Less than 25 percent have a severe cost burden. This is roughly consistent in all jurisdictions. Elderly one and two person renter households tend to experience a higher degree of high cost burden (56.3 percent) and severe cost burden (27.6 percent) countywide. Concord has the highest degree of cost burdened elderly renters with a high cost burden of 70.1 percent and 57
61 severe cost burden of 38.1 percent. Both Walnut Creek and Richmond have a lower number experiencing severe cost burden (24.6 percent and 24.4 percent, respectively). Large renter households (five or more persons) experience cost burdens at a higher rate than all renter households, with 51.5 percent of large families facing a high cost burden and 28.9 percent with severe cost burden. Income Groups Low income renter households in the County (>50 to 80 percent area median income [AMI]) experience a high cost burden at a rate of 57.4 percent. The severe cost burden is significantly lower (11.2 percent). Comparatively, 71.7 percent of very low income (>30 percent to 50 percent AMI) and 69.4 percent of extremely low income renter households ( 30 percent AMI) have a high cost burden. 40 percent of the very low-income population is severely cost burdened, and percent of the extremely low-income population that is severely cost burdened (59.7 percent) is nearly three times the rate of all renters countywide. The rate of high cost burden for renter households with incomes above low income (>80 percent AMI) is 16 percent. Cost burden rates among the income groups in Concord tend to be slightly better than the County as a whole. The three populations in which Concord does not have better rates are Very Low-Income High Cost Burden, Very Low-Income Severe Cost Burden, and Extremely Low- Income High Cost Burden. In these groups, however, the variation from the County is very small and within a margin of error. Antioch is similar to the County as a whole with the exception of a higher rate of high cost burden for very low income (76.1 percent). Pittsburg is very close to the County as a whole, except for one segment in which Pittsburg has a significantly lower cost burden. The rate of Very Low-Income households who are severely cost burdened is 33 percent, approximately 7 percent lower than the County as a whole. 58
62 Richmond has much lower rates of cost burden for lower income renter households across all income categories except in the category of extremely low-income: 57.6 percent high cost burden and 27.4 percent severe cost burden for very low income; 49.3 percent high and 4.2 percent severe for low income. Out of the eight cost burden and income categories Richmond has the lowest rate in five of them. Although the cost burden for extremely low income households is consistently high across the County as a whole, Walnut Creek stands out with a rate of 74 percent high cost burden and 64 percent severe cost burden for extremely low-income households. It is also higher for cost burden rates in the categories of very low income households (77.5 percent high, 48.3 percent severe) and low income households (70.8 percent and 12.8 percent). Out of the eight cost burden and income categories, Walnut Creek has the highest cost burden in seven of them as compared to the other jurisdictions and the County as a whole. Owner Households Household Type Over one third (38.5 percent) of owner households in the County have a high cost burden. Approximately 15 percent have a severe cost burden. This is generally consistent across all jurisdictions. Elderly one and two person owner households tend to experience a slightly lower degree of cost burden (28.7 percent high and 12.9 percent severe) countywide. At the County level, large owner households (five or more persons) and small related households (two to four persons) experience a cost burden at a slightly higher rate compared to all owner households. Concord has a lower rate of severe cost burden for large owner households (10.2 percent) than other jurisdictions. 59
63 Income Groups Low income owner households (>50 to 80 percent AMI) experience a high cost burden at a higher rate (55.9 percent) than do all households countywide. The severe cost burden is twice as high for low income owners (31.6 percent) as for all owners. Very low income owners (>30 percent to 50 percent AMI) experience high and severe cost burdens much higher than the general population (61.2 percent and 42.5 percent). Extremely low income households ( 30 percent AMI) are even more cost burdened (75.1 percent high, 63.6 percent severe). The rate of cost burden for owner households with incomes above low income (>80 percent AMI) is lower than the overall population (30.6 percent high, 6.8 percent severe). The cost burdened population in Antioch is similar to the County as a whole. The one stand out is Antioch has a noticeably higher rate of severe cost burden among extremely low-income homeowners (72.8 percent). Concord has a pattern similar to the County as a whole with the exception of extremely lowincome households having a lower rate of severe cost burden (55.1 percent). Pittsburg is also very similar to the County as a whole but it has a higher rate of high cost burden for very low-income households (72.5 percent). Richmond has a generally lower rate of cost burden for owner households, particularly lowincome severe cost burden (16.6 percent). Walnut Creek has lower rates of cost burden for above low-income and low-income households than the County as a whole, but it has higher rates of cost burden for very low-income and extremely low-income households. 60
64 Table 28 Cost Burden Summary, Renters Jurisdiction All Renters Elderly Large Above Low- Income Low-Income Very Low- Income Extremely Low- Income High Severe High Severe High Severe High Severe High Severe High Severe High Severe Antioch 52.2% 28.6% 50.5% 30.9% 56.4% 25.6% 15.7% 0.0% 56.0% 7.8% 76.1% 41.4% 70.0% 59.5% Concord 44.8% 23.6% 70.1% 38.1% 58.2% 26.2% 11.5% 0.9% 51.1% 3.3% 72.0% 42.8% 70.0% 59.1% Pittsburg 48.8% 26.0% 56.8% 35.1% 66.3% 46.0% 15.5% 0.0% 56.1% 11.5% 68.7% 33.3% 66.8% 55.8% Richmond 44.1% 24.3% 40.8% 24.6% 53.7% 27.0% 9.3% 0.0% 49.3% 4.2% 57.6% 27.4% 68.9% 59.0% Walnut Creek 40.1% 18.7% 48.8% 24.4% 36.8% 15.8% 14.1% 1.0% 70.8% 12.8% 77.5% 48.3% 74.0% 64.0% Countywide 45.3% 23.5% 56.3% 27.6% 51.5% 28.9% 16.2% 0.9% 57.4% 11.2% 71.7% 40.0% 69.4% 59.7% Table 29 Cost Burden Summary, Owners Jurisdiction All Owners Elderly Large Above Low- Income Low-Income Very Low- Income Extremely Low- Income High Severe High Severe High Severe High Severe High Severe High Severe High Severe Antioch 43.2% 16.6% 25.9% 14.6% 54.4% 24.9% 34.2% 4.4% 59.4% 28.3% 58.0% 44.5% 78.7% 72.8% Concord 38.8% 14.8% 26.8% 11.9% 40.2% 10.2% 30.2% 5.9% 58.1% 29.4% 56.0% 38.0% 74.7% 55.1% Pittsburg 44.8% 18.4% 37.4% 19.9% 49.1% 23.7% 31.6% 3.7% 59.3% 30.6% 72.5% 42.5% 74.4% 66.7% Richmond 37.7% 15.8% 17.9% 11.3% 45.5% 22.2% 29.2% 6.8% 46.7% 16.6% 56.7% 45.5% 65.9% 50.2% Walnut Creek 34.6% 16.4% 26.7% 12.4% 34.5% 19.7% 24.3% 6.7% 49.5% 23.0% 73.3% 47.9% 81.2% 75.8% Countywide 38.5% 15.7% 28.7% 12.9% 46.9% 18.9% 30.6% 6.8% 55.9% 31.6% 61.2% 42.5% 75.1% 63.6% 61
65 Overcrowding Table 30 illustrates the share of households by person per room for owners and renters in the state and entitlement cities. Households with more than 1 person per room are considered overcrowded. Households with more than 1.5 persons per room are considered severely overcrowded. As shown in Table 30, renter occupied households have a higher incidence of overcrowding than owner occupied households. In both categories (owner and renter), Walnut Creek has the smallest share of overcrowded households. Table 30 Persons Per Room Jurisdiction <1.0 persons Owner Occupied 1.01 to 1.5 persons >1.5 persons <1.0 persons Renter Occupied 1.01 to 1.5 persons >1.5 persons State of California 95.9% 3.1% 1.0% 86.7% 8.2% 5.0% Contra Costa County (countywide) 98.0% 1.6% 0.4% 90.9% 6.9% 2.2% Antioch 97.7% 1.7% 0.6% 90.6% 7.5% 1.9% Concord 98.5% 1.2% 0.3% 87.7% 10.7% 1.6% Pittsburg 94.7% 5.0% 0.3% 87.0% 10.3% 2.7% Richmond 96.1% 2.6% 1.3% 85.6% 10.2% 0.5% Walnut Creek 99.6% 0.4% 0.0% 96.5% 2.0% 1.5% Source: ACS 5-Year Estimates S2501 Foreclosures Foreclosure is a term used to describe the procedure followed in enforcing a creditor s rights when a debt secured by any lien on property is in default. The Contra Costa County Recorder keeps an inventory of notices of defaults, notices of trustee sales, and trustee s deed upon sale (see definitions of each below). Table 31 provides the number of homes with each status for the entire year. Please note that one housing unit may be counted more than once per year. Notice of Default: A written document that gives constructive notice of a trustor s failure to perform his or her obligation under a deed of trust. This document must be recorded. 62
66 Notice of Trustee s Sale: A written document that sets forth the day, date, and time of the trustee s sale and describes the property to be sold. This document is prepared by the trustee and must be recorded with the County Recorder in the county in which the property is located at least 14 days prior to the scheduled sale date. Trustee s Deed Upon Sale: A written document which is prepared and signed by the trustee when the secured property is sold at a trustee s sale. This document transfers ownership to the successful bidder at the sale and must be recorded with the County Recorder in the county in which the property is located. Table 31 Foreclosure Activity Year Total Notices of Defaults Total Notices of Trustee Sales Total Trustee s Deed Upon Sale ,959 1, ,351 1, ,077 3,070 1, ,842 7,518 3, ,021 10,935 6, ,226 13,496 7, ,323 14,623 8, ,714 14,932 11, ,837 6,666 4, ,380 1, , , ,713 1, ,815 1, , ,207 1, One of the most significant increases in demand for a range of services has come as a result of low income tenants being evicted from their homes because the property owner has been foreclosed upon. Most often the tenants are unaware that the foreclosure is under way and find themselves without housing. Due to the costs of moving, security deposit requirements, 63
67 and the rent qualification process, they find it difficult or impossible to find new housing, particularly if they have experienced a job loss and have little or no income to qualify for a new rental and little in the way of savings. Seniors, disabled persons, and large families are especially adversely impacted when evicted. There is little legal recourse for tenants who are evicted as a result of foreclosures. 4 4 Bay Area Legal Aid, Contra Costa County, September 17 and 18, 2009; Contra Costa Senior Legal Services, September 17 and 18, 2009; Loaves and Fishes of Contra Costa County, September 17 and 18,
68 V. Mortgage Lending (Home Mortgage Disclosure Act Data) Lending Practices An analysis of lending practices is possible through an examination of data gathered from lending institutions in compliance with the Home Mortgage Disclosure Act (HMDA). The HMDA was enacted by Congress in 1975 and is implemented by the Federal Reserve Board as Regulation C. The intent of the Act is to provide the public with information related to financial institution lending practices and to aid public officials in targeting public capital investments to attract additional private sector investments. Since enactment of the HMDA in 1975, lending institutions have been required to collect and publicly disclose data regarding applicants including: location of the loan (by Census Tract, County, and Metropolitan Statistical Area (MSA)); income, race and gender of the borrower; the number and dollar amount of each loan; property type; loan type; loan purpose; whether the property is owner occupied; action taken for each application; and, if the application was denied, the reason(s) for denial. Property types examined include one to four family units, manufactured housing and multi family developments. HMDA data is a useful tool in accessing lending practices and trends within a jurisdiction. While many financial institutions are required to report loan activities, it is important to note that not all institutions are required to participate. Depository lending institutions banks, credit unions, and savings associations must file under HMDA if they hold assets exceeding the coverage threshold set annually by the Federal Reserve Board, have a home or branch office in one or more MSAs, and originated at least one home purchase or refinancing loan on a one to four family dwelling in the preceding calendar year. Such institutions must also file if they meet any one of the following three conditions: is a federally insured or regulated institution; originates a mortgage loan that is insured, guaranteed, or supplemented by a federal agency; or originates a loan intended for sale to Fannie Mae or Freddie Mac. Forprofit, non depository institutions (such as mortgage companies) must file HMDA data if: 65
69 their value of home purchase or refinancing loans exceeds 10 percent or more of their total loan originations or equals or exceeds $25 million; they either maintain a home or branch office in one or more MSAs or in a given year execute five or more home purchase, home refinancing, or home improvement loan applications, originations, or loan purchases for properties located in MSAs; or they hold assets exceeding $10 million or have executed more than 100 home purchase or refinancing loan originations in the preceding calendar year. It is recommended that the analysis of HMDA data be tempered by the knowledge that no one characteristic operates in isolation, but must be considered in light of other factors. For instance, while it is possible to develop conclusions simply on the basis of race data, it is more accurate when all possible factors are considered, particularly in relation to loan denials and loan pricing. According to the Federal Financial Institutions Examination Council (FFIEC), with few exceptions, controlling for borrower related factors reduces the differences among racial and ethnic groups. Borrower related factors include income, loan amount, lender, and other relevant information included in the HMDA data. Further, the FFIEC cautions that the information in the HMDA data, even when controlled for borrower related factors and the lender, is insufficient to account fully for racial or ethnic differences in the incidence of higher priced lending. The FFIEC suggests that a more thorough analysis of the differences may require additional details from sources other than HMDA about factors including the specific credit circumstances of each borrower, the specific loan products that they are seeking, and the business practices of the institutions that they approach for credit. The following analysis is provided for the County, summarizing 2014 HMDA data (the most recent year for which data are available), and data between 2007 and 2014 where applicable. Where specific details are included in the HMDA records, a summary is provided below for loan denials including information regarding the purpose of the loan application, race of the applicant and the primary reason for denial. For the purposes of analysis, this report will focus only on the information available and will not make assumptions regarding data that is not available or was not provided as part of the mortgage application or in the HMDA 66
70 reporting process County Overview In 2014, there were just over 55,000 applications for loans to purchase, refinance or make improvements to single family homes in Contra Costa County. Of those applications, over 30,500 or 55 percent were approved and originated. Of the remaining 24,500 applications, approximately 7,750 or 14 percent of all applications were denied for reasons identified below. It is important to note that financial institutions are not required to report reasons for loan denials, although many do so voluntarily. Also, while many loan applications are denied for more than one reason, this analysis refers to the primary reason for the denial of each loan. The balance of the 16,750 applications that were neither originated nor denied were closed for one reason or another including, a) the loan was approved but not accepted by the borrower, b) the application was closed because of incomplete information or inactivity by the borrower, or c) in many instances the application may have been withdrawn by the applicant. 67
71 Table 32 Disposition Of Application By Loan Type And Purpose, 2014 Single Family Homes (Excluding Manufactured Homes) Total Applications Loans Originated Loans Approved but not accepted Applications Denied Applications Withdrawn Files Closed for Incompleteness Source: 2014 HMDA Loan Type Home Purchase Refinance Home Improvement Conventional 14,609 28,891 2,458 FHA 4,508 1, VA 1,132 1, FSA/RHS Conventional 9,340 15, FHA 2, VA FSA/RHS Conventional FHA VA FSA/RHS Conventional 1,298 4, FHA VA FSA/RHS Conventional 1,266 3, FHA VA FSA/RHS Conventional 267 1, FHA VA FSA/RHS
72 Of the home purchase loans for single-family homes that were originated in 2014, (12,377 loans originated or just over 40 percent of the County s total) approximately 75 percent of these originations were provided by conventional lenders. The remaining 25 percent were provided by federally-backed sources including the Federal Housing Administration (FHA), Department of Veterans Affairs (VA) and Farm Service Agency/Rural Housing Service (FSA/RHS). The VA and RHS lenders had an application/approval ratio of 52 percent and 31 percent respectively. Conventional lenders originated home purchase loans at a rate of 57 percent of all applications while 48 percent of the FHA home purchase loan applications resulted in origination. A further examination of the 7,755 denials indicates that just over 5,200 or 68 percent of all denials were for applicants seeking to refinance existing mortgages for owner-occupied, primary residences. The number one reason for denial of refinance applications was debt-toincome ratio (29 percent of refinance denials) followed by credit history (21 percent of refinance denials). Typically, homeowners seeking to refinance their existing home mortgage are able to use their home as collateral. When the denial reason given for a refinance is a lack of collateral, this would indicate the home is worth less than the existing mortgage and therefore refinancing is not an option these homes are commonly referred to as underwater or the borrowers are upside-down in their mortgage. Home Purchase Applications and Race and Ethnicity The denial rate for traditional home purchase loans for one to four family housing in the County varies significantly among Whites, Blacks, and Hispanics. In 2014, Blacks were more than twice as likely to be denied for conventional single-family home purchases as Whites, with respective denial rates of 18 percent and 8 percent. Hispanics and Asians were denied at a rate that falls between the other two groups, at 14 percent and 11 percent, respectively. Additionally, a closer look at home purchase denial rates by race/ethnicity and income group within the County, shown below, demonstrates that high-income Blacks (having greater than 69
73 120 percent of AMI) were more likely to be denied for a single-family home purchase, at 15 percent, than low-income Whites (having 80 percent or less of AMI), at 12 percent. Low-income Hispanics were denied at a rate of 17 percent, slightly higher than high-income Blacks. Additionally, high-income Hispanics and high-income Asians were denied at rates slightly below low-income Whites, at 10 percent. White applicants demonstrated the lowest disparity in denial rates between their low- and high-income applicants at 5 percent, compared to 7 percent for Blacks and Hispanics. GRAPHIC 1 SINGLE FAMILY HOME PURCHASE DENIAL RATE, % Low-Income 22% High-Income Denial Rate 20% 15% 10% 12% 7% 15% 16% 10% 17% 10% 5% 0% White Black or African Asian American Race/Ethnicity Hispanic or Latino Upon a review of denial reasons for federally supported loan products, the most common reason for Black and Hispanic denials was credit history, at respective rates of 36 percent and 28 percent, while the top denial reason for Whites and Asians was debt-to-income ratio, at respective rates of 35 percent and 43 percent. Reviewing the denial reasons provided by conventional lenders shows that as of 2014 the top denial reason for Whites, Blacks, and Asians was debt-to-income ratio while for Hispanics it was credit history. 70
74 Table 33 Home Purchase (Single Family - Owner Occupied) Denials By Race, Ethnicity, And By Reason Primary Reason for Denial Percentage of Conventional Loan Denials Percentage of Federally Supported Loan Denials Race Whites Collateral 15% 11% Application Incomplete 13% 6% Credit History 14% 23% Debt to Income Ratio 27% 35% Employment History 2% 2% Insufficient Cash 7% 5% Mortgage Insurance Denied 0% 0% Unverifiable Information 7% 3% Other 16% 16% African American/Black Collateral 4% 18% Application Incomplete 7% 7% Credit History 30% 36% Debt to Income Ratio 34% 23% Employment History 2% 0% Insufficient Cash 5% 2% Mortgage Insurance Denied 0% 2% Unverifiable Information 0% 9% Other 18% 2% Asian Collateral 18% 9% Application Incomplete 12% 2% Credit History 13% 17% Debt to Income Ratio 31% 43% Employment History 3% 9% Insufficient Cash 7% 0% Mortgage Insurance 0% 0% Denied Unverifiable Information 8% 4% Other 8% 15% Ethnicity Hispanic or Latino Collateral 24% 23% Application Incomplete 12% 9% Credit History 27% 28% 71
75 Percentage of Conventional Loan Denials Percentage of Federally Supported Loan Denials Primary Reason for Denial Debt to Income Ratio 20% 20% Employment History 2% 5% Insufficient Cash 5% 4% Mortgage Insurance 1% 0% Denied Unverifiable Information 2% 3% Other 7% 7% Source: 2014 HMDA Contra Costa County s Single Family Lending Market, The following section will examine HMDA data over the time period for singlefamily properties in the County. Multifamily and manufactured housing properties have been excluded because on average between 2007 and 2014, these property types represented less than one half of one percent of the total applications submitted (applications) and total loans made (loan originations) within the County. Highlighted below, the trajectory of single-family loan originations within the County between 2007 and 2014 did not exhibit a consistent trend, though between 2012 and 2014 the total number of originations trended steadily downward after a dramatic rise between 2011 and While the 2014 level of originations was 32 percent below that of 2007, originations in both 2012 and 2013 surpassed 2007 levels. In contrast to the inconsistency of originations, the number of denials demonstrated a relatively steadier downward trend between 2007 and 2014, falling by 72 percent more than twice the rate of originations. As a percent of the sum of originations and denials, the share of denials decreased substantially, falling from nearly 40 percent to just over 20 percent. GRAPHIC 2 SINGLE-FAMILY LOAN ORIGINATIONS AND APPLICATION DENIALS 72
76 CONTRA COSTA COUNTY 70,000 Originations Denials 60,000 50,000 Total 40,000 30,000 20,000 10, Income, Race, and Single Family Loan Denials Over Time Denial rates for single-family loans in the vary by race and ethnicity. The chart below shows that between 2007 and 2014, Blacks were consistently denied at the highest rate relative to the other groups, with Hispanics consistently denied at the second-highest rate. Though the spread between the denial rate of Blacks and Hispanics relative to Whites narrowed significantly between 2007 and 2011, a mild uptick occurred between 2012 and
77 GRAPHIC 3 SINGLE-FAMILY DENIAL RATE BY RACE/ETHNICITY 40% White Black or African American Hispanic or Latino Asian 35% 30% Denial Rate 25% 20% 15% 10% 5% A view of single-family denial rates by applicant income group within the County, highlighted below, shows the expected outcome that higher income groups have lower denial rates than lower income groups. Between 2007 and 2014, applicants in the Very Low-Income category (50 percent or less of AMI), were consistently more likely to be denied for a single-family loan than any other income group. Low-Income applicants (between 50 percent and 80 percent of AMI) were denied at the second highest rate, though remained closer to higher income groups between 2007 and 2014 relative to Very Low-Income applicants. Middle-Income applicants (80 to 120 percent of AMI), in a manner similar to Low-Income and High-Income applicants, saw a relatively strong drop in denial rates between 2007 and 2012, from 27 percent to 11 percent, though the denial rate has since trended mildly upward to 15 percent as of The lowest denial rate in every year examined belonged to the High-Income group (greater than 120 percent of AMI). Consistent with an overall countywide decline in the single-family denial rate, every income group s denial rate fell between 2007 and 2012, and between 2012 and 2014, the denial rates for every income group increased. 74
78 GRAPHIC 4 SINGLE-FAMILY (SF) DENIAL RATE BY APPLICANT INCOME GROUP 40% Very Low Income Low Income Middle Income High Income 35% 30% Denial Rate 25% 20% 15% 10% 5% 0% A view of denial rates by income level of the property s Census Tract (shown in the chart on the following page) reveals a similar trend, though Very Low-Income Census Tracts have avoided the post-2011 denial rate increase that Very Low-Income applicants experienced. GRAPHIC 5 SINGLE-FAMILY DENIAL RATE BY TRACT INCOME GROUP Denial Rate 40% 35% 30% 25% 20% 15% 10% 5% 0% Very Low Income Low Income Middle Income High Income
79 Though Very Low-Income tracts represent nearly 10 percent of all Census Tracts within the County, they are represented by approximately 3 percent of total originations and 5 percent of total denials in the County as of Further, loans for single-family properties within these tracts were denied at a rate of 20 percent higher than any other group. Loan originations within the County are disproportionately likely to occur for properties in Middle- and High-Income tracts. Middle- and High-Income tracts represent 55 percent of the County total, but they account for 85 percent of all single-family loans originations throughout the County in Relatedly, Low- and Very Low-Income tracts represent 45 percent of all tracts, but account for roughly 16 percent of all single-family loan originations during the same year. GRAPHIC 6 ORIGINATIONS AND DENIALS BY CENSUS TRACT INCOME, 2014 Originations Denials Denial Rate Total 16,000 14,000 12,000 10,000 8,000 6,000 4,000 2,000 0 Very Low Income Low Income Middle Income High Income 25% 20% 15% 10% 5% 0% Denial Rate In addition to contrasting mortgage market outcomes by applicant and tract income, denial rates also differ depending on the share of minority residents in a housing unit s Census Tract. Majority-minority tracts, and particularly those with a share greater than 75 percent, have experienced higher denial rates than majority-white tracts for all study years. Though 76
80 denial rates for all share groups increased between 2012 and 2014, the gap between denial rates for the highest minority tracts (greater than 75 percent) and the lowest minority tracts (less than 25 percent) has decreased significantly since the onset of the economic downturn. GRAPHIC 7 SINGLE-FAMILY DENIAL RATE BY TRACT MINORITY SHARE Less than 25 Percent 25 to 50 Percent 50 to 75 Percent Greater than 75 Percent 40% 35% 30% Denial Rate 25% 20% 15% 10% 5% 0% The Subprime Market in Contra Costa County Illustrated below, the subprime mortgage market in the County has declined significantly relative to 2007 levels, though it has gradually increased since bottoming out in The total number of subprime loan originations fell by nearly 80 percent between 2007 and 2014 much higher than the total origination decline of 32 percent. 77
81 GRAPHIC 8 SINGLE-FAMILY SUBPRIME MORTGAGE ORIGINATIONS 7,000 6,000 5,000 Total 4,000 3,000 2,000 1, As a percentage of total single-family loan originations, Contra Costa County experienced a substantial decline between 2007 and 2010, falling from 13 percent to less than 1 percent. However, in recent years the subprime share has trended upward to 4.4 percent as of Subprime originations as a percent of borrower income group follow a similar pattern. While all income groups, and also the County as a whole, have demonstrated an upward trend in the share of subprime originations since 2012, they remain well below 2007 levels as of 2014 despite recent acceleration. Subprime origination trends in the County are consistent with the tightened credit conditions and heightened home lending standards that have taken place in the aftermath of the financial crisis and Great Recession. 78
82 GRAPHIC 9 PERCENT OF SUBPRIME ORIGINATIONS BY BORROWER INCOME GROUP TOTALS 16% 14% Very Low Income 12% Low Income Percent 10% 8% 6% Middle Income High Income All 4% 2% 0%
83 VI. Laws, Policies and Furthering Fair Housing Overview of Federal Fair Housing Laws and Executive Orders Both Federal and State fair housing laws establish protected classes, govern the treatment of these individuals, and are designed to affirmatively further access to housing and community development resources to members of protected classes. This section provides an overview of these laws. Title VI of the Civil Rights Act of 1964: Prohibits discrimination on the basis of race, color or national origin in programs and activities receiving federal financial assistance. Title VIII of the Civil Rights Act of 1968 (Fair Housing Act) and as amended 1988: Prohibits discrimination in the sale, rental and financing of dwellings, and in other housing-related transactions, based on: Race; Color; National origin; Religion; Sex; Familial status (including children under the age of eighteen living with parents or legal custodians, pregnant women and people securing custody of children under the age of eighteen, or discrimination based on age); and Persons with physical, mental, and developmental disabilities. Specifically, in the sale and rental of housing no one may take any of the following actions based on these protected classes: Refuse to rent or sell housing; Refuse to negotiate for housing; 80
84 Make housing unavailable; Deny a dwelling; Set different terms, conditions, or privileges for sale or rental of a dwelling; Provide different housing services or facilities; Falsely deny that housing is available for inspection, sale, or rental; For profit, persuade owners to sell or rent (blockbusting); Deny anyone access to or membership in a facility or service (such as multiple listing service) related to the sale or rental of housing; Refuse to allow reasonable modifications to dwelling or common use areas, at the expense of the renter or owner, if necessary, for a person living with disabilities to use the housing; or Refuse to make reasonable accommodations in rules, policies, practices, or services if necessary for the disabled person to use the housing In Mortgage Lending: No one may take any of the following actions based on these protected classes: Refuse to make a mortgage loan; Refuse to provide information regarding loans; Impose different terms or conditions on a loan, such as different interest rates, points, or fees Discriminate in appraising property; Refuse to purchase a loan; or Set different terms or conditions for purchasing a loan In addition, it is illegal for anyone to: Threaten, coerce, intimidate, or interfere with anyone exercising a fair housing right or assisting others who exercise that right; or Advertise or make any statement that indicates a limitation or preference based on race, color, national origin, religion, sex, familial status, or handicap. This prohibition 81
85 against discriminatory advertising applies to single-family and owner-occupied housing that is otherwise exempt from the Fair Housing Act. Section 504 of the Rehabilitation Act of 1973: Prohibits discrimination based on disability in any program or activity receiving federal financial assistance. Section 109 of Title I of the Housing and Community Development Act of 1974: Prohibits discrimination on the basis of race, color, national origin, sex, or religion in programs or activities receiving financial assistance from HUD s Community Development Block Grant Program. Sections 104(b) and 106 (d) (5) specifically require CDBG Program grantees to certify that they will affirmatively further fair housing. This requirement was also included in Section 105 (c) (13) of the National Affordable Housing Act of Title II of the Americans with Disabilities Act of 1990: Prohibits discrimination based on disabilities, services, or activities provided or made available by public entities. HUD enforces Title II when it relates to state and local public housing, housing assistance, and housing referrals. Architectural Barriers Act of 1968: Requires that buildings and facilities designed, constructed, altered or leased with certain federal funds after September 1969 must be accessible to, and usable by, handicapped persons. Age Discrimination Act of 1975: Prohibits discrimination of basis of age in programs or activities receiving federal financial assistance. Equal Credit Opportunity Act of 1974: Prohibits discrimination in lending based on race, color, religion, national origin, sex, marital status, age, receipt of public assistance or the exercise of any right under the Consumer Credit Protection Act. 82
86 Community Reinvestment Act (CRA) of 1977: According to the Federal Office of the Comptroller of the Currency, the CRA provides a framework for financial institutions, state and local governments and community organizations to jointly promote banking services to all members of a community. The CRA: Prohibits redlining (denying or increasing the cost of banking to residents of racially defined neighborhoods); and Encourages efforts to meet the credit needs of all community members, including residents of low- and moderate-income neighborhoods. The Community Reinvestment Act (CRA) provides that regulated financial institutions have continuing and affirmative obligations to help meet the credit needs of the local communities in which they are chartered. CRA establishes federal regulatory procedures for monitoring the level of lending, investments and services in low- and moderate-income neighborhoods defined as underserved by lending institutions. CRA creates an obligation for depository institutions to serve the entire community from which its deposits are garnered, including low- and moderateincome neighborhoods. Home Mortgage Disclosure Act (HMDA) of 1975: Requires banks, savings and loan associations and other financial institutions to publicly report detailed data on their home lending activity. Under HMDA, lenders are required to publicly disclose the number of loan applications by census tract, income, race and gender of the borrower, the type of loan and the number and dollar amount of loans made. Starting in 1993, independent mortgage companies were also required to report HMDA data. HMDA creates a significant and publicly available tool by which mortgage-lending activity in communities can be assessed. HMDA data can be analyzed to determine bank performance and borrower choices. Executive Order 11063: Prohibits discrimination in the sale, leasing, rental, or other disposition of properties and facilities owned or operated by the federal government or provided with federal funds. 83
87 Executive Order (as amended): Requires federal agencies to affirmatively further fair housing in their programs and activities and provides that the Secretary of HUD will be responsible for coordinating the effort. The Order also establishes the President s Fair Housing Council, chaired by the Secretary of HUD. Executive Order 12898: Requires each federal agency conduct its program, policies and activities that substantially affect human health or the environment in a manner that does not exclude persons based on race, color, or national origin. Executive Order 13166: Eliminates, to the extent possible, limited English proficiency as a barrier to full and meaningful participation by beneficiaries in all federally assisted and federally conducted programs and activities. Executive Order 13217: Requires federal agencies to evaluate their policies and programs to determine if any can be revised or modified to improve the availability of community-based living arrangements for persons with disabilities. Equal Access Rule (24 CFR 5.105(a)(2) and 5.106): Under 24 CFR 5.105(a)(2), the regulations provide protections for HUD-assisted or insured housing (including local housing programs funded with CDBG, HOME, etc. whether run by grantees or subrecipients) on the basis of gender identity, sexual orientation, and marital status and generally prohibits owners and program administrators from making inquiry about such characteristics. Further, 24 CFR specifically requires providers to establish, amend, or maintain program admissions, occupancy, and operating policies and procedures (including policies and procedures to protect individuals privacy and security), so that equal access is provided to individuals based on their gender identity. This requirement includes tenant selection and admission preferences. Such policies must ensure that an individual is placed, served, and accommodated in accordance with the 84
88 individual s gender identity and not subjected to intrusive questioning or asked to provide anatomical information or documentation to evidence the individual s gender. Review of State Laws The following is a list of California s statutes, rules and plans that have or might have an impact on fair housing choice. This section provides an overview of these statutes, policies, and/or plans. California Government Code section et seq - Fair Employment and Housing Act (FEHA): Prohibits all housing providers, including local governments, from discriminating in housing development and all actions related to the provision of housing based on: Age (40 and over) Ancestry Color Religious Creed Denial of Family and Medical Care Leave Disability (mental and physical) including HIV and AIDS Marital Status Medical Condition (cancer and genetic characteristics) Genetic Information National Origin Race Religion Sex (which includes pregnancy, childbirth and medical conditions related to pregnancy or childbirth) Gender, Gender Identity, and Gender Expression Sexual Orientation Specifically, Government Code section 12955(I) prohibits discrimination through public or private land use practices, decisions and authorizations. Government Code section
89 prohibits land use policies and practices that have a disproportionate impact on persons protected by the fair housing laws unless they are necessary to achieve an important purpose sufficiently compelling to override the discriminatory effect and there is not less restrictive means to achieve the purpose. The FEHA also incorporates the Unruh Act (Civil Code section 51), the Ralph Act (Civil Code section 51.7) and Bane Act (Civil Code section 52.1) as follows: The Unruh Civil Rights Act (California Civil Code section 51) provides protection from discrimination by all business establishments in California, including housing and accommodations, because of age, ancestry, color, disability, national origin, race, religion, sex, and sexual orientation. While the Unruh Civil Rights Act specifically lists sex, race, color, religion, ancestry, national origin, disability, or medical condition as protected classes, the California Supreme Court has held that protections under the Unruh Act are not necessarily restricted to these characteristics. The Ralph Civil Rights Act (California Civil Code section 51.7) forbids acts of violence or threats of violence because of a person s race, color, religion, ancestry, national origin, age, disability, sex, sexual orientation, political affiliation, or position in a labor dispute (California Civil Code section 51.7). Hate violence can be: verbal or written threats; physical assault or attempted assault; and graffiti, vandalism, or property damage. The Ralph Act provides that all persons have the right to be free from violence committed against themselves or their property because of their race, color, religion, ancestry, national origin, political affiliation, sex, sexual orientation, age, disability, position in a labor dispute, or because another person perceives them to have one or more of these characteristics. The Bane Civil Rights Act (California Civil Code section 52.1) provides another layer of protection for fair housing choice by protecting all people in California from interference by force or threat of force with an individual s constitutional or statutory rights, including a right to equal access to housing. 86
90 Government Code sections 11135, 65008, and : Prohibit discrimination in programs funded by the State and in any land use decision as follows: Government Code section : Provides protection from discrimination of protected classes from any program or activity that is conducted, funded directly by, or receives any financial assistance from the State. Specifically, whenever a state agency that administers a program or activity has reasonable cause to believe a contractor, grantee, or local agency has violated the provisions of Section 11135, or has adopted any regulation to implement such section, the head of the state agency shall notify the contractor, grantee, or local agency of such violation. If it is determined that a contractor, grantee, or local agency has violated the provisions of this article, the state agency that administers the program or activity involved shall take action to curtail state funding in whole or in part to such contractor, grantee, or local agency. Welfare and Institutions Code sections 5115 and 5116 (The Lanterman Developmental Disabilities Services Act): Declares that mentally and physically disabled persons are entitled to live in normal residential surroundings and grants to each person in the State with a developmental disability a right to services and support in the least restrictive environment. In addition, this act provides that the use of property for the care of six or fewer mentally disordered or otherwise handicapped persons is required by State law. Specifically, this act states a State authorized or certified family care home, foster home, or group home serving six or fewer persons with disabilities or dependent and neglected children on a 24-hour-a-day basis is considered a residential use to be permitted in all residential zones. Housing Accountability Act (Government Code section ): Prohibits a jurisdiction from disapproving a housing development project, including housing for farmworkers and for very low, low, or moderate-income households, or conditioning approval in a manner that renders the project infeasible for development for the use of very low, low, or moderate-income households, including through the use of design review standards, unless it makes at least one 87
91 of five specific written findings based on substantial evidence in the record (Government Code Section ). Pursuant to the Housing Accountability Act, a local government is prohibited from making the finding regarding zoning and general plan inconsistency (Section (d)(5)) to disapprove a development if the jurisdiction identified the site in its general plan (e.g., housing or land-use element) as appropriate for residential use at the density proposed or failed to identify adequate sites to accommodate its share of the regional housing need for all income groups. Chapter 633, Statutes of 2007, extended these provisions to emergency shelters and transitional housing, and prohibits the use of the zoning and general plan inconsistency finding to disapprove an emergency shelter if the jurisdictions have: not identified a zone(s) where emergency shelters are allowed as a permitted use without a conditional use or other discretionary permit, not demonstrated the identified zone(s) include sufficient capacity to accommodate the need for emergency shelter, or not demonstrated the identified zone(s) can accommodate at least one emergency shelter. This provision applies to any site identified in any element of the general plan for industrial, commercial, or multifamily residential uses. In any court action, the burden of proof is on the local jurisdiction to demonstrate its housing element satisfies the above requirements. HUD Office of General Counsel Guidance HUD Office of General Counsel Memorandum on Criminal History. In April 2016, HUD issued legal guidance from the Office of General Counsel (OGC) regarding the likely violation of the Fair Housing Act when housing providers employ blanket policies in refusing to rent or renew a lease based on an individual s criminal history, because such policies may have a disparate 88
92 impact on racial minorities. 18 The guidance states, [b]ecause of widespread racial and ethnic disparities in the U.S. criminal justice system, criminal history-based restrictions on access to housing are likely disproportionately to burden African-Americans and Hispanics. The guidance states that when a housing provider s seemingly neutral policy or practice has a discriminatory effect, such as restricting access to housing on the basis of criminal history, and has a disparate impact on individuals of a particular race, national origin, or other protected class, the policy or practice is unlawful under the Fair Housing Act if it is not necessary to serve a substantial, legitimate, nondiscriminatory interest of the housing provider, or if the interest could be served by another practice that has a less discriminatory effect. The guidance states, bald assertions based on generalization or stereotype that any individual with an arrest or conviction record poses a greater risk than those without such records are not sufficient. Landlords and property managers must be able to prove through reliable evidence that blanket policies actually assist in protecting residents and property. The guidance also states that a housing provider with policies of excluding people because of a prior arrest without conviction cannot satisfy its burden of showing such a policy is necessary to achieve a substantial, legitimate, nondiscriminatory interest, since an arrest is not a reliable basis upon which to assess the potential risk to residents or property. In instances when a person has been convicted, the policy must be applied on a case-by-case basis considering the nature and severity of the conviction, what the individual has done since conviction, and how long ago the conviction took place. OGC Memorandum on Fair Housing Act Protections for Persons with Limited English Proficiency. In September 2016, HUD issued legal guidance discussing how the Fair Housing Act applies to a housing provider s consideration of a person s Limited English Proficiency (LEP), or the person s limited ability to read, write, speak or understand English. 89
93 The memorandum clarifies that while people with limited English proficiency are not a protected class under the Fair Housing Act, the Fair Housing Act prohibits discrimination on seven protected bases, including national origin, which is closely linked to the ability to communicate proficiently in English. Housing providers are, therefore, prohibited from using limited English proficiency selectively or as an excuse for intentional housing discrimination. The law also prohibits landlords from using limited English proficiency in a way that causes an unjustified discriminatory effect. The guidance addresses how various legal approaches, such as discriminatory effects and disparate treatment, apply in Fair Housing Act cases in which a housing-related decision such as a landlord s refusal to rent or renew a lease involves a person s limited ability to speak, read, write, or understand English. Discriminatory practices, for example, could include applying a language-related requirement to people of certain races or nationalities; posting advertisements that contain blanket statements, such as "all tenants must speak English;" or immediately turning away applicants who are not fluent in English. Targeting racial or national origin groups for scams related to housing also constitutes intentional discrimination. A housing provider also violates the Fair Housing Act when the provider s policies or practices have an unjustified discriminatory effect, even when the provider had not intended to discriminate. Determining whether a practice has a discriminatory effect involves a three-step legal evaluation of the statistical evidence of a discriminatory effect; whether the housing provider s policy or practice is necessary to achieve a substantial, legitimate, nondiscriminatory interest; and, if so, whether there is a less discriminatory alternative policy or practice. OGC Memorandum on Application of Fair Housing Act Standards to the Enforcement of Local Nuisance and Crime-Free Housing Ordinances Against Victims of Domestic Violence, Other Crime Victims, and Others Who Require Police or Emergency Services. In September 2016, HUD issued guidance to explain how the Fair Housing Act applies to ensure that the growing 90
94 number of local nuisance ordinances and crime-free housing ordinances do not lead to discrimination in violation of the Act. This memorandum s guidance focuses primarily on the impact these ordinances may have on domestic violence victims, but the Act and the standards apply equally to victims of other crimes and to those in need of emergency services who may be subjected to discrimination prohibited by the Act due to the operation of these ordinances. The guidance further addresses the obligation of HUD-funded recipients to consider the impacts of the ordinances in assessing how they will fulfill their affirmative obligation to further fair housing. The memorandum describes that a growing number of local governments are enacting a variety of nuisance ordinances that can affect housing in potentially discriminatory ways. These ordinances often label various types of conduct associated with a property whether the conduct is by a resident, guest or other person a nuisance and require the landlord or homeowner to abate the nuisance under the threat of a variety of penalties. The conduct defined as a nuisance varies by ordinance and has ranged from conduct affecting the appearance of the property to general prohibitions related to the conduct of a tenant or guest. Nuisance ordinances have included what is characterized by the ordinance as an excessive number of calls for emergency police or ambulance services, typically defined as just a few calls within a specified period of time by a tenant, neighbor, or other third party, whether or not directly associated with the property. In some jurisdictions, an incident of domestic violence is defined as a nuisance without regard to whether the resident is the victim or the perpetrator of the domestic violence. In other jurisdictions, incidents of domestic violence are not specifically defined as nuisances, but may still be categorized as such because the ordinance broadly defines nuisance activity as the violation of any federal, state or local law, or includes conduct such as disturbing the peace, excessive noise, disorderly conduct, or calls for emergency services that exceed a specified number within a given timeframe. Even where ordinances expressly exclude victims of domestic violence or other crimes, victims are still frequently deemed to have committed 91
95 nuisance conduct because police and other emergency service providers may not log the call as domestic violence, instead categorizing it incorrectly as property damage, disturbing the peace or another type of nuisance conduct. The ordinances generally require housing providers either to abate the alleged nuisance or risk penalties, such as fines, loss of their rental permits, condemnation of their properties and, in some extreme instances, incarceration. Some ordinances may require the housing provider to evict the resident and his or her household after a specified number of alleged nuisance violations often quite low within a specific timeframe. The memorandum explains that the Fair Housing Act prohibits intentional housing discrimination and housing ordinances, policies or practices that have an unjustified discriminatory effect because of protected characteristics. While the Act does not prohibit local governments from appropriately considering nuisance or criminal conduct when enacting laws related to housing, governments should ensure that such ordinances and related policies or practices do not discriminate in violation of the Fair Housing Act. Where the enforcement of a nuisance or crime-free ordinance penalizes individuals for use of emergency services or for being a victim of domestic violence or other crime, a local government bears the burden of proving that any discriminatory effect caused by such policy or practice is supported by a legally sufficient justification. Such a determination cannot be based on generalizations or stereotypes. Selective use of nuisance or criminal conduct as a pretext for unequal treatment of individuals based on protected characteristics violates the Act. The memorandum advises that repealing ordinances that deny access to housing by requiring or encouraging evictions or that create disparities in access to emergency services because of a protected characteristic is one step local governments can take to avoid Fair Housing Act violations and as part of a strategy to affirmatively further fair housing. 92
96 VII. Private Sector Analysis This section discusses the efforts to determine and evaluate the practices of the private sector as they relate to fair housing choice, including the policies and practices of real estate agents, property managers, and mortgage lenders. Mortgage lending patterns are discussed in the preceding Section. Real Estate Sales Practices In the State of California, to engage in the business of real estate sales, a broker or salesperson must be licensed by the Department of Real Estate (DRE). The DRE also enforces violations of California real estate law. The real estate industry in California is highly professionalized. Almost all real estate brokers and salespersons are affiliated with a real estate trade association. The two largest are the California Association of Realtors (CAR), associated with the National Association of Realtors (NAR), and the California Association of Real Estate Brokers (CAREB), associated with the National Association of Real Estate Brokers (NAREB). Members of NAREB are licensed to use the professional designation Realtist. The use of the term Realtor is restricted by NAR as a registered trademark. NAR has a professional code of conduct which specifically prohibits unequal treatment in professional services or employment practices on the basis of, race, color, religion, sex, handicap, familial status, or national origin (Article 10, NAR Code of Ethics). Both prohibit members from promulgating deed restrictions or covenants based on race. Article 10 of the NAR Code of Ethics provides that Realtors shall not deny equal professional services to any person for reasons of race, color, religion, sex, handicap, familial status, or national origin. Realtors shall not be a party to any plan or agreement to discriminate against any person or persons on the basis of race, color, religion, sex, 93
97 handicap, familial status, or national origin. A Realtor pledges to conduct business in keeping with the spirit and letter of the Code of Ethics. Article 10 imposes obligations upon Realtors and is also a firm statement of support for equal opportunity in housing. A Realtor who suspects discrimination is instructed to call the local Board of Realtors. Local Boards of Realtors will accept complaints alleging violations of the Code of Ethics filed by a home seeker who alleges discriminatory treatment in the availability, purchase, or rental of housing. Local Boards of Realtors have a responsibility to enforce the Code of Ethics through professional standards procedures and corrective action in cases where a violation of the Code of Ethics is proven to have occurred. The California Association of Realtors has many local associations. The County is served by the Contra Costa Association of Realtors, the Bay East Association of Realtors, the Delta Association of Realtors, and the West Contra Costa Association of Realtors. CAR offers continuous online courses dealing with fair housing requirements and issues. According to the course description, the course will provide an overview of the federal fair housing laws and an in depth discussion of the individual laws and their application to the practice of real estate. The course also provides CAR members with a study of the State of California fair housing laws and regulations. The course emphasizes anti discriminatory conduct which all licensees should practice and concludes by discussing the voluntary affirmative action marketing program and why promoting fair housing laws is a positive force at work in California and throughout the nation. NAREB Realtists follow a strict code of ethics that states any Realtist shall not discriminate against any person because of Race, Color, Religion, Sex, National Origin, Disability, Familial Status or Sexual Orientation (Part I, Section 2, NAREB Code of Ethics): In the sale or rental of real property. 94
98 In advertising the sale or rental of real property. In the financing of real property. In the provision of professional services. Part I, Section 2 of the NAREB Code of Ethics continues to state that any Realtist shall not be instrumental in establishing, reinforcing or extending any agreement or provision that restricts or limits the use or occupancy of real property to any person or group of persons on the basis of race, color, religion, sex, national origin, disability, familial status or sexual orientation. Rental and Property Management The California Apartment Association (CAA) is the country s largest statewide trade association for rental property owners and managers. CAA incorporated in 1941 to serve rental property owners and managers throughout California. CAA represents rental housing owners and professionals who together manage more than 1.5 million rental units. CAA supports the spirit and intent of all local, state, and federal fair housing laws for all residents without regard to color, race, religion, sex, marital status, mental or physical disability, age, familial status, sexual orientation, or national origin. Members of the California Apartment Association agree to abide by the following provisions of their Code for Equal Housing Opportunity: We agree that in the rental, lease, sale, purchase, or exchange of real property, owners and their employees have the responsibility to offer housing accommodations to all persons on an equal basis; We agree to set and implement fair and reasonable rental housing rules and guidelines and will provide equal and consistent services throughout our resident s tenancy; 95
99 We agree that we have no right or responsibility to volunteer information regarding the racial, creed, or ethnic composition of any neighborhood, and we do not engage in any behavior or action that would result in steering; and We agree not to print, display, or circulate any statement or advertisement that indicates any preference, limitations, or discrimination in the rental or sale of housing. The CAA offers a Certificate in Residential Management (CRM), which includes a course on fair housing law. In addition, the CAA website provides links to the Fair Housing Institute and Fair Housing Network. CAA has a local association with offices in Pleasant Hill. The CAA of Contra Costa /Napa/Solano serves Contra Costa County, Napa, and Solano counties. Rental and Property Management. The CAA offers a Certificate in Residential Management (CRM), which includes a course on fair housing law. In addition, the CAA website provides links to the Fair Housing Institute and Fair Housing Network. CAA has a local association with offices in Pleasant Hill. The CAA of Contra Costa /Napa/Solano serves Contra Costa County, Napa, and Solano counties. Public Outreach Public Survey The Consortium conducted two online public surveys to gather input about fair housing in the County from the public and interest groups. There were two target groups for the surveys: nonprofit and government stakeholder groups with an interest in fair housing, and residents of the County. Stakeholder Interviews Stakeholders were engaged through targeted interviews to explore topics that were not fully covered through other outreach or to clarify information gathered through other efforts. A list of individuals interviewed is included as Appendix 1. 96
100 A. Methodology The survey questionnaires are included at Appendix 5. The first survey question asked respondents which of the two target groups they belong to, and then directed them to the proper questionnaire based on their response. The survey for County residents was also available in a Spanish-language version. Stakeholder respondents were asked to complete the survey from an organizational, and not personal, viewpoint, but were invited to complete the resident survey separately. Survey participants were not required to answer most of the survey items. As a result, survey questions were answered by a varied number of respondents. While not preferable, not requiring a response to all items allowed the respondent to skip over sections of the survey that may not have been applicable and still respond to subsequent questions. The alternative option of requiring all questions was considered an invitation for respondents to quit the survey before their responses were recorded. The surveys were administered electronically using Survey Monkey as a host platform from April 26, 2016 to June 2, The Consortium distributed the survey link to its stakeholders and requested that they pass it on to colleagues, partners, and the general public. A link to the survey was also posted online. B. Results and Analysis A total of 240 individuals accessed the survey and at least answered the required question about target group. The number of respondents by target group is shown in Table
101 Table 34: Responses by Survey Survey No. Participants Resident, English 115 Resident, Spanish 40 Stakeholder 85 Total 240 Below is a detailed summary of the survey results. As mentioned above, the number of respondents for each survey item varied greatly. The population considered for each question is the number of respondents who replied to the item (i.e. percentages refer to the percentage that replied to the question, not the percentage of all who access the survey for that target group). 1. Resident Survey A total of 155 individuals provided responses for the resident survey. Forty of these completed the Spanish-language version of the survey. Nearly half (47 percent) of respondents lived in Concord, the County s largest city. The remaining respondents were spread among the County s other communities. In many ways the demographic characteristics of the survey respondents were very disproportionate to the County as a whole (as reported in U.S. Census Bureau data). 5 The County is just over 50 percent female, for example, but 80 percent of survey respondents were female. While both survey respondents and County residents were 65 percent white, only 25 percent of County residents reported Hispanic/Latino heritage, compared to over half of survey respondents (54 percent). Twelve percent of respondents claimed to be disabled, higher than the 6 percent County-wide. 5 Source: Census Bureau Quick Facts 98
102 Income and housing characteristics follow this trend as well. According to the U.S. Census Bureau, 65 percent of County housing units are owner occupied, but only 45 percent of survey respondents were homeowners. About half of respondents reported annual household income of below $46,750. In fact, of the income brackets offered, the one selected most was the lowest 29 percent of respondents reported annual household income less than $28,000. This is in stark contrast to the County-wide population, where the median household income was nearly $80,000 per year in Finally, 61 percent of survey respondents reported spending more than 30 percent of their income on housing. The survey asked participants to provide insights about the conditions in their neighborhood and home. Respondents had a general positive feeling toward their own neighborhood. When asked to rate on a ten-point scale a number of neighborhoods characteristics (schools, parks, public safety, infrastructure, public transit, grocery stores, hospitals, and sense of community), a majority of respondents answered on the positive side of the scale for all characteristics. Schools received a particularly high rating, with 18 percent rating them as 10 or best, the only characteristic where the most positive selection was chosen most often. These results were mirrored when respondents were asked to report the incidence of specific neighborhood issues in the previous two years. While 41 percent indicated an increase in crime and one-third a lack of upkeep of neighborhood homes, all other items were selected by less than a quarter of respondents. This same question format was used to ask about the incidence of specific issues in the home in the previous two years. More than a third indicated no experience with any of the issues, except for difficulty paying rent or mortgage (41 percent). Overall, survey respondent did not report many issues with their neighborhoods or homes. 99
103 GRAPHIC 10 Familiarity with Fair Housing Laws Unsure Very Familiar Familiar Somewhat Familiar Not Familiar 0.0% 10.0% 20.0% 30.0% 40.0% Graphic 10 shows participant familiarity with fair housing laws, and only a small portion reported great knowledge of the subject. Over 70 percent of respondents reported no familiarity or only somewhat familiarity with the subject. Similarly, 34 percent indicated an awareness of their rights under the federal Fair Housing Act and related California state laws. Only 36 percent reported knowledge of the protections the law generally provides against housing discrimination, and 28 percent knew where to go for help if they experienced housing discrimination. 100
104 GRAPHIC 11 Sources of Information, Generally and Specific to Housing Discrimination Conversations with friends and family Legal services or social services organizations Fair housing organizations Interactions with the State or Federal government Interaction with my City and/or County Public Service announcements News stories in the national news News stories in your local community 0% 5% 10% 15% 20% 25% 30% 35% 40% 45% 50% Have Heard of Housing Discrimination Usual Information Source If a small portion of respondents are aware of fairing housing generally, where are they hearing about the subject? Graphic 11 shows where respondents get information about laws and news generally, and where they have heard about housing discrimination. 6 In general, respondents reported getting information about fair housing from the same sources they get other news and information. News stories in local news media is the most common source of news generally and specific to fair housing, followed by conversations with friends and family. More respondents reported hearing of fair housing in national news stories than usually go to this source for information. However, less reported hearing of fair housing in public service announcements (PSAs) and interactions with government than usually use these as a source of information. These may be areas were the Consortium can look to increase fair housing marketing. 6 Note: the general information question included the option of internet research, but this option was not included in the question where have you heard about housing discrimination? so it was excluded from the chart. 101
105 One survey item listed barriers to housing choice and asked respondents to select those they have observed or experienced in their community. Graphic 12 shows the results of this question. Over three-quarters (76 percent) of respondents observed or experienced high cost of housing as a barrier. The next highest selection was distance of housing to employment at 35 percent, followed by poor condition of available units (34 percent) and lack of access to public transportation (32 percent). Clearly cost of housing is the most obvious barrier to housing choice in the County. GRAPHIC 12 Observed Barriers to Housing Choice 0% 10% 20% 30% 40% 50% 60% 70% 80% High cost of housing Distance of housing to jobs Poor physical conditions of housing Lack of access to transportation Utility costs Lack of accessibility for disabled Diversity of housing types None Age-restrictions on housing Other (please specify) One third of survey participants reported observing housing discrimination in their community. In addition, 13 percent indicated a personal experience with housing discrimination. It is also noteworthy that 12 percent indicated they did not know if they had experienced housing discrimination it is possible that some victims of housing discrimination do not know enough about the issue to self-report. The leading reasons for experienced housing discrimination are race (cited in 44 percent of incidents), national origin (28 percent), and familial status (28 percent). Almost three-quarters (72 percent) of incidents occurred in rental housing by a landlord or property manager, and half occurred in multi-family apartment complexes (only a 102
106 quarter in single family homes). This suggests that housing discrimination is occurring more often in larger developments. None of the respondents who had experienced housing discrimination had reported the incident to a government agency or fair housing group. When asked why they failed to report the discrimination, about a quarter selected each of the options: no knowledge of where to report, fear of retaliation, unsure of rights, and did not think it would make a difference. It is important to note that every respondent that chose did not know where to report completed the Spanish-language survey; there may be a need to market fair housing reporting options in the Spanish-language community. Finally, only 21 percent of respondents reported an awareness of fair housing trainings and workshops in their communities. Only 10 percent of respondents had participated in these opportunities in the past. 2. Stakeholder Survey A total of 85 individuals accessed the stakeholder survey. However, no more than 65 answered any one survey question. The majority (58 percent) worked for non-profit organizations, and another 17 percent worked in local government. The remainder worked in a variety of other fields. Forty percent of respondents reported working in Concord, with another 14 percent in Martinez and 12 percent in Richmond. 103
107 GRAPHIC 13 Organizational Familiarity with Fair Housing Laws Not Familiar Somewhat Familiar Familiar Very Familiar 0.0% 10.0% 20.0% 30.0% 40.0% Graphic 13 shows stakeholder respondent familiarity with fair housing laws. Only 11 percent of respondents claimed no familiarity with fair housing laws, while a full one-third said they were very familiar with laws on this subject. The survey asked about the frequency of client-reported discrimination based on a variety of characteristics. For none of the characteristics did a majority of respondents claim that clients had reported discrimination. Over one-third of respondents noted mental disability (39 percent), physical disability (38 percent), and familial status (38 percent), while 31 percent mentioned race. For race, 11 percent (4 respondents) also claimed that they have received over 7 reports of incidents in the past year. Several survey items asked about impediments to fair housing related to different topics. For every impediment related to services and opportunities, a majority of respondents reported the occurrence as somewhat frequent or very frequent. The leading impediment was insufficient information about housing availability at 75 percent somewhat or very frequent occurrence, but the other impediments were not far behind: inadequate access to technology (66 percent), inadequate info about fair housing rights (63 percent), inadequate access to 104
108 employment (63 percent), inadequate access to transportation (59 percent), and inadequate access to public and social services (58 percent). The results were similar with economic impediments to housing choice. Almost three-quarters (72 percent) of respondents said an inability to secure subsidies for affordable housing developments occurred very frequently, and another 16 percent reported somewhat frequent occurrence. Next was lack of affordable housing developers at 69 percent and high cost of land at 66 percent. Despite these results, impediments related to the real estate market did not receive similar high reported frequency. It seems that stakeholders may find economic impediments to housing choice related to developing affordable housing, but not as much in the homebuyer market. The survey also asked about impediments to housing choice related to government actions and policies. For the nine possible impediments offered, a majority indicate somewhat or very frequent occurrence for just two of them lack of fair housing knowledge at the local level (62 percent very or somewhat frequent) and lack of designated officer to handle fair housing issues (53 percent). In addition, exactly half of respondents indicated local land-use controls and zoning prohibiting higher density housing very or somewhat frequently. But the other six impediments did not receive a majority of responses about higher frequency, in contrast to the other areas of impediments on the survey. This could be because the local government respondents and non-profit respondents with close ties to local government are not selfreporting issues related to their own organizations. In a related item, participants were asked to evaluate the effectiveness of nine different government actions related to fair housing. In almost every case, a plurality of respondents indicated that the action was somewhat effective. Most of these items dealt with coordination and locating affordable housing near different services. However, in two cases the plurality chose not at all effective : increasing housing choice for Housing Choice Voucher 105
109 (HCV) recipients (45 percent) and allocating local funds for affordable housing (38 percent); the items related to increasing housing supply were deemed least effective. Respondents offered their opinions on the effectiveness of other efforts to promote fair housing as well. When asked about fair housing marketing practices, however, a majority of respondents indicated uncertainty about the effectiveness or that it was not used in their area for all practices listed. The results were the same when asked to evaluate the effectiveness of educational outreach efforts related to fair housing. Clearly these efforts are not occurring or their use is not widespread in the County. A majority of respondents (63 percent) reported having clients who have complained about being victims of housing discrimination. The leading reason for this discrimination were race in 47 percent of cases, national origin and familial status each in 37 percent of cases, and physical handicap and age each in 32 percent of cases. 7 Lastly, the survey asked about questionable practices in different housing markets and policy areas. The only area in which a plurality of respondents said they know of questionable practices was in the rental housing market. The leading response for all other areas (real estate market, lending market, minority populations serving on local boards, and other housing services) was don t know. 7 Respondents were allowed to select multiple reasons for the act of housing discrimination. 106
110 VIII. Government Barriers to Fair Housing Public policies established at the state, regional, and local levels can affect housing development and, therefore, may have an impact on the range and location of housing choices available to residents. This section discusses the public policies enacted by jurisdictions within the County and their potential impacts on housing development. Zoning and housing related documents (e.g., housing elements, previous fair housing assessments, consolidated plans) were reviewed to identify potential impediments to fair housing choice and affordable housing development. Housing Element Law and Compliance California state housing element law requires that local governments adequately plan to meet the existing and projected housing needs of all economic segments of the community. California state housing element law requires each jurisdiction to: Identify adequate sites which will be made available through appropriate zoning and development standards and with the services and facilities needed to facilitate and encourage the development of a variety of types of housing for all income levels in order to meet the city s regional housing needs. Assist in the development of adequate housing to meet the needs of extremely low, very low, low, and moderate income households. Address and, where appropriate and legally possible, remove governmental constraints to the maintenance, improvement, and development of housing. Conserve and improve the condition of the existing affordable housing stock. Promote housing opportunities for all persons regardless of race, religion, sex, marital status, ancestry, national origin, color, familial status, or disability. 107
111 Housing for Persons with Special Needs Housing for Persons with Disabilities Persons with special needs such as the elderly and those with disabilities must have access to housing in a community. Community care facilities provide a supportive housing environment to persons with special needs in a group situation. Restrictions that prevent these types of facilities from locating in a community may impede equal access to housing for the special needs groups. Licensed Community Care Facilities The Lanterman Developmental Disabilities Services Act (Sections 5115 and 5116 of the California Welfare and Institutions Code) states that mentally and physically disabled persons are entitled to live in normal residential surroundings and that the use of property for the care of six or fewer disabled persons is a valid residential use for zoning purposes. Housing element law requires that jurisdictions permit community care facilities with six or fewer persons by right in all residential zones. Group homes of seven or more residents, however, are often subject to special requirements. Current housing element law requires local governments to permit group homes of seven or more in at least one zone; a conditional use permit can be required. There are many different types of licensed care facilities within the County. Below is a description of the different types of care facilities within these jurisdictions. Adult day care facilities (ADCF) provide programs for frail elderly and developmentally disabled and/or mentally disabled adults in a day care setting. Adult residential facilities (ARF) are facilities of any capacity that provide 24 hour nonmedical care for adults ages 18 through 59, who are unable to provide for their own daily needs. Adults may be physically handicapped, developmentally disabled, and/or mentally disabled. 108
112 Group homes are facilities of any capacity and provide 24 hour nonmedical care and supervision to children in a structured environment. Residential care facilities for the elderly (RCFE) provide care, supervision, and assistance with daily living activities to persons 60 years of age and over and persons under 60 with compatible needs. Small family homes (SFH) provide care 24 hours a day in the licensee s family residence for six or fewer children who are mentally disabled, developmentally disabled, or physically handicapped and who require special care and supervision as a result of such disabilities. A social rehabilitation facility is any facility that provides 24 hour a day nonmedical care and supervision in a group setting to adults recovering from mental illnesses who temporarily need assistance, guidance, or counseling. The Transitional Housing Placement Program provides care and supervision for children at least 17 years of age participating in an independent living arrangement. Reasonable Accommodation Under State and Federal law, local governments are required to reasonably accommodate housing for persons with disabilities when exercising planning and zoning powers. Jurisdictions must grant variances and zoning changes if necessary to make new construction or rehabilitation of housing for persons with disabilities feasible, but they are not required to fundamentally alter their zoning ordinance. Although most local governments are aware of State and Federal requirements to allow reasonable accommodations, if specific policies or procedures are not adopted by a jurisdiction, disabled residents may be unintentionally displaced or discriminated against. All of the jurisdictions examined provide flexibility in development standards to reasonably accommodate the housing needs of residents with disabilities. The degree of formalization varies by jurisdiction. 109
113 Housing for the Homeless Transitional and Supportive Housing Transitional housing is defined by HUD as a project that is designed to provide housing and appropriate support services to homeless persons to facilitate movement to independent living within 24 months. Permanent supportive housing is defined by HUD as long term community based housing and supportive services for homeless persons with disabilities. The intent of this type of supportive housing is to enable this special needs population to live as independently as possible in a permanent setting. The supportive services may be provided by the organization managing the housing or provided by other public or private service agencies. There is no definite length of stay. California Senate Bill 2 requires that both the transitional and supportive housing types be treated as a residential use and be subject only to those restrictions that apply to other residential uses of the same type in the same zone. Both transitional and supportive housing types must be explicitly permitted in the zoning code. California Senate Bill 2 also requires jurisdictions to allow emergency shelters without any discretionary action in at least one zone that is appropriate for permanent emergency shelters (i.e., with commercial uses compatible with residential or light industrial zones in transition). The goal of SB 2 is to ensure that local governments are sharing the responsibility of providing opportunities for the development of emergency shelters. To that end, the legislation also requires that jurisdictions demonstrate site capacity in the zone identified to be appropriate for the development of emergency shelters. Within the identified zone, only objective development and management standards may be applied, given they are designed to encourage and facilitate the development of or conversion to an emergency shelter. 110
114 Building Code Building codes are essential to preserve public health and safety and to ensure the construction of safe housing. On the other hand, excessive standards can constrain the development of housing. Building codes are typically reviewed on an ongoing basis to evaluate whether changes are necessary or desirable and consistent with changing state law. A review of the building codes for local jurisdictions in the County was completed, and it was found that none of the building codes or amendments to the building codes create an undue constraint on housing development. Please see Appendix 6 for a description of the local building codes currently adopted. Resources and Incentives for Affordable Housing Local jurisdictions may provide resources and incentives for the development of affordable housing in order to assure the greatest possible availability of housing types for all persons and all income groups. Resources include local, State, and Federal funding as well as local programs that provide incentives for the development of affordable housing. Please see Appendix 7 for a listing of the funding programs available. Two of the most significant incentive programs are inclusionary housing and the so called density bonus. Inclusionary Housing An inclusionary housing program requires a percentage of new residential housing units to be offered for sale or rent at prices affordable to lower income households. In an effort to generate a mix of income levels within residential areas and to offer access to public and commercial services without regard to economic status and income level, the affordable units are expected to be dispersed throughout the development. The number of inclusionary units is determined as a percentage of the total units in the development. Developers may choose to 111
115 pay a fee or to provide a combination of fee and units in lieu of providing the units on site. Fees collected are allocated to an Affordable Housing Trust Fund. Density Bonus Senate Bill 1818 (Hollingsworth, 2004) altered the State density bonus provisions. Effective January 1, 2005, SB 1818 increased the maximum bonus from 25 to 35 percent and changed the eligibility thresholds for projects. The bill also required localities to grant additional incentives and allowed bonuses for land donation. Under the new density bonus law, there are provisions for projects that include affordable housing (to low and very low income households), senior housing, donations of land, condominium conversions, and child care facilities. The law also allows for concessions and incentives that have the effect of reducing the cost of development. A developer may apply for one to three concessions or incentives depending on how many affordable units are being constructed. Such concessions or incentives may include modification of or relief from development standards such as minimum parking requirements, minimum building setback and separation distances, maximum floor area ratios, architectural design requirements, or others. 112
116 IX. Findings, Impediments, and Recommendations This AI broadly analyzes actions and conditions that may have the effect of restricting housing choice for people protected under State and Federal fair housing laws. The AI not only identifies impediments to fair housing choice, but also makes recommendations to overcome the effects of those impediments and will serve as the basis for fair housing planning, providing essential information to staff, policy makers, housing providers, lenders, and fair housing advocates, and assisting with garnering community support for fair housing efforts. Findings The study s principal findings are as follows: Overall, approximately 45 percent of renter households in the County have a high cost burden. Less than 25 percent have a severe cost burden. This is roughly consistent in all jurisdictions except Antioch (high: 52.2 percent; severe: 28.6 percent) and Pittsburg (high: 48.8 percent; severe: 26 percent). Elderly one- and two-person renter households tend to experience a higher degree of high cost burden (56.3 percent) and severe cost burden (27.6 percent) countywide. Concord has the highest percentage of cost-burdened elderly households with 70.1 percent having a high cost burden and 38.1 percent having a severe cost burden. Over one third (38.5 percent) of owner households in the County have a high cost burden. Approximately 15 percent have a severe cost burden. This is generally consistent across all jurisdictions except Pittsburg (high: 44.8 percent; severe: 18.4 percent) and Antioch (high: 43.2 percent; severe: 16.6 percent). Elderly one- and two-person owner households tend to experience a slightly lower degree of cost burden (28.7 percent high and 12.9 percent severe) countywide. 113
117 The above findings on cost burden are supported by survey responses from residents. Sixtyone percent of survey respondents reported spending more than 30 percent of their income on housing. Over three-quarters (76 percent) of respondents observed or experienced high cost of housing as a barrier. Higher income communities in the County tend to be in the central region, and lower income communities are more likely to be in the industrial and agricultural communities of the eastern, northern and western regions. The cities of San Pablo, Pittsburg and Richmond are notable for the level of poverty (over 17 percent) as compared to the rest of the County. San Pablo, Antioch, Pittsburg and Richmond are all notable for having a poverty level over 20 percent for persons under the age of 18 years. When comparing the 2009 data to the 2014 data for the County as a whole, due to the current economic condition the unemployment rate has increased dramatically from 7.2 percent in 2009 to 9.8 percent in 2014 an increase of 36 percent. This increased unemployment rate is the trend for all but two jurisdictions in the County (Hercules and Pleasant Hill), with almost all jurisdictions seeing an increase in the unemployment rate. The jurisdiction that had the greatest increase in unemployment rate was Moraga (268 percent increase) going from 2.2 percent in 2009 to 8.1 percent in In stakeholder interviews, numerous stakeholders reported that the lack of sufficient affordable housing supply and concentration of affordable housing remain relevant findings from the previous AI. Survey results support this finding in that 72 percent of stakeholder respondents said an inability to secure subsidies for affordable housing developments occurred very frequently, and another 16 percent reported somewhat frequent occurrence. Further, 75 percent said lack of information about housing availability is a very frequent or somewhat frequent impediment. Additionally, 41 percent of resident respondents indicated difficulty paying rent or mortgage (41 percent). 114
118 Overall, the 2014 data indicate that the County has a very low vacancy rate. With the exception of three communities, all communities in the Urban County have vacancy rates below 5 percent, which is extremely low. The three communities within the Urban County that have vacancy rates above 5 percent are San Pablo (8.3 percent), Pinole (6.9 percent), and El Cerrita (5.2 percent). All entitlement jurisdictions have vacancy rates above 5 percent (Antioch- 7.7 percent; Walnut Creek-6.8 percent; Pittsburg- 6.2 percent; and Concord 5.8 percent;). The denial rate for traditional home purchase loans for one to four family housing in the County varies significantly among Whites, Blacks, and Hispanics. In 2014, Blacks were more than twice as likely to be denied for conventional single-family home purchases as Whites, with respective denial rates of 18 percent and 8 percent. Hispanics and Asians were denied at a rate that falls between the other two groups, at 14 percent and 11 percent, respectively. Additionally, a closer look at home purchase denial rates by race and ethnicity and income group within the County demonstrates that high-income Blacks (having greater than 120 percent of Area Median Income) were more likely to be denied for a single-family home purchase, at 15 percent, than low-income Whites (having 80 percent or less of Area Median Income), at 12 percent. In contrast, high-income Hispanics and high-income Asians were denied at rates slightly below low-income Whites, at 10 percent. White applicants demonstrated the lowest disparity in denial rates between their low- and high-income applicants at 5 percent, compared to 7 percent for Blacks and Hispanics. Over 70 percent of respondents reported no familiarity or only somewhat familiarity with fair housing laws. Thirty-four percent indicated an awareness of their rights under the federal Fair Housing Act and related California state laws. Only 36 percent reported knowledge of the protections the law generally provides against housing discrimination, and 28 percent knew where to go for help if they experienced housing discrimination. Respondents reported that, to the extent they know about housing rights, they get information from community news stories and family/friends. 115
119 Twelve percent of resident survey respondents reported that they did not know if they had experienced housing discrimination. It is possible that some victims of housing discrimination do not know enough about the issue to self-report. Only 21 percent of resident respondents reported an awareness of fair housing trainings and workshops in their communities. Sixty-three percent of stakeholder survey respondents said that inadequate information about fair housing rights was a somewhat frequent or very frequent impediment to fair housing. Disabled persons are especially impacted by the increase in evictions that resulted from property owners being foreclosed upon beginning in 2008 and There is little legal recourse for tenants who are evicted as a result of foreclosure. Disabled persons find it more difficult to find housing that can accommodate their needs than nondisabled persons and are more likely to fall into a low income category, making it more difficult to find new housing that meets their needs and that they can afford. Several jurisdictions studied have greater percentages of persons who are disabled than the County average of 10.4 percent, which is in line with the state average of 10.3 percent. These jurisdictions include Pinole (14.3 percent), Pittsburg (14.1 percent), Antioch (13.4 percent), Walnut Creek (12.3 percent), Pleasant Hill (12 percent), San Pablo (11.9 percent), and Concord (11.5 percent). Stakeholders reported that a lack of formal policies and procedures regarding reasonable accommodation remains an issue, especially as applied to small rental property owners. They also noted that transitional and permanent supportive housing faces resistance throughout the County. 116
120 Among resident survey respondents, the leading reasons for experienced housing discrimination are race (cited in 44 percent of incidents), national origin (28 percent), and familial status (28 percent). Almost three-quarters (72 percent) of incidents occurred in rental housing by a landlord or property manager. However, among stakeholder survey respondents over one-third of respondents noted mental disability (39 percent), physical disability (38 percent), and familial status (38 percent), while 31 percent mentioned race. Half of stakeholder respondents to the survey indicated that local land-use controls and zoning very frequently or somewhat frequently prohibit the development of multi-family housing. Stakeholders that were interviewed indicated that local processes for building approvals can be complicated and discourage construction of affordable housing. Rather than having a system of building approvals by right where approvals can be obtained if all regulatory conditions are met, local governments sometimes require separate approvals for every aspect of the development process and stipulate public hearings that invite community opposition. Impediments 1. Education and public perception. Inadequate information on fair housing issues and a lack of understanding about the potential extent of housing discrimination exists. 2. Housing affordability. The high cost of housing and the extreme burden of those costs, particularly for renters, present a barrier to fair housing choice. Also, low vacancies and lack of affordable housing options contribute to these issues. Concentration of the limited affordable housing supply is also a fair housing concern. 3. Home purchase loan denials. Significant disparity between races and ethnicities in loan denial rates exists. Minorities are more likely to be denied loans than whites, even in high income categories. 117
121 4. Disability and elder care issues. Availability and access to housing for individuals with physical and mental disabilities is a rapidly emerging impediment to fair housing. Further, insufficient education and enforcement around issues of reasonable accommodations results in discrimination against individuals with disabilities. 5. Local Building Approvals. Lengthy, complex and extensive local review and approval processes discourage construction of affordable housing. Local governments sometimes require separate approvals for every aspect of the development process and sometimes stipulate public hearings that invite community opposition, which can have the same effect as exclusionary zoning. Recommendations To address impediments identified in the study, the report offers a set of recommendations for consideration. Recommendation # 1: Increase Public Awareness of Fair Housing Rights The Contra Costa County Consortium could strengthen efforts to make the public aware of fair housing rights and further emphasize how reporting fair housing violations can have positive outcomes. This would include providing communities information on fair housing laws and policies, model zoning ordinances, and advice from other communities that have succeeded in overcoming regulatory impediments to fair housing choice. Recommendation #2: Improve Financial Assistance for Housing High housing costs and cost burden to both buyers and renters may be reduced through direct and indirect financial assistance programs. There is a variety and volume of programs available to low/moderate-income people. Real estate professionals, lenders and rental property owners often do not know what is available and what qualifications are for the various programs. All 118
122 could benefit from more information on the availability of home finance and rental subsidy programs (including both tenant-based and project-based subsidies). In order to increase the number of households who are served by these programs, there needs to be additional funding and increased efficiencies in program delivery. Members of the Contra Costa County Consortium could support efforts to increase funding through local, State and federal initiatives; lower development costs of new affordable housing; and allow for innovative housing options such as tiny homes and accessory dwelling units. Recommendation # 3: Review Home Purchase Loan Denial Figures with Local Lenders Significant disparity between races and ethnicities in loan denial rates exists. Minorities are more likely to be denied loans than Whites, even in high income categories. The Contra Costa County Consortium should further research the extent of these issues and review this information with Fair Housing Organizations and local lenders. Both members of the Consortium and the Fair Housing Organizations should report the disparate impact to lenders, encourage them to examine loan approval policies and procedures within that context and indicate what affirmative steps, as appropriate, that they might take to address this apparent issue. Members of the Consortium have some established networks such as the Home Equity Preservation Alliance and lists of preferred lenders that may be able to serve as a base for growing outreach on these issues. Recommendation # 4: Increase Access to Special Needs Housing The Contra Costa County Consortium should gather more information of this emerging impediment and determine the extent to which the available supply of supportive housing is limited particularly for individuals with physical and mental disabilities. Members of the Consortium should examine and develop more formal policies and procedures regarding reasonable accommodation and better inform landlords, especially small rental property owners. Promoting best practices for alternative types of special needs/elderly housing and considering policy changes may be in order. Shaping community attitudes as described in the first recommendation may also be necessary to confront this barrier. 119
123 Recommendation #5: Review Municipalities Planning Code and Offer Incentives The Contra Costa County Consortium should encourage local governments to examine the review and approval processes that discourage construction of affordable housing with respect to elements that have the unintended consequence of impeding such development. As observed in the findings, local governments sometimes require separate approvals for every aspect of the development process and sometimes stipulate public hearings that result in community opposition, which can have the same effect as exclusionary zoning. Local building and zoning codes could be modified to simplify local processes for building approvals and more effectively encourage construction of affordable housing as well as special needs housing. X. Fair Housing Action Plan Based on the Analysis of Impediments to Fair Housing Choice, the Consortium proposes specific goals and action aimed at overcoming barriers to fair housing choice and expanding public awareness of fair housing issues throughout the County. This plan contains long- and short - term goals. Its supporting actions are specific, measurable, attainable and realistic, and they correspond directly with impediments identified in the preceding section. Appropriate maps are available in the AI to support all recommendations. The plan is informed by a report on the progress and the success of actions to affirmatively further fair housing taken by the County as well as accomplishments of other jurisdictions and organizations that address fair housing issues. As described in the body of the AI, the Consortium has made significant progress in addressing impediments since the last AI was published in Data analysis, survey results, focus groups, and interview records indicate past barriers are being removed. There is increased investment in affordable housing and the creation of assistance programs for low income households, greater outreach to community partners working to address fair housing concerns, and progress on strengthening policies and 120
124 local ordinances to protect rights and encourage best practices. Nonetheless, the following impediments remain and present barriers which this plan is designed to address: Inadequate information on fair housing issues and a lack of understanding about the potential extent of housing discrimination exists. The high cost of housing and extreme burden those costs place, particularly on renters, present a barrier to fair housing choice. Also, low vacancies and lack of affordable housing options contribute to these issues. Concentration of the limited affordable housing supply is also a fair housing concern. Significant disparity between races and ethnicities in loan denial rates exists. Minorities are more likely to be denied loans than whites, even in high income categories. Availability and access to housing for individuals with physical and mental disabilities is a rapidly emerging impediment to fair housing. Further, insufficient education and enforcement around issues of reasonable accommodations results in discrimination against individuals with disabilities. Lengthy, complex and extensive local review and approval processes discourage construction of affordable housing. Local governments sometimes require separate approvals for every aspect of the development process and sometimes stipulate public hearings that invite community opposition, which can have the same effect as exclusionary zoning. A set of tables containing the specific goals and actions appear on the following pages. 121
125 Goal Duration Action Steps Responsibility Completion Deliverable Comments Goal # 1: To Increase Public Awareness Long-term of Fair Housing Rights a) Contract with Fair Housing Services or consultant(s) to educate County residents, tenants, and owners and agents of rental properties regarding their fair housing rights and responsibilities Consortium Members 2017 Service contracts with each jurisdiction of the Consortium; assignments related to standardizing public information materials Countywide Expect to renew contracts every fiscal year; plan joint semiannual meetings with fair housing providers b) Update existing guidance on fair housing rights to include recent changes in protected classes and equal access Fair Housing Services 2017 Content for website and brochures with consistent message and inclusive delivery Refer to HUD Exchange for updated guidance and coordinate content production from County c) Promote and coordinate expansion of outreach to the community regarding fair housing rights Consortium Lead 2018 Campaign to highlight the single toll-free telephone number for fair housing services; strategies to jurisdictions and pre-prepared content for trade publications Involve Home Builders, Realtors, Property Management Association, and small landlords d) Diversify form and content of outreach Fair Housing Services 2019 Alternatives to traditional fair housing outreach that reach different populations or present a fresh way of sharing information; also, develop a LAP Collect best practices and outcomes to share with grantees. (This will be ongoing and updates will be provided annually in CAPER.) 122
126 Goal Duration Action Steps Responsibility Completion Deliverable Comments Goal # 2: To Improve and Better Utilize Financial Assistance for Housing Short-term a) Continue to support and expand development of new affordable housing and preservation of existing affordable housing, which include the CDBG, HOME, and HOPWA Programs b) Publicize information about housing assistance programs, especially rental assistance with referral feature for available housing Consortium Members 2017 Action Plan budget allocation percentages maintained with minimum reduction; project selection criteria that relate to new State resources, e.g. Housing Trust Fund and Rapid Rehousing Consortium Lead 2017 Annual update/distribution of material; update County website list of subsidized rental housing; maintain interactive map of affordable rental units Coordinate funding levels from within the Corsortium and CCD Lead report performance in CAPER; also improve efficiencies through innovative housing options, e.g., tiny homes and accessory dwelling units Include information rental assistance programs; create list of realtors, brokers, banks, credit unions etc. c) Continue to fund agencies that facilitate tenant/landlord dispute resolution or other dispute resolution services Consortium Members 2017 Reduced evictions and greater lease renewals Collect and monitor data on tenant rent increases; promote rights of protected classes and equal access d) Diversify information on the availability of home financing and rental subsidy programs Consortium Members 2018 Expanded multi-lingual services and outreach to special needs population and the organizations that serve these populations Ensure website and social media has all materials in Spanish that serve these populations (will be necessary to establish best modes of outreach and coordination) 123
127 Goal Duration Action Steps Responsibility Completion Deliverable Comments Goal # 3: Review Home Purchase Loan Denial Figures with Local Lenders Short-term a) Require their respective fair housing consultant(s) to review and monitor HMDA data in regards to loan denial rates among racial/ethnic minorities b) Support consumer credit and homebuyer education programs to educate borrowers about perils of subprime lending c) Utilize preapproved lenders and encourage them to examine loan approval policies and procedures d) Prefer lenders with Community Reinvestment Act (CRA) rating of Outstanding when selecting new participants of first time homebuyer programs Consortium Members Consortium Members Consortium Members Consortium Members 2017 Reports of any disparate impacts between racial and ethnic minorities to the Consortium members and possible enforcement action Refer cases as appropriate to State and Federal complaint centers 2019 Expanded course curriculum In addition to current counseling agencies, interest other agencies in these deliveries 2017 Documentation of review by lenders Include established networks such as the Home Equity Preservation Alliance; indicate what affirmative steps lenders might take to address this apparent issue 2018 Review of CRA rating reports In addition, review lenders most recent HMDA reporting published by Federal Financial Institutions Examination Council (FFIEC) 124
128 Goal Duration Action Steps Responsibility Completion Deliverable Comments Goal # 4: Increase Access to Special Short-term Needs Housing a) Adopt formal policies and procedures, in jurisdictions that have none, for persons with disabilities to request reasonable accommodations to local planning and development standards Consortium Members 2017 New appeals process within jurisdictions that presently do not offer such protection Gather more information to determine extent to which the available supply of supportive housing is limited particularly for individuals with physical and mental disabilities; use County policy as model for other jurisdictions b) Promote best practices for alternative types of special needs/elderly housing and considering policy changes Consortium Members 2017 Prototypes of housing designs that permit vulnerable populations to gain access, receive services/age in place (this includes development of accessory dwelling units by reducing fees for new units), placement services for seniors, and expanded use of VASH vouchers Reflect changes in plans, program descriptions and funding requests for CoC, PHA, etc. (Also, follow new State legislation to further encourage accessory dwelling units) c) Educate tenants, and owners and agents of rental properties Fair Housing Service Providers 2018 Targeted outreach to property owners and representatives that have not received past notification Include landlords and small property owners with scattered site units 125
129 Goal Duration Action Steps Responsibility Completion Deliverable Comments Goal # 5: To Review Municipalities Planning Code and Publicize Incentives Long-term a) Examine the review and approval process to identify opportunities to streamline and simplify action on affordable projects Consortium Members 2018 Report recommending possible changes in zoning, land use and building permit issuance Confer with both planners, developers and builders b) Publicize the density bonus ordinance and encourage developers to utilize the ordinance in order to create affordable housing Consortium Lead 2018 Media campaign to draw attention to recent successes in the region (e.g. as a 25% parking reduction permitted with the inclusion of very low Income rental housing units); updates of promotional material and outreach strategies Track progress to determine whether further changes are necessary in other jurisdictions and promote consideration of similar incentives c) Develop policy for priority review to affordable housing projects as needed Consortium Members 2019 Model development codes, including one adopted recently in the region which streamlines the review process for many types of development; facilitate information sharing and networking among municipalities Compile best practices from other states, ask APA and ICMA for best practices 126
130 Appendix 1 List of Stakeholder Interviews Appendix 2 Past Impediments and Actions Appendix 3 Maps Appendix 4 Comprehensive Housing Affordability Strategy (CHAS) Tables Appendix 5 Survey Questionnaires Appendix 6 Local Building Codes Appendix 7 Affordable Housing Resources 127
131 APPENDIX 1 List of Stakeholder Interviews Fifteen stakeholders were contacted for interviews. The six stakeholders below responded and interviews were held on the dates noted. The stakeholders who did not respond were contacted again to follow, but they did not reply. 1. Bay Area Legal Aid Naomi Young August 4, Contra Costa Association of REALTORS Heather Schiffman August 8, Contra Costa Interfaith Housing Louise Bourrasa August 4, East Bay Apartment Management Association Lisa Vorderbrueggen September 27, Contra Costa County Housing Authority Joseph Villareal September 26, Richmond Housing Authority Tim Jones August 17, 2106
132 APPENDIX 2 PAST IMPEDIMENTS AND ACTIONS PAST IMPEDIMENTS 1. IMPEDIMENT: Lack of sufficient affordable housing supply Action: Provide assistance to preserve existing affordable housing and to create new affordable housing. Assistance will be provided through the Consolidated Plan programs of the Consortium member jurisdictions. These include CDBG, HOME, and HOPWA. ACTION Antioch Antioch allocates CDBG funds to promote Fair Housing activities. The City of Antioch has historically funded BALA and/or Echo to provide fair housing services to its residents. These agencies provide trainings and workshops to landlords, tenants and other interested parties annually. Both agencies are HUD-approved housing counseling agencies, and satisfy HUD's definition of Fair Housing Enforcement Organization and Qualified Fair Housing Enforcement Organization. Concord Concord took the following actions to preserve and create affordable housing a. Preserve affordable housing - The City reserved $300,000 in RDA Housing set-aside funds to assist in rehabilitating a 48-unit multifamily complex in the Monument Corridor, however, due to the State Budget elimination of RDAs and subsequent litigation, these
133 funds are currently unable to be used. The developer also was unsuccessful in securing State funding for the project. b. Preserve affordable housing - The City used $220,000 in RDA Housing set-aside funds for 7 loans to low to moderate income First Time Homebuyers to purchase their first home during the fiscal year. In addition, the City's Housing Rehabilitation Loan and Grant Program provided 6 loans and 33 grants and rebates to rehabilitate housing for low income households utilizing CDBG and RDA funds. 2011/12: Based upon the limited CDBG funding, the City's Housing Rehabilitation Loan and Grant Program still provided 2 loans and 13 grants to rehabilitate housing for low income households utilizing CDBG funds. 2012/13: Based upon the limited CDBG funding, the City's Housing Rehabilitation Loan and Grant Program still provided 2 loans and 13 grants to rehabilitate housing for low income households utilizing CDBG funds. 2013/14: The City's Housing Rehabilitation Loan and Grant Program received eight applications and completed work for four grants.
134 2014/15: The City's Housing Rehabilitation Loan and Grant Program provided twenty-six (24) grants and one loan to rehabilitate housing for low income households utilizing CDBG funds. c. Preserve affordable housing - The City invested $102,652 in CDBG funds and $25,927 in General Funds to conduct Code Enforcement in lower income areas to preserve and protect single family housing stock and neighborhoods. 2011/12: The City invested $59,626 in CDBG funds to conduct Code Enforcement in lower income areas to preserve and protect single family housing stock and neighborhoods. 2012/13: The City invested $59,626 in CDBG funds to conduct Code Enforcement in lower income areas to preserve and protect single family housing stock and neighborhoods. 2013/14: The City invested $55,408 in CDBG funds to conduct Multi-family housing inspections for affordable housing units to preserve and protect single family housing stock and neighborhoods: 2014/15: The City invested $32,620 in CDBG funds to conduct Multi-family housing inspections for affordable housing units to preserve and protect housing stock and neighborhoods.
135 d. Create new affordable housing - The City continues to coordinate with the Urban County on potential housing projects that may be funded with HOME and HOPWA funds. No projects were funded in FY e. Create new affordable housing - The City continues to implement the lnclusionary Housing Ordinance (adopted June 2004), that requires all new residential developments to provide a component of lower or moderate income housing. It includes a 45- year term of affordability for ownership projects, 55 years for rental projects; 10% moderate- or 6% low income for ownership, and 10% low or 6% very low income for rental. Minimal development activity was experienced in Concord during FY 20 I 0-11 and no new inclusionary units were approved or built. Once the existing number of foreclosures declines, the City anticipates some development may begin. 2011/12: Minimal development activity was experienced in Concord during FY and only one new
136 inclusionary unit was built. 2012/13: Minimal development activity was experienced in Concord during FY and only one new inclusionary unit was built. f. The City continues to require housing development sponsors to provide housing on an equal opportunity basis without regard to race, religion, disability, sex sexual orientation, marital status, or national origin. Walnut Creek From , the City of Walnut Creek committed over $8 million dollars to create new affordable housing through land acquisition, predevelopment and development financing. Funding sources included Housing Impact Fees, commercial linkage fees, and CDBG. The City also purchased a remnant Cal Trans parcel and donated it to Habitat for Humanity. The City contributed to affordable housing preservation by refinancing two affordable housing projects and extending both the affordability and loan terms; and also provided CDBG funding for facility improvements.
137 1.2. Action: Offer regulatory relief and incentives for the development of affordable housing. Such relief includes that offered under state density bonus provisions. (See housing element programs.) Concord - The City has an existing Density Bonus Ordinance. No project applications were processed during the fiscal year that requested a density bonus. The City's Planning Division prepared a comprehensive update of the City's Development Code, which includes the Affordable Housing provisions of the Code. Affordable Housing provisions include inclusionary housing, density bonus, and a new affordable housing incentive program with regulatory incentives. Planning Commission public hearings were held throughout the year with final hearings in June 2012 and adoption by the City Council on July 24, The Development Code became effective in August Walnut Creek Between , the City granted density bonuses and concessions to two affordable housing projects. Additionally, an affordable project that was entitled prior to 2012, was constructed in 2013 and received a 150% density bonus plus 3 concessions. The City s housing element was certified in 2014, including an extensive opportunity sites list. The opportunity
138 sites are reviewed and updated annually Action: Assure the availability of adequate sites for the development of affordable housing. (See housing element programs.) Concord - Housing Element Policy H-1.1 promotes ensuring an adequate supply of housing sites to achieve the City's Regional Housing Needs Allocation numbers. The City adopted its Housing Element Update ( ) on January 6, As part of that effort an updated inventory was conducted to determine if there are adequate sites available for the construction of the City's Regional Housing Needs Allocation (RHNA). The inventory update concluded that the City does have enough adequately zoned sites to achieve the capacity necessary to meet the City's RHNA over the next 8 years. The City also promotes programs and ordinances and incentives for the development of affordable housing. Pittsburg - From , assisted with 1. La Almenara recorded restriction 11/02/11; 20 units 2. Siena Court recorded restriction 11/09/10; 110 units 3. Santa Fe Commons recorded restriction 11/02/11; 10 units 4. Approval of a loan to Domus for Veterans Square was given 06/15/ CDBG funds were awarded to the County to administer the
139 Housing Rehab program in fiscal years [please fill in] to preserve and expand affordable housing opportunities. 2. IMPEDIMENT: Concentration of affordable housing Action: Housing Authorities within the County (Contra Costa County, Richmond and Pittsburg) will be encouraged to promote wide acceptance of Housing Choice Vouchers, and will monitor the use of Housing Choice Vouchers to avoid geographic concentration. Contra Costa County - From , more than $19.8 million of the County s CDBG, HOME, NSP, and HOPWA resources was allocated to develop new units and rehabilitate existing units of affordable housing in different regions of the County. In addition, resources were provided for single-family rehabilitation programs, first time homebuyer programs, and fair housing counseling, legal services, and outreach. Concord - Concord has no public housing authority, therefore, 2.1 does not apply. While Concord has no jurisdiction over the above Housing Authorities, the Housing division receives calls from persons seeking assistance, and provides information and referral services to the Housing Authorities. Pittsburg - The Housing Authority has over 1100 HCV/VASH throughout Pittsburg. The tenants are given the opportunity to
140 choose where they want to live. The challenge for Pittsburg isn t concentration, it s finding available housing. In 2017, a landlord workshop will be conducted to encourage property owners/managers throughout Pittsburg, to lease to HCV clients Action: Consortium member jurisdictions will collaborate to expand affordable housing opportunities in communities in which they are currently limited. Concord The Consortium met during FY to discuss affordable housing opportunities and reviewed HOPWA applications. One of the recipients of HOPWA funds was the Riley Court Project (48-unit rental) where funds were to be utilized toward a substantial rehabilitation. Due to the elimination of RDA funds committed to the project and a lack of MHP State funds, the project moved forward on a smaller scale using HOPWA funds. In 2012, the City of Concord adopted a new Development Code which streamlines the review process for many types of development by requiring a staff level review and an Administrative Use Permit which does not require a hearing. Other developments require review by the Design Review Board which is advisory to staff and for which a limited number of meetings are scheduled. Use Permits for multifamily developments are approved by the Planning Commission and are not required to go
141 before the City Council unless appealed, or if a General Plan Amendment or Re-zoning is required. The City expedites multifamily development in the review process. Walnut Creek - Through the City s inclusionary ordinance, ownership residential projects can provide affordable units on site or pay a fee. When units are provided on site it increases the distribution of affordable units throughout the City. Between , 11 affordable ownership units were developed through the inclusionary ordinance Action: A higher priority for the allocation of financial and administrative resources may be given to projects and programs which expand affordable housing opportunities in communities in which they are currently limited. Concord a. The City's Housing Element Update, adopted January 201 5, includes Program H which streamlines the processing of building permits for residential developments that include units below-market rate (BMR). Building permits for the Wisteria project (including BMRs) were streamlined. The City spent a large amount of effort during the fiscal year on advanced planning projects including the next step for the Complete Streets initiative, which includes the Bike and Pedestrian Master Plan, which is anticipated to be completed during FY In addition, the process for selection of a master
142 developer for the City's Reuse Plan at the Concord Naval Weapons Station has been progressing with selection of a master developer anticipated in September The Reuse Plan will include approximately l 2,200 housing units with 25% of those planned as affordable. The City's Housing Element Update and Development Code Update through the Affordable Housing Incentive Program are geared toward attracting affordable housing to the City by providing incentives for affordable developers. b. The City's Development Code (adopted July 24, 2012) includes an Affordable Housing Incentive Program geared toward encouraging the development of housing affordable to a broad range of households with varying income levels within the City. The new Program is intended to ensure that a minimum percentage of units affordable to very low, low, and/or moderate income individuals is included within new residential developments and that appropriate incentives are established to encourage affordable units beyond the minimum. Contra Costa County - CDBG funds were awarded to the County to administer the Housing Rehabilitation program in fiscal years 2014-
143 2015 and to expand and preserve affordable housing opportunities. Walnut Creek - The City administers a First Time Homebuyer Downpayment Assistance program (FTHB) that can help to make homeownership affordable to moderate income households throughout the City. Between , the City processed 16 downpayment assistance loans Action: Member jurisdictions will report on the location of new affordable housing in relation to the location of existing affordable housing and areas of low income, poverty and minority concentration. Concord a. Staff has met with a variety of affordable developers throughout the year, however no new affordable housing is currently in the pipeline for development. The sites inventory conducted as part of the Housing Element Update has determined that the City has adequate capacity through appropriately zoned sites to provide the amount of affordable housing necessary to meet the City's Regional Housing Needs Allocation over the next 8 years. Staff has met with a variety of affordable developers throughout the year, however no new affordable housing is currently in the pipeline for development. The sites inventory conducted as part of the Housing Element Update has determined that the City has adequate capacity through appropriately zoned sites
144 to provide the amount of affordable housing necessary to meet the City's Regional Housing Needs Allocation over the next 8 years. b. The City received grant funding through ABAG/MTC toward the development of a Downtown Specific Plan with the goal of increasing housing density, particularly for affordable housing, intensifying transit opportunities and optimizing connections. The 18-month project was concluded on June 24, 2014, when the City Council adopted the Downtown Specific Plan which encourages the development of approximately 4,200 units during the next 25 years. The Downtown Steering Committee for the Specific Plan selected a Preferred Alternative for the Specific Plan which has a heavy housing focus. The Alternative was further developed and a wide range of implementation strategies were developed to attract downtown growth in the short-, mid- and long-term. c. The City has a great deal of affordable housing, much of it concentrated in the lower income Monument Corridor, with others focused downtown and along Clayton Road. The City is attempting to relieve this concentration through
145 adoption of an Inclusionary Housing Ordinance, efforts to construct housing near BART and transit hubs, and through the Concord Naval Weapons Station base closure process, which is ongoing. Two projects were rehabilitated during including the Robin Lane Apartments (16 units in Monument Corridor) and the Grant Street Apartments (at 3142 Grant St in North Concord) both of which provide housing to very low and low income households, respectively. d. The Concord Reuse Plan Area Plan adopted by the City Council in January 2012, included a commitment toward affordable housing with a stated requirement of 25% of the overall units (12,200), targeted as affordable. The City is currently in the process of retaining a master developer for the site. In January 201 5, staff will recommend two finalists to the City Council. After a series of negotiations, one firm will be selected by the Council sometime in The successful company will be responsible for conducting more detailed planning/design and engineering studies, providing all of the infrastructure for the site, including roads, sewer, water, power, as well the financing and successful phasing of the project over many years. After the site is improved,
146 the master developer will likely partner with other companies to build the residential, retail, commercial and community facilities called for in the plan. While the city is selecting a master developer, the Navy, which still owns the property, is completing approval processes so it can begin to transfer the land to civilian entities in late 2015 or early Contra Costa County - The County compiles and annually updates a complete list of all subsidized affordable rental housing available in all cities. This list provides the type of housing (senior, family, HIV/AIDS, disabled adults, etc.), number of units which are affordable, address and city, and contact information for property management. All jurisdictions utilize this list when receiving telephone inquiries about affordable rental housing. Walnut Creek - Walnut Creek does not have any areas of low-income, poverty and minority concentration. The city has a map of all the affordable housing locations on their website. 3. IMPEDIMENT: Differential origination rates based on race, ethnicity and location.
147 3.1. Action: Member jurisdictions will periodically monitor Home Mortgage Disclosure Act (HMDA) data and report significant trends in mortgage lending by race, ethnicity and location Action: When selecting lending institutions for contracts and participation in local programs, member jurisdictions may prefer those with a Community Reinvestment Act (CRA) rating of Outstanding. Member jurisdictions may exclude those with a rating of Needs to Improve, or Substantial Noncompliance according to the most recent examination period published by the Federal Financial Institutions Examination Council (FFIEC). In addition, member jurisdictions may review an individual institution s most recent HMDA reporting as most recently published by the FFIEC. 4. IMPEDIMENT: Lack of knowledge about the requirements of mortgage lenders and the mortgage lending/home purchase process, particularly among lower income and minority households Action: Member jurisdictions will support pre purchase counseling and home buyer education programs. Concord a. During , the City conducted monthly HUD-certified First Time Homebuyer classes (all day Saturdays), to provide potential buyers with homebuyer education to those interested in buying their first home. These efforts were funded by RDA funds and by the City's Inclusionary Housing In-Lieu funds.
148 b. Beginning FY 2013/14, the City referred potential first time homebuyers interested in the City's program to certified HUD First Time Homebuyer education programs and required a HUDcertified certificate as evidence of their attendance at such a program, as part of their application submittal documents for the City's program to provide potential buyers with homebuyer education to those interested in buying their first home. Contra Costa County - From there were 622 rental units that were created or rehabilitated throughout the County for lowincome households; 389 homeowner units that were constructed and/or rehabilitated throughout the County for low-income households. There were 355 units that were developed or rehabilitated for non-homeless Special Needs households, which included Elderly/Frail Elderly, persons with disabilities, persons living with HIV/AIDS, and victims of domestic violence. Pittsburg - SA funds PCSI [JA1]for housing counseling services including: mortgage delinquency and default counseling to
149 homeowners facilitate tenant/landlord dispute resolution or such other dispute resolution services conduct pre- and post- purchase counseling with homebuyers provide free of charge information and referral services regarding home ownership to households within the City. refer homeowners that require credit maintenance and money management services to a credit counseling agency Walnut Creek - Walnut Creek requires that all program participants (for BMR and FTHB programs) attend a homebuyer certification course Action: Member jurisdictions will support home purchase programs targeted to lower income (low and very low), immigrant, and minority households. Minority households include Hispanic households. Concord a. During FY , the City continued implementation of its First Time Homebuyer (FTHB) Program and closed 7 FTHB loans for low- to median-income households (at 60% to 100% of median income) with loans totaling $222,000 in RDA funds. The Program was promoted through the City's website, the website of Homebricks (the City's administrator for the Program) and through the Mount Diablo Housing Opportunity Center, as well as through the City's First Time Homebuyer classes. The program was put into hiatus in FY
150 2011/12, but was reinstituted in FY 2013/14 to provide for down payment assistance for 2-3 loans per fiscal year for First Time Homebuyers, with Hello Housing administering the program for the City. The City's program provides assistance of $20,000 to $40,000 for eligible households based on income and household size, with income levels between 60%- 100% of Area Median Income Program brochures and applications are available in Spanish. b. During FY , the City contracted with Housing Rights, which provided assistance to low-income households in becoming homeowners through homeowner education and counseling, in addition to conducting fair housing counseling, tenant landlord counseling, and foreclosure prevention counseling. During FY , the City also contracted with Eden Council for Hope & Opportunity (ECHO) Housing to provide assistance to low-income households to conduct fair housing counseling, tenant landlord counseling and continued contracting with ECHO through FY 2012/13. In FY 2013/14 the City also contracted with Eden Council for Hope & Opportunity (ECHO) Housing to provide assistance to lowincome households to conduct fair housing counseling. The City contracted with Bay Area Legal Aid (BALA) for tenant
151 landlord counseling. Pittsburg - HOME funds for down payment assistance to restart in Walnut Creek - Walnut Creek has a downpayment assistance program for low and moderate income households Action: Member jurisdictions will encourage mortgage lenders to responsibly market loan products to lower income (low and very low), immigrant, and minority households. Minority households include Hispanic households. Concord - The City's First Time Homebuyer Program requires that homebuyers receive a 30-year fixed mortgage product. Loan applications are reviewed to confirm the homebuyer is receiving a competitive rate and reasonable closing costs. Buyers' rates ranged from 4.25% to 5.5% and a few used CALHFA products. Housing Program staff coordinated with HomeBricks staff to implement a preferred lender program to achieve better loan products and streamline the process for the homebuyer. Walnut Creek - In the fall of 2007, housing staff from the City of Walnut Creek, Contra Costa County, and the City of Richmond convened a series of meetings regarding the region's increasing difficulties with the sub-prime mortgage crisis and the rapidly increasing number of home foreclosures. The jurisdictions met with all of the non-profit agencies countywide that are providing home
152 loan counseling and low cost legal services. The agencies reported tremendous increases in calls for assistance due largely to calls for mortgage counseling, and difficulty in staffing their homeowner counseling functions due to the increase in demand. As a result of these discussions, the non-profit organizations have come together into a collaborative called HEPA (Home Equity Preservation Alliance) to provide coordinated services more effectively and efficiently than if the agencies worked independently. The HEPA Collaborative received CDBG funding from the Cities of Walnut Creek, Antioch, and Contra Costa County between Activities included homeowner information seminars, financial and asset preservation counseling, renter information seminars, one-onone counseling, and legal services. The HEPA team facilitated an annual foreclosure prevention workshop in Walnut Creek where residents can get one-on-one assistance, counseling, legal advice, and resources. 5. IMPEDIMENT: Lower mortgage approval rates in areas of minority concentration and low income concentration Action: Member jurisdictions will support home purchase programs targeted to households who wish to purchase homes in Concord - The City's First Time Homebuyer Program completed seven loans during FY 2010/11; however, it was put on hold due
153 Census Tracts with loan origination rates under 50 percent according to the most recently published HMDA data. to the loss of Redevelopment funding. City staff has contacts with Spanish-speaking loan agents that are also listed on the City's Preferred lender list Action: Member jurisdictions will encourage mortgage lenders to responsibly market loan products to households who wish to purchase homes in Census Tracts with loan origination rates under 50 percent according to the most recently published HMDA data. Concord - City staff has contact with Spanish-speaking Joan agents that are also listed on the City's Preferred lender list to market to both English and Spanish speaking low-income clients. The City also coordinated the subordination of existing loans to assist existing eligible homeowners in the FTHB Program or Rehabilitation Loan Program to achieve better interest rates through a refinance of their homes. 6. IMPEDIMENT: Lack of knowledge of fair housing rights Action: Support efforts to educate tenants, and owners and agents of rental properties regarding their fair housing rights and responsibilities. Concord - Concord allocated resources to encourage and facilitate the development of affordable housing, as detailed in this CAPER. To ensure fair access to housing for all in Concord, the City invested $70,000 in resources for fair housing and tenant/ land lord counseling services through Housing Rights; $40,000 to provide one-stop services for housing and tenant/landlord issues at the Mt. Diablo Housing Opportunity Center; and additional $5,000 to provide augmented foreclosurerelated housing services. At least 67 percent of all services were
154 provided to extremely low- and very low-income households. These services were paid for with RDA funds. The City also provided free printing services for all fair housing outreach materials used within the city. Housing rights also held 3 legal clinics during the year, and assisted with coordination on critical tenant issues such as pest control. Housing Rights relocated at the beginning of the fiscal year to the Keller House, co-locating with the Monument Community Partnership to provide better access to residents. Pittsburg - PCSI services funded by SA. Walnut Creek - Walnut Creek funds ECHO Housing to provide Fair Housing and Tenant/Landlord services to Walnut Creek residents. ECHO housing provides resource materials, and educational workshops for residents. 7. IMPEDIMENT: Discrimination in rental housing Action: Support efforts to enforce fair housing rights and to provide redress to persons who have been discriminated against. Concord Through , the City contracted with Housing Rights and ECHO to provide assistance to enforce fair housing rights. They assisted 26 residents with fair housing issues during the year.
155 Contra Costa County - From , the County allocated $122,400 of CDBG funds to Bay Area Legal Aid to provide Fair Housing services, which included investigation services and outreach. Bay Area Legal Aid and its partner agencies distributed fair housing literature at seven events on an annual basis throughout the County. They also distributed fliers to over 60 nonprofit and governmental agencies throughout the County, explaining the fair housing services that they provide and how to get in contact with them. Outreach was focused in low income communities, many with significant numbers of Spanish speaking and other non-english speaking residents. Pittsburg - PCSI services funded by SA. Walnut Creek - ECHO Housing will investigate and report Fair Housing violations. ECHO housing also conducts annual fair housing tests in Walnut Creek Action: Support efforts to increase the awareness of discrimination against persons based on sexual orientation. Concord - Through , the City contracted with Housing Rights and ECHO to provide assistance to enforce fair housing rights, which included discrimination against residents who have experienced discrimination based on sexual orientation, race, religion, ethnicity or disabilities.
156 Pittsburg - Agreements such as a lease or housing agreement executed by the City, SA, HA, etc. specifically addresses language against discrimination. 8. IMPEDIMENT: Failure to provide reasonable accommodation to persons with disabilities Action: Support efforts to educate tenants, and owners and agents of rental properties regarding the right of persons with disabilities to reasonable accommodation. Concord - Through , the City contracted with Housing Rights and ECHO to promote fair housing assistance and tenant/landlord counseling to provide reasonable accommodation to persons with disabilities. Pittsburg - PCSI services funded by SA. Walnut Creek - Walnut Creek funds ECHO Housing to provide Tenant/Landlord and Fair Housing services Action: Support efforts to enforce the right of persons with disabilities to reasonable accommodation and to provide redress to persons with disabilities who have been refused reasonable accommodation. Concord - Through , the City contracted with Housing Rights and ECHO to promote fair housing assistance and tenant/landlord counseling to provide reasonable accommodation to persons with disabilities. Pittsburg - Agreements such as a lease or housing agreement
157 executed by the City, SA, HA, etc. specifically addresses language against discrimination. 9. IMPEDIMENT: Lack of information on the nature and basis of housing discrimination Action: Monitor the incidence of housing discrimination complaints and report trends annually in the CAPER. Concord - The City monitored incidence of discrimination complaints through review of the quarterly Housing Rights and ECHO reports. No trends have been noted Action: Improve the consistency in reporting of housing discrimination complaints. All agencies who provide this information should do so in the same format with the same level of detail. Information should be available by the quarter year. Concord - All Housing Rights and ECHO reports were submitted by quarter year, with breakdowns regarding type of assistance, household composition, household ethnicity and household income, with a brief summary of the quarter and an outreach report, with the types and number of clinics, mailings, or household distributions conducted. The City will implement reporting online in City Data Services in FY Action: Improve collection and reporting information on discrimination based on sexual orientation and failure to provide reasonable accommodation to persons with disabilities. Concord - During , the City's Housing Program continued to coordinate with Housing Rights and ECHO through quarterly reporting in monitoring trends and incidents of discrimination.
158 10. IMPEDIMENT: Lack of formal policies and procedures regarding reasonable accommodation Action: Jurisdictions which have not done so will adopt formal policies and procedures for persons with disabilities to request reasonable accommodations to local planning and development standards. Concord - The City has completed this action. The City's Municipal Code, Section through -220, pursuant to the federal Fair Housing Amendments Act of l 988, the Americans with Disabilities Act, and the California Fai r Employment and Housing Act, provides people with disabilities, reasonable accommodation as necessary to ensure equal access to housing and a process for individuals with disabilities to make requests for reasonable accommodation in regard to relief from the zoning rules, policies, practices and/or procedures of the City. Contra Costa County - The County s Mortgage Credit Certificate program reserves 40 percent of its allocation for households with incomes at or below 80 percent of area median income. Lenders have been cooperative with this program, and 150 Mortgage Credit Certificates were provided to low-income households through Walnut Creek - In 2014 the City of Walnut Creek adopted a Reasonable Accommodation Ordinance that outlines the policy and procedure for requesting reasonable accommodation in the application of local planning, zoning, and building standards.
159 11. IMPEDIMENT: Transitional and supportive housing is not treated as a residential use subject only to those restrictions that apply to other residential uses of the same type in the same zone, and is not explicitly permitted in the zoning code Action: Jurisdictions which have not done so will amend their zoning codes to treat transitional and supportive housing types as a residential use subject only to those restrictions that apply to other residential uses of the same type in the same zone, and to explicitly permit both transitional and supportive housing types in the zoning code. Concord - The City's new Development Code currently lists transitional and supportive housing (group homes) under the category of residential uses as a Permitted Use in both the Industrial Business Park and Industrial Mixed Use zoning districts, similar to Live/Work units. The Development Code was adopted on July 24, Walnut Creek - In 2014, the City of Walnut Creek amended its zoning codes to treat transitional and supportive housing types as a residential use subject only to those restrictions that apply to other residential uses of the same type in the same zone, and to explicitly permit both transitional and supportive housing types in the zoning code. 12. IMPEDIMENT: Permanent emergency shelter is not permitted by right in at least one appropriate zoning district Action: Jurisdictions which have not done so will amend their Concord - The City's new Development Code lists Emergency or
160 zoning codes to permit transitional and supportive housing by right in at least one residential zoning district. Homeless Shelters under the category of residential uses as a Permitted Use in the Office Business Park, Industrial Business Park and Industrial Mixed Use zoning districts, similar to Live/Work units. The Development Code was approved by the City Council on July 24, Walnut Creek - The City of Walnut Creek amended its zoning codes to permit transitional and supportive housing by right in at least one residential zoning district.
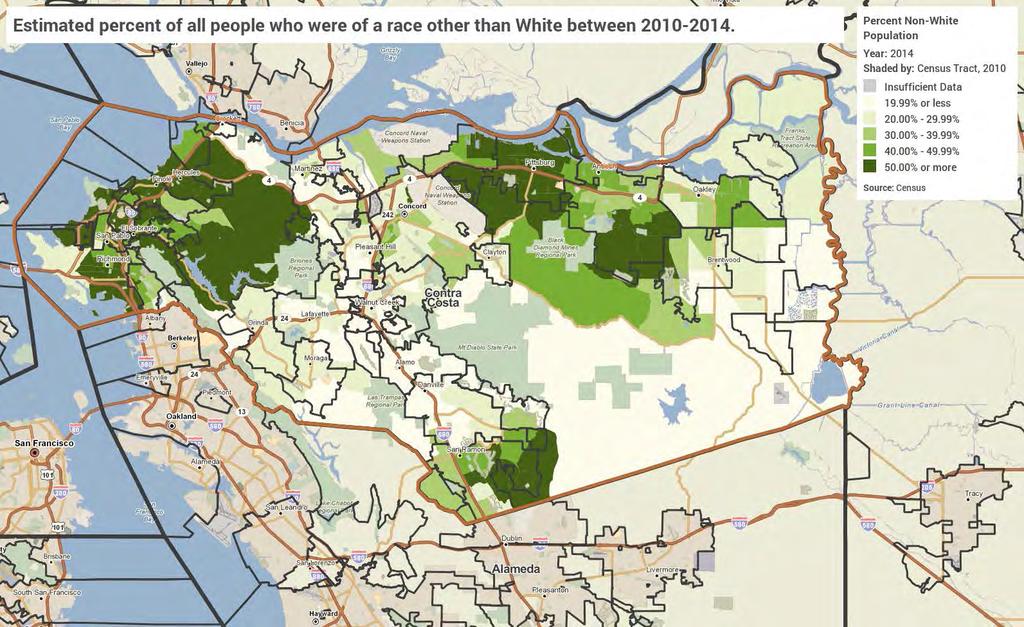
161
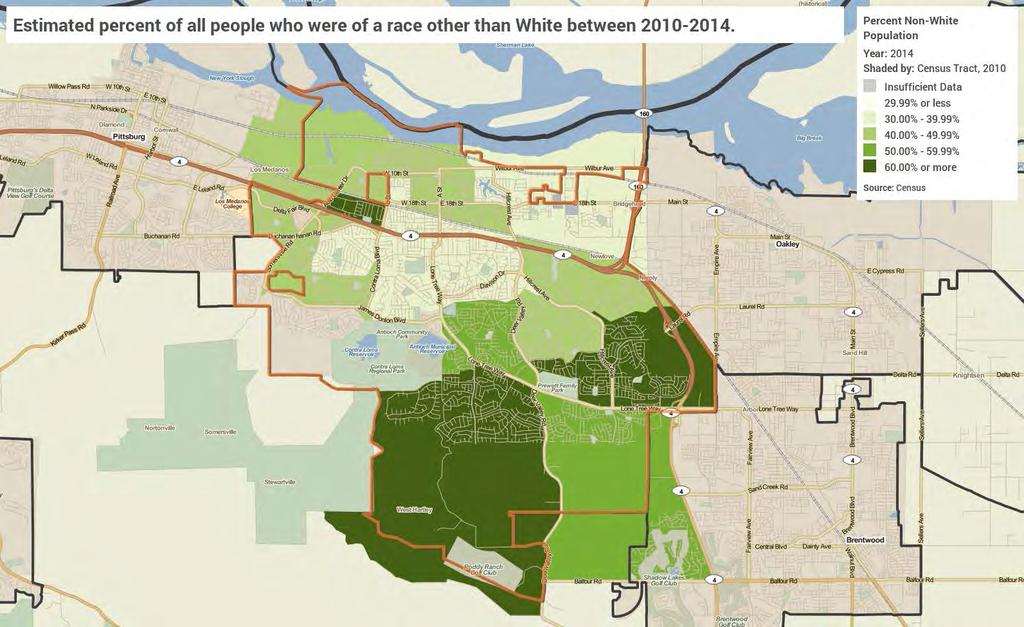
162

163
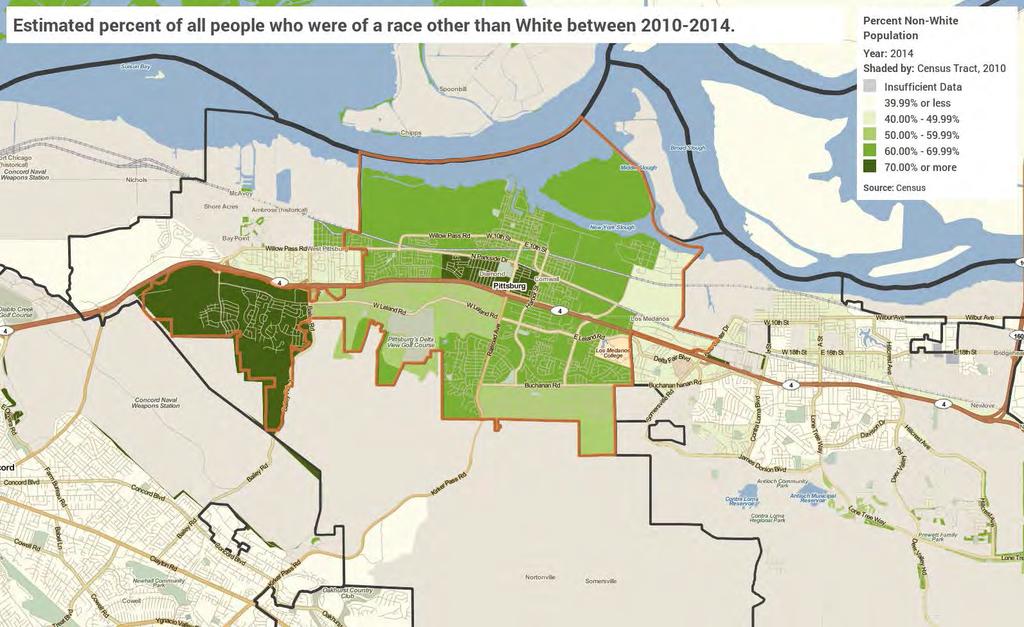
164
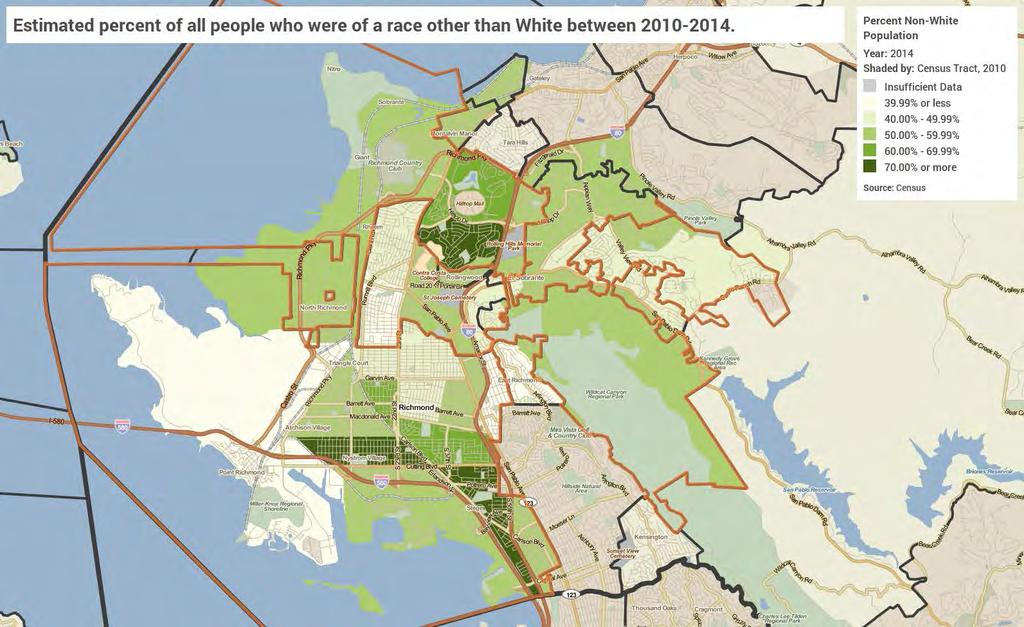
165
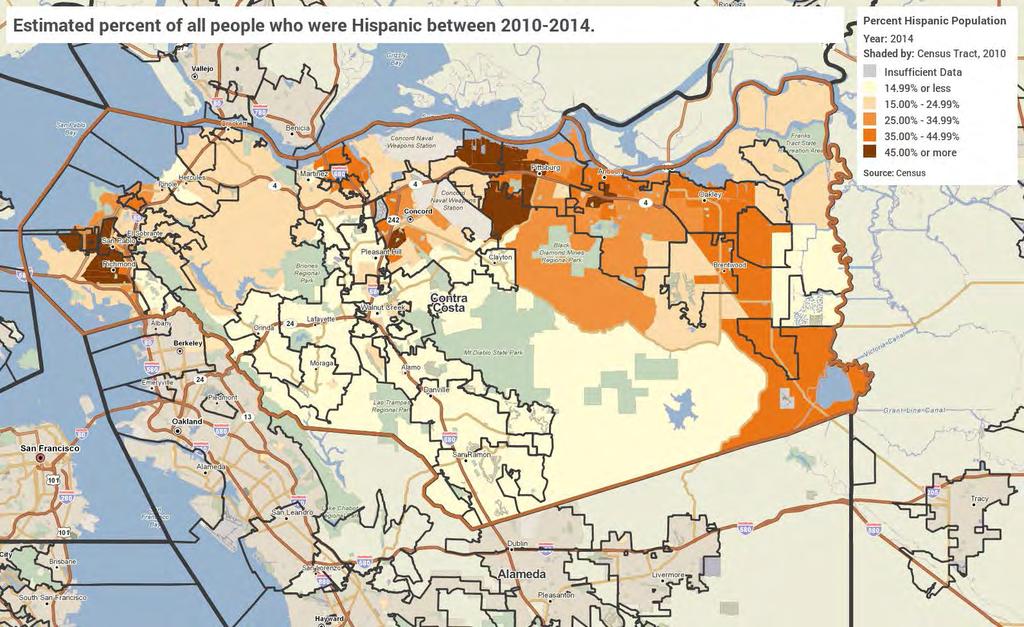
166
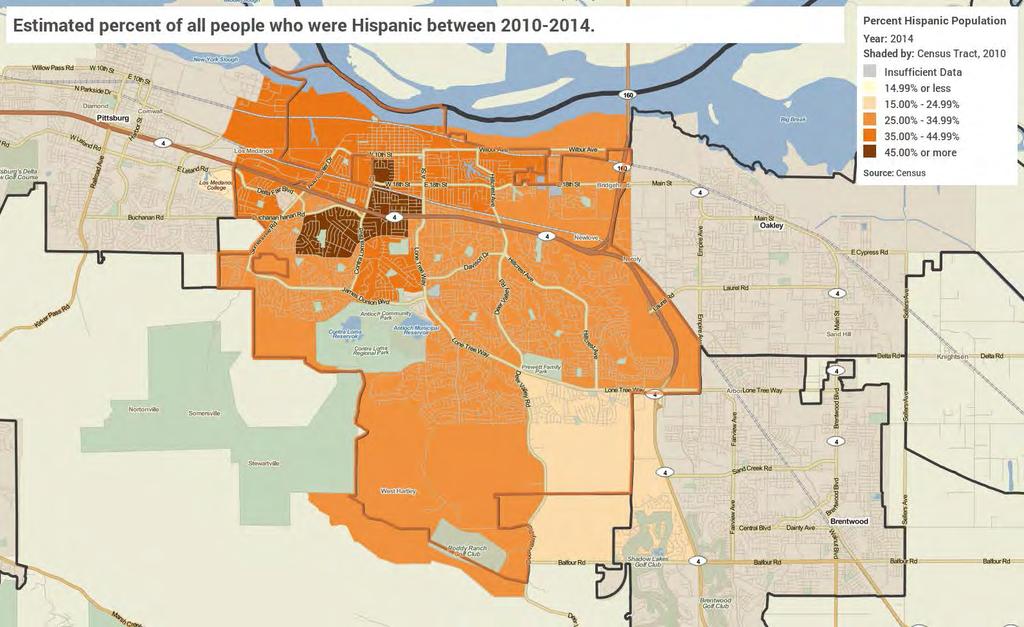
167
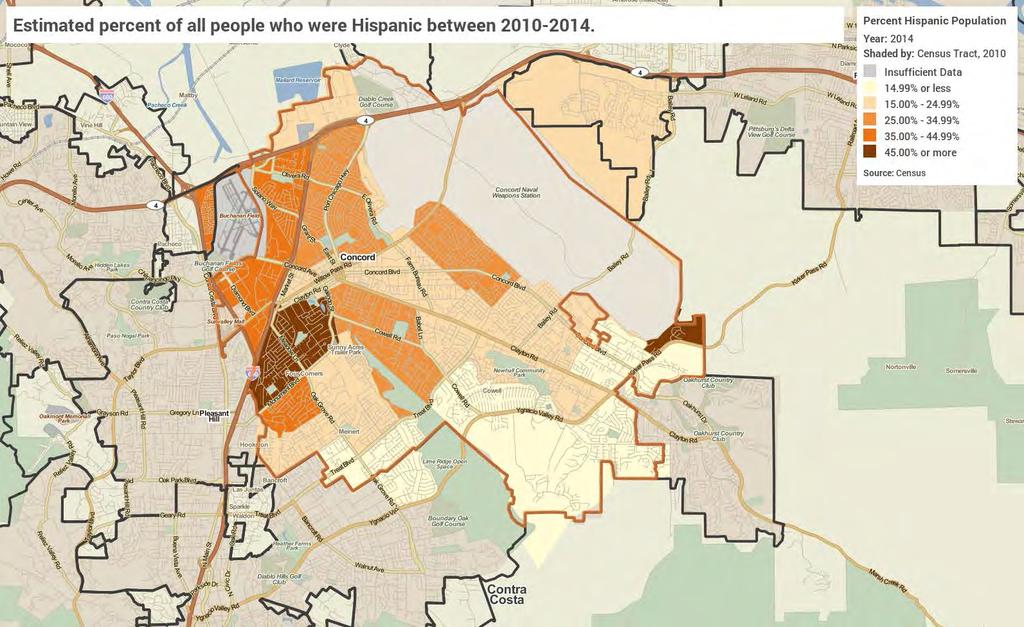
168
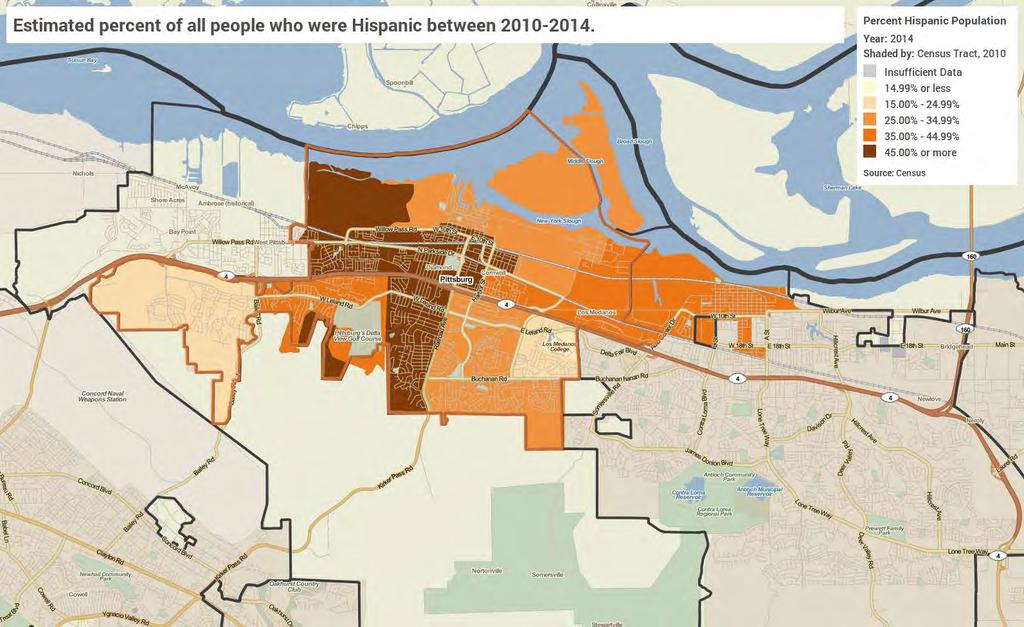
169
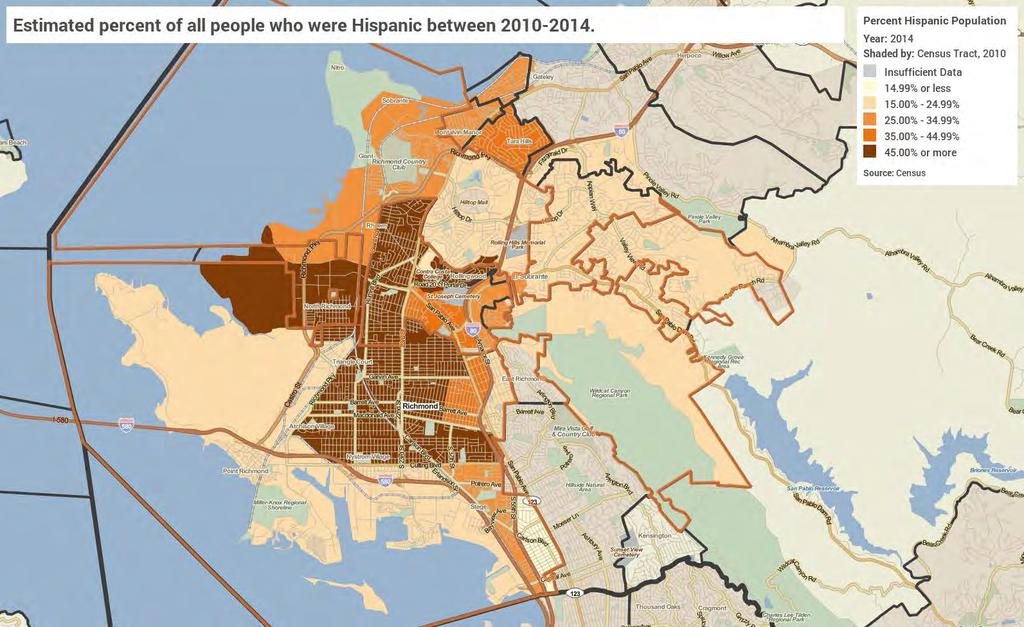
170
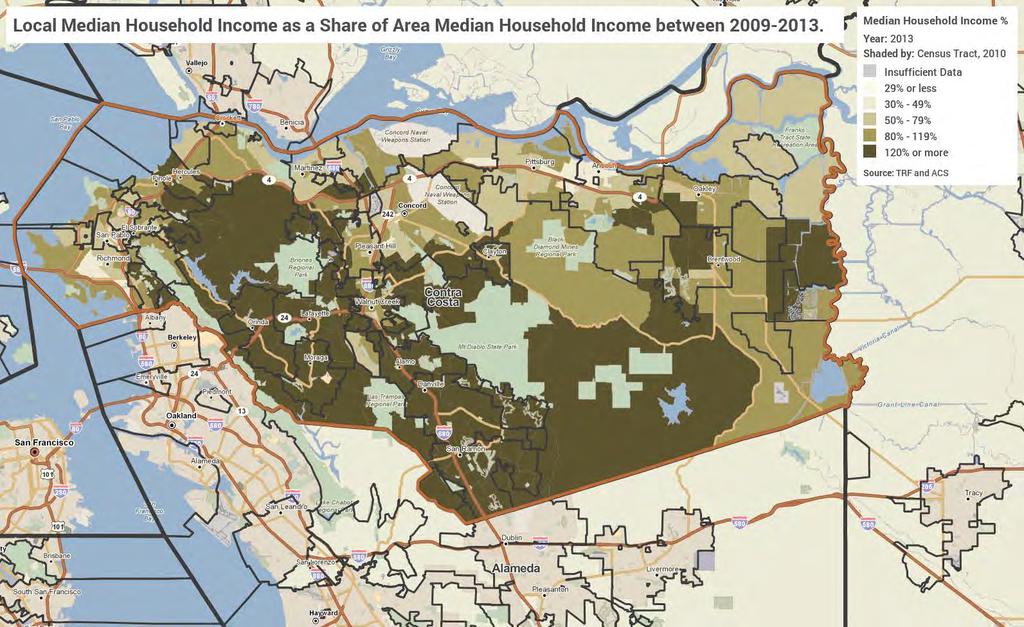
171
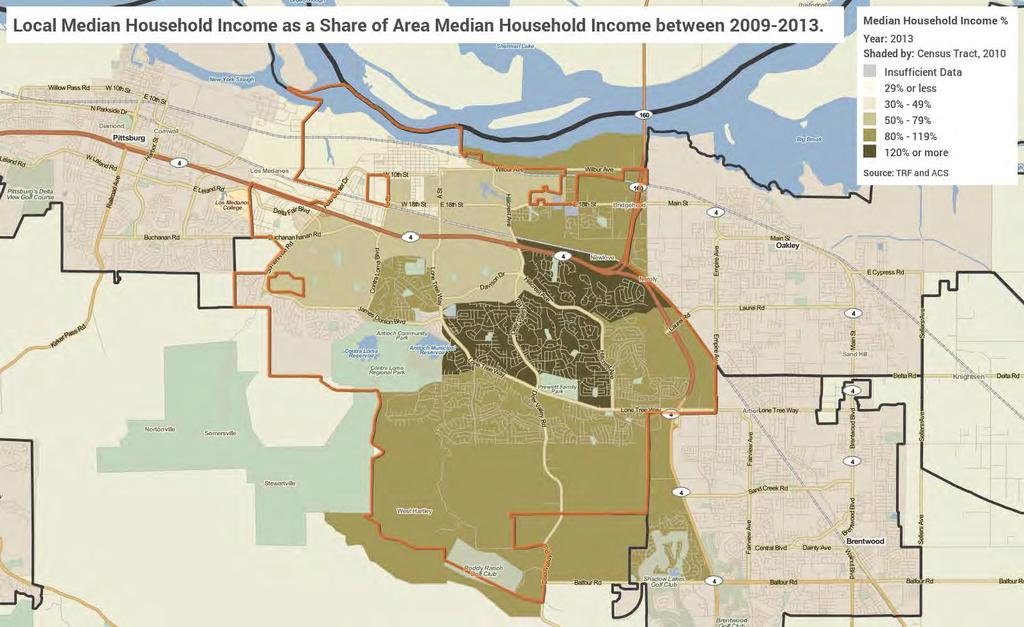
172

173
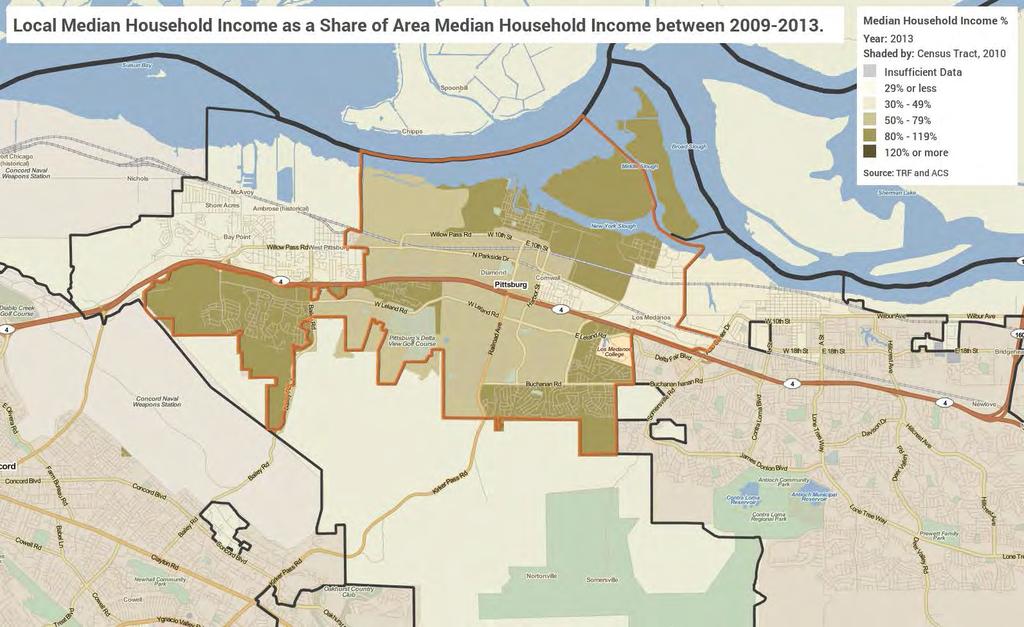
174
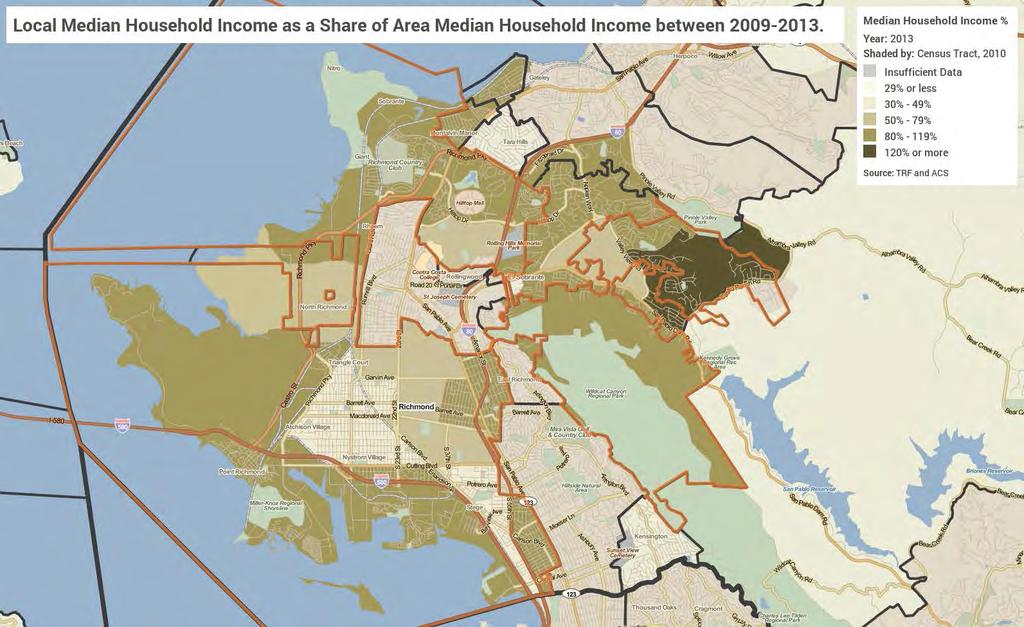
175
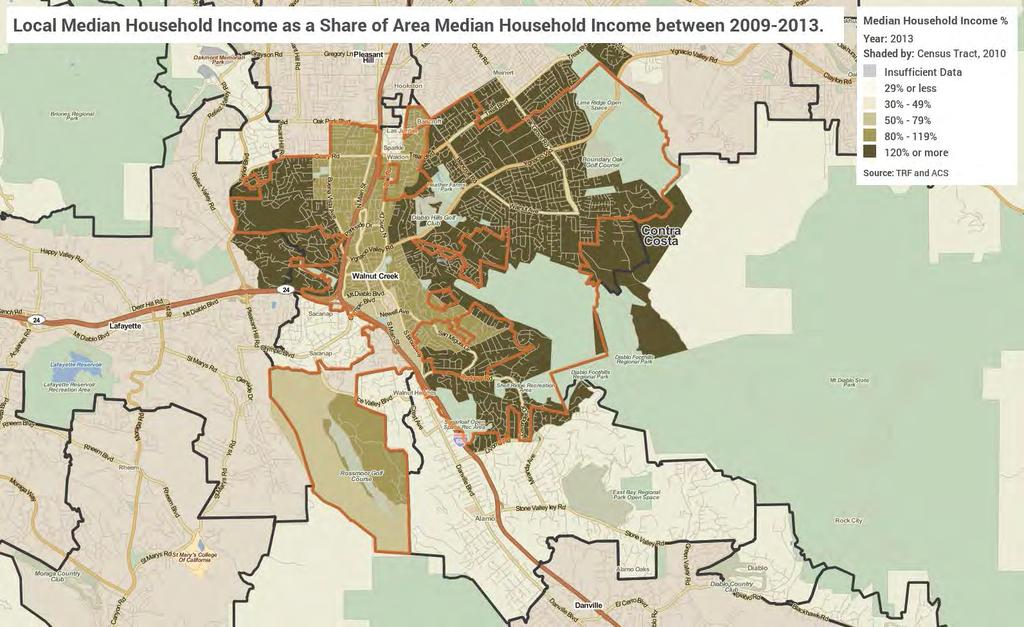
176
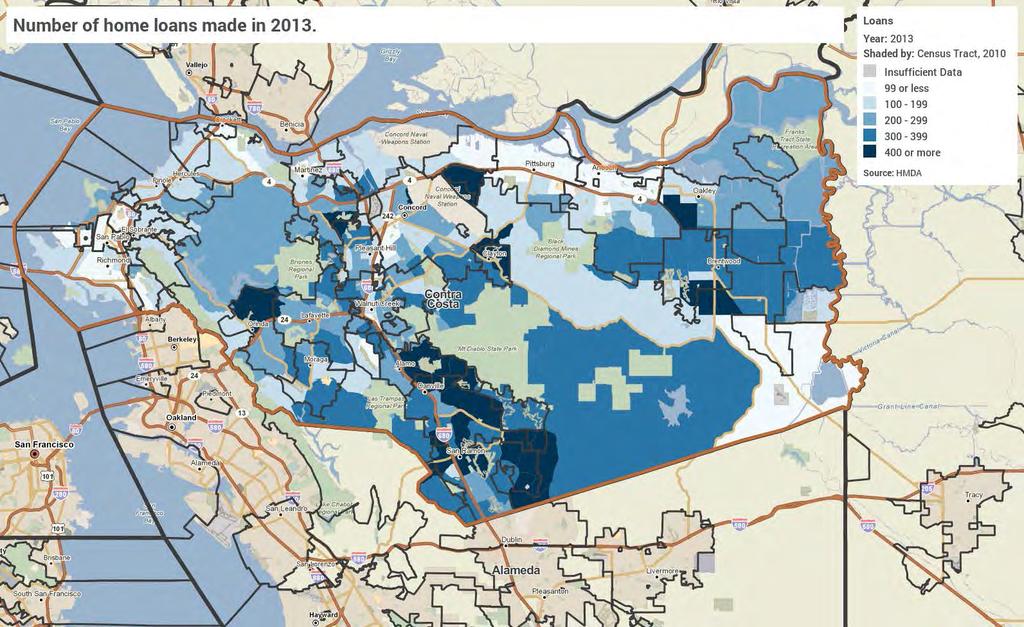
177
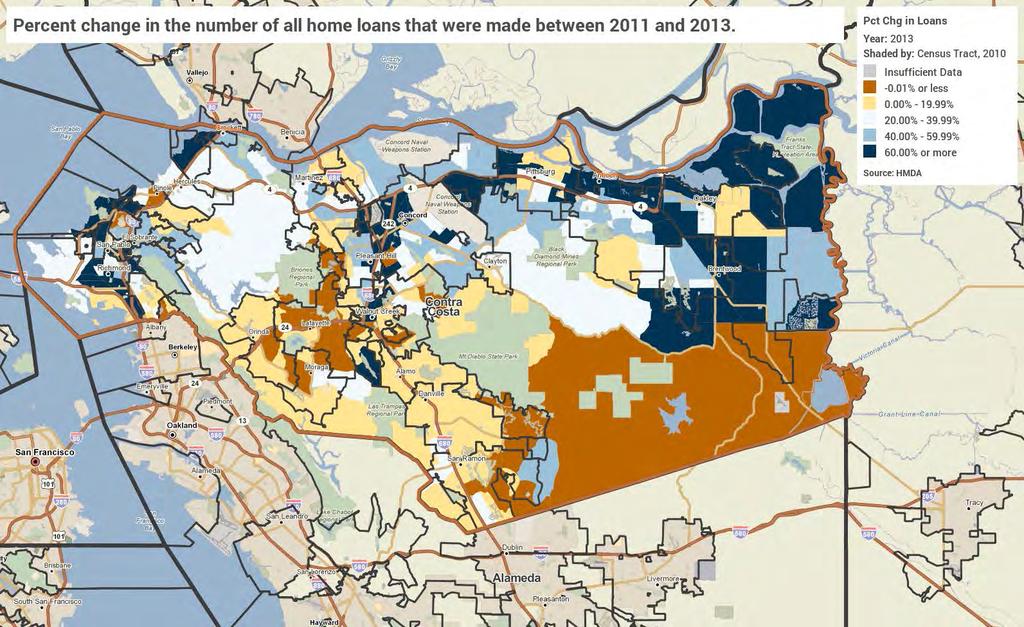
178
SECTION X. IMPEDIMENTS AND SUGGESTED ACTIONS
 SECTION X. IMPEDIMENTS AND SUGGESTED ACTIONS Provisions to affirmatively furthering fair housing are long-standing components of HUD s housing and community development programs. In exchange for receiving
ANALYSIS OF IMPEDIMENTS TO FAIR HOUSING CHOICE
 ANALYSIS OF IMPEDIMENTS TO FAIR HOUSING CHOICE PIERCE COUNTY CONSORTIUM FOR CDBG, HOME AND ESG FUNDS RECEIVED THROUGH THE U.S. DEPARTMENT OF HOUSING AND URBAN DEVELOPMENT AUGUST 2010 TABLE OF CONTENTS
Analysis of Impediments to Fair Housing Choice
 Final Report Analysis of Impediments to Fair Housing Choice Prepared for: Kane County, IL City of Elgin, IL City of Aurora, IL Prepared by: Economic & Planning Systems, Inc. 2012 EPS #20836 Table of Contents
Affirmative Fair Marketing Procedures
 City of Oakland Department of Housing and Community Development Affirmative Fair Marketing Procedures I. Policy on Nondiscrimination and Accessibility 1. Owners and managing agents of housing assisted
Assessment of Fair Housing Tool for Local Governments. Table of Contents
 Assessment of Fair Housing Tool for Local Governments (LG0) OMB Control Number: -00 I. Cover Sheet Assessment of Fair Housing Tool for Local Governments Table of Contents II. III. IV. Executive Summary
CITY OF VALDOSTA, GEORGIA ANALYSIS OF IMPEDIMENTS TO FAIR HOUSING CHOICE
 CITY OF VALDOSTA, GEORGIA ANALYSIS OF IMPEDIMENTS TO FAIR HOUSING CHOICE Prepared for: City of Valdosta, Georgia Ms. Mara S. Register, Assistant to the City Manager Public Involvement Department 300 North
Guidelines For Creating a TBRA Administrative Plan
 NOTE: Do not submit this document as your administrative plan. Also, do not submit KHC s Housing Choice Voucher Administrative Plan. You must create your own by using the document below as your guide.
CITY OF THOMASVILLE NORTH CAROLINA ANALYSIS OF IMPEDIMENTS
 CITY OF THOMASVILLE NORTH CAROLINA ANALYSIS OF IMPEDIMENTS May, 2010 TECHNICAL ASSISTANCE PROVIDED BY BENCHMARK CMR INC. City of Thomasville Analysis of Impediments INTRODUCTION... 3 Historical Overview
CITY OF MEDFORD OREGON
 CITY OF MEDFORD OREGON ANALYSIS OF IMPEDIMENTS TO FAIR HOUSING CHOICE Submitted: May 15, 2015 Contact: Parks and Recreation Department Grants Administrator 701 North Columbus Avenue Medford, Oregon 97504
City of Santa Clarita
 City of Santa Clarita Fair Housing Choice (AI) City of Santa Clarita 23920 W. Valencia Blvd. Suite 302 Santa Clarita, CA 91355 May 2014 Table of Contents Page Section I: Introduction... 1 A. Community
DRAFT Citizens Summary of Recommendations: 2017 Thurston County Assessment of Fair Housing Report Fair Housing is Affordable Housing
 DRAFT Citizens Summary of Recommendations: 2017 Thurston County Assessment of Fair Housing Report Fair Housing is Affordable Housing 2017 DRAFT Summary of Recommended Goals from the 2017 Thurston County
AFFIRMATIVELY FURTHERING FAIR HOUSING
 FINAL REGULATIONS AFFIRMATIVELY FURTHERING FAIR HOUSING Ed Gramlich (ed@nlihc.org) National Low Income Housing Coalition Modified, October 2015 INTRODUCTION On July 8, 2015, HUD released the long-awaited
FAIR HOUSING: Serious Responsibility, Serious Liability
 FAIR HOUSING: Serious Responsibility, Serious Liability PRESENTED TO: American Planning Association Housing and Community Development Division PRESENTED BY: Heidi Aggeler, Managing Director 1999 Broadway
DRAFT Analysis of Impediments to Fair Housing Choice. City of Menifee Haun Road Menifee, CA
 DRAFT 2017-2021 Analysis of Impediments City of Menifee 29714 Haun Road Menifee, CA 92586 www.cityofmenifee.us This Page Left Intentionally Blank City Council Neil R. Winter Mayor Greg August District
2011 ANALYSIS OF IMPEDIMENTS TO FAIR HOUSING CHOICE FOR THE CITY OF TULSA, OKLAHOMA
 2011 ANALYSIS OF IMPEDIMENTS TO FAIR HOUSING CHOICE FOR THE CITY OF TULSA, OKLAHOMA DRAFT REPORT FOR PUBLIC REVIEW MAY 18, 2011 2011 ANALYSIS OF IMPEDIMENTS TO FAIR HOUSING CHOICE FOR THE CITY OF TULSA,
Analysis of Impediments to Fair Housing Choice
 STATE OF ARKANSAS Analysis of Impediments to Fair Housing Choice Final Report November 6, 2014 Submitted by: J-QUAD Planning Group, LLC 14683 Midway Rd. Suite # 210 Addison, TX 75001 Office: (972) 458-0600
Consolidated Planning Process
 Consolidated Planning Process By Ed Gramlich, Director of Regulatory Affairs, National Low Income Housing Coalition Administering agency: HUD s Office of Community Planning and Development Year Program
Analysis of Impediments to Fair Housing 2015 Carson, California
 Analysis of Impediments to Fair Housing 2015 Carson, California City of Carson Community Development Department 701 East Carson Street Carson, CA 90745 (310) 830-7600, extension 1319 E-mail: kbennett@carson.ca.us
GOAL SUMMARY Assessment of Fair Housing 2017, City of Ithaca, NY
 GOAL SUMMARY Assessment of Fair Housing 2017, City of Ithaca, NY GOAL # 1 Prohibit 1.1. In Year 1: Gather best practices and Source of Income discrimination recommendations for implementation models Discrimination
2018 SKAGIT COUNTY HOME CONSORTIUM ANALYSIS OF IMPEDIMENTS TO FAIR HOUSING CHOICE
 2018 SKAGIT COUNTY HOME CONSORTIUM ANALYSIS OF IMPEDIMENTS TO FAIR HOUSING CHOICE DRAFT FOR PUBLIC REVIEW APRIL 2, 2018 2018 SKAGIT COUNTY HOME CONSORTIUM ANALYSIS OF IMPEDIMENTS TO FAIR HOUSING CHOICE:
City of Alhambra. Analysis of Impediments to Fair Housing Choice. City of Alhambra 111 South First Street Alhambra, CA 91801
 City of Alhambra Fair Housing Choice City of Alhambra 111 South First Street Alhambra, CA 91801 May 2013 Table of Contents Chapter Page Chapter 1: Introduction... 1 A. Background... 1 B. Fair Housing
City of New Albany. Analysis of Impediments to Fair Housing Choice Draft. January 16, 2015
 January 16, 2015 City of New Albany Analysis of Impediments to Fair Housing Choice Draft Redevelopment Department 311 Hauss Square, Room 325 New Albany, Indiana 47150 Table of Contents I: Introduction,
Affirmative Fair Housing Marketing Plans
 Affirmative Fair Housing Marketing Plans Asset Management Department, Housing Programs Analysts Christi Wheelock cwheelock@housingnm.org 505-767-2279 Amanda Aragon aaragon@housingnm.org 505-767-2267 Kathy
Town of Yucca Valley GENERAL PLAN 1
 Town of Yucca Valley GENERAL PLAN 1 This page intentionally left blank. 3 HOUSING ELEMENT The Housing Element is intended to guide residential development and preservation consistent with the overall values
DELAWARE STATEWIDE ANALYSIS OF IMPEDIMENTS TO FAIR HOUSING CHOICE
 DELAWARE STATEWIDE ANALYSIS OF IMPEDIMENTS TO FAIR HOUSING CHOICE 1. INTRODUCTION... 1 A. Introduction... 1 B. Obligation to Affirmatively Further Fair Housing... 1 C. Fair Housing Choice... 3 D. The Federal
TOD and Equity. TOD Working Group. James Carras Carras Community Investment, Inc. August 7, 2015
 TOD and Equity TOD Working Group James Carras Carras Community Investment, Inc. August 7, 2015 What is Equitable TOD? Equity is fair and just inclusion. Equitable TOD is the precept that investments in
Delaware State Housing Authority New Castle County Department of Community Services City of Wilmington City of Dover
 RFP # 2010-1 ANALYSIS OF IMPEDIMENTS TO FAIR HOUSING CHOICE REQUEST FOR PROPOSALS Delaware State Housing Authority New Castle County Department of Community Services City of Wilmington City of Dover RFP
ANNUAL ELEMENT PROGRESS REPORT Housing Element Implementation (CCR Title ) Table A
 Table A") ANNUAL ELEMENT PROGRESS REPORT Housing Element Implementation (CCR Title 25 622 ) Jurisdiction City of Escondido Reporting Period 1/1/217-12/31/217 Table A Annual Building Activity Report Summary - New
ANNUAL ELEMENT PROGRESS REPORT Housing Element Implementation (CCR Title 25 622 ) Jurisdiction City of Escondido Reporting Period 1/1/217-12/31/217 Table A Annual Building Activity Report Summary - New
ANALYSIS OF IMPEDIMENTS TO FAIR HOUSING CHOICE ATHENS-CLARKE COUNTY, GEORGIA
 ANALYSIS OF IMPEDIMENTS TO FAIR HOUSING CHOICE ATHENS-CLARKE COUNTY, GEORGIA January 2012 145 Church St. Suite 200 Marietta, GA 30060 (770) 420-5634 www.wfnconsulting.com Analysis of Impediments To Fair
COUNTY OF RIVERSIDE 2014 FAIR HOUSING IMPEDIMENTS STUDY
 COUNTY OF RIVERSIDE 2014 FAIR HOUSING IMPEDIMENTS STUDY Prepared by Riverside County Economic Development Agency Rob Field, Assistant County Executive Officer/EDA COUNTY OF RIVERSIDE 2014 FAIR HOUSING
2017 SOUTH DAKOTA ANALYSIS OF IMPEDIMENTS TO FAIR HOUSING CHOICE
 2017 SOUTH DAKOTA ANALYSIS OF IMPEDIMENTS TO FAIR HOUSING CHOICE Prepared by South Dakota Housing Development Authority and Governor s Office of Economic Development January 10, 2018 Analysis of Impediments
Rental Housing Preliminary Application
 Rental Housing Preliminary Application Please list the properties and number of bedrooms you are applying for in order of preference: Property Name # Bedrooms Property Name # Bedrooms 1. 3. 2. 4. How did
Our Commitment to Fair Housing. Montgomery County, Pennsylvania
 Our Commitment to Fair Housing Montgomery County, Pennsylvania HUD Urban County Montgomery County is a recipient of federal Community Development Block Grant (CDBG) and Home Investment Partnership (HOME)
Policies and Objectives CHAPTER 1 POLICIES AND OBJECTIVES
 CHAPTER 1 POLICIES AND OBJECTIVES 1.0 INTRODUCTION The Housing Choice Voucher (Section 8) Program was enacted as part of the Housing and Community Development Act of 1974, which recodified the U.S. Housing
AFFIRMATIVELY FURTHERING FAIR HOUSING
 AFFIRMATIVELY FURTHERING FAIR HOUSING Proposed Rule 24 CFR Parts 5, 91, 92, et al. Presented by: Fair Housing Continuum, Inc. A private, not-for-profit, 501 ( c )( 3 ), fair housing enforcement agency.
NJ CDBG-Disaster Recovery Program (HURRICANE IRENE) Handbook. Section V Civil Rights
 Handbook. Section V Civil Rights") NJ CDBG-Disaster Recovery Program (HURRICANE IRENE) Handbook Section V Civil Rights Revised 10/02 CDBG-Disaster Recovery Program Handbook Section V Civil Rights CONTENTS PAGE Civil Rights Requirements
NJ CDBG-Disaster Recovery Program (HURRICANE IRENE) Handbook Section V Civil Rights Revised 10/02 CDBG-Disaster Recovery Program Handbook Section V Civil Rights CONTENTS PAGE Civil Rights Requirements
El Cerrito Affordable Housing Strategy City Council Presentation August 15, 2017
 El Cerrito Affordable Housing Strategy City Council Presentation August 15, 2017 1 Overview of Tonight s Agenda Project Overview Affordable Housing Strategies Closing 2 PROJECT OVERVIEW 3 What is the Affordable
CITY OF CORPUS CHRISTI, TEXAS ANALYSIS OF IMPEDIMENTS TO FAIR HOUSING CHOICE
 CITY OF CORPUS CHRISTI, TEXAS ANALYSIS OF IMPEDIMENTS TO FAIR HOUSING CHOICE Prepared for: City of Corpus Christi, Texas City of Corpus Christi Community Development Division of Neighborhood Services Department
PLANNING AND FAIR HOUSING LAW
 PLANNING AND FAIR HOUSING LAW Benjamin Frost, Esq., AICP New Hampshire Housing Purpose and Overview Purpose: Increase Understanding of the Implications of Fair Housing Laws on Municipal Law-making Illustrate
Affirmative Fair Housing Marketing (AFHM) Plan Multifamily Housing
 Plan Multifamily Housing") Affirmative Fair Housing Marketing (AFHM) Plan Multifamily Housing U.S. Department of Housing and Urban Development Office of Fair Housing and Equal Opportunity 1a. Project Name & Address (including County,
Affirmative Fair Housing Marketing (AFHM) Plan Multifamily Housing U.S. Department of Housing and Urban Development Office of Fair Housing and Equal Opportunity 1a. Project Name & Address (including County,
The Urban County of Bucks County and Bensalem Township M a r c h
 Analysis of Impediments to Fair Housing Choice The Urban County of Bucks County and Bensalem Township M a r c h 2 0 1 4 Analysis of Impediments to Fair Housing Choice Table of Contents I. Introduction
Monterey Urban County Analysis of Impediments to Fair Housing Choice
 Analysis of Impediments to Fair Housing Choice May 2013 Lead Agency Monterey County Economic Development Department 168 West Alisal Street, 3rd Floor Salinas, CA 93901 Table of Contents Chapter 1... 1
Affirmatively Furthering Fair Housing & CDBG. November 9, 2017 Ankeny, Iowa
 Fair Housing & CDBG November 9, 2017 Ankeny, Iowa Today s discussion» HUD s Fair Housing rule (AFFH)» AFFH requirements & assessments» Where we are at now» Impacts on communities receiving CDBG funds»
PALM BEACH COUNTY ANALYSIS OF IMPEDIMENTS TO FAIR HOUSING CHOICE FISCAL YEARS
 PALM BEACH COUNTY ANALYSIS OF IMPEDIMENTS TO FAIR HOUSING CHOICE FISCAL YEARS 2010-2015 Prepared By: Palm Beach County Department of Housing and Community Development Edward W. Lowery, Director June, 2010
CITY OF CLAYTON Housing Element
 CITY OF CLAYTON 2015-2023 Housing Element Adopted by City Council Resolution No. 42 2014 November 18, 2014 City of Clayton 6000 Heritage Trail Clayton, CA 94517-1250 Technical Assistance By: 2729 Prospect
Little Haiti Community Needs Assessment: Housing Market Analysis December 2015
 Little Haiti Community Needs Assessment: Housing Market Analysis December 2015 Prepared by: EXECUTIVE SUMMARY Background The Little Haiti Housing Needs Assessment provides a current market perspective
SECTION III. REVIEW OF FAIR HOUSING AGENCIES
 SECTION III. REVIEW OF FAIR HOUSING AGENCIES The purpose of this section is to provide a profile of fair housing in the Urban County based on a number of factors including an enumeration of key agencies
Fair Housing: A Closer Look. Jessica Schneider & Morgan P Davis Housing Action Illinois Conference, October 2nd, 2014
 Fair Housing: A Closer Look Jessica Schneider & Morgan P Davis Housing Action Illinois Conference, October 2nd, 2014 Racial Concentration Overview Chicago has been and today is still one of the most segregated
Opening Doors that Finance Fair Housing
 Opening Doors that Finance Fair Housing October 6, 2016 Alison George Melinda Pasquini, Esq. Denise Rome-Tamulis Polsinelli PC. In California, Polsinelli LLP Questions With a show of hands, how many in
City of Waco, Texas. Housing and Community Development Services Fair Housing Plan
 City of Waco, Texas Housing and Community Development Services 2014-2018 Fair Housing Plan Fair Housing Plan City of Waco Texas 1 Introduction to Fair Housing Federal Legislation and Regulations The Federal
2016 Vermont National Housing Trust Fund Allocation Plan
 2016 Vermont National Housing Trust Fund Allocation Plan Overview The National Housing Trust Fund (HTF) is a new federal affordable housing production program that will complement existing Federal, State,
TENANT SELECTION PLAN Providence Elizabeth House 3201 SW Graham Street, Seattle WA Phone: TRS/TTY: 711
 TENANT SELECTION PLAN Providence Elizabeth House 3201 SW Graham Street, Seattle WA 98126 Phone: 206-938-3276 TRS/TTY: 711 ELIGIBILITY REQUIREMENTS Households applying for residency must meet the following
+ - " &$ #. ($ % * * (& %$ (!( /001
 ii State of Illinois Analysis of Fair Housing Impediments! "# $ % & '''()(*& '#(' +, + - " &$ #. ($ % * * (& %$ (!( /001 ii iii iii iv State of Illinois Analysis of Fair Housing Impediments TABLE OF CONTENTS
Analysis of Impediments to Fair Housing Choice 2010 Update
 Analysis of Impediments to Fair Housing Choice 2010 Update To Satisfy the Requirements of 24 CFR 91.225(a)(1) August, 11 2010 City of Bryan Community Development Services Department 405 W 28 th St Bryan,
Resident Selection Criteria
 POLICY ON NON-DISCRIMINATION Resident Selection Criteria With respect to the treatment of applicants, the Management Agent will not discriminate against any individual or household because of race, color,
Rental Housing Preliminary Application
 Rental Housing Preliminary Application Disabled applicants have the right to request reasonable accommodations. Please contact us with such requests. Please list the properties and number of bedrooms you
APPLICATION COVER LETTER
 Hughes Associates 670 Union Street, Bangor, Maine 04401 (207) 561-4700 x (207) 561-4708 fax xtoll Free: (866) 861-4700 e-mail: hughespm@roadrunner.com TDD: 955-3323 (Maine Relay Service) APPLICATION COVER
Barbara County Housing Element. Table 5.1 Proposed Draft Housing Element Goals, Policies and Programs
 Table 5.1 Proposed Draft Housing Element Goals, Policies and Programs Goal 1: Enhance the Diversity, Quantity, and Quality of the Housing Supply Policy 1.1: Promote new housing opportunities adjacent to
HOUSING ELEMENT GOALS, OBJECTIVES, & POLICIES
 HOUSING ELEMENT GOALS, OBJECTIVES, & POLICIES GOAL H-1: ENSURE THE PROVISION OF SAFE, AFFORDABLE, AND ADEQUATE HOUSING FOR ALL CURRENT AND FUTURE RESIDENTS OF WALTON COUNTY. Objective H-1.1: Develop a
The work that provided the basis for this presentation was supported by funding under a grant with the U.S. Department of Housing and Urban
 Idaho Legal Aid Services Fair Housing Presentation Building Capacity to Address Fair Housing Issues in Our Communities The work that provided the basis for this presentation was supported by funding under
Section 811 Project Rental Assistance Tenant Selection Plan
 Section 811 Project Rental Assistance Tenant Selection Plan The Section 811 Project Rental Assistance (811 PRA) program provides project-based rental assistance for extremely low-income persons with disabilities,
CITY of OAKLAND, CALIFORNIA HOUSING and COMMUNITY DEVELOPMENT ANALYSIS OF IMPEDIMENTS TO FAIR HOUSING CHOICE
 CITY of OAKLAND, CALIFORNIA HOUSING and COMMUNITY DEVELOPMENT ANALYSIS OF IMPEDIMENTS TO FAIR HOUSING CHOICE October 2015 To request interpretation services for this document in languages other than English,
Housing Consumer Education Center Intake Form
 FRANKLIN COUNTY REGIONAL HOUSING & REDEVELOPMENT AUTHORITY 42 Canal Road Turners Falls, MA 01376 Telephone: (413) 863-9781 Facsimile: (413) 863-9289 Housing Consumer Education Center Intake Form Please
Riviera Family Apartments
 Attachment 1 Resident Selection Criteria POLICY ON NON-DISCRIMINATION With respect to the treatment of applicants, John Stewart Company, as the Management Agent, will not discriminate against any individual
2017 Assessment of Fair Housing, City of Ithaca, NY Factors Contributing to Fair Housing Problems
 2017 Assessment of Fair Housing, City of Ithaca, NY Factors Contributing to Fair Housing Problems City of Ithaca Request for Proposals (RFP) for 2019 Action Plan: Introduction & Information for Applicants
This report summarizes our SMPL activities for the year July 1, 2008 through June 30, 2009.
 August 1, 2009 Don Freitas Contra Costa County Clean Water Program 255 Glacier Drive Martinez, CA 94553-4825 Re: SMPL FY 2008-09 Year End Report Dear Mr. Freitas: This report summarizes our SMPL activities
Columbus Urban League
 Columbus Urban League 2012 Fair Housing Plan Columbus and Franklin County Analysis of Impediments to Fair Housing Choice and Action Plan August 2012 Community Research Partners Yvonne Olivares, Director
Chapter 9: Housing. Introduction. Purpose and Intent. Legislative Authority. Organization of the Housing Element. Housing Element HE-1
 Chapter 9: Housing Introduction Purpose and Intent The is intended to provide residents of the community and local government officials with a greater understanding of housing needs in Rancho Cucamonga,
HOUSING ELEMENT OF THE CITY OF PEMBROKE PINES COMPREHENSIVE PLAN ADOPTION DOCUMENT
 HOUSING ELEMENT OF THE CITY OF PEMBROKE PINES COMPREHENSIVE PLAN RULES 9J-5.010, FAC City of Pembroke Pines, Florida ADOPTION DOCUMENT HOUSING ELEMENT HOUSING ELEMENT ADOPTION DOCUMENT VI. GOALS, OBJECTIVES
EQUAL HOUSING OPPORTUNITY POLICY OF THE COLUMBUS HOUSING AUTHORITY
 Policy #26 EQUAL HOUSING OPPORTUNITY POLICY OF THE COLUMBUS HOUSING AUTHORITY The Columbus Housing Authority will comply with all applicable State and Federal laws and regulations including: Title VI of
SUMMARY ANALYSIS OF IMPEDIMENTS SALT LAKE COUNTY AND ENTITLEMENT CITIES
 SUMMARY ANALYSIS OF IMPEDIMENTS SALT LAKE COUNTY AND ENTITLEMENT CITIES Grantees of the Sustainable Communities Regional Planning Grants are required to complete a Fair Housing Equity Assessment (FHEA).
AFFIRMATIVE FAIR HOUSING MARKETING PLAN GUIDANCE
 NATIONAL HOUSING TRUST FUND AFFIRMATIVE FAIR HOUSING MARKETING PLAN GUIDANCE North Dakota Housing Finance Agency 2624 Vermont Avenue PO Box 1535 Bismarck, ND 58502-1535 800/292-8621 or 701/328-8072 800/366-6888
AFFIRMATIVELY FURTHERING FAIR HOUSING FOR MUNICIPAL LEADERS
 AFFIRMATIVELY FURTHERING FAIR HOUSING FOR MUNICIPAL LEADERS Presented by Erin Kemple Executive Director Connecticut Fair Housing Center 221 Main Street Hartford, CT 06106 (860)247-4400, ext. 723 erin@ctfairhousing.org;
1SUPPORT TRANSPORTATION POLICY TO BUILD DIVERSE, SUSTAINABLE COMMUNITIES
 1SUPPORT TRANSPORTATION POLICY TO BUILD DIVERSE, SUSTAINABLE COMMUNITIES Prepared for the Transportation Equity Network Conference March 10, 2009 Washington, DC For 40 years, transportation and infrastructure
The'Analysis'of'Impediments'Study' to'fair'housing'choice'
 February( 2014 The'Analysis'of'Impediments'Study' to'fair'housing'choice' Justin'Harris' [Type'the'abstract'of'the'document'here.'The'abstract'is'typically'a'short'summary'of'the' contents'of'the'document.]'
OUTLINE OF THE CDBG-DR FEDERAL REGISTER NOTICE (February 23, 2018)
") OUTLINE OF THE CDBG-DR FEDERAL REGISTER NOTICE (February 23, 2018) INTRODUCTION When Congress makes a special appropriation of Community Development Block Grant funds for disaster recovery (CDBG-DR), HUD
OUTLINE OF THE CDBG-DR FEDERAL REGISTER NOTICE (February 23, 2018) INTRODUCTION When Congress makes a special appropriation of Community Development Block Grant funds for disaster recovery (CDBG-DR), HUD
ANNUAL ELEMENT PROGRESS REPORT Housing Element Implementation (CCR Title )
") page 1 of 18 Table A Annual Building Activity Report Summary - New Construction Very Low-, Low-, and Mixed-Income Multifamily Projects 1 2 Project Identifier (may be APN No., project name or address) Unit
page 1 of 18 Table A Annual Building Activity Report Summary - New Construction Very Low-, Low-, and Mixed-Income Multifamily Projects 1 2 Project Identifier (may be APN No., project name or address) Unit
City of St. Petersburg, Florida Consolidated Plan. Priority Needs
 City of St. Petersburg, Florida 2000-2005 Consolidated Plan Priority Needs Permanent supportive housing and services for homeless and special needs populations. The Pinellas County Continuum of Care 2000
Boise City Consolidated Plan, Annual Action Plan and Analysis of Impediments to Fair Housing. April, 2016
 Boise City Consolidated Plan, Annual Action Plan and Analysis of Impediments to Fair Housing April, 2016 Introduction Federal law requires Boise to develop a Consolidated Plan for Housing and Community
Background and Purpose
 DRAFT MEMORANDUM To: From: Perkins+Will James Musbach and Rebecca Benassini Subject: Affordable Housing Need and Supply, Downtown Concord Specific Plan, addendum to Existing Conditions Report; EPS #121118
Housing Element
 2007-2014 Housing Element January 2012 City of El Cerrito Environmental and Development Services Department 10890 San Pablo Avenue El Cerrito, CA 94530 Adopted by the City Council on February 6, 2012 Certified
Fair Housing Laws. What are They and Why are They Important?
 Fair Housing Laws What are They and Why are They Important? Town Residential Flatiron Office August 13, 2014 Pierre E. Debbas Romer Debbas, LLP 183 Madison Avenue Suite 904 New York, NY 1001 212-888-3100
Chapter 1 OVERVIEW OF THE PROGRAM AND PLAN
 INTRODUCTION Chapter 1 OVERVIEW OF THE PROGRAM AND PLAN The PHA receives its operating subsidy for the public housing program from the Department of Housing and Urban Development. The PHA is not a federal
PDA Investment & Growth Strategy
 PDA Investment & Growth Strategy 2014 Update Adopted The preparation of this report has been financed through a grant from the U.S. Department of Transportation and the Federal Highway Administration.
TENANT SELECTION PLAN
 TENANT SELECTION PLAN Providence Joseph House 11215 5 th Ave SW, Seattle WA 98146 Phone: 206-686-6364 TRS/TTY: 711 Providence Joseph House is comprised of 1-bedroom and 2-bedroom apartments. Due to the
Iris Park Apartments Preliminary Application
 Office Use Only Time/ Received: Iris Park Apartments Preliminary Application INSTRUCTIONS: This information will be used to determine your household s preliminary eligibility for Iris Park Apartments.
INSTRUCTIONS FOR COMPLETING THE APPLICATION FOR HOUSING:
 INSTRUCTIONS FOR COMPLETING THE APPLICATION FOR HOUSING: Thank you for your interest in obtaining housing at one of our properties. The following instructions, if followed properly, will ensure timely
HCEC INTAKE FACESHEET
 HCEC INTAKE FACESHEET Name: Date: Dependents No Dependents Crisis: Please check one of the following Owe back rent-no notice yet 14 Day Notice 30 Day Notice-no Summary Process Homeless-on the street with
Fair Housing in Homeless Housing Programs. Detroit, Hamtramck and Highland Park, Michigan February 10, 2016
 Fair Housing in Homeless Housing Programs Detroit, Hamtramck and Highland Park, Michigan February 10, 2016 About CSH Advancing housing solutions that: Improve the lives of vulnerable people Maximize public
Planning Committee STAFF REPORT October 5, 2016 Page 2 of 4 jurisdictions adopt a surplus land resolution is excessive and recommending that it be rep
 Planning Committee STAFF REPORT Meeting Date: October 5, 2016 Subject Summary of Issues Recommendations Financial Implications Options Attachments (See PC Packet, dated 10/5/16 for Attachment A, Attachments
FAIR HOUSING AND AFFIRMATIVELY FURTHERING FAIR HOUSING
 FAIR HOUSING AND AFFIRMATIVELY FURTHERING FAIR HOUSING Presented by Fair Housing of Marin 2016 All rights reserved. No copying or reproduction without the express written consent of Fair Housing of Marin.
Supporting documents; DHC publications & HomeSwapper publications. Health & safety; Breach of this policy unlikely to have direct impact on H&S
 Section; Housing Policy name; Lettings Policy Executive responsible; Housing Manager Review by; Housing Manager Tenant review: Not yet Type of review; Exception Authority to amend; Board Frequency of review;
Fair Housing for Service Coordinators
 Fair Housing for Service Coordinators Ron Budynas Chief Operating Officer, Wesley Living NAHPe, CPO, CDP, SCHM, CGPM, FHC 1 Who Does Fair Housing Protect? The protected Classes 2 There are 7 protected
Analysis of Impediments to Fair Housing Choice. Passaic County, NJ including the Urban County and Wayne Township
 Analysis of Impediments to Fair Housing Choice Passaic County, NJ including the Urban County and Wayne Township May 2015 ANALYSIS OF IMPEDIMENTS TO FAIR HOUSING CHOICE Passaic County, New Jersey Table
HOUSING ELEMENT TABLE OF CONTENTS INTRODUCTION...HO- 1 BAINBRIDGE ISLAND SNAPSHOT: PEOPLE AND HOUSING.. HO-1
 HOUSING ELEMENT TABLE OF CONTENTS PAGE INTRODUCTION...HO- 1 BAINBRIDGE ISLAND SNAPSHOT: PEOPLE AND HOUSING.. HO-1 GMA GOAL AND REQUIREMENTS FOR HOUSING. HO-1 HOUSING NEEDS..HO-2 HOUSING ELEMENT VISION...HO-3
Memo to the Planning Commission JULY 12TH, 2018
 Memo to the Planning Commission JULY 12TH, 2018 Topic: California State Senate Bill 828 and State Assembly Bill 1771 Staff Contacts: Joshua Switzky, Land Use & Housing Program Manager, Citywide Division
PENNSYLVANIA AFFORDABLE HOUSING ACT Act of Dec. 18, 1992, P.L. 1376, No. 172 AN ACT Providing for the establishment and administration of an
 PENNSYLVANIA AFFORDABLE HOUSING ACT Act of Dec. 18, 1992, P.L. 1376, No. 172 AN ACT Cl. 48 Providing for the establishment and administration of an affordable housing program; and imposing additional powers
1) To be eligible for this property, you must be at least 55 years of age to qualify. Income limits do apply.
 To be eligible for this property, you must be at least 55 years of age to qualify. Income limits do apply.") APPLICATION INSTRUCTIONS Thank you for your interest. The following instructions, if followed properly, will ensure timely processing of your application and will prevent delays. 1) To be eligible for
APPLICATION INSTRUCTIONS Thank you for your interest. The following instructions, if followed properly, will ensure timely processing of your application and will prevent delays. 1) To be eligible for
Housing Policy in the United States
 Housing Policy in the United States Second Edition Alex F. Schwartz THE NEW SCHOOL O Routledge g^^ Taylor & Francis Croup NEW YORK AND LONDON Brief Contents PREFACE ACKNOWLEDGMENT XIII XV 1 INTRODUCTION
Attached is your application for Bessey Commons. Before submitting your application, please keep in mind the following:
 Attached is your application for Bessey Commons. Before submitting your application, please keep in mind the following: Bessey Commons is a smoke-free building. Smoking will not be allowed anywhere on