Township Growth & Change: Population Characteristics of Ohio s Townships 1960 to 2000
|
|
|
- Gervase Gray
- 6 years ago
- Views:
Transcription
1 Township Growth & Change: Population Characteristics of Ohio s Townships 1960 to 2000 Prepared by: Jeff S. Sharp Rural Sociology Program Department of Human & Community Resource Development Ohio State University Extension The Ohio State University & Jason W. Reece Data Manager & Analyst Department of Agricultural, Environmental & Developmental Economics The Ohio State University September 2001
2 Selected Highlights The following are highlights of some of the data reported in this monograph. More detail and precise figures are found in the report s text and tables. There are 1,309 townships in the state of Ohio. More than 3.86 million people or 34% of Ohio s total population live in townships (Table 1). There is substantial variation of population among Ohio townships. The average population of an Ohio township is 2,947 residents. There are 25 townships with 348 or fewer residents (Table 2). Colerain Township in Hamilton County has 60,144 residents, the most of any township in the state. There are 21 townships in the state with more than 20,000. The number of Ohioans residing in townships has grown from over 2.71 million in 1960 to over 3.86 million in 2000 (Table 3). This is a net increase of 1.15 million residents during a 40 year period. During the same time period, Ohioans residing in cities or villages grew from 6.99 million to 7.49 million, an increase of just under 500,000. From 1990 to 2000, 849 Ohio townships (65 percent of all Ohio townships) grew from 1 to 499 residents. During the same time period, 32 townships experienced growth greater than 2,500 (Table 6). Townships experiencing net population increases greater than 500 people in a decade are generally located near Cincinnati-Hamilton, Columbus, or the Cleveland-Akron metropolitan areas across all four decades under consideration. In the 1970s and 1990s, this level of population growth was common near these major cities. Despite the steady increase in the total population residing in Ohio townships, population change has not been uniform across all townships (Table 5). A large number of Ohio townships consistently lost population. In the 1960s and the 1980s, 516 and 557 townships respectively lost population. Even during the 1970s, when net population growth in townships was the largest of any decade under consideration, 224 townships lost population. Seven Ohio counties have township populations greater than 100,000, all of which are located either in the northeast or southwest regions of the state (Map 16). In general, the counties with the largest number of residents living in townships are part of a metropolitan area, such as Columbus, Cincinnati, Dayton-Springfield, Cleveland-Akron, Canton, or Toledo. The metropolitan area with the largest number of township residents in 2000 is Cincinnati-Hamilton with 690,783 township residents (Table 8). Cleveland Akron has the second most township residents, with 476,747 area residents living in township.
3 Table of Contents: Page Introduction 4 Notes on Data 4 Section 1: Township Population, Section 2: Ohio population by township, village, and city, Section 3: Population change in Ohio townships, Section 4: Townships Population by County and Metropolitan Area 23 Section 5: Concluding Observations 31 Appendix A: Townships Abolished since Appendix B: Additional Notes on Data 34
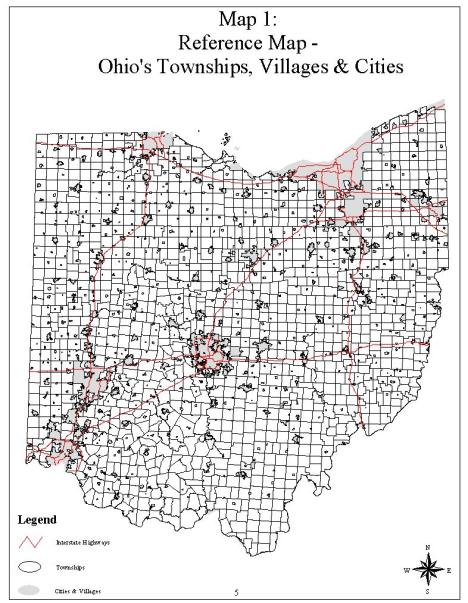
4 Index of Tables, Figures and Maps TABLES: Page Table 1: 2000 Ohio population by township, village and cities 7 Table 2: 25 Most and Least Populated Ohio Townships (2000) 7 Table 3: Aggregate Population of Townships, Cities, and Villages, Table 4: Population Change in Townships, Cities, and Villages by 13 Decade Table 5: Townships categorized by growth rates (% change), Table 6: Townships categorized by net population change, Table 7: Townships Categorized by population density (persons per sq. 17 mile), 1960, 1980 & 2000 Table 8: Township Population within Metropolitan Areas 30 FIGURES: Page Figure 1: Number of Townships by Township Size Category: Figure 2: Population of Townships by Township Size Category: Figure 3: Population of Ohio Townships, Villages and Cities Figure 4: Metro and Non Metro Township Population: Figure 5: Population Growth Rates 1960 to 2000: Metro City & Village 28 Population, Non-Metro City & Village Population, Metro Township Population, and Non-Metro Township Population MAPS: Page Map 1: Reference Map Ohio s Townships, Villages & Cities 5 Map 2: 25 Largest and 25 Smallest Townships in Map 3: Townships by Population Size: Map 4: Townships by Population Density: 2000 (persons per sq. mile) 11 Map 5: Township Population Change (Percent Change) 18 Map 6: Township Population Change (Percent Change) 18 Map 7: Township Population Change (Percent Change) 19 Map 8: Township Population Change (Percent Change) 19 Map 9: Township Population Change (Absolute Change) 20 Map 10: Township Population Change (Absolute Change) 20 Map 11: Township Population Change (Absolute Change) 21 Map 12: Township Population Change (Absolute Change) 21 Map 13: Townships by Population Density: 1960 (persons per sq. mile) 22 Map 14: Townships by Population Density: 1980 (persons per sq. mile) 22 Map 15: Townships by Population Density: 2000 (persons per sq. mile) 22 Map 16: Township Population by County: Map 17: Percentage of County Population Living in Townships: Map 18: Ohio Metropolitan Area Reference Map 26 Map 19: Percentage of Metro Population in Townships:
5 Introduction: This report focuses on Ohio townships. The focus in this document is on population characteristics of townships in 2000, patterns of population change in townships since 1960, and comparisons of the number of Ohioans living in townships versus cities and villages. The goal is to better understand townships, at least in terms of population, and identify spatial patterns of township population growth. This is one in a series of reports related to townships 1. Future reports will include data about land use; economic and business characteristics; and agriculture. In addition, a series of townships reports (compiled by county) are available in conjunction with this report at the following website: Notes on Data: Definitions: Three types of general-purpose local governments exist in the state of Ohio: counties, townships, and municipalities. Counties are the major local government subdivision of the state, with all of the state s territory and population contained within one of Ohio s 88 counties. Municipalities in the state are classified as either a village (population less than 5,000) or city (population 5,000 or greater). Municipalities may adopt laws that are not forbidden or in direct conflict with state law. In contrast, townships are administrative units of state government limited to functions specified by state law (although state law in 1991 has permitted some alternative township government with limited powers of self-government). See OSU Extension Bulletin (online at: ohioline.ag.ohio-state.edu) for additional background information about local governments in Ohio. Sources of Data: To analyze township population characteristics, sub-county level data was gathered and aggregated from five decennial censuses ( ). Data was summarized into a township database that included all townships that existed since 1960 and their 100% population counts and land areas. The following section explains the sources of data utilized to create the township database. Office of Strategic Research. The Ohio Department of Development (2001) 2000 Census of Population by age, race and Hispanic origin for Ohio s governmental units Office of Strategic Research. The Ohio Department of Development (2001) Decennial Census of Population for places, 1990 to 2000 U.S. Census Bureau. (1990) 1990 Census of Population and Housing Geolytics. (2000) Geolytics CensusCD 1980: Data derived from the 1980 Census of Population and Housing U.S. Census Bureau. (1981) 1980 Census of Population: Volume 1 Characteristics of the Population Number of Inhabitants Ohio: PC80-1-A37. Table 4 U.S. Census Bureau. (1967) Area Measurement Reports Areas and Population of Ohio 1960: GE-20, No The township data reported in this study represents all persons residing in the unincorporated land in the state and does not account for the population residing in villages or cities.
6
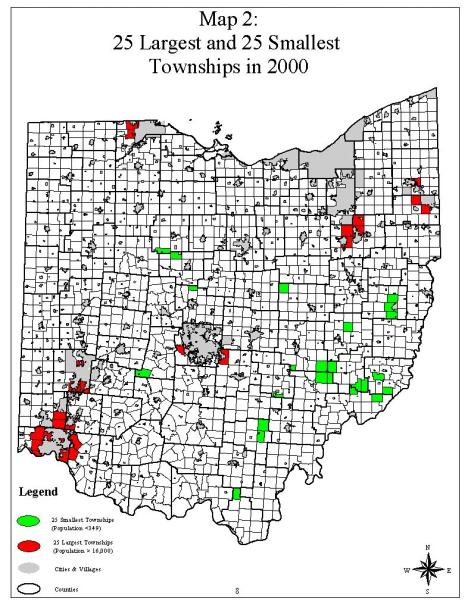
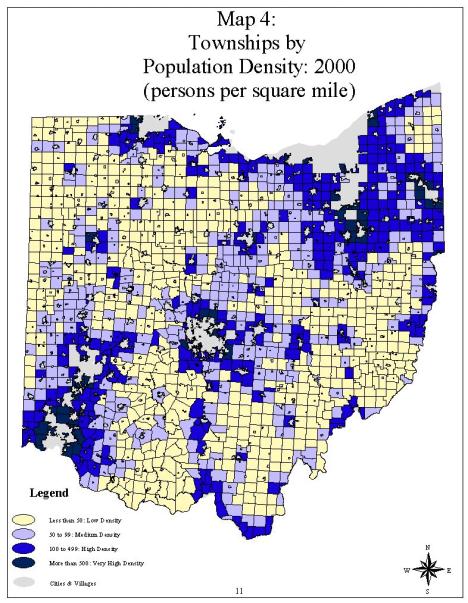
7 Section 1: Township Population, 2000 Background: Table 1 In 2000, there are 1,309 townships in the state of Ohio. More than 3.86 million people or 34% of Ohio s total population live in townships (Table 1). There are 698 incorporated places in the state classified as villages, with.86 million total residents. There are 226 cities with less than 50,000 but more than 5,000 residents, with 3.64 million total residents. There are 19 cities with 50,000 or more residents, or 2.99 million total residents. Largest and Smallest Ohio Townships: Table 2 and Map 2 There is substantial variation of population in Ohio townships. The average size of a township is 2,947 residents. Jefferson Township in Guernsey County is the township with the smallest population with 94 residents. There are 25 townships with 348 or fewer residents (Table 2). Colerain Township in Hamilton County has 60,144 residents, the most of any township in the state. There are 21 townships in the state with more than 20,000. Many of the most populated townships are located along the Cincinnati-Hamilton-Dayton corridor in the southwestern part of the state (Map 2). Many of the townships with the fewest number of residents are located in the eastern part of Ohio. Townships by Population Size: Figures 1 and 2 and Map 3: Forty-nine percent of all Ohio townships residents reside in one of the 155 townships with 5,000 or more residents (Figures 1 and 2). Thirty-eight percent of Ohio townships (N=506) have less than 1,250 residents, and are home to 11 percent (.41 million) of the state s township population. There are 417 townships having between 1,250 and 2,499 residents, with 730,336 total residents, and 231 townships with population of 2,500 to 4,999 residents and 809,832 total residents. The townships with 5,000 or more residents are generally located around the largest urban areas of the state, Cincinnati-Hamilton, Cleveland-Akron, Columbus, Dayton- Springfield, and Toledo (Map 3). The townships with less than 1,250 residents are located primarily in the south and east as well as in the northwest portion of the state. Township population generally decreases the greater the distance from one of the state s large urban areas. Townships by Population Density: Map 4 To evaluate population characteristics of Ohio townships, while controlling for land area, population density can be studied. Similar to the spatial pattern of township population size in Ohio, high and very high density townships (density greater than 100 and 500 respectively) are located around the state s largest urban areas while low density townships (less than 50 residents per square mile) are located in the more rural south, east, and northwest areas of the state.
8 Table 1: 2000 Ohio population by township, village, and cities Number Population % of Ohio population Townships 1,309 3,860, % Villages* , % Small Cities** 226 3,642, % Large Cities*** 19 2,987, % Total Ohio Population 11,353, % *Villages are incorporated places of 0 to 4,999 residents **Small cities are incorporated places of 5,000 to 49,999 residents ***Large Cities are incorporated places of 50,000 or more residents Table 2: 25 Most and Least Populated Ohio Townships (2000) Most Populated Least Populated Rank Township County Pop. Township County Pop. 1 Colerain Hamilton 60,144 Jefferson Guernsey 94 2 Green Hamilton 55,660 Manchester Adams 98 3 Union Butler 52,669 Brookfield Noble Anderson Hamilton 43,857 Chagrin Falls Cuyahoga Boardman Mahoning 42,518 Manchester Morgan Union Clermont 42,332 Meigs Muskingum Austintown Ashtabula 38,001 Athens Harrison Springfield Hamilton 37,587 Jefferson Noble Jackson Montgomery 37,484 Bristol Morgan Miami Lucas 36,632 Marlboro Delaware Plain Stark 35,543 Aurelius Washington Delhi Hamilton 30,104 Washington Lawrence Washington Montgomery 29,967 Clay Muskingum Perry Stark 29,167 Brown Vinton Miami Montgomery 25,706 Elk Noble Sylvania Lucas 25,583 Archer Harrison Deerfield Warren 25,515 Madison Vinton Harrison Montgomery 24,303 Salt Rock Marion Lake Stark 23,718 Marseilles Wyandot Springfield Lucas 22,817 Ludlow Washington Liberty Butler 22,005 Cadiz Harrison Sycamore Hamilton 19,675 Coal Perry Howland Trumbull 17,546 Stokes Madison Prairie Franklin 17,058 Tiverton Coshocton Violet Fairfield 16,893 Wayne Monroe 348
9
10 Figure 1: Number of Townships by Township Size Category: 2000 Large 2,500 to 4,999 People 18% Largest: More than 5,000 People 12% Medium: 1,250 to 2,499 People 32% Small: Less than 1,249 People 38% Total Number of Townships: 1,309 Figure 2: Population of Townships by Township Size Category: 2000 Largest: More than 5,000 People 49% 1,906, ,612 Small: Less than 1,249 People 11% 809, ,336 Medium: 1,250 to 2,499 People 19% Large 2,500 to 4,999 People 21% Total Township Population: 3,860,763
11
12
13 Section 2: Ohio population by township, village, and city, Aggregate Population and Change by Type of Place: Tables 3 and 4 The number of Ohioans residing in townships has grown from over 2.71 million in 1960 to over 3.86 million (Table 3). This is a net increase of 1.15 million residents during a forty-year period. During the same time period, Ohioans residing in cities or villages grew from 6.99 million to 7.49 million, an increase of just under half a million. Population growth in townships, cities and villages has not been uniform across decades. Township population consistently increased across all four decades, with the largest net increase occurring in the 1960s and 1970s (increases of 330,561 and 444,330 residents, respectively) and the lowest net growth occurring in the 1980s (increase of 126,524 residents). Percent increase of people living in townships was over 12 percent during both the 1960 and 1970s, falling to 3.5 percent in the 1980s and increasing to 6.8 percent during the 1990s. The pattern of net population change in cities and villages during this forty-year period is quite different. During the 1960s, the net population residing in cities and villages increased to over 620,000 residents, nearly twice the net growth of townships. In the 1970s and 1980s there was a net decrease in Ohio s population residing in cities and villages. In the 1970s, the decrease was just over 304,000, a four percent decline. Ohio as a whole would have experienced a population decline during the 1970s if not for population growth in the townships exceeding population loss in cities and villages. Net population loss in cities and villages during the1980s was 77,039 residents, or 1.1 percent decline. In the 1990s, net city and village population growth exceeded township growth slightly, with a net increase of 260,437 residents or 3.6 percent. Population by Size of Place and Township, : Figure 3 The pattern of population change within cities and villages when examined by size of place reveals a distinct pattern. The population residing in the state s largest cities (greater than 50,000 residents in 2000), fell from 3.58 million in 1970 to 3.15 million in Since 1980, a slight decline has continued, resulting in less than 3 million living in the state s largest cities. In the smaller cities with population s between 5,000 and 50,000, there has been a steady increase from 2.62 million in 1960 to 3.64 million people in The pattern of population growth in these small cities is consistent with the population growth in townships. Ohio population residing in villages has remained fairly constant since 1970 with between.82 and.86 million residents.
14 Table 3: Aggregate Population of Townships, Cities, and Villages, Townships 2,713,670 3,044,231 3,488,561 3,615,175 3,860,763 Cities & Villages 6,992,727 7,613,192 7,309,069 7,231,940 7,492,377 State 9,706,397 10,657,423 10,797,630 10,847,115 11,353,140 Table 4: Population Change in Townships, Cities, and Villages by Decade Net Population Change Townships 330, , , ,588 Cities & Villages 620, ,123-77, ,437 State 951, ,207 49, ,025 Percent Population Change Townships Cities & Villages State
15 4.50 Figure 3: Population of Ohio Townships, Villages and Cities Po pu lat ion (in Mi llio ns) Year: *Small Cities categorized as cities with population less than 50,000, Large cities contain population greater than 50,000 Village Small Cities* Large Cities* Townships Change : Change : Change : +27.9% -15.2% +33.2% Change : +11.4% Note: Classification of small city and large city based on 2000 population levels, classification of villages based on 2000 political classification.
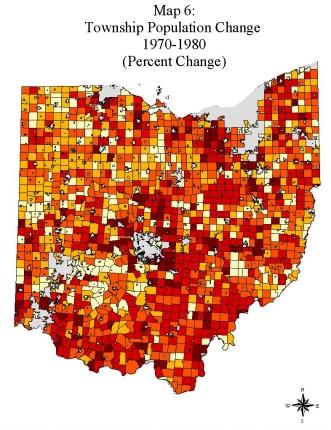
16 Section 3: Population change in Ohio townships, Townships by population percent population growth, 1960 to 2000: Table 5, Maps 5 thru 8 Despite the steady increase in the total population residing in Ohio townships, population change has not been uniform across all townships (Table 5). A large number of Ohio townships that have consistently lost population between 1960 and In the 1960s and the 1980s, 516 and 557 townships respectively lost population. Even during the 1970s, when net population growth in townships was the largest of any decade under consideration, 224 townships lost population. From 1990 to 2000, 446 townships grew from zero to nine percent. Thirty-nine townships experienced growth greater than 50 percent. In the 1960s and 1970, two to three times as many townships experienced growth in excess of 50 percent (78 in the 1960 s and 116 in the 1970 s). During the 1960s (Map 5), township population growth tended to be highest around the Cleveland-Akron, Columbus, Cincinnati-Hamilton, and Dayton-Springfield Metropolitan Areas. Population loss occurred in townships throughout the state, with the largest number of townships with losses found in the south, east, and northwest parts of the state. The spatial pattern of population loss during the 1970s (Map 6) reflects widespread population growth throughout the state, although, there were pockets of population loss. In the 1980s, population losses occurred throughout the state, with a large number of townships with population loss located in the west central portion of the state and in areas of the northwest (Map 7). In the 1990s, population loss persisted in some parts of the northwest and east, but modest to high population gains occurred in many townships along the Interstate 71 corridor between Cleveland and Cincinnati, with substantial growth occurring in townships east of Cincinnati and south of Cleveland (Map 8) Townships by net population change categories, 1960 to 2000: Table 6, Maps 9 thru 12 Simply focusing on percent population change can overstate the level of growth occurring in Ohio townships as small net changes in a township s population can result in substantial percentage changes if the township is relatively small initially. Across all four decades from 1960 to 2000, the most common level of change was an increase of 1 to 499 residents in a township (Table 6). In the 1990s, 849 Ohio townships (65 percent of all townships) experienced growth of between 1 and 499 residents. During the same time period, 32 townships experienced growth greater than 2,500. Townships experiencing net population increases greater than 500 are consistently located near Cincinnati, Columbus, or the Cleveland-Akron metropolitan areas across all four decades. In the 1970s and 1990s, this level of population growth was quite common near these major cities.
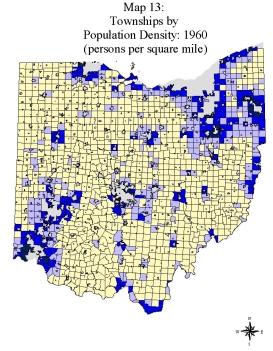
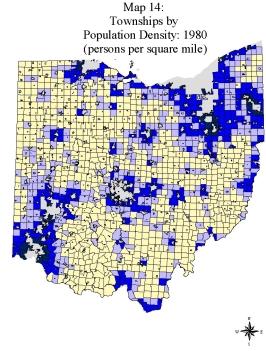
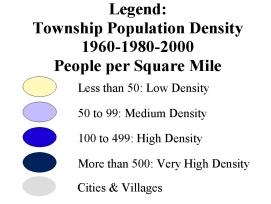
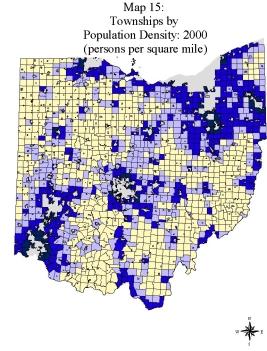
17 Townships by Population Density Categories, 1960 to 2000: Table 7, Maps 13 thru 15 One result of net or percent township population growth is steadily increasing population densities of Ohio townships throughout the state. In the 1960s, most Ohio townships (884 of 1330 townships) had population densities of less than 50 persons per square mile (Table 7). In the 1960s, medium and higher density townships, with more than 50 people per square miles, were primarily located in the Cleveland-Akron region and the Cincinnati to Dayton corridor (Map 13). By 1980, population growth resulted in an increased number of townships with high density; in 1960 there were 209 townships with density greater than 100 persons per square mile and in 1980 there were 297. There was an increase in higher density townships in both the northeast and southwest areas of the state, but also an increase in township density in central Ohio (Map 14). By the 1990s, there were 348 Ohio townships with population density greater than 100 residents and a continuation of the trend of higher density townships around the major urban areas and along the transportation corridors emanating from them (Map 15).
18 Table 5: Townships categorized by growth rates (% change), 1960 to 2000 Category # of Townships Increase 50% or more Increase 25% to 49% Increase 10% to 24% Increase 0% to 9% Population Loss Total: Table 6: Townships categorized by net population change, 1960 to 2000 Category # of Townships Increase 2,500 or more Increase 500 to 2, Increase 1 to Population Loss: Total: Table 7: Townships categorized by population density (Persons per square mile), 1960,1980 and 2000 Category Persons per square mile # of Townships More than to to Less than Total
19
20
21
22
23
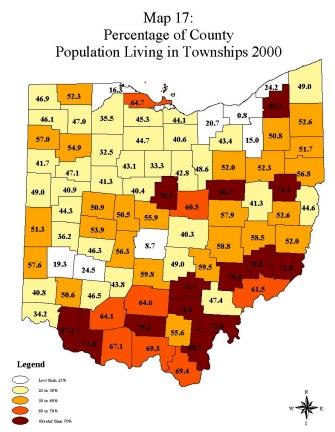
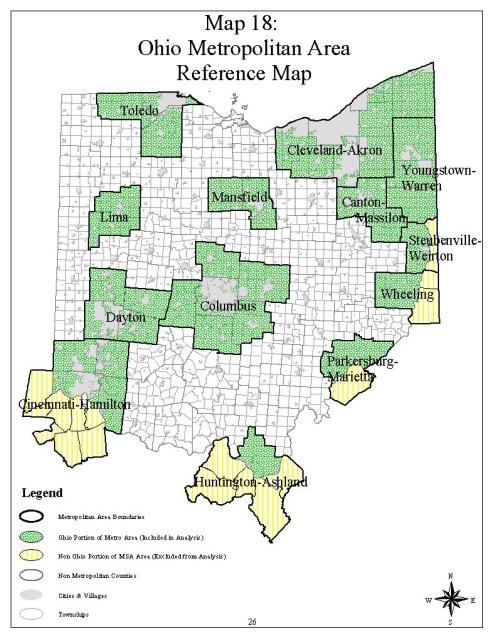
24 Section 4: Townships Population by County and Metropolitan Area Township Population by County, Map 16 & Map 17 Seven Ohio counties have township populations greater than 100,000, all of which are located either in the northeast or southwest regions of the state (Map 16). In general, the counties with the largest number of residents living in townships are part of a metropolitan area, such as Columbus, Cincinnati, Dayton-Springfield, Cleveland-Akron, Canton, or Toledo (see Map 18 to identify Ohio metropolitan areas and associated counties). In terms of proportion of total population residing in townships, there are 14 Ohio counties in which over 70 percent of the population resides in townships (Map 17). These counties are primarily located along the southwest portion of the state. Many of the counties with the lowest proportion of residents living in townships are the counties that contain a large city, such as the case in Cuyahoga County (city of Cleveland) or Franklin County (city of Columbus). Townships Population, Metro versus Nonmetro, Map 18, Figure 4 & 5 The metropolitan and nonmetropolitan status of counties is a common contrast to identify the effect of proximity to a large city. Metropolitan areas are defined as counties containing a city of 50,000 or more residents and those counties closely tied to the large city through commuting patterns or the presence of some portion of the core cities urbanized area within the county. In Ohio there are 15 metropolitan areas, encompassing 39 counties. Map 18 identifies the metropolitan areas and the associated counties. Since 1960, there has consistently been a large proportion of Ohio s township population residing in one of the 39 counties currently defined as metropolitan (Figure 4). Over this forty-year period, these 39 counties have experienced an increase of 806,933 township residents, while the nonmetropolitan counties had an increase of 340,160 residents in townships. The rate of growth in metropolitan versus nonmetropolitan township population has varied across the 1960 to 2000 time period (Figure 5). During the 1960s and 1980s, metropolitan township population increased at a higher rate than did nonmetropolitan township population. In the 1970s and 1990s, nonmetropolitan township population grew faster than metropolitan township population. Across all time periods, population growth rates of metropolitan townships have exceeded the growth rate of the cities and villages in metropolitan areas (Figure 5). In the 1970 s the difference was the greatest, with metropolitan township population growing 12.1 percent while there was a population decrease 0.3 percent in metropolitan cities and villages. In the most recent time period, metropolitan township population grew 5.9 percent while metropolitan city and village population grew 4.4 percent.
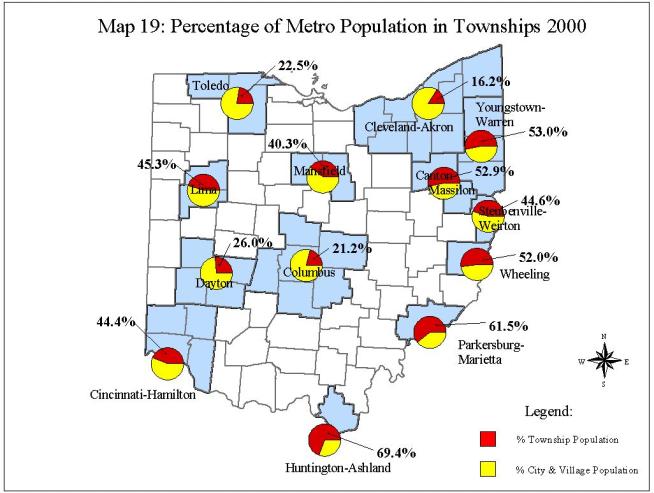
25 Township Population by Metropolitan Area, Table 8 and Map 19 The Ohio metropolitan area with the largest proportion of population residing in townships 2 is the Youngstown-Warren metropolitan area, with 53 percent of the population residing in townships (Map 19). Canton-Massillon with 52.9 percent of its population residing in townships, Lima with 45.3 percent of its population residing in townships, and the Ohio portion of the Cincinnati-Hamilton metropolitan area with 44.4 percent of its population residing in townships are also metropolitan areas with a substantial proportion of persons living in townships. The Ohio metropolitan area with the largest number of township residents in 2000 is Cincinnati-Hamilton with 690,783 township residents (Table 8). Cleveland-Akron has the second most township residents, with 476,747 township residents. Generally, all metropolitan areas have experienced increases in the number of township residents since Dayton-Springfield and Toledo are exceptions, with modest net losses for the time period (although from 1990 to 2000, the decline of 45,940 township residents in Dayton- Springfield is substantial). 2 Steubenville-Weirton, Wheeling, Parkersburg-Marietta, and Huntington-Ashland metropolitan areas are all only partially contained in the state of Ohio and none of the central cities of these metropolitan areas are located in the state either. Thus a high proportion of percent township population in these metropolitan areas is the result of the core urban areas not being included in the computation, as the core is located in other states.
26
27
28 Figure 4: Metro and Non Metro Township Population ,000,000 2,703,987 2,500,000 2,458,707 2,554,015 2,194,070 2,000,000 1,897,054 Population 1,500,000 1,000, , ,161 1,029,854 1,061,160 1,156,776 Non-Metro Township Pop. Metro Township Pop. 500, Year *Data Data reflects only Ohio Population of Metropolitan Area, excludes non-ohio portion of
29 25.0% Figure 5: Population Growth Rates 1960 to 2000: Metro City &Village Population, Non-Metro City & Village Population, Metro Township Population, and Non-Metro Township Population 20.0% 21.1% Percent Population Growth 15.0% 10.0% 5.0% 0.0% -5.0% Metro Population in Cities & Villages 15.7% 10.9% 5.2% Non Metro Population in Township 4.1% 12.1% -0.3% -1.0% 3.9% 3.0% 0.4% -1.7% 9.0% 5.9% 4.4% 2.4% 1960 to to to to 2000 Metro Population in Township Non Metro Population in Cities & Villages Decade *Data reflects only Ohio Population of Metropolitan Area, excludes non-ohio portion of Metropolitan Population
30
31 Table 8: Township Population within Metropolitan Areas Population: Metro Area: Canton-Massillon 147, , , , ,136 Cincinnati-Hamilton* 323, , , , ,783 Cleveland-Akron 352, , , , ,747 Columbus 200, , , , ,078 Dayton-Springfield 266, , , , ,088 Huntington-Ashland* 32,168 33,359 39,974 40,519 43,270 Lima 56,097 56,913 64,312 64,939 70,185 Mansfield 46,354 68,316 71,224 68,595 70,795 Parkersburg-Marietta* 26,057 29,550 36,829 37,048 38,898 Steubenville-Weirton* 34,389 32,795 35,545 33,105 32,945 Toledo 147,647 93, , , ,344 Wheeling* 37,012 35,845 40,040 34,967 36,513 Youngstown-Warren 227, , , , ,205 Total Metro Township Population: 1,897,054 2,194,070 2,458,707 2,554,015 2,703,987 Total Non Metro Township Population: 816, ,161 1,029,854 1,061,160 1,156,776 *Data reflects only Ohio Population of Metropolitan Area, excludes non-ohio portion of Metropolitan Population
32 Section 5: Concluding Observations This reports outlines some of the population changes occurring outside of Ohio s villages and cities. For a variety of reasons, ranging from availability of data to reliance on other contrasts such as rural versus urban, analysis of township demographic, social and economic change is not common. The data and analysis summarized in this report reveal that townships are home to over 34% of the State of Ohio s population, and that this proportion as well as the total number of township residents has been steadily growing since at least This report s analysis also reveals that there is great diversity within the state in terms of the number of residents within a township, the rates of growth across the last forty years, and the population density of townships. Spatial representation of some of these changes show that townships experiencing losses and/or having low population density are generally located in the northwestern, southern and eastern portions of the state. The townships with the most residents, the fastest population growth rates, and the highest density are primarily located around the largest urban areas (Cincinnati, Cleveland, and Columbus) or near the I-71 corridor linking them together. These descriptive, spatial and historic population trends raise a number of important policy and community questions that require further consideration. The increased interest in land-use and farmland preservation issues in the state of Ohio are clearly justified based on the population growth patterns identified in this report. One challenge, if current population growth patterns persist, is the need for townships and counties further from the urban edge to take land-use and farmland issues seriously. Between 1960s and 2000, the population density of townships even further away from the urban edge have steadily increased. This requires that not only those areas immediately adjacent to an urban area examine land-use issues, but areas much further away must do so also. An issue of local government capacity that must also be noted. Ohio s townships are growing and the capacity of local government to manage some of this growth in a fashion that preserves the rural character and meets the service needs of new residents is a question that requires additional research. Many of the larger townships have strong local capacity, but many townships likely do not have the same capacity, despite an increasing demand for planning or service provision. Relative to cities and villages, townships are an increasingly important settlement area. The pattern of steady township growth, despite annexation of township land and people by municipalities is quite remarkable. Regional efforts to plan and manage growth are increasingly going to have to include townships in these efforts, as a growing and substantial portion of the regional populations are located in townships. The pattern of township population growth in proximity to urban areas raises some interesting questions about why Ohioans are choosing to settle in townships versus cities and villages. There is a need to move beyond the simple population data analyzed in this report and understand the individual preferences and local policies that are resulting in township population growth. Another social question pertains to the emergence of community in townships. Much community research and policy work relates to incorporated places with the township areas surrounding the village or city often being lumped in with the incorporated place as
33 part of the same community. The pattern of more Ohioans choosing to live in townships coupled with the increased density of these townships raises questions about what is the community in these areas and is it appropriate to link the unincorporated open spaces of an area with the nearby village or city. This question is an important one, because for townships or any type of community to collectively address local issues and problems there may be a need for a shared sense of place and related social organizational capacity to bring people together to act. Research identifying what the primary social organizations in townships, besides township government, is needed. A related question is simply whether citizens in townships know one another and do they have the capacity to come together and address collective problems or work for community improvement. Often incorporated places have local service organizations or business organizations, such as the Chamber of Commerce, that provide leadership in local improvement efforts. What are the equivalents in townships and what might be done to develop these equivalents?
34 Appendix A: Townships Abolished Since 1960 Townships Dissolved, Completely Annexed or Abolished Since 1960 Township: County: Pop. In Last Census Before Abolishment Kelleys Island Erie 171 Kirtland Lake 4,867 Mentor Lake 17,423 Timberlake Lake 670 Waite Hill Lake 360 Black River Lorain 853 Adams Lucas 22,449 Streetsboro Portage 5,767 Macedonia Summit 4,060 Ross Wood 3, Wayne Montgomery 9,032 Lordstown Trumbull 2, Riveredge Cuyahoga 477 Northampton Summit 6, Warrensville Cuyahoga 1,934 Lima Licking 4,398 Mad River Montgomery 23,777 Madison Montgomery 20,605 Randolph Montgomery 12,848 Green Summit 15,626 Hudson Summit 11,969
35 Appendix B: Additional Notes on Data Calculating Township Population: Township data is derived from extracting place remainder data from the census bureau. Place remainder data is a very detailed level of geography and includes data for those persons residing in the township area. Persons living in cities and villages are not contained in this data. In summary, the township data reported in this report represents all demographic and population attributes of persons residing in the unincorporated land in the state and does not account for the population residing in a village or city. Place remainder data is more detailed than the traditional MCD (minor civil divisions) level of geography often used by the Census Bureau. Often MCD level geography does not disaggregate population residing in villages or cities from population living in townships, thus MCD level data is not an accurate representation of population residing in unincorporated areas. MCD level data will not match the township totals presented in this report. Census Designated Places or CDPs are concentrations of population or economic activity not within a city or village. The Census Bureau separates these place from township population counts. Because Census Designated Places do represent township population and are not affiliated with any city or village, these population counts were recalculated back into the township population totals according to the township(s) within which the CDP existed. Due to discrepancies in the hard copy census records utilized to produce 1960 and 1970 township data it was necessary to estimate some township population counts. The estimation method may introduce a slight error for a few 1970 township data presented in this report. Problems also arose due to the discovery of some incorrect data for township population within the printed documents. Township population for 1970 in some cases was computed by determining the percentage of the minor civil division population living in townships in 1960 and multiplying this percentage by the minor civil division population in 1970 to estimate population residing in the townships. This method was used to estimate 1970 population totals for 13 townships. Population totals presented in the report represent 100% count data from the U.S. Census Bureau. The 100% count totals are derived directly from questionnaire responses from the decennial census and are not adjusted for any sampling error. Thus, the data presented in this report may not match sample population counts (population counts with sampling error adjustments) released by the Census Bureau. Impacts of annexation on population loss are not distinguished in this report. Due to annexation activity (especially in metropolitan areas) many townships are geographically smaller in more recent decades. Annexation activity may result in unusually high population losses between census periods for a small number of townships. Future research related to this project may attempt to investigate population gains and losses associated with annexation, but such an undertaking is currently beyond the scope of this project.
36 Some townships that existed in 1960 have been abolished or dissolved over time. A total of 21 townships have been dissolved or abolished since These townships, their geographic location and population count recorded in the decennial census before their abolishment is listed in Appendix A. Calculating Township Population Density: Population Density for Townships was calculated by dividing land area by population counts for all Ohio townships. The following list describes methods utilized to calculate land area for townships in each decennial census year. All area measurements were calculated in square miles Land Area: Area Measurement Report Areas of Ohio U.S. Census Bureau Land Area: Estimated by calculating the mean value of 1960-township land area and 1980 township land area Land Area: Geolytics CensusCD area measurements were calculated in a GIS using boundary files from Geolytic s CensusCD Townships areas were created by overlaying minor civil division boundaries with place boundaries. After overlaying place boundaries, all residual minor civil division land was identified as township area. Area calculations were performed after creating township boundaries Land Area: 1990 Census of Population, Summary Population and Housing Characteristics, Ohio Land Area: Calculated utilizing a Geographic Information System and 2000 Census Tiger Files. Townships areas were created by overlaying minor civil division boundaries with place boundaries. After overlaying place boundaries, all residual minor civil division land was identified as township area. Area calculations were performed after creating township boundaries.
2017 LIHTC Rent and Income Limits for 50% and 60%
 Adams 50% rent $505 $540 $648 $749 $836 $922 Allen 50% rent $505 $540 $648 $749 $836 $922 ~ Lima MSA 50% rent $535 $573 $687 $794 $886 $978 50% income $21,400 $24,450 $27,500 $30,550 $33,000 $35,450 $37,900
2018 LIHTC Rent and Income Limits for 50% and 60%
 Adams 50% rent $537 $576 $691 $798 $891 $983 Allen 50% rent $548 $588 $706 $815 $910 $1,003 ~ Lima MSA 50% income $21,950 $25,100 $28,250 $31,350 $33,900 $36,400 $38,900 $41,400 60% rent $658 $705 $847
U.S. DEPARTMENT OF HUD 04/11/2017 STATE: OHIO ADJUSTED HOME INCOME LIMITS
 Akron, OH MSA Canton-Massillon, OH MSA 30% LIMITS 13800 15800 17750 19700 21300 22900 24450 26050 VERY LOW INCOME 23000 26300 29600 32850 35500 38150 40750 43400 60% LIMITS 27600 31560 35520 39420 42600
A Hannah News Service Publication. Ohio s Residential Real Estate Markets
 ON THE MONEY A Hannah News Service Publication Vol. 130, No. 11 By Bill LaFayette, PhD, owner, Regionomics LLC June 14, 2013 Ohio s Residential Real Estate Markets Residential real estate markets have
What does the Census of 2000 tell us about
 Inside Indiana s Counties: Township Population Changes, 1990 to 2000 Morton J. Marcus Executive Director, Indiana Business Research Center, Kelley School of Business, Indiana University Figure 2 Distribution
LIHTC Properties in Franklin County
 LIHTC Properties in Franklin County Mark Potts Office of Auditor Clarence E. Mingo, II Director of Government Relations Mapotts@franklincountyohio.gov LIHTC Properties Need to notify Auditor before or
Table of Contents. Appendix...22
 Table Contents 1. Background 3 1.1 Purpose.3 1.2 Data Sources 3 1.3 Data Aggregation...4 1.4 Principles Methodology.. 5 2. Existing Population, Dwelling Units and Employment 6 2.1 Population.6 2.1.1 Distribution
2014 Plan of Conservation and Development
 The Town of Hebron Section 1 2014 Plan of Conservation and Development Community Profile Introduction (Final: 8/29/13) The Community Profile section of the Plan of Conservation and Development is intended
Washington Market Highlights: Third Quarter 2018
 Washington State s Housing Market 3rd Quarter 2018 Washington Market Highlights: Third Quarter 2018 Existing home sales rose in the third quarter by 0.1 percent to a seasonally adjusted annual rate of
Technical Description of the Freddie Mac House Price Index
 Technical Description of the Freddie Mac House Price Index 1. Introduction Freddie Mac publishes the monthly index values of the Freddie Mac House Price Index (FMHPI SM ) each quarter. Index values are
City of Lonsdale Section Table of Contents
 City of Lonsdale City of Lonsdale Section Table of Contents Page Introduction Demographic Data Overview Population Estimates and Trends Population Projections Population by Age Household Estimates and
Washington Market Highlights: Fourth Quarter 2018
 Washington State s Housing Market 4th Quarter 2018 Washington Market Highlights: Fourth Quarter 2018 Existing home sales fell in the fourth quarter by 2.7 percent to a seasonally adjusted annual rate of
Existing Conditions: Economic Market Assessment
 Existing Conditions: Economic Market Assessment Introduction The US 24/40 Corridor Study examined existing conditions as they related to economic and commercial market assessments, existing land use, and
REAL ESTATE MARKET OVERVIEW 1 st Half of 2015
 REAL ESTATE MARKET OVERVIEW 1 st Half of 2015 With Comparisons to the 2 nd Half of 2014 September 4, 2015 Prepared for: First Bank of Wyoming Prepared by: Ken Markert, AICP MMI Planning 2319 Davidson Ave.
Lingering Impact: Report on 2016 Foreclosure Trends
 December 2017 Consumer Protection Lingering Impact: Report on Foreclosure Trends Hannah Lebovits Introduction Homes provide shelter, but they are often a long-term investment and source of financial security,
Washington Market Highlights: Fourth Quarter 2017
 Washington State s Housing Market 4th Quarter 2017 Washington Market Highlights: Fourth Quarter 2017 Existing home sales declined in the fourth quarter by 0.2 percent to a seasonally adjusted annual rate
CASS COUNTY MASTER PLAN July 1, Appendix C LAND USE
 Appendix C LAND USE Introduction Existing land use and development patterns in Cass County are important considerations in the development of policies addressing future growth and land use. Existing land
Existing Land Use. Typical densities for single-family detached residential development in Cumberland County: 1
 Existing Land Use A description of existing land use in Cumberland County is fundamental to understanding the character of the County and its development related issues. Economic factors, development trends,
Attachment 3. Guelph s Housing Statistical Profile
 Attachment 3 Guelph s Housing Statistical Profile Table of Contents 1. Population...1 1.1 Current Population (26)...1 1.2 Comparative Growth, Guelph and Ontario (21-26)...1 1.3 Total Household Growth (21
2012 Indiana Tax Credit Rental Housing Survey
 2012 Indiana Tax Credit Rental Housing Survey 155 East Columbus Street Suite 220 Pickerington, OH 43147 Bowen National Research conducted a statewide survey of nearly 450 Tax Credit rental housing properties
Town of Prescott Valley 2013 Land Use Assumptions
 Town of Prescott Valley 2013 Land Use Assumptions Raftelis Financial Consultants, Inc. November 22, 2013 Table of Contents Purpose of this Report... 1 The Town of Prescott Valley... 2 Summary of Land Use
Table of Contents. Title Page # Title Page # List of Tables ii 6.7 Rental Market - Townhome and Apart ment Rents
 RESIDENTIAL MONITORING REPORT 2013 Table of Contents Title Page # Title Page # List of Tables ii 6.7 Rental Market - Townhome and Apart ment Rents 21 List of Figures iii 7.0 Other Housing Demands and Trends
CHAPTER 3. HOUSING AND ECONOMIC DEVELOPMENT
 CHAPTER 3. HOUSING AND ECONOMIC DEVELOPMENT This chapter analyzes the housing and economic development trends within the community. Analysis of state equalized value trends is useful in estimating investment
Housing Indicators in Tennessee
 Housing Indicators in l l l By Joe Speer, Megan Morgeson, Bettie Teasley and Ceagus Clark Introduction Looking at general housing-related indicators across the state of, substantial variation emerges but
410 Land Use Trends Comprehensive Plan Section 410
 411 410 Comprehensive Plan Section 410 In order to plan future land use, we must know how the land is used today. This section includes the following: Definition of analyzed land-use categories Summary
Housing Characteristics
 CHAPTER 7 HOUSING The housing component of the comprehensive plan is intended to provide an analysis of housing conditions and need. This component contains a discussion of McCall s 1990 housing inventory
2011 Census Bulletin #4 Dwellings & Structure Type in Metro Vancouver
 2011 Census Bulletin #4 Dwellings & Structure Type in Metro Vancouver Regional Dwelling Count According to the 2011 Census figures recently released by Statistics Canada, there were 891,340 occupied private
5. PROPERTY VALUES. In this section, we focus on the economic impact that AMDimpaired
 5. PROPERTY VALUES In this section, we focus on the economic impact that AMDimpaired streams have on residential property prices. AMD lends itself particularly well to property value analysis because its
Status of HUD-Insured (or Held) Multifamily Rental Housing in Final Report. Executive Summary. Contract: HC-5964 Task Order #7
 Multifamily Rental Housing in Final Report. Executive Summary. Contract: HC-5964 Task Order #7") Status of HUD-Insured (or Held) Multifamily Rental Housing in 1995 Final Report Executive Summary Cambridge, MA Lexington, MA Hadley, MA Bethesda, MD Washington, DC Chicago, IL Cairo, Egypt Johannesburg,
Status of HUD-Insured (or Held) Multifamily Rental Housing in 1995 Final Report Executive Summary Cambridge, MA Lexington, MA Hadley, MA Bethesda, MD Washington, DC Chicago, IL Cairo, Egypt Johannesburg,
The rapidly rising price of single-family homes in. Change and Challenges East Austin's Affordable Housing Problem
 Change and Challenges East 's Affordable Housing Problem Harold D. Hunt and Clare Losey March 2, 2017 Publication 2161 The rapidly rising price of single-family homes in East has left homeownership out
November An updated analysis of the overall housing needs of the City of Aberdeen. Prepared by: Community Partners Research, Inc.
 City of Aberdeen HOUSING STUDY UPDATE November 2010 An updated analysis of the overall housing needs of the City of Aberdeen Prepared by: Community Partners Research, Inc. nd 10865 32 Street North Lake
Geographic Variations in Resale Housing Values Within a Metropolitan Area: An Example from Suburban Phoenix, Arizona
 INTRODUCTION Geographic Variations in Resale Housing Values Within a Metropolitan Area: An Example from Suburban Phoenix, Arizona Diane Whalley and William J. Lowell-Britt The average cost of single family
Comparative Housing Market Analysis: Minnetonka and Surrounding Communities
 Comparative Housing Market Analysis: Minnetonka and Surrounding Communities Prepared by Mark Huonder, Eric King, Katie Knoblauch, and Xiaoxu Tang Students in HSG 5464: Understanding Housing Assessment
BOARD OF TRUSTEES JEFFERSON TOWNSHIP, MONTGOMERY COUNTY, OHIO RESOLUTION NO
 BOARD OF TRUSTEES JEFFERSON TOWNSHIP, MONTGOMERY COUNTY, OHIO RESOLUTION NO. 16-125 AUTHORIZATION GIVEN TO ADMINISTRATOR BY THE JEFFERSON TOWNSHIP TRUSTEES TO MAKE APPLICATION TO JOIN CLOUT The Board of
2012 Profile of Home Buyers and Sellers Texas Report
 2012 Profile of Home and Sellers Report Prepared for: Association of REALTORS Prepared by: NATIONAL ASSOCIATION OF REALTORS Research Division December 2012 2012 Profile of Home and Sellers Report Table
PURPOSE OF STUDY. physical and social environments, as well as our political and economic institutions. As a commodity,
 PURPOSE OF STUDY Housing is one of the most important elements in our lives and our communities. Providing shelter and links to neighborhoods and larger communities, housing plays an essential part in
2012 Profile of Home Buyers and Sellers New Jersey Report
 Prepared for: New Jersey Association of REALTORS Prepared by: Research Division December 2012 Table of Contents Introduction... 2 Highlights... 4 Conclusion... 7 Report Prepared by: Jessica Lautz 202-383-1155
APPENDIX C CHARACTERISTICS OF THE ENERGIZE PHOENIX CORRIDOR
 APPENDIX C CHARACTERISTICS OF THE ENERGIZE PHOENIX CORRIDOR BACKGROUND ON RESIDENTIAL AND COMMERCIAL BUILDINGS IN THE EP CORRIDOR The 10-mile EP corridor (Figure G1) is a highly diverse, mixed-use L-shaped
RESOLUTION NO ( R)
") RESOLUTION NO. 2013-06- 088 ( R) A RESOLUTION OF THE CITY COUNCIL OF THE CITY OF McKINNEY, TEXAS, APPROVING THE LAND USE ASSUMPTIONS FOR THE 2012-2013 ROADWAY IMPACT FEE UPDATE WHEREAS, per Texas Local
RESOLUTION NO. 2013-06- 088 ( R) A RESOLUTION OF THE CITY COUNCIL OF THE CITY OF McKINNEY, TEXAS, APPROVING THE LAND USE ASSUMPTIONS FOR THE 2012-2013 ROADWAY IMPACT FEE UPDATE WHEREAS, per Texas Local
Census Tract Data Analysis
 Data Analysis Study Area: s within the City of Evansville, Indiana Prepared For Mr. Kelley Coures City of Evansville Department of Metropolitan Development 1 NW MLK Jr. Boulevard Evansville, Indiana 47708
Residential September 2010
 Residential September 2010 Karl L. Guntermann Fred E. Taylor Professor of Real Estate Adam Nowak Research Associate For the first time since March, house prices turned down slightly in August (-2 percent)
ARLA Members Survey of the Private Rented Sector
 Prepared for The Association of Residential Letting Agents ARLA Members Survey of the Private Rented Sector Second Quarter 2014 Prepared by: O M Carey Jones 5 Henshaw Lane Yeadon Leeds LS19 7RW June, 2014
Market Segmentation: The Omaha Condominium Market
 Market Segmentation: The Omaha Condominium Market Roger P. Sindt Steven Shultz University of Nebraska at Omaha Introduction A highly visible and growing niche in the homeownership market is the condominium
Radian RATE Programme STAR Survey Results April 2017 to March 2018 All Residents Report April 2018
 Radian RATE Programme STAR Survey Results April 2017 to March 2018 All Residents Report April 2018 Executive summary This report summarises the results of the continuous STAR survey of Radian s residents,
Nonresidential construction activity in the Twin Cities region was robust in 2013
 1 Recent Nonresidential Construction Activity in the Twin Cities Region March 2015 Key Findings After bottoming out in 2010, nonresidential construction activity in the Twin Cities region is once again
Radian RATE Programme STAR Survey Results April 2017 to December 2017 All Residents Report February 2018
 Radian RATE Programme STAR Survey Results April 2017 to December 2017 All Residents Report February 2018 Executive summary This report summarises the results of the continuous STAR survey of Radian s residents,
2016 Census Bulletin Changing Composition of the Housing Stock
 Metro Vancouver s Role Every five years, the Census of Canada provides benchmark data that is instrumental in analyzing and evaluating local government planning policies and services. Representing member
Pueblo Regional Development Plan, Addendum
 Pueblo Regional Development Plan, Addendum August 2014 Table of Contents Factual Foundation.1 Land Demand Analysis....1 Population Trends 2 Housing Trends..3 Employment Trends 4 Future Land Demand Summary.5
Key Findings on the Affordability of Rental Housing from New York City s Housing and Vacancy Survey 2008
 Furman Center for real estate & urban policy New York University school of law n wagner school of public service 110 West 3rd Street, Suite 209, New York, NY 10012 n Tel: (212) 998-6713 n www.furmancenter.org
Housing Market Affordability in Northern Ireland
 Housing Market Affordability in Northern Ireland A report commissioned by the Northern Ireland Housing Executive and Chartered Institute of Housing from Professor Steve Wilcox, University of York The Regional
Characteristics of Recent Home Buyers
 Characteristics of Recent Home Buyers Special Studies, February 1, 2019 By Carmel Ford Economics and Housing Policy National Association of Home Builders Introduction To analyze home buyers NAHB uses the
THE TREND OF REAL ESTATE TAXATION IN KANSAS, 1910 TO 1942¹
 THE TREND OF REAL ESTATE TAXATION IN KANSAS, 1910 TO 1942¹ HAROLD HOWE². INTRODUCTION The purpose of this study is to show the trends of taxes on farm and city real estate in Kansas from 1910 to 1942 and
8Land Use. The Land Use Plan consists of the following elements:
 8Land Use 1. Introduction The Land Use Plan consists of the following elements: 1. Introduction 2. Existing Conditions 3. Opportunities for Redevelopment 4. Land Use Projections 5. Future Land Use Policies
Do Tenant- and Place-Based Rental Housing Programs Complement Each Other? Evidence from Ohio
 Do Tenant- and Place-Based Rental Housing Programs Complement Each Other? Evidence from Ohio Brett Barkley 1 Amy Higgins 1 Francisca García-Cobián Richter 1,2 1 Federal Reserve Bank of Cleveland 2 Case
Agenda Re~oort PUBLIC HEARING: PROPOSED ADJUSTMENTS TO INCLUSIONARY IN-LIEU FEE RATES
 Agenda Re~oort August 27, 2018 TO: Honorable Mayor and City Council THROUGH: Finance Committee FROM: SUBJECT: William K. Huang, Director of Housing and Career Services PUBLIC HEARING: PROPOSED ADJUSTMENTS
Estimate of the Percentage of Rent that Constitutes Property Taxes in Minnesota. Based on Rent and Property Taxes Paid in 2016
 Estimate of the Percentage of Rent that Constitutes Property Taxes in Minnesota Based on Rent and Property Taxes Paid in 2016 March 1, 2018 Minnesota Statute 3.197 requires any report to the Legislature
Introduction. Sidney Ainkorn, Peter Mathison, and David Tomporowski. General History and Context. Geographic Context
 Sidney Ainkorn, Peter Mathison, and David Tomporowski Introduction General History and Context Geographic Context Richfield is a first-ring suburb, located just outside the city of Minneapolis (Map 1).
P o p u l a t i o n, L a n d U s e, a n d Z o n i n g
 P o p u l a t i o n, L a n d U s e, a n d Z o n i n g The Town of Upper Marlboro is located only 15 miles southeast of the District of Columbia, in the central portion of Prince George s County in the
Final 2011 Residential Property Owner Customer Survey
 TOP-LINE REPORT Final 2011 Residential Property Owner Customer Survey Prepared for: Prepared by: Malatest & Associates Ltd. CONTENTS SECTION 1: INTRODUCTION...3 1.1 Project Background... 3 1.2 Survey Objectives...
MEMORANDUM. Trip generation rates based on a variety of residential and commercial land use categories 1 Urban form and location factors the Ds 2
 MEMORANDUM Date: September 22, 2015 To: From: Subject: Paul Stickney Chris Breiland and Sarah Keenan Analysis of Sammamish Town Center Trip Generation Rates and the Ability to Meet Additional Economic
2018 Profile of Home Buyers and Sellers
 Massachusetts Report Prepared for: Massachusetts Association of REALTORS Prepared by: Research Division December 2018 Massachusetts Report Table of Contents Introduction... 2 Highlights... 4 Methodology...
ECONOMIC CURRENTS. Vol. 3, Issue 3 SOUTH FLORIDA ECONOMIC QUARTERLY. Introduction
 ECONOMIC CURRENTS THE Introduction SOUTH FLORIDA ECONOMIC QUARTERLY Economic Currents provides an overview of the South Florida regional economy. The report presents current employment, economic and real
Residential August 2009
 Residential August 2009 Karl L. Guntermann Fred E. Taylor Professor of Real Estate Adam Nowak Research Associate Summary The latest data for May 2009 reveals that house prices declined by 33 percent in
Residential January 2010
 Residential January 2010 Karl L. Guntermann Fred E. Taylor Professor of Real Estate Adam Nowak Research Associate Another improvement to the ASU-RSI is introduced this month with new indices for foreclosure
JASPER PLACE NEIGHBOURHOOD HOUSING ASSESSMENT NOVEMBER West Jasper Place. Glenwood. Britannia Youngstown. Canora
 JASPER PLACE NEIGHBOURHOOD HOUSING ASSESSMENT NOVEMBER 2013 West Jasper Place Glenwood Britannia Youngstown Canora TABLE OF CONTENTS A: INTRODUCTION................................... 01 B: PHOTOGRAPHIC
2012 Profile of Home Buyers and Sellers Florida Report
 2012 Profile of Home and Sellers Report Prepared for: REALTORS Prepared by: NATIONAL ASSOCIATION OF REALTORS Research Division December 2012 2012 Profile of Home and Sellers Report Table of Contents Introduction...
SOCIAL AND ECONOMIC TRENDS IN INDIANAPOLIS : AN OVERVIEW OF NEIGHBORHOOD LEVEL CHANGE
 SOCIAL AND ECONOMIC TRENDS IN INDIANAPOLIS 2000-2014: AN OVERVIEW OF NEIGHBORHOOD LEVEL CHANGE Alan Mallach Center for Community Progress November 2016 This is a draft research brief for limited public
Chapter 12 Changes Since This is just a brief and cursory comparison. More analysis will be done at a later date.
 Chapter 12 Changes Since 1986 This approach to Fiscal Analysis was first done in 1986 for the City of Anoka. It was the first of its kind and was recognized by the National Science Foundation (NSF). Geographic
Farm Real Estate Ownership Transfer Patterns in Nebraska s Panhandle Region
 University of Nebraska Lincoln Research Bulletin RB349 Farm Real Estate Ownership Transfer Patterns in Nebraska s Panhandle Region Bruce B. Johnson, Professor, Agricultural Economics Dennis M. Conley,
Appraisers and Assessors of Real Estate
 http://www.bls.gov/oco/ocos300.htm Appraisers and Assessors of Real Estate * Nature of the Work * Training, Other Qualifications, and Advancement * Employment * Job Outlook * Projections Data * Earnings
Hamilton Heights Manhattan. Morningside Heights Harlem
 Sutton Area TriBeCa Upper East Side Upper West Side Washington Heights West Village The Corcoran Report Battery Park City Beekman Carnegie Hill Central Park South Chelsea Flatiron Clinton East Harlem East
Appendix D HOUSING WORK GROUP REPORT JULY 10, 2002
 Appendix D HOUSING WORK GROUP REPORT JULY 10, 2002 Work Group Assignment At the 20/20 forum in April 2001, the community expressed a need for housing policies which will protect both the Town s social
Assessment Quality: Sales Ratio Analysis Update for Residential Properties in Indiana
 Center for Business and Economic Research About the Authors Dagney Faulk, PhD, is director of research and a research professor at Ball State CBER. Her research focuses on state and local tax policy and
Regression Estimates of Different Land Type Prices and Time Adjustments
 Regression Estimates of Different Land Type Prices and Time Adjustments By Bill Wilson, Bryan Schurle, Mykel Taylor, Allen Featherstone, and Gregg Ibendahl ABSTRACT Appraisers use puritan sales to estimate
3. FISCAL IMPACT ANALYSIS FISCAL IMPACT ANALYSIS 29
 3. FISCAL IMPACT ANALYSIS FISCAL IMPACT ANALYSIS 29 The purpose of fiscal impact analysis is to estimate the impact of a development or a land use change on the budgets of governmental units serving the
2017 Profile of Home Buyers and Sellers
 New Jersey Report Prepared for: New Jersey REALTORS Prepared by: Research Division December 2017 New Jersey Report Table of Contents Introduction... 2 Highlights... 4 Methodology... 8 Report Prepared by:
An Executive Summary. Residential Market Potential
 T1 Residential Market Potential for New Traditional Neighborhoods, Neighborhood Centers, Town Centers, Urban Centers, and The Urban Core T2 October 2004 Conducted by Zimmerman/Volk Associates Inc. Clinton,
A Historical Perspective on Illinois Farmland Sales
 A Historical Perspective on Illinois Farmland Sales Erik D. Hanson and Bruce J. Sherrick Department of Agricultural and Consumer Economics University of Illinois May 3, 2013 farmdoc daily (3):84 Recommended
Residential October 2009
 Residential October 2009 Karl L. Guntermann Fred E. Taylor Professor of Real Estate Adam Nowak Research Associate Summary The latest data for July 2009 reveals that house prices declined by 28 percent
ECONOMIC CURRENTS. Vol. 3, Issue 1. THE SOUTH FLORIDA ECONOMIC QUARTERLY Introduction
 ECONOMIC CURRENTS THE SOUTH FLORIDA ECONOMIC QUARTERLY Introduction Economic Currents provides an overview of the South Florida regional economy. The report contains current employment, economic and real
Prepared For: Pennsylvania Utility Law Project (PULP) Harry Geller, Executive Director Harrisburg, Pennsylvania
 Harry Geller, Executive Director Harrisburg, Pennsylvania") THE CONTRIBUTION OF UTILITY BILLS TO THE UNAFFORDABILITY OF LOW-INCOME RENTAL HOUSING IN PENNSYLVANIA June 2009 Prepared For: Pennsylvania Utility Law Project (PULP) Harry Geller, Executive Director Harrisburg,
THE CONTRIBUTION OF UTILITY BILLS TO THE UNAFFORDABILITY OF LOW-INCOME RENTAL HOUSING IN PENNSYLVANIA June 2009 Prepared For: Pennsylvania Utility Law Project (PULP) Harry Geller, Executive Director Harrisburg,
MISSISSIPPI GULF COAST APARTMENT SURVEY
 MISSISSIPPI GULF COAST APARTMENT SURVEY PREPARED FOR GULF REGIONAL PLANNING COMMISSION 1635 POPPS FERRY ROAD, SUITE G TELEPHONE (228) 864-1167 BILOXI, MISSISSIPPI 39532 PREPARED BY W. S. LOPER AND ASSOCIATES
CHAPTER 3. COMMUNITY CHARACTERISTICS. Community Summary. Recent Population Growth
 Chapter 3. Community Characteristics CHAPTER 3. COMMUNITY CHARACTERISTICS Community Summary Population and demographic change are among the most important measures to express growth or decline and its
Assessing the Cost Effectiveness of LEED Certified Homes in Kentucky By Stephen J. Glossner, Sanjeev Adhikari, and Hans Chapman
 10 The Journal of Technology Studies Assessing the Cost Effectiveness of LEED Homes in Kentucky By Stephen J. Glossner, Sanjeev Adhikari, and Hans Chapman ABSTRACT The purpose of this study was to analyze
The Impact of Using. Market-Value to Replacement-Cost. Ratios on Housing Insurance in Toledo Neighborhoods
 The Impact of Using Market-Value to Replacement-Cost Ratios on Housing Insurance in Toledo Neighborhoods February 12, 1999 Urban Affairs Center The University of Toledo Toledo, OH 43606-3390 Prepared by
Minneapolis Trends. Permitted residential conversions, remodels and additions. Permitted non-residential conversions, remodels and additions
 Minneapolis Trends A Quarterly Overview of Socioeconomic & Housing Trends in Minneapolis Highlights for the third quarter of 213 third quarter 213 Labor force 219,777 residents change from 3Q-13 2Q-13
County Survey. results of the public officials survey in the narrative. Henry County Comprehensive Plan,
 Introduction During the planning process, a variety of survey tools where used to ensure the Henry County Comprehensive Plan was drafted in the best interests of county residents and businesses. The surveys
2013 Profile of Home Buyers and Sellers Metro Indianapolis Report
 Prepared for: Metro Indianapolis Board of REALTORS Prepared by: Research Division December 2013 Table of Contents Introduction... 2 Highlights... 3 Conclusion... 6 Methodology..7 Report Prepared by: Jessica
Massachusetts 2016 First Quarter Housing Report
 Massachusetts 2016 First Quarter Housing Report Outlook for 2016 Positive as Unit Sales Continue to Climb The re-entry of boomerang buyers and potential for millennial homeownership point to a strengthening
MARKET WATCH: Dakota County
 MARKET WATCH: Dakota County Trends in the unsubsidized multifamily rental market Minnesota Housing Partnership OCTOBER 2018 Across the Twin Cities, the growing ranks of renter households are facing an
Gold Beach Buildable Lands Analysis
 Gold Beach Buildable Lands Analysis Final Report Submitted to: City of Gold Beach Prepared by: Community Planning Workshop Community Service Center 1209 University of Oregon Eugene, OR 97403-1209 http://darkwing.uoregon.edu/~cpw
Implementing Small Area Fair Market Rents (SAFMRs) in the HCV Program. Plano Housing Authority Case Study
 in the HCV Program. Plano Housing Authority Case Study") Implementing Small Area Fair Market Rents (SAFMRs) in the HCV Program Plano Housing Authority Case Study 1 Contents Background...2 Motivations for Implementing SAFMR...2 Market conditions...2 Strategic
Implementing Small Area Fair Market Rents (SAFMRs) in the HCV Program Plano Housing Authority Case Study 1 Contents Background...2 Motivations for Implementing SAFMR...2 Market conditions...2 Strategic
HOME SALES RALLY IN THE FOURTH QUARTER TO KEEP WISCONSIN HOUSING MARKET STABLE
 Date: 2/11/2010 For Release: Immediately For More Information Contact: David E. Clark, Economist C3 Statistical Solutions Inc. Office phone: 414-803-6537 or William Malkasian, President Wisconsin REALTORS
Toledo Regional Association of REALTORS 2015 Housing Report
 Toledo Regional Association of REALTORS Housing Report Notes for Reading the Report The data we use is publicly available and statistically valid. Our interpretation of the data in some cases may lead
Trends in Affordable Home Ownership in Calgary
 Trends in Affordable Home Ownership in Calgary 2006 July www.calgary.ca Call 3-1-1 PUBLISHING INFORMATION TITLE: AUTHOR: STATUS: TRENDS IN AFFORDABLE HOME OWNERSHIP CORPORATE ECONOMICS FINAL PRINTING DATE:
4.0. Residential. 4.1 Context
 4. 0Residential 4.1 Context In 1986, around the time of Burnaby s last Official Community Plan, the City had a population of 145,000 living in 58,300 residential units. By 1996, there were 179,000 people
Housing Affordability in Lexington, Kentucky
 University of Kentucky UKnowledge CBER Research Report Center for Business and Economic Research 6-29-2009 Housing Affordability in Lexington, Kentucky Christopher Jepsen University of Kentucky, chris.jepsen@uky.edu
MISSISSIPPI GULF COAST APARTMENT SURVEY
 MISSISSIPPI GULF COAST APARTMENT SURVEY PREPARED FOR GULF REGIONAL PLANNING COMMISSION 1635 POPPS FERRY ROAD, SUITE G TELEPHONE (228) 864-1167 BILOXI, MISSISSIPPI 39532 PREPARED BY W. S. LOPER AND ASSOCIATES
CHAPTER 2 VACANT AND REDEVELOPABLE LAND INVENTORY
 CHAPTER 2 VACANT AND REDEVELOPABLE LAND INVENTORY CHAPTER 2: VACANT AND REDEVELOPABLE LAND INVENTORY INTRODUCTION One of the initial tasks of the Regional Land Use Study was to evaluate whether there is
Briefing Book. State of the Housing Market Update San Francisco Mayor s Office of Housing and Community Development
 Briefing Book State of the Housing Market Update 2014 San Francisco Mayor s Office of Housing and Community Development August 2014 Table of Contents Project Background 2 Household Income Background and