Capital Markets Day. Oslo 21 March 2013
|
|
|
- Cecily Dean
- 6 years ago
- Views:
Transcription
1 Capital Markets Day Oslo 21 March 2013
2 Welcome Baard Schumann CEO 2
3 Agenda 13:00 Registration 13:10 History and background 13:25 Strategic direction 13:55 Project portfolio and land bank 14:25 Q&A 14:30 Break 14:45 Project development, market and sales 15:25 Project execution 15:45 Q&A 15:50 Break 16:05 Financial update 16:35 Q&A 16:45 Summary and closing remarks 3
4 Strategic direction Baard Schumann CEO 4

5 STRATEGIC DIRECTION Vision Selvaag Bolig aims to be Norway s leading residential property builder, based on a unique ability to develop new competences. We aim to be a driving force for innovation Lervik brygge 5

6 STRATEGIC DIRECTION Values Care & creativity A great place to work A dependable business partner Building homes for ordinary people Create residential environments where people thrive Help making better cities 6


7 STRATEGIC DIRECTION Strategy Provide targeted housing concepts to suit aspirations of different households at affordable prices in and around main cities Three well defined and robust concepts Industrial approach to homebuilding Cost efficient module based solutions No in-house construction unit Focus on Greater Oslo, Stavanger and Bergen 7


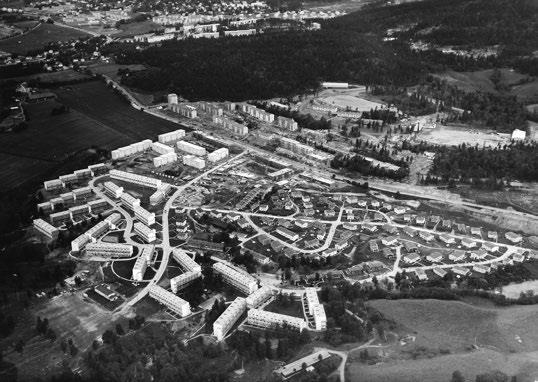


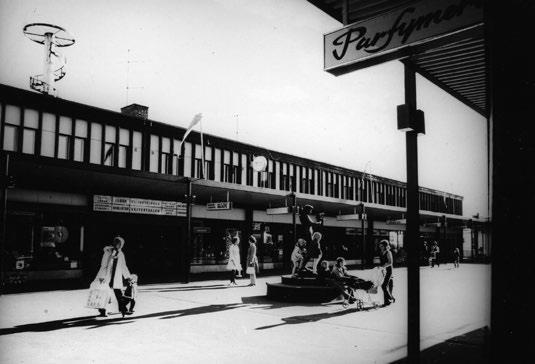


8 STRATEGIC DIRECTION Housing for all Housing for all The Gullhaug House 2013 Pluss: Housing with extra service homes completed 2012 e Modular construction Listed at Oslo Børs Løren district Defind hous i ng concept s Terraced buildings 1988 Industrial production Veitvet district The Ekeberg House 8


9 STRATEGIC DIRECTION Segmentation through housing concepts Affordable apartments based on a "no frills" model Low cost land plots situated in fringe zones of large cities Mostly modular based construction Young people in the start-up phase Apartments/small houses situated in high density areas Established housing solutions, solid quality and well planned living environment Modular and on site construction Single people/couples in all ages, with/without children Apartments with attractive, central location in large cities High quality standard coupled with a service concept On site construction Affluent customers who value comfort and convenience 9


10 STRATEGIC DIRECTION Industrial approach Modular construction Sub-contractors in Estonia and Poland Modern factories 13 years of experience Profitable Lower construction costs Higher project margins Sensible house prices High quality Reduced risk of faults Technically better homes Energy efficient homes 10


11 STRATEGIC DIRECTION Module based solutions Generation I Kornmoenga Løren 11


12 STRATEGIC DIRECTION Module based solutions Generation II Bjørnåsen Moss Glassverk 12


13 STRATEGIC DIRECTION Module based solutions Generation III Lørenskog Stasjonsby, Sprinten Aase Gaard 13

14 STRATEGIC DIRECTION Targets Increase share of modular construction Project margins Modular 16% On-site 12% 1500 units for delivery in 2015 Lørenskog Stasjonsby 14

15 Residential development value chain STRATEGIC DIRECTION Value drivers Land bank development Project development and market adaption Project execution 6 36 MONTHS 6 12 MONTHS 3 9 MONTHS MONTHS Acquire and refine land for development Project design Marketing and sale Construction Zoning Sales start Construction start Deliveries 15
16 Project portfolio and land bank Baard Schumann CEO 16
17 PROJECT PORTFOLIO AND LAND BANK Norway s leading homebuilder Sales in 2012: units Tromsø 243 units Land bank for homes 1067 units under construction Trondheim 260 units Module 25% 1067 Units On-site 75% Bergen 189 units Stavanger units Greater-Oslo units Stockholm 79 units Kristiansand 34 units Note: The numbers represent the size of the land portfolio as at 31. December All numbers are adjusted for Selvaag Bolig s share in joint ventures. 1) Greater Oslo area: Oslo, Akershus, Buskerud, Vestfold and Østfold, 2) 260 units at Stord (Hordaland county) and 50 units at Alfaz Del Sol (Spain), 3) The residential property development portfolio consists of land plots that are to be paid for when planning permission is received. These have a development potential of ~1 600 residential units, whereof the company has purchasing obligations for ~ and purchasing options for ~400. units. Other 310 units 17
 Avløs/Ballerud -")


18 PROJECT PORTFOLIO AND LAND BANK Greater Oslo (selected projects) Avløs/Ballerud - Bærum units - Avløs - Ballerud Note: purchasing obligations Nydalen - Oslo 323 units - Fernanda Nissen - Lillohøyden Lørenskog - Lørenskog units - Skårødegården - Vestparken - Skårer bolig - LSV Landås - Oslo units Note: purchasing option and obligation Oslo South - Oslo units - Bjørnåsen - Mortensrud 18
")

 - Lervik")


19 PROJECT PORTFOLIO AND LAND BANK Stavanger (selected projects) Jaasund - Sola units - Jaasund - Jaasund Bolig Lervik brygge- Stavanger units (+150 if high utilisation) - Lervik Brygge - Lervik Brygge Øya Note: includes option Emmaustunet - Stavanger 22 units Aase Gård - Sandnes units Sandnes center * units *SBO s share in the project 19
 Tromsø 230-260 units -")

20 PROJECT PORTFOLIO AND LAND BANK Rest of Norway (selected projects) Tromsø units - Strandkanten I - Strandkanten II Trondheim units - Lade Bergen units - Nesttun - Nyhavn 20

21 PROJECT PORTFOLIO AND LAND BANK Land bank strategy Acquisition criteria Proximity to attractive high growth areas Preferably non-zoned with option to buy when planning permission is given Potential of units Good infrastructure and public transport Alignment with existing land bank portfolio Greater Oslo, Stavanger and Bergen areas Sandnes sentrum Location to fit with criteria for one or more of the three housing concepts Photo: nyebilder.no 21


22 PROJECT PORTFOLIO AND LAND BANK Land bank strategy Recently acquired land for development Avløs Ballerud 22

23 PROJECT PORTFOLIO AND LAND BANK Land bank strategy Project refining Utilize existing land bank Allows for flexibility in development plans Adaptive to market changes Maximizing utilization through continuous project evaluation and development Kaldnes brygge 23


24 PROJECT PORTFOLIO AND LAND BANK Lervik Brygge phase 2 - utilisation turnaround Discovered significant unrealised potential in zoning volume Planning permits for up to sq m TBRA New zoning proposal for TBRA of approximately sq m sq m SBRA ( sq m TBRA) Approximately 150 housing units Development potential Paid for sq m SBRA, receives sq m SBRA Profit for additional land Additional profit as developer Previous zoning plan New zoning plan Lervik Brygge 24
25 Q&A 25
26 Project development, market and sales Baard Schumann CEO 26

27 PROJECT DEVELOPMENT, MARKETS AND SALES EXTERNAL FACTORS Cost development Approximate industry margins (NOK) 70,000 60,000 50,000 40,000 30,000 20, ,000 Lillohøyden 0 Oslo Center Eastern Norway Modular Construction cost Sales price Source: Selvaag Bolig/ECON 27
28 PROJECT DEVELOPMENT, MARKETS AND SALES EXTERNAL FACTORS Demographic changes People per household in Norway High population growth in main cities 3.3 Urbanization Immigration Increased life expectancy Less people per household Supports need for smaller houses Source: Statistics Norway 28
29 PROJECT DEVELOPMENT, MARKETS AND SALES EXTERNAL FACTORS Strong housing market Critical undersupply of houses in Oslo Support from strong national macro economics Significant housing need short and long term High immigration supports demand Selvaag Bolig well positioned in growth areas Housing units 9,000 6,000 3, Housing construction Housing need from population growth* Source: Statistics Norway * Average household size in Oslo is
30 PROJECT DEVELOPMENT, MARKETS AND SALES EXTERNAL FACTORS Increasing demand for lower cost housing Immigration from Europe most important Labour related immigration for permanent settling 74% of population growth from immigration 3% 3% 0% Solid purchase power, though somewhat below population average Selvaag Bolig well positioned for constructing affordable homes Strongest growth in Selvaag Bolig s focus areas 31% 50 % labor related 52% Europe Africa Asia North America South America Oceania 11% Source: Statistics Norway Source: Statistics Norway / Selvaag Bolig 30
31 PROJECT DEVELOPMENT, MARKETS AND SALES EXTERNAL FACTORS Regional differences Oslo & Eastern Norway Limited amount of unsold finished units Amount of unsold started and not started units stable Stavanger & Western Norway Practically no unsold finished units Amount of unsold started and not started units stable Contractors East: Many suppliers, good capacity West: Few large, limited capacity Unsold units status East 6,000 3,000 0 Construction not started Construction started Finished Unsold units status West 2,000 1,000 0 Apr 12 Jun 12 Aug 12 Oct 12 Dec 12 Feb 12 Construction not started Construction started Finished Source: ECON 31
 Lervig Brygge (Stavanger) Løren Start")

 Sold 108 (100%) Sold 36 (100%) Sold 67(100%) Sold 73 (39%)")


32 PROJECT DEVELOPMENT, MARKETS AND SALES SELVAAG BOLIG ADAPTATION Multi-concept-projects Løren (Oslo) Lervig Brygge (Stavanger) Løren Start Lørenpynten* Løren Torg Hageby Start Sjøkvartalet Lervik Brygge Pluss No of apartments 88 No of apartments 127 No of apartments 108 No of apartments 36 No of apartments 67 No of apartments 188 Sold 88 (100%) Sold 80 (63%) Sold 108 (100%) Sold 36 (100%) Sold 67(100%) Sold 73 (39%) Construction start Q Construction start Q Construction start Q Construction start Q2 2012e Construction start Q Construction start Q Completion Q4 2013e Completion Q1 2015e Completion Q Completion Q3 2013e Completion Q Completion Q4 2015e * Several development phases 32

33 PROJECT DEVELOPMENT, MARKETS AND SALES SELVAAG BOLIG ADAPTATION Market adaption Changed market conditions Original project not meeting demand Project development flexibility enable project adjustments Pluss Hjem and Start sq m per unit Onsite Module Nyhavn 33
34 PROJECT DEVELOPMENT, MARKETS AND SALES SELVAAG BOLIG ADAPTATION Sales optimization targeting correct pricing Aim for 60% sold after 6-9 months Price adjustments at construction start All major costs secured at 60% sold Price adjustments during construction period 6-9 MONTHS 60% sold MONTHS 40% sold Last unit sold at time of delivery Sales start Construction start Deliveries Price adjustments 34
35 Project execution Baard Schumann CEO 35


36 PROJECT EXECUTION Modules vs. on-site construction Approximate average value On-site Modular 12% 4% - 6% 10% - 20% 6% - 10% 16% 3% - 5% 10% - 20% 5% - 8% 60% - 65% 55% - 60% Margin Financial costs Costs of land Project managment Construction cost Lørenskog stasjonsby - modular On-site Modular Lervik Brygge on-site 36


37 PROJECT EXECUTION Project duplication Bjørnåsen Start - floor plan 37


38 PROJECT EXECUTION Project duplication Duplication of Bjørnåsen Start project Lørenskog stasjonsby Lørenskog stasjonsby 38
39 PROJECT EXECUTION Project management optimisation Standardised and detailed project specifications Reduce deviation Improve contractor efficiency Lowers project design cost 39


40 PROJECT EXECUTION Long term relations Leading, financial solid contractors Improved efficiency through project recurrence Fixed price contracts Most costs fixed at 60% sold 40
41 Q&A 41
42 Financial update Haavard Rønning CFO 42
43 FINANCIAL UPDATE Margin break down 100% 55% - 65% 5% - 10% 10% - 20 % 3% - 6% 12% - 16% Sales revenue Construction cost Project managment Costs of land Financial costs Margin 43


44 FINANCIAL UPDATE Project margins Q Q Kornmo Kaldnes Nesttun Jaasund Løren 2B* Løren 5* Bjørnåsen Syd Lervig Brygge Tangen Location Tårnåsen Tønsberg Bergen Sola Oslo Oslo Oslo Stavanger Kristiansand No of units Sqm SBRA Revenues NOK 40m NOK 71m NOK 269m NOK 45m NOK 259m NOK 362m NOK 92m NOK 238m NOK 247m 29.8 % 15.0 % 13.7 % 14.7 % 15.7 % 12.2 % 14.9 % 18.4 % 15.2 % Project margin 9.6 % 14.3 % *Including commercial property On-site Module Margin before adjustments for value added 44
45 FINANCIAL UPDATE Substantial portfolio for development Total land bank portfolio No of units * Total Land bank Option Obligation to acquire In production JV Land bank included in the balance sheet *The portfolio is adjustedwith 253 units at Lillohøyden and 127 units at Lørenpynten, but only 61 units at Lillohøyden and 54 units at Lørenpynten had started construction as of 31 December
46 FINANCIAL UPDATE Land bank valuation External valuation vs. booked value Independent land valuation, by Akershus Eiendom. NOKm Valuation is mainly based on a calculated profit from sales of fully developed housing units For projects under development, remaining costs are split on developer and buyer, affecting value distribution DCF valuation method is applied on residents for lease Booked value Added value Valuation Akershus Eiendom 46
47 FINANCIAL UPDATE Income statement IFRS (figures in NOK million) FY 2012 FY 2011 Total operating revenues Project expenses ( ) (199.0) Other operating expenses (212.6) (173.3) Associated companies and joint ventures EBITDA EBITDA margin 19.3 % (5.8) EBIT EBIT margin 17.4 % 2.3 % Profit/(loss) before taxes (29.0) Income taxes (101.8) 23.3 Net income (5.7) Earnings per share (NOK) 3.39 (0.15) Net income for the period attributable to: Minority interests 68.0 (1.0) Shareholders in Selvaag Bolig ASA (majority interests) (4.7) 47
48 FINANCIAL UPDATE Cash Flow statement (figures in NOK million) FY 2012 FY 2011 Net cash flow from operating activities (354.9) Net cash flow from investment activities Net cash flow from financing activities (319.5) Net change in cash and cash equivalents Cash and cash equivalents at start of period Cash and cash equivalents at end of period
49 FINANCIAL UPDATE Sound balance sheet (figures in NOK million) Total non-current assets Inventories (property) Other current assets TOTAL ASSETS Total equity Equity attributed to shareholders in Selvaag Bolig ASA * Non-controlling interests Total non-current liabilities Total current liabilities TOTAL EQUITY AND LIABILITIES Equity ratio majority shareholders in Selvaag Bolig ASA 36.0 % 24.0 % Equity ratio non-controlling interests 1.3 % 0.2 % *corresponding to NOK 22.1 per share 49
50 FINANCIAL UPDATE Financial structure going forward Defined down payment of term loan: 39 MNOK in MNOK in MNOK in 2015 Long-term goal: Working capital facilities only in mother company (Selvaag Bolig ASA) Land loans and corresponding construction loans in single purpose entity(spe) Loan facility 1 NOK 225 million term loan from DNB 2 NOK 150 million revolving credit facility from DNB maturing in NOK 150 million working capital facility from DNB maturing in NOK 500 million long term land loan from DNB 5 Land loan facilities from a range of Nordic credit institutions 6 Construction loan facilities from a range of Nordic credit institutions Drawn per (NOKm) Interest rate margin % % % % % % % % 50
51 FINANCIAL UPDATE Construction loans Revolving construction loan (example) Land acquisition 50% equity, 50% land loan Interest and development costs paid by equity up to construction start NOKm Land loan converted to construction loan at construction start, given 60% presale 0 Separate construction loan for each project -50 Revolving credit facility when multiple building phases -100 Building costs 100% financed by construction loan Interest added to construction loan (145) Months 51
52 Q&A 52
53 Summary Baard Schumann CEO 53
54 SUMMARY Summary Maintain position as leading residential developer in Norway Utilize potential in strong land bank Continue development of industrial approach to homebuilding Increase share of modular based development Average project margins of 12% and 16% for on-site and module 1,500 units for delivery in
55 Thank you for your attention AGM 2012: 10 April 2013 Q1 2013: 29 May
Interim report presentation
 Interim report presentation 13 July, 2017 Anders Nissen, CEO Liia Nõu, CFO Forward-looking statements This presentation contains forwardlooking statements. Such statements are subject to risks and uncertainties
Strong progress for Property Management
 Strong progress for Property Management Interim report January-June 2016 Stockholm, 18 August 2016 Anders Nissen, CEO Liia Nõu, CFO Forward-looking statements PANDOX EXCELLENCE IN HOTEL OWNERSHIP & OPERATIONS
Interim report presentation
 Interim report presentation 10 November, 2017 Anders Nissen, CEO Liia Nõu, CFO Forward-looking statements This presentation contains forwardlooking statements. Such statements are subject to risks and
Real estate development significant growth driver Company profile and business model High-quality Investment Portfolio
 STRATEGY Over three decades of continual development, CA Immo has become distinctly competitive and secured an excellent market position in Central Europe. By letting, managing and developing high quality
26 February 2013 FIRST HALF RESULTS PRESENTATION
 26 February 2013 FIRST HALF RESULTS PRESENTATION Investment highlights Proven track record of consistent earnings growth and meeting targets Strategically located and diverse residential portfolio Urban
REPORT S T A T U S Q North Bridge Nordic Property. Contact. Hoffsvn. 1C P.O. Box 211 Skøyen 0212 Oslo - Norway
 Q3 2006 North Bridge Nordic Property Hoffsvn. 1C P.O. Box 211 Skøyen 0212 Oslo - Norway Contact t: + 47 22 51 76 40 f: + 47 22 51 76 20 www.northbridge.no WELCOME The board and CEO of North Bridge Nordic
Good underlying growth
 Good underlying growth Interim report January-March 2016 Stockholm, 3 May 2016 Anders Nissen, CEO Liia Nõu, CFO Agenda Introduction Financial review Market and business Q&A Anders Nissen Liia Nõu Anders
AUDIOCAST PRESENTATION H1/2018
 AUDIOCAST PRESENTATION H1/2018 IRREPLACEABLE AND MULTI-FUNCTIONAL ASSETS IN GROWING CATCHMENTS 2 WE CONTINUE OUR TRANSFORMATION JOURNEY 2011 H1/2018 GOAL 2022 41 # OF SHOPPING # OF SHOPPING 78 30 CENTRES
Interim presentation. 13 July, Anders Nissen, CEO Liia Nõu, CFO
 Interim presentation 13 July, 2018 Anders Nissen, CEO Liia Nõu, CFO Profitable growth 20% R12M Return on equity 2 1 2 3 Profitable acquisitions in new large markets Continued strong development in Brussels
FY18/12 Q2 PRESENTATION
 FY18/12 Q2 PRESENTATION RENESAS ELECTRONICS CORPORATION JULY 31, 2018 2018 Renesas Electronics Corporation. All rights reserved. FINANCIAL TARGETS AND STRATEGY Long-term Financial Targets *1 (Starting
Welcome to Opportunity Day Financial Performance Result for the 6 months period ended Jun 30, 2018
 Welcome to Opportunity Day Financial Performance Result for the 6 months period ended Jun 30, 2018 Creating Perfect Cities where Possibilities Happen Disclaimer This document was prepared by Amata Corporation
Douja Promotion Groupe Addoha. An African leader of Real Estate Development
 Douja Promotion Groupe Addoha An African leader of Real Estate Development Summary I II III IV V Addoha Group: Strong fundamentals & a clear focus Development in Morocco Development in Africa Key highlights
Affordable Housing in Kenya
 Affordable Housing in Kenya Investment cases for developers building affordable homes in Nairobi Industry Report June 26, 2018 About the Report This report describes the affordable housing real estate
Interim presentation. 24 April, Anders Nissen, CEO Liia Nõu, CFO
 Interim presentation 24 April, 2018 Anders Nissen, CEO Liia Nõu, CFO A stable earnings development 21% Return on equity 2 1 2 3 Profitable acquisitions Positive effects from product development A seasonally
January - September 2011 results
 January - September 2011 results 14 November 2011 Highlights 9M 2011 RESULTS Commercial Property business continues showing a recurrent income giving the company stability and solidity, representing 95%
RESULTS PRESENTATION for the year ended 28 February 2017
 RESULTS PRESENTATION for the year ended 28 February 2017 AGENDA INTRODUCTION HIGHLIGHTS OPERATIONAL OVERVIEW FINANCIAL OVERVIEW LOOKING FORWARD ANNEXURE 2 INTRODUCTION Founded in 1996 Listed on the JSE
AUDIOCAST PRESENTATION Q1/2018
 19.4.2018 AUDIOCAST PRESENTATION Q1/2018 HIGHLIGHTS Q1/2018 EPRA EARNINGS PER SHARE EUR 0.041 -Divestments in 2017 and weaker currencies impacted EPRA EPS -Efficient cost management with administrative
DEVELOPING EAST CAIRO SINCE
 1 DEVELOPING EAST CAIRO SINCE 1959 MNHD at a glance 2 2019 MNHD Corporate History & Structure MNHD is currently positioned as one of the leading real estate developers in Egypt MNHD s history dates back
NORTH BRIDGE NORDIC PROPERTY AS
 NORTH BRIDGE NORDIC PROPERTY AS STATUS REPORT 1st QUARTER 2012 www.northbridge.no PROPERTY UPDATE Newsec is the source of the values and yield 1) levels in the tables below. The valuations were updated
Investor Presentation Shaw and Partners - Emerging Leaders Conference
 Investor Presentation Shaw and Partners - Emerging Leaders Conference Your Community Developer 31 May 2017 1 AVJennings at a glance 2 ON AFFORDABLE HOUSING IN URBAN GROWTH CORRIDORS STRONG BALANCE SHEET
Full Year Results Presentation for the year ended 31 December March 2015
 Full Year Results Presentation for the year ended 31 December 2014 3 March 2015 Disclaimer This presentation is not intended to, and does not constitute or form part of, any offer, invitation or the solicitation
Certificate in Financial Management
 Certificate in Financial Page 1 of 11 Why Attend Most strategic and operational business decisions rely on a fundamental knowledge of financial management. Speaking and understanding the language of finance
H RESULTS 10 AUGUST 2018 TLG IMMOBILIEN AG H RESULTS
 TLG IMMOBILIEN AG H1 2018 RESULTS DISCLAIMER This presentation includes statements, estimates, opinions and projections with respect to anticipated future performance of TLG IMMOBILIEN ("Forward-Looking
Sponda Financial Results Q4 and FY February 2017
 Sponda Financial Results Q4 and FY 2016 3 February 2017 1. 2. 3. 4. Highlights for the Period Kari Inkinen Portfolio Development Pia Arrhenius Financials Niklas Nylander Business Environment and Business
Financial Analysis Workshop. Contents are subject to change. For the latest updates visit
 Financial Analysis Workshop Page 1 of 11 Why Attend In today s world, finance professionals are challenged with providing management a detailed analysis of the impact of the organization's financial decisions.
Report on 2018 Second Quarter Operating and Financial Results
 Report on 2018 Second Quarter Operating and Financial Results Forward-Looking Statements This press release includes "forward-looking statements." These statements are subject to a number of risks, uncertainties
INTERIM REPORT JANUARY MARCH 2016
 INTERIM REPORT JANUARY MARCH 2016 1 Strong start to the year JANUARY MARCH 2016 QUARTER Rental income amounted to MSEK 650 (589) Profit from property management totaled MSEK 340 (265), corresponding to
Corporate Presentation Q SHH Bostad AB
 Corporate Presentation Q3 2018 SHH Bostad AB SHH in brief A residential developer offering affordable housing throughout Sweden 3 SHH in brief Introduction SHH Bostad AB (publ) (SHH), incorporated 2010,
Q RESULTS 15 MAY 2018 TLG IMMOBILIEN AG Q RESULTS
 TLG IMMOBILIEN AG Q 208 RESULTS DISCLAIMER This presentation includes statements, estimates, opinions and projections with respect to anticipated future performance of TLG IMMOBILIEN ("Forward-Looking
Preliminary Results Presentation
 Preliminary Results Presentation Year to 30 June 2008 Tuesday 9 September 2008 Alan Bowkett Chairman Chairman s Introduction Early recognition, by management team of industry issues Adjustment in strategy
FY2012 RESULTS PRESENTATION
 FY2012 RESULTS PRESENTATION 21 August 2012 INVESTMENT HIGHLIGHTS Proven track record of consistent earnings growth and meeting targets Strategically located and diverse residential portfolio Urban and
2017 Annual Results Construction of solid and sustainable cash flow continues
 Press Release 2018/03/07 2017 Annual Results Construction of solid and sustainable cash flow continues The Board of Directors of the Société de la Tour Eiffel, meeting on 7 March 2018, approved the annual
Investor Presentation 2007
 Investor Presentation 2007 1 Forward Looking Statements This presentation contains forward-looking statements within the meaning of the federal securities laws. These statements reflect management s current
Efficient Finance and Accounting Operations: 2019 Best Practices and Updates
 Efficient Finance and Accounting Operations: 2019 Best Practices and Updates Page 1 of 11 Why Attend Stop what you are doing, take a step back, and look at how you perform your work. You will probably
2018 Half-Year Results Ongoing developments to prepare for the future
 Press Release 2018/07/20 2018 Half-Year Results Ongoing developments to prepare for the future The Board of Directors of Société de la Tour Eiffel, which met on 20 July 2018, approved the financial statements
Interim Report, H1 2017/18. Amerika Have, residential property Copenhagen, Denmark
 Interim Report, H1 2017/18 Amerika Have, residential property Copenhagen, Denmark Contents 1. The Group s results in H1 2017/18 Financial highlights and key ratios Segment results Projects handed over
IFRS in Saudi Arabia: Compliance with SOCPA. Contents are subject to change. For the latest updates visit
 IFRS in Saudi Arabia: Compliance with SOCPA Page 1 of 12 Why Attend Whether you work for a listed company in Saudi Arabia that has already adopted International Financial Reporting Standards (IFRS) or
CREATING A FUTURE WORTH LIVING. FOR PATIENTS. WORLDWIDE. EVERY DAY. Third quarter Conference call October 29, 2015
 CREATING A FUTURE WORTH LIVING. FOR PATIENTS. WORLDWIDE. EVERY DAY. Third quarter 2015 Conference call October 29, 2015 Our motivation in numbers 9m 2015 Every 0.8 seconds we provide a dialysis treatment
Market update Q3 2017
 Market update Q3 2017 1 Rikshem in brief Total property value SEK 40.3 bn Portfolio comprising c. 600 properties with c. 28,000 apartments. Lettable area c. 2.2 million sqm Annual rental income 2016 was
INVESTOR PRESENTATION MAY 2013
 INVESTOR PRESENTATION MAY 2013 Forward-Looking Statements This presentation includes forward-looking statements. These statements are subject to a number of risks, uncertainties and other factors that
Rental income, EUR million Like-for-like growth in rental income, percent
 Akelius Residential Property AB (publ) year-end report January to December summary Oct Dec Oct Dec Jan Dec Jan Dec Rental income, EUR million 129 124 482 469 Like-for-like growth in rental income, percent
Financial Modeling Workshop Using Excel
 Financial Modeling Workshop Using Excel Page 1 of 11 Why Attend Financial modeling is crucial for taking investment decisions that can have a huge financial impact on companies. By attending this course,
Summary report for The complete report is available at (Norwegian only)
") Summary report for 2014 The complete report is available at www.husbanken.no (Norwegian only) KEY FIGURES FOR THE HOUSING BANK S ACTIVITIES 2009 2010 2011 2012 2013 2014 Programmes Housing allowance Amount
Summary report for 2014 The complete report is available at www.husbanken.no (Norwegian only) KEY FIGURES FOR THE HOUSING BANK S ACTIVITIES 2009 2010 2011 2012 2013 2014 Programmes Housing allowance Amount
2016 FULL-YEAR RESULTS WEBCAST 21 FEBRUARY 2017
 FULL-YEAR RESULTS WEBCAST 21 FEBRUARY 2017 DISCLAIMER The information contained in this document has not been independently verified. No representation, warranty or undertaking, express or implied, is
Investor presentation. Filago AS Januar 2018
 Investor presentation Filago AS Januar 2018 Introduction Filago Group Established in 2012 Filago has projects that builds a new green society, through new technology and sustainable business driven by
Rental income, EUR million Like-for-like growth in rental income, percent
 Akelius Residential Property AB (publ) interim report January to June summary Apr Jun Apr Jun Jan Jun Jan Jun Jan Dec Rental income, EUR million 115 113 233 229 469 Like-for-like growth in rental income,
Year-end report Peter Wågström President and CEO Ann-Sofie Danielsson Chief Financial Officer NCC AB 1
 Year-end report 2012 Peter Wågström President and CEO Ann-Sofie Danielsson Chief Financial Officer 2013-01-30 NCC AB 1 Q4 in brief Strong close resulted in successful year All business areas on par with
Half-year report January-June 2016
 Half-year report January-June 2016 Summary, January-June 2016» Rental income amounted to SEK 1,070 million (SEK 989 million corresponding period preceding year).» Profit from property management amounted
Akiş REIT 2Q18 Performance Presentation August 2018
 Akiş REIT 2Q18 Performance Presentation August 2018 1 Breaking News New Investment Project The project is located in the uprising Aldgate region (London) which is 20-25 min away from central London The
Preparing Financial Statements and the Annual Report
 Preparing Financial Statements and the Annual Report Page 1 of 11 Why Attend Financial statements and the annual report are key communication channels between companies and their different stakeholders.
First Sponsor Group Limited Investor Presentation 24 July 2015
 First Sponsor Group Limited Investor Presentation 24 July 2015 The initial public offering of the Company s shares was sponsored by DBS Bank Ltd., who assumes no responsibility for the contents of this
GODREJ INDUSTRIES LIMITED Performance Update Q1 FY AUGUST 13, 2018
 GODREJ INDUSTRIES LIMITED Performance Update Q1 FY 2018-19 AUGUST 13, 2018 1 I Godrej Industries Limited I Q1 FY 2018-19 Performance Update Aug 13,2018 DISCLAIMER Some of the statements in this communication
JM Group. Sweden. Norway. Finland. Belgium 3 % 19 % 78 % 0 % 12-month period 2) SEK 301 per share
 SEK 301 per share") Interimreport 2017 JM Group Revenue: SEK 16.7 billion Total assets: SEK 13.5 billion No. of building rights: 34,600 No. of employees: 2,538 Market Cap: SEK 21.3 billion 2) 19 % Norway 78 % Sweden 3 % Finland
Interimreport 2017 JM Group Revenue: SEK 16.7 billion Total assets: SEK 13.5 billion No. of building rights: 34,600 No. of employees: 2,538 Market Cap: SEK 21.3 billion 2) 19 % Norway 78 % Sweden 3 % Finland
MTR Corporation Interim Results. 7 August 2007
 MTR Corporation 2007 Interim Results 7 August 2007 2007/8/7 Page 1 Results highlights and business overview Mr. CK Chow, CEO 2007/8/7 Page 2 First half 2007 achievements Merger Key legislative process
Rental income, SEK million 1,071 1,014 4,122 4,109 Growth in rental income comparable properties, percent
 Akelius Residential Property AB (publ) year-end report January to December summary Oct Dec Oct Dec Jan Dec Jan Dec Rental income, SEK million 1,071 1,014 4,122 4,109 Growth in rental income comparable
Analyst Presentation 12 February 2018
 Analyst Presentation 12 February 2018 Disclaimer This presentation is not an offer or an invitation to sell or exchange securities, or a recommendation to subscribe, buy or sell ANF Immobilier securities.
Rental income, SEK million 1,016 1,040 3,051 3,095 4,109 Growth in rental income comparable properties, percent
 Akelius Residential Property AB (publ) interim report January to September summary Jul Sep Jul Sep Jan Sep Jan Sep Jan Dec Rental income, SEK million 1,016 1,040 3,051 3,095 4,109 Growth in rental income
Housing New Zealand Investor Update
 Housing New Zealand Investor Update May 2018 Matthew Needham CFO Matthew.needham@hnzc.co.nz Sam Direen Treasury Manager Sam.direen@hnzc.co.nz Disclaimer This presentation has been prepared by Housing New
Co-operative Housing Federation of Norway. Kristiansand, a town in southern Norway. Photo: Kjell-Inge Søreide
 Co-operative Housing Federation of Norway Kristiansand, a town in southern Norway. Photo: Kjell-Inge Søreide The housing co-operative Auvitoppen in Lier. Photo: Liv Ulveseth, Usbl 2 The Co-operative Housing
Certified Internal Auditor Exam Preparation. Contents are subject to change. For the latest updates visit
 Certified Internal Auditor Exam Preparation Page 1 of 11 Why Attend This preparatory course is designed to equip candidates with the knowledge and skills required to write and pass the Certified Internal
City-Wide Real Estate Transformation
 City-Wide Real Estate Transformation Presentation on Portfolio & Asset Management Toronto Realty Agency Board Meeting October 20, 2017 Re: RA5.3 What is Portfolio Strategy & Asset Management Portfolio
2018 HALF-YEAR RESULTS
 2018 HALF-YEAR RESULTS WEBCAST 25 JULY 2018 Disclaimer The information contained in this document has not been independently verified. No representation, warranty or undertaking, express or implied, is
Zug Estates Group. Financial Year Tobias Achermann, CEO Gabriela Theus, CFO. March 11, 2016
 Zug Estates Group Financial Year 2015 Tobias Achermann, CEO Gabriela Theus, CFO March 11, 2016 2015 in a nutshell Gratifying result Operating income before depreciation and revaluation CHF 39.2 Mio. +4.0%
Business and Property Committee
 Business and Property Committee Item No Report title: Direct Property Development Company Date of meeting: 20 June 2017 Responsible Chief Executive Director of Finance and Officer: Commercial Services
First Quarter Fiscal Year Ending March 31, 2017 Consolidated Earnings Announcement (Japanese GAAP)
") First Quarter Fiscal Year Ending March 31, 2017 Consolidated Earnings Announcement (Japanese GAAP) Company Name: Hoosiers Holdings Stock Code: 3284 Representative: (Title) CEO and President Contact: (Title)
First Quarter Fiscal Year Ending March 31, 2017 Consolidated Earnings Announcement (Japanese GAAP) Company Name: Hoosiers Holdings Stock Code: 3284 Representative: (Title) CEO and President Contact: (Title)
2018 Q3: TENANTS FIRST Putting the needs of our tenants at the centre of everything we do. 26 October 2018
 2018 Q3: TENANTS FIRST Putting the needs of our tenants at the centre of everything we do 26 October 2018 CONTENT 1 HIGHLIGHTS AND KEY FIGURES 2 NEW NAME 3 MARKET OVERVIEW 4 GENERAL COMPANY OVERVIEW 7
Behind the Scenes: Washington REIT 2.0. Presentation to NAIOP Members
 Behind the Scenes: Washington REIT 2.0 Presentation to NAIOP Members February 23, 2016 They always say time changes things, but you actually have to change them yourself. - Andy Warhol The Oldest REIT
Rental income, EUR million Like-for-like growth in rental income, percent
 Akelius Residential Property AB (publ) interim report January to September summary Jul Sep Jul Sep Jan Sep Jan Sep Jan Dec Rental income, EUR million 120 116 353 345 469 Like-for-like growth in rental
Principle Barriers Holding Back Schemes. & Public Sector Solutions
 Principle Barriers Holding Back Schemes & Public Sector Solutions 24 Barriers to growth: 1 2 3 4 5 6 7 8 Not enough outlets Too slow Sales Rates (Mortgage availability) Not enough land: Public sector land
International Financial Reporting Standards (IFRS) and 2018 Updates
 and 2018 Updates") International Financial Reporting Standards (IFRS) and 2018 Updates Page 1 of 11 Why Attend Our 'International Financial Reporting Standards (IFRS) and 2018 Updates' course will help build the knowledge
International Financial Reporting Standards (IFRS) and 2018 Updates Page 1 of 11 Why Attend Our 'International Financial Reporting Standards (IFRS) and 2018 Updates' course will help build the knowledge
MANAGING HIGH VALUE ADDED PROCESSES GLOBALLY. MID TERM FINANCIAL REPORT JUNE 30 th 2017
 1 MANAGING HIGH VALUE ADDED PROCESSES GLOBALLY MID TERM FINANCIAL REPORT JUNE 30 th 2017 DISCLAIMER 2 This document has been prepared by CIE Automotive, S.A. ("CIE Automotive"), and is for information
SUNTEC REIT FINANCIAL RESULTS. For the 2 nd Quarter and Half Year ended 30 June 2017
 SUNTEC REIT FINANCIAL RESULTS For the 2 nd Quarter and Half Year ended 30 June 2017 26 July 2017 Agenda 03 2Q 17 Highlights 05 Financial Highlights 18 Office Portfolio Performance 25 Retail Portfolio Performance
Rental income, EUR million** Like-for-like growth in rental income, percent Net operating income, EUR million
 Akelius Residential Property AB (publ) interim report January to March summary* Jan Mar Jan Mar Jan Dec Rental income, EUR million** 119 116 469 Like-for-like growth in rental income, percent 3.7 5.4 5.1
Investor Presentation Second Quarter 2006
 Investor Presentation Second Quarter 2006 2006 Highlights (Six months to June 30, 2006) Revenues up 10.2% from accretive acquisitions Net Operating Income up 10.9% NOI margin increases Stabilized portfolio
National Real Estate Company. Earnings Presentation Q1 FY2014
 National Real Estate Company (Kuwait KSE: NRE) Earnings Presentation Q1 FY2014 May 28, 2014 1 Agenda 1. NREC Overview 3 2. Q1 FY2014 Summary 4 3. Financial Performance 5 4. Key Financial Ratios 7 5. Quarterly
Peab forms Brinova Fastigheter AB
 1 (5) Press release from Peab AB 13 February 2003 No. 3 Peab forms Brinova Fastigheter AB As previously announced, the board of Peab has decided to propose that the group s entire holding of managed properties
Vantage Development S.A. CC Group Small & MidCap Conference 5th Edition. 26 March 2015
 Vantage Development S.A. CC Group Small & MidCap Conference 5th Edition 26 March 2015 2014 The best year in the history of Vantage Development 2014 Financial results Record revenues of PLN 61.8 million
Investor Presentation December 2017
 Investor Presentation December 2017 Cautionary Statement This presentation includes statements concerning our expectations, beliefs, plans, objectives, goals, strategies, future events or performance and
Third Quarter Fiscal Year Ending March 31, 2016 Consolidated Earnings Announcement (Japanese GAAP)
") Third Quarter Fiscal Year Ending March 31, 2016 Consolidated Earnings Announcement (Japanese GAAP) Company Name: Hoosiers Holdings Stock Code: 3284 Representative: (Title) CEO and President Contact: (Title)
Third Quarter Fiscal Year Ending March 31, 2016 Consolidated Earnings Announcement (Japanese GAAP) Company Name: Hoosiers Holdings Stock Code: 3284 Representative: (Title) CEO and President Contact: (Title)
Board of Directors' Report on the Corporation's State of Affairs
 Board of Directors' Report on the Corporation's State of Affairs Brack Capital Properties NV (hereinafter: "the Company") hereby submits the Board of Directors' report for a period of six months ending
ATRIUM Q RESULTS ANALYST AND INVESTOR CALL. 18 May 2016
 ATRIUM Q1 2016 RESULTS ANALYST AND INVESTOR CALL 18 May 2016 KEY EVENTS IN 2016 YTD OPERATIONAL PERFORMANCE Core Markets¹: NRI increased 1.2% to 36.3m; LFL NRI remained stable at 31.4m Russia continues
Interim Report, H1 2016/17. Illustration: Amerika Have, residential property Copenhagen, Denmark
 Interim Report, H1 2016/17 Illustration: Amerika Have, residential property Copenhagen, Denmark Contents 1. The Group s results in H1 2016/17 Financial highlights and key ratios Segment results Handed-over
Interim statement from the Board of Directors for the first quarter of 2015
 Regulated information - under embargo until 05/05/2015, 8 a.m. Antwerp, 5 May 2015 Interim statement from the Board of Directors Acquisition of a modern logistics site of approximately 52.000 m² in a prime
REPORT 2018 COMMERCIAL REAL ESTATE OFFICE WAREHOUSE SHOWROOM DEVELOPMENT
 REPORT 2018 COMMERCIAL REAL ESTATE OFFICE WAREHOUSE SHOWROOM DEVELOPMENT CONTENT 3 CONTENT The Fabritius Group 7 Organisation/ Property management 9 Areas for development 10 Development projects 12 Our
PORTFOLIO COMMITTEE ON HOUSING 13 MAY 2008
 DEPARTMENT OF LOCAL GOVERNMENT & HOUSING PORTFOLIO COMMITTEE ON HOUSING 13 MAY 2008 Integrated Sustainable Human Settlement: Progress Report 7/8 and Annual Performance Plans for 2008/2009 Financial Year
MANAGING HIGH VALUE ADDED PROCESSES GLOBALLY. MID TERM FINANCIAL REPORT SEPTEMBER 30 th 2017
 1 MANAGING HIGH VALUE ADDED PROCESSES GLOBALLY MID TERM FINANCIAL REPORT SEPTEMBER 30 th 2017 DISCLAIMER 2 This document has been prepared by CIE Automotive, S.A. ("CIE Automotive"), and is for information
Sunway Berhad TP: RM3.27 (+10.6%) Acquires Industrial Land Parcels in Selangor
 Acquires Industrial Land Parcels in Selangor") A Member of the TA Group MENARA TA ONE, 22 JALAN P. RAMLEE, 50250 KUALA LUMPUR, MALAYSIA TEL: +603-20721277 / FAX: +603-20325048 C O M P A N Y U P D A T E Monday, 22 February 2016 FBMKLCI: 1,674.88 Sector:
A Member of the TA Group MENARA TA ONE, 22 JALAN P. RAMLEE, 50250 KUALA LUMPUR, MALAYSIA TEL: +603-20721277 / FAX: +603-20325048 C O M P A N Y U P D A T E Monday, 22 February 2016 FBMKLCI: 1,674.88 Sector:
THE ART OF BUSINESS VALUATION
 BUSINESS VALUATIONS GROWING THE ART OF BUSINESS VALUATION Douglas A. Michel, CPA/ABV, CVA & Alex E. Kummer, CPA, CVA, Clark Schaefer Hackett THE VALUE OF YOUR BUSINESS Steve Lumley, LGI CFO BUY SELL AGREEMENTS
Project Direction Presentation June SBM Offshore All rights reserved.
 Project Direction Presentation June 2013 Disclaimer Some of the statements contained in this presentation that are not historical facts are statements of future expectations and other forward-looking statements
WYNYARD CENTRAL HOUSING POLICY
 WYNYARD CENTRAL HOUSING POLICY 1 Policy objectives 1.1 To clarify the approach that Waterfront Auckland (WA) will take to delivering a thriving residential community. 2 Scope 2.1 Covers the approach to
Revenue Recognition- Real Estate Companies
 Revenue Recognition- Real Estate Companies CTC 25 NOVEMBER ZFB & ASSOCIATES, Chartered Accountants 1 Accounting for Real Estate Transactions Introduction Scope Revenue Recognition Criteria Project Project
Transit-Oriented Development Specialized Real Estate Services
 COLLIERS INTERNATIONAL Transit-Oriented Development Specialized Real Estate Services Accelerating success. Colliers International transit-oriented development GROUP P. 1 2 transit-oriented development
IAG Conference Accounting Update Emerging issues in the public sector 20 November 2014 Michael Crowe Yannick Maurice
 www.pwc.com.au IAG Conference Accounting Update Emerging issues in the public sector 20 November 2014 Michael Crowe Yannick Maurice Agenda Introduction Key topics o Fair value o PPP Projects Refinancing
Certified Corporate Financial Planning & Analysis Professional (Cert FP&A): Preparation Course Part 1
: Preparation Course Part 1") Certified Corporate Financial Planning & Analysis Professional (Cert FP&A): Preparation Course Part 1 Page 1 of 12 Why Attend In today's world, there is more importance given to financial planning and
Certified Corporate Financial Planning & Analysis Professional (Cert FP&A): Preparation Course Part 1 Page 1 of 12 Why Attend In today's world, there is more importance given to financial planning and
AS MERKO EHITUS Annual General Meeting of Shareholders. Nordic Hotel Forum, Tallinn 9 May 2018
 AS MERKO EHITUS Annual General Meeting of Shareholders Nordic Hotel Forum, Tallinn 9 May 2018 1. Approval of the annual report of the year 2017 and overview of the economic results and outlook 2. Decision
Pressance Corporation Co., Ltd.
 3254 Tokyo Stock Exchange First Section Analyst Hideo Kakuta Index Summary----------------------------------------------------------------------------------------------------------------------------------------------------------------------------
METROPOLITAN TRACT PERFORMANCE REPORT For the Quarter Ended June 30, 2007
 F-6 METROPOLITAN TRACT PERFORMANCE REPORT For the Quarter Ended June 30, 2007 Finance, Audit & Facilities Committee September 20, 2007 CONSOLIDATED METROPOLITAN TRACT PROPERTIES Quarterly Summary Quarterly
ICADE REVENUE UP +8.4% IN Q1 2018
 PRESS RELEASE Issy-les-Moulineaux, April 27, 208 ICADE REVENUE UP +8.4% IN Q 208 Commercial Property Investment: o Rental income up by as much as +5,8% to 99.0 million o Financial occupancy rate at 92.4%
Investor Property Tour Summer 2015
 Investor Property Tour Summer 2015 Agenda for today Presentation Grainger overview & strategy Private Rented Sector (PRS) Abbeville overview Q&A Tour of the building Your hosts: Nick Jopling Executive
News Release. PS Business Parks, Inc. 701 Western Avenue P.O. Box Glendale, CA
 News Release PS Business Parks, Inc. 701 Western Avenue P.O. Box 25050 Glendale, CA 91221-5050 www.psbusinessparks.com For Release: Immediately Date: May 3, 2001 Contact: Mr. Jack Corrigan (818) 244-8080,