Table of Contents March 31, 2016
|
|
|
- Camron Watkins
- 6 years ago
- Views:
Transcription
1
2 i
3 ii
4 Table of Contents March 3, 206 Page EARNINGS PRESS RELEASE Page SUPPLEMENTAL INFORMATION (continued) First Quarter Ended March 3, 206, Financial and Operating Results... Incremental NOI by Year of Delivery from Development and Redevelopment Projects... 3 Top 20 Tenants Disciplined Allocation of Capital and Management of Value-Creation Pipeline... 4 Summary of Properties and Occupancy Dispositions... 5 Property Listing Guidance... 6 Earnings Call Information and About the Company... 7 Key Real Estate Metrics Consolidated Statements of Income... 8 Disciplined Allocation of Capital and Management of Development Pipeline Consolidated Balance Sheets... 9 Sustainability Funds From Operations and Adjusted Funds From Operations... 0 Investments in Real Estate Operating Information (continued) Investments in Real Estate Visible Growth Pipeline: SUPPLEMENTAL INFORMATION Company Profile... 3 Highly Leased Projects to Be Placed into Service by 4Q Investor Information... 4 Projects to Be Placed into Service by 207 and NAV, FFO, and Common Stock Dividends Per Share... 5 Key Future Projects... 4 High-Quality, Diversified, and Innovative Tenants... 6 Projected and Historical Construction Spending Class A Assets in AAA Locations... 7 Pro Rata Operating and Balance Sheet Information Occupancy... 8 Consolidated Joint Ventures Financial and Asset Base Highlights... 9 Unconsolidated Joint Ventures Real Estate Investments in Asia... 5 Operating Information Key Operating Metrics... 2 Non-Real Estate Investments Same Property Performance Key Credit Metrics Leasing Activity Summary of Debt Contractual Lease Expirations Definitions and Reconciliations This document includes forward-looking statements within the meaning of Section 27A of the Securities Act of 933, as amended, and Section 2E of the Securities Exchange Act of 934, as amended. Please see page 7 of the earnings press release for further information. This document is not an offer to sell or a solicitation to buy securities of Alexandria Real Estate Equities, Inc. Any offers to sell or solicitations to buy our securities shall be made only by means of a prospectus approved for that purpose. Unless otherwise indicated, the Company, Alexandria, ARE, we, us, and our refer to Alexandria Real Estate Equities, Inc. and its consolidated subsidiaries. Alexandria Real Estate Equities, Inc. All Rights Reserved. 206 iii
5 Alexandria Real Estate Equities, Inc. Reports First Quarter Ended March 3, 206 Financial and Operating Results FFO per Share Diluted, as Adjusted, of.34 for Q6, up 4.7% over Q5 Total Revenues of 26. million for Q6, up 9.8% over Q5 NOI of 45.3 million for Q6, up 6.5% over Q5 Solid Life Science Industry Fundamentals Strong Rental Rate Growth on Continued Solid Demand Disciplined Allocation of Capital Continued Asset Recycling Leverage Goals On Track PASADENA, Calif. May 2, 206 Alexandria Real Estate Equities, Inc. (NYSE:ARE) today announced financial and operating results for the first quarter ended March 3, 206. Joel S. Marcus, chairman, chief executive officer, and founder of Alexandria Real Estate Equities, Inc. ( Alexandria ), stated, We are pleased to start 206 with a very successful first quarter executed by our best-in-class team. Key Q6 Highlights: Funds from operations ( FFO ) per share diluted, as adjusted, of.34, up 4.7%, for Q6, compared to.28 for Q5; In Q6, Verily, Alphabet Inc. s life science subsidiary, subleased 407,369 rentable square feet ( RSF ) from Amgen Inc. at 249/259/269 East Grand Avenue in our South San Francisco submarket. The sublease highlights the continued demand from high-quality science and technology companies in our key urban innovation clusters; Executed leases for 388,872 RSF during Q6, despite minimal contractual lease expirations in 206 and our highly pre-leased value-creation pipeline; Rental rate increases of 33.6% and 6.9% (cash basis) for Q6 lease renewals and releasing of space aggregating 28,342 RSF (included in the 388,872 RSF above); Same property NOI growth of 5.3% and 6.2% (cash basis) for Q6, compared to Q5; Disciplined allocation of capital to value-creation pipeline of highly leased Class A buildings in urban innovation clusters: Year of Delivery RSF,465,977 2,036,828 3,502,805 Leased % 90% 72% 8% Incremental Annual NOI 75 million to 80 million 20 million to 30 million 95 million to 20 million Recycling estimated proceeds of 04.4 million from disposition of all our investments in Asia in several separate transactions over the next 2 months. Proceeds will be allocated to development of Class A facilities in high value urban innovation clusters In March 206, we recognized an impairment charge of 29.0 million for two land parcels in India that met the criteria for classification as held for sale in March 206. As of March 3, 206, we only had one binding sale agreement related to one land parcel. This land parcel was sold on May 2, 206, at a sales price of 7.5 million with no gain or loss. On April 22, 206, our Board of Directors approved the monetization of our remaining real estate investments in Asia. As a result of this decision, we recognized an aggregate impairment charge of 53.0 million to reduce our net book value to fair value less cost to sell for all of our remaining investments in Asia; 2.0 billion of liquidity, including availability on our million secured construction loan for 00 Binney Street closed in April 206; 7.4x net debt to adjusted EBITDA Q6 annualized, goal of achieving less than 6.0x; 7.2x net debt to adjusted EBITDA Q6 trailing 2 months; Common stock dividend for Q6 of 0.80 per common share, up 3 cents, or 4%, over 4Q5; continuation of our strategy to share growth in cash flows from operating activities with our stockholders while also importantly retaining capital for reinvestment. Results Q6 FFO attributable to Alexandria s common stockholders diluted, as adjusted: In Millions Per Share Net (loss) income attributable to Alexandria s common stockholders diluted: In Millions Per Share Q5 Change (3.8) (0.05) (2.6) (0.30) 6.3 % 4.7 % N/A N/A Transactions impacting net (loss) income and EPS attributable to Alexandria s common stockholders: Amount Per share - diluted Q6 Q5 Q6 Q5 (in millions, except per share amounts) Impairment of real estate - rental properties Impairment of real estate - land parcels Preferred stock redemption charge Net income attributable to NCI Total Weighted average shares of common stock outstanding Alexandria Real Estate Equities, Inc. All Rights Reserved. 206
6 First Quarter Ended March 3, 206, Financial and Operating Results March 3, 206 Core operating metrics (In millions) Total revenues NOI, including our pro rata share of consolidated and unconsolidated real estate joint ventures Q6 26. Q Change % % All tenants: 52% of annualized base rent ( ABR ) from investment-grade tenants as of Q6 Top 20 tenants as of Q6: 8% of ABR from investment-grade tenants 8.2 years weighted average remaining lease term In Q6, Verily, Alphabet Inc. s life science subsidiary, subleased 407,369 RSF at 249/259/269 East Grand Avenue in our South San Francisco submarket from Amgen Inc. The sublease highlights the continued demand from high-quality science and technology companies in our key urban innovation clusters Executed leases for 388,872 RSF during Q6, despite minimal contractual lease expirations in 206 and our highly pre-leased value-creation pipeline: 33.6% and 6.9% (cash basis) rental rate increases on lease renewals and re-leasing of space aggregating 28,342 RSF (included in the 388,872 RSF above) Same property NOI growth of 5.3% and 6.2% (cash basis) for Q6, compared to Q5 Occupancy for operating properties in North America of 97.3% as of Q6 Operating margin at 70% for Q6 Adjusted EBITDA margin at 65% for Q6 External growth: visible, multiyear, highly leased value-creation pipeline Disciplined allocation of capital to value-creation pipeline of highly leased Class A buildings in urban innovation clusters: Year of Delivery RSF,465,977 2,036,828 3,502,805 Leased % 90% 72% 8% Incremental Annual NOI 75 million to 80 million 20 million to 30 million 95 million to 20 million Q6 commencement of development project: 50,000 RSF development project at 505 Brannan Street in our Mission Bay/SoMa submarket; 00% leased to Pinterest, Inc. Balance sheet 2.0 billion of liquidity, including availability on our million secured construction loan for 00 Binney Street closed in April x net debt to Adjusted EBITDA Q6 annualized, with goal of achieving less than 6.0x 7.2x net debt to Adjusted EBITDA Q6 trailing 2 months 3.3x fixed-charge coverage ratio Q6 annualized 3.4x fixed-charge coverage ratio Q6 trailing 2 months Proceeds from sales of investments in life science entities aggregated 0.9 million in Q6 Repurchased 93,934 outstanding shares of our Series D cumulative convertible preferred stock at an aggregate price of 25.6 million, or per share, and recognized a preferred stock redemption charge of 3.0 million in Q6 Sold an aggregate of 293,235 shares of common stock under our ATM program for gross proceeds of 25.9 million, or per share, and net proceeds of approximately 25.3 million in Q6. billion total market capitalization as of Q6 6% of gross investments in real estate North America in value-creation pipeline as of Q6, with a target range from 0% to 5% as of 4Q6 Limited debt maturities through 208 and well-laddered maturity profile 5% unhedged variable-rate debt as a percentage of total debt as of Q6 Executed additional interest rate swap agreements during Q6, with an aggregate notional amount of 500 million, to increase notional hedged variable-rate debt to a minimum of 900 million and 250 million during 207 and 208, respectively LEED certifications 57% of our total ABR expected to be generated from LEED projects upon completion of our inprocess projects Subsequent events In April 206, we closed a secured construction loan with commitments available for borrowing of million for our development project at 00 Binney Street in our Cambridge submarket, which bears interest at a rate of LIBOR+200 bps On May 2, 206, we repaid a 26.0 million secured note payable with an effective interest rate of 6.64% In April 206, we completed the purchase of the remaining outstanding noncontrolling interest in our.2 million RSF campus at Alexandria Technology Square in our Cambridge submarket for 54 million In April 206, we completed the sale of 6020 Industrial Drive in our Gaithersburg submarket of Maryland for a sales price of 6.4 million Recycling estimated proceeds of 04.4 million from disposition of all our investments in Asia in several separate transactions over the next 2 months. Proceeds will be allocated to development of Class A facilities in high value urban innovation clusters In March 206, we recognized an impairment charge of 29.0 million for two land parcels in India that met the criteria for classification as held for sale in March 206. As of March 3, 206, we only had one binding sale agreement related to one land parcel. This land parcel was sold on May 2, 206, at a sales price of 7.5 million with no gain or loss. On April 22, 206, our Board of Directors approved the monetization of our remaining real estate investments in Asia. As a result of this decision, we recognized an aggregate impairment charge of 53.0 million to reduce our net book value to fair value less cost to sell for all of our remaining investments in Asia Alexandria Real Estate Equities, Inc. All Rights Reserved

7 Incremental Annual NOI by Year of Delivery from Development and Redevelopment Projects March 3, 206 () Represents incremental annual NOI upon stabilization of our development and redevelopment projects, including our share of real estate joint venture development projects. Excludes NOI related to spaces delivered and in service prior to March 3, 206. Alexandria Real Estate Equities, Inc. All Rights Reserved
8 Disciplined Allocation of Capital and Management of Value-Creation Pipeline March 3, 206 () 206 Disciplined Allocation of Capital () 6% of Gross Investments in Real Estate in North America Value-Creation Pipeline Pre-Leased Percentage of Ground-Up Developments Since January, 2009 Ground-Up Developments Commenced & Delivered Since January, 2009 Single-Tenant Multi-Tenant 00% 38% Pre-Leased Pre-Leased 2.6M RSF 2.5M RSF Average Initial Stabilized Yield Average Initial Stabilized Yield (Cash Basis) 7.9% 7.6% Includes projected construction and acquisitions for the year ending December 3, 206. Refer to page 44 of our Supplemental Information for additional details. Represents average pre-leased percentage at the time development commenced. Alexandria Real Estate Equities, Inc. All Rights Reserved
9 Dispositions March 3, 206 (Dollars in thousands) Property/Market/Submarket Cash NOI () NOI () RSF/Acres Actual/Estimated Sales Price Assets held for sale in North America: 6020 Industrial Drive/Maryland/Gaithersburg 7,000 RSF, Belmont Street and 350 Plantation Street/Greater Boston/Route 495/Worcester 90,690 RSF,557,347 6,400 7,550 Assets held for sale in North America 23,950 Asia assets pending disposition: (4) Operating properties Land parcels,200,683 RSF 96 acres (5) (5) (5) (5) 3,000 () (4) (5) 36,950 Cash NOI excludes straight-line rent and amortization of acquired below-market leases. NOI amounts represent the annualized amounts for Q6. Property consists of an R&D/Warehouse building acquired in 2005 with minimal capital improvements since acquisition. Buyer intends to make considerable investments in the building including demolition of some of the existing space and repurposing of its use. Non-core properties located outside of our urban innovation clusters. These properties are Class B office buildings leased to non-credit tenants and represent our last investment in Worcester. The internal rate of return over our hold period, including the expected disposition of the asset, is expected to be approximately 8.9%. In March 206, we recognized an impairment charge of 29.0 million for two land parcels in India that met the criteria for classification as held for sale in March 206. As of March 3, 206, we only had one binding sale agreement related to one land parcel. This land parcel was sold on May 2, 206, at a sales price of 7.5 million with no gain or loss. On April 22, 206, our Board of Directors approved the monetization of our real estate investments in Asia in order to invest capital into our highly leased value-creation pipeline. As a result of this decision, we recognized an aggregate impairment charge of 53.0 million to reduce our net book value to fair value less cost to sell for all of our remaining investments in Asia. In determining the carrying amount for evaluating the real estate for impairment, we considered the cumulative foreign currency translation losses of approximately 32.0 million for our land parcels located in India, and 8.8 million for our rental properties in our India and China submarkets, that will be reclassified to net income only when realized upon sale or disposition. We believe our real estate investments in Asia will be monetized in several separate transactions over the next 2 months. See page 5 of our Supplemental Information for operating and balance sheet information related to our real estate investments in Asia. Alexandria Real Estate Equities, Inc. All Rights Reserved
10 Guidance March 3, 206 (Dollars in thousands, except per share amounts) The following updated guidance is based on our current view of existing market conditions and other assumptions for the year ending December 3, 206. There can be no assurance that actual amounts will be materially higher or lower than these expectations. See our discussion of forward-looking statements on page 7. Summary of Key Changes in Guidance Preferred stock redemption charge Impairment charge related to real estate in Asia: Land parcels located in India Rental properties Period Recognized Q6 April 206 3,046 28,980 EPS and FFO per Share Attributable to Alexandria s Common Stockholders Diluted Earnings per share Add: depreciation and amortization Add: impairment of real estate rental properties Other FFO per share Add: preferred stock redemption charge Add: impairment of real estate land parcels Other FFO per share, as adjusted (.04) to (0.94) (0.02) 4.5 to (0.02) 5.46 to Guidance Low High Key Assumptions Occupancy percentage for operating properties in North America as of December 3, 206 Lease renewals and re-leasing of space: Rental rate increases Rental rate increases (cash basis) Same property performance: NOI increase NOI increase (cash basis) Straight-line rent revenue General and administrative expenses Capitalization of interest Interest expense () 96.5% 97.% 4.0% 6.0% 7.0% 9.0% 2.0% 3.5% 4.0% 5.5% 5,000 59,000 45,000 08,000 56,000 64,000 55,000 8,000 64,789 88,79 Total 3,046 93,769 88,79 Per Share 0.04 () () FFO Per Share - Diluted Included FFO Per Share - Diluted, As Adjusted Excluded Included Excluded Excluded Excluded Guidance 6.5x to 6.9x 3.0x to 3.5x Key Credit Metrics Net debt to Adjusted EBITDA 4Q annualized Fixed charge coverage ratio 4Q annualized Value-creation pipeline as a percentage of gross investments in real estate as of December 3, 206 Key Sources and Uses of Capital Sources of capital for construction: 0% to 5% Low 206 Guidance High Mid-Point Net cash provided by operating activities after dividends Debt funding from growth in EBITDA Internally generated sources Asset sales (minimum target) Other capital/sales of available-for-sale equity securities Total sources/projected construction uses 5, , , ,000 25, ,000 35, , , ,000 25, ,000 25, , , ,000 25, ,000 Sources of capital for acquisitions: Debt funding from growth in EBITDA Other capital Total sources/projected acquisitions uses 45,000 05,000 50,000 45, , ,000 45,000 55, ,000 Incremental debt (included above): Issuance of unsecured senior notes payable Borrowings under secured construction loans Repayments of secured notes payable Unsecured senior line of credit/other Incremental debt 400, , ,000 75, , ,000 (90,000) (290,000) (240,000) (80,000) (200,000) (40,000) 305, , ,000 See footnote 4 on page 5. Also, pursuant to standards established by NAREIT, impairments related to land parcels are included, and impairments related to depreciable properties are excluded, from NAREIT defined FFO. In 206, we expect to amend and extend the maturity date of our.5 billion unsecured senior line of credit. Our guidance for the year ending December 3, 206, excludes the potential loss on early extinguishment of debt related to the write-off of any unamortized loan fees as a result of the amendment. Includes acquisition price of 88 Bluxome Street in our Mission Bay/SoMa submarket of San Francisco that we expect to complete in 2H6. Also includes the purchase of the remaining noncontrolling interest outstanding at Alexandria Technology Square for 54 million completed in April 206. Alexandria Real Estate Equities, Inc. All Rights Reserved
11 Earnings Call Information and About the Company March 3, 206 We will host a conference call on Tuesday, May 3, 206, at 3:00 p.m. Eastern Time ( ET )/noon Pacific Time ( PT ), that is open to the general public to discuss our financial and operating results for the first quarter ended March 3, 206. To participate in this conference call, dial (866) or (480) and confirmation code shortly before 3:00 p.m. ET/noon PT. The audio webcast can be accessed at in the For Investors section. A replay of the call will be available for a limited time from 6:00 p.m. ET/3:00 p.m. PT on Tuesday, May 3, 206. The replay number is (888) or (79) , and the confirmation code is Additionally, a copy of this Earnings Press Release and Supplemental Information for the first quarter ended March 3, 206, is available in the For Investors section of our website at or by following this link: For any questions, please contact Joel S. Marcus, chairman, chief executive officer, and founder, at (626) or Dean A. Shigenaga, executive vice president and chief financial officer, at (626) About the Company Alexandria Real Estate Equities, Inc. (NYSE:ARE) is a fully integrated, self-administered, and self-managed urban office real estate investment trust ( REIT ) uniquely focused on worldclass collaborative science and technology campuses in AAA innovation cluster locations, with a total market capitalization of. billion and an asset base in North America of 24.5 million square feet as of March 3, 206. The asset base in North America includes 8.9 million RSF of operating properties and development and redevelopment projects (under construction or pre-construction) and 5.6 million square feet of future ground-up development projects. Alexandria pioneered this niche in 994 and has since established a dominant market presence in key locations, including Greater Boston, San Francisco, New York City, San Diego, Seattle, Maryland, and Research Triangle Park. *********** This document includes forward-looking statements within the meaning of Section 27A of the Securities Act of 933, as amended, and Section 2E of the Securities Exchange Act of 934, as amended. Such forward-looking statements include, without limitation, statements regarding our 206 earnings per share attributable to Alexandria s common stockholders diluted, 206 FFO per share attributable to Alexandria s common stockholders diluted, NOI, and our projected sources and uses of capital. You can identify the forward-looking statements by their use of forwardlooking words, such as forecast, guidance, projects, estimates, anticipates, believes, expects, intends, may, plans, seeks, should, or will, or the negative of those words or similar words. These forward-looking statements are based on our current expectations, beliefs, projections, future plans and strategies, anticipated events or trends, and similar expressions concerning matters that are not historical facts, as well as a number of assumptions concerning future events. There can be no assurance that actual results will not be materially higher or lower than these expectations. These statements are subject to risks, uncertainties, assumptions, and other important factors that could cause actual results to differ materially from the results discussed in the forwardlooking statements. Factors that might cause such a difference include, without limitation, our failure to obtain capital (debt, construction financing, and/or equity) or refinance debt maturities, increased interest rates and operating costs, adverse economic or real estate developments in our markets, our failure to successfully place into service and lease any properties undergoing development or redevelopment and our existing space held for future development or redevelopment (including new properties acquired for that purpose), our failure to successfully operate or lease acquired properties, decreased rental rates, increased vacancy rates or failure to renew or replace expiring leases, defaults on or non-renewal of leases by tenants, general and local economic conditions, a favorable capital market environment, leasing activity, lease renewals, and other risks and uncertainties detailed in our filings with the Securities and Exchange Commission ( SEC ). Accordingly, you are cautioned not to place undue reliance on such forward-looking statements. All forward-looking statements are made as of the date of this earnings press release, and unless otherwise stated, we assume no obligation to update this information and expressly disclaim any obligation to update or revise any forward-looking statements, whether as a result of new information, future events, or otherwise. For more discussion relating to risks and uncertainties that could cause actual results to differ materially from those anticipated in our forward-looking statements, and risks to our business in general, please refer to our SEC filings, including our most recent annual report on Form 0-K and any subsequent quarterly reports on Form 0-Q. Alexandria Real Estate Equities, Inc. All Rights Reserved
12 Consolidated Statements of Income March 3, 206 (In thousands, except per share amounts) Three Months Ended 3/3/6 Revenues: Rental Tenant recoveries Other income Total revenues Expenses: Rental operations General and administrative Interest Depreciation and amortization Impairment of real estate Loss on early extinguishment of debt Total expenses 65,837 5,88 24,855 70,866 28, ,726 Equity in (losses) earnings of unconsolidated real estate joint ventures Gain on sales of real estate rental properties Income from continuing operations Loss from discontinued operations Net income Net income attributable to noncontrolling interests Net income attributable to Alexandria Real Estate Equities, Inc. Dividends on preferred stock Preferred stock redemption charge Net income attributable to unvested restricted stock awards Net (loss) income attributable to Alexandria Real Estate Equities, Inc. s common stockholders Earnings per share attributable to Alexandria Real Estate Equities, Inc. s common stockholders basic and diluted: Continuing operations Discontinued operations Earnings per share basic and diluted () (4) () 58,00 54,956 0, ,955 9/30/5 68,93 5,02 28,230 72,245 8,740 93,230 55,3 56,9 7,80 28,60 6/30/5 5,805 49,594 2, ,56 3/3/5 43,608 48,394 4,75 96,753 68,846 5,43 27,679 67,953 79,62 62,250 4,989 26,668 62, ,267 6,223 4,387 23,236 58,920 4,50 72,276 (397) 9,966 (74) 2,426 42, , , ,05 9,966 (4,030) 5,936 (5,907) (3,046) (80) 42,977 (972) 42,005 (6,246) (628) 39,699 (70) 39,529 (6,247) (623) 38,430 (263) 38,67 (6,246) (630) (43) 25,008 (492) 24,56 (6,247) (483) (4) (3,88) 35,3 32,659 3,29 7,786 (0.05) (0.05) Weighted-average shares of common stock outstanding for calculating earnings per share attributable to Alexandria s common stockholders basic and diluted Dividends declared per share of common stock 58,276 52,597 5,26 26,089 2/3/5 72, , , , , Decrease in total revenues from 4Q5 is primarily related to a 2.4 million reduction in tenant recoveries due to lower operating expenses and a 3.6 million decrease in investment gains. Decrease in interest expense from 4Q5 is primarily related to a reduction of interest expense on our unsecured senior line of credit related to the 453. million in sales of partial interest in three Class A assets in December 205, and an increase in capitalized interest driven by the increase in development activities related to our 3.5 million RSF highly leased value creation pipeline. See footnote 4 on page 5. Increase in net income attributable to noncontrolling interests is due to the sales described in footnote 2 above. Alexandria Real Estate Equities, Inc. All Rights Reserved
13 Consolidated Balance Sheets March 3, 206 (In thousands) 3/3/6 2/3/5 9/30/5 6/30/5 3/3/5 Assets Investments in real estate Investments in unconsolidated real estate joint ventures Cash and cash equivalents Restricted cash Tenant receivables Deferred rent Deferred leasing costs () Investments Other assets () Total assets Liabilities, Noncontrolling Interests, and Equity Secured notes payable () Unsecured senior notes payable () Unsecured senior line of credit Unsecured senior bank term loans () Accounts payable, accrued expenses, and tenant security deposits Dividends payable Total liabilities 7,74,466 27,65 46,97 4,885 9, ,44 92,48 36,63 30,5 8,97,532 86,578 2,03, , , ,467 64,275 4,784,24 7,629,922 27,22 25,098 28,872 0, ,570 92,08 353,465 33,32 8,88,07 809,88 2,030,63 5, , ,356 62,005 4,587,053 7,527,738 26,47 76,383 36,993 0,24 267,954 84, ,570 5,669 8,72, ,874,734, , , ,594 6,340 4,937,522 7,32,820 2,055 68,67 44,9 9, ,427 69, ,64 45,073 8,497, ,844,734,30 624, ,463 53,62 6,94 4,658,423 7,268,03 20,028 90,64 56,704 0, ,459 59, ,062 47,979 8,379, ,483,733,765 42, , ,69 58,824 4,582,686 Commitments and contingencies Redeemable noncontrolling interests Alexandria Real Estate Equities, Inc. s stockholders equity: Series D cumulative convertible preferred stock Series E cumulative redeemable preferred stock Common stock Additional paid-in capital Accumulated other comprehensive (loss) income Alexandria s stockholders equity Noncontrolling interests Total equity Total liabilities, noncontrolling interests, and equity () 4,28 23,864 30, ,529,660 (8,533) 3,865, ,353 4,73,073 8,97,532 4,28 4,28 4,248 4, ,63 30, ,558,008 49,9 3,975, ,659 4,279,746 8,88,07 237,63 30, ,356,043 35,238 3,759,62,798 3,760,960 8,72, ,63 30, ,37,06 83,980 3,822,876,995 3,824,87 8,497, ,63 30, ,383,456 29,23 3,780,548 2,022 3,782,570 8,379,538 On January, 206, we adopted an accounting standard update that requires debt issuance costs, excluding debt issuance costs associated with a line of credit, to be presented on the balance sheet as a direct deduction from the carrying amount of the related debt liability. Debt issuance costs associated with a line of credit will continue to be presented as an asset. As a result of adopting the accounting standard update, the unamortized deferred financing costs previously classified in deferred leasing and financing costs, aggregating 28.5 million as of March 3, 206, were classified with the corresponding debt instrument appearing on the consolidated balance sheets and deferred financing costs related to our unsecured senior line of credit, aggregating 0.9 million as of March 3, 206, were classified in other assets. This accounting standard update was also applied retroactively to all periods presented, as required by the accounting standard update. Alexandria Real Estate Equities, Inc. All Rights Reserved
14 Funds From Operations and Adjusted Funds From Operations March 3, 206 (In thousands) The following table presents a reconciliation of net (loss) income attributable to Alexandria s common stockholders basic, the most directly comparable financial measure presented in accordance with generally accepted accounting principles ( GAAP ), to FFO attributable to Alexandria s common stockholders basic and diluted, FFO attributable to Alexandria s common stockholders diluted, as adjusted, and adjusted funds from operations ( AFFO ) attributable to Alexandria s common stockholders diluted. Three Months Ended 3/3/6 Net (loss) income attributable to Alexandria s common stockholders Depreciation and amortization 2/3/5 (3,88) 69,308 9/30/5 35,3 6/30/5 32,659 3/3/5 3,29 7,786 72,528 68,398 62,523 59,202 Impairment of real estate rental properties 8,740 4,50 Gain on sales of real estate rental properties (2,426) Allocation to unvested restricted stock awards (80) FFO attributable to Alexandria s common stockholders basic and diluted () (522) 65,40 Investment income Impairment of real estate land parcels Loss on early extinguishment of debt Preferred stock redemption charge Allocation to unvested restricted stock awards (7,73) (38) 00,359 (5,378) (66) 93,433 9,332 28, ,046 (358) FFO attributable to Alexandria s common stockholders diluted, as adjusted (698) 03, ,078 95,805 95,048 93,620 9,332 (2,38) (2,025) (2,404) (2,743) (2,278) Non-revenue-enhancing capital expenditures: Building improvements Tenant improvements and leasing commissions Straight-line rent revenue Straight-line rent expense on ground leases Amortization of acquired below-market leases Amortization of loan fees Allocation to unvested restricted stock awards (5,499) (6,429) (5,775) (2,006) (4,59) (0,697) (,245) (974) (997) (3,82) (,006) 2,657 2,92 2,689 (86) Stock compensation expense () (4,436) (3,57) 2,792 Amortization of debt premiums AFFO attributable to Alexandria s common stockholders diluted (2,475) (2,492) (90) 50 (00) 363 (933) 2,835 (00) (82) 5,439 4,590 5,78 4,054 3, ,662 83,022 78,654 76,820 78,573 Calculated in accordance with standards established by the Advisory Board of Governors of the National Association of Real Estate Investment Trusts (the NAREIT Board of Governors ) in its April 2002 White Paper and related implementation guidance. Includes gross investment gains, primarily from the sale of two public securities in each of 4Q5 and 3Q5, of 2.7 million and 8.7 million, respectively. Alexandria Real Estate Equities, Inc. All Rights Reserved
15 Funds From Operations Per Share and Adjusted Funds From Operations Per Share March 3, 206 (In thousands, except per share amounts) The following table presents a reconciliation of earnings per share attributable to Alexandria s common stockholders basic, the most directly comparable financial measure presented in accordance with GAAP, to FFO per share attributable to Alexandria s common stockholders diluted, FFO per share attributable to Alexandria s common stockholders diluted, as adjusted, and AFFO per share attributable to Alexandria s common stockholders diluted. Amounts allocable to unvested restricted stock awards are not material and are not presented separately within the table below. Per share amounts may not add due to rounding. Three Months Ended 3/3/6 EPS attributable to Alexandria s common stockholders basic and diluted Depreciation and amortization 2/3/5 (0.05) /30/ /30/ /3/ Impairment of real estate rental properties Gain on sales of real estate rental properties (0.7) (0.) (0.08) FFO per share attributable to Alexandria s common stockholders basic and diluted () 0.90 Investment income Impairment of real estate land parcels 0.40 Preferred stock redemption charge Building improvements (0.03) (0.03) (0.03) (0.04) (0.03) Tenant improvements and leasing commissions (0.04) (0.06) (0.08) (0.09) (0.08) (0.7) (0.9) (0.7) (0.20) (0.5) FFO per share attributable to Alexandria s common stockholders diluted, as adjusted Non-revenue-enhancing capital expenditures: Straight-line rent revenue Straight-line rent expense on ground leases (0.02) (0.0) (0.0) (0.04) (0.0) (0.0) Amortization of loan fees Stock compensation expense Amortization of acquired below-market leases AFFO per share attributable to Alexandria s common stockholders diluted Weighted-average shares of common stock outstanding for calculating FFO, FFO, as adjusted, and AFFO per share attributable to Alexandria s common stockholders basic and diluted ().2 72, , , ,42.0 7,366 Calculated in accordance with standards established by the NAREIT Board of Governors in its April 2002 White Paper and related implementation guidance. Alexandria Real Estate Equities, Inc. All Rights Reserved. 206
16 SUPPLEMENTAL INFORMATION
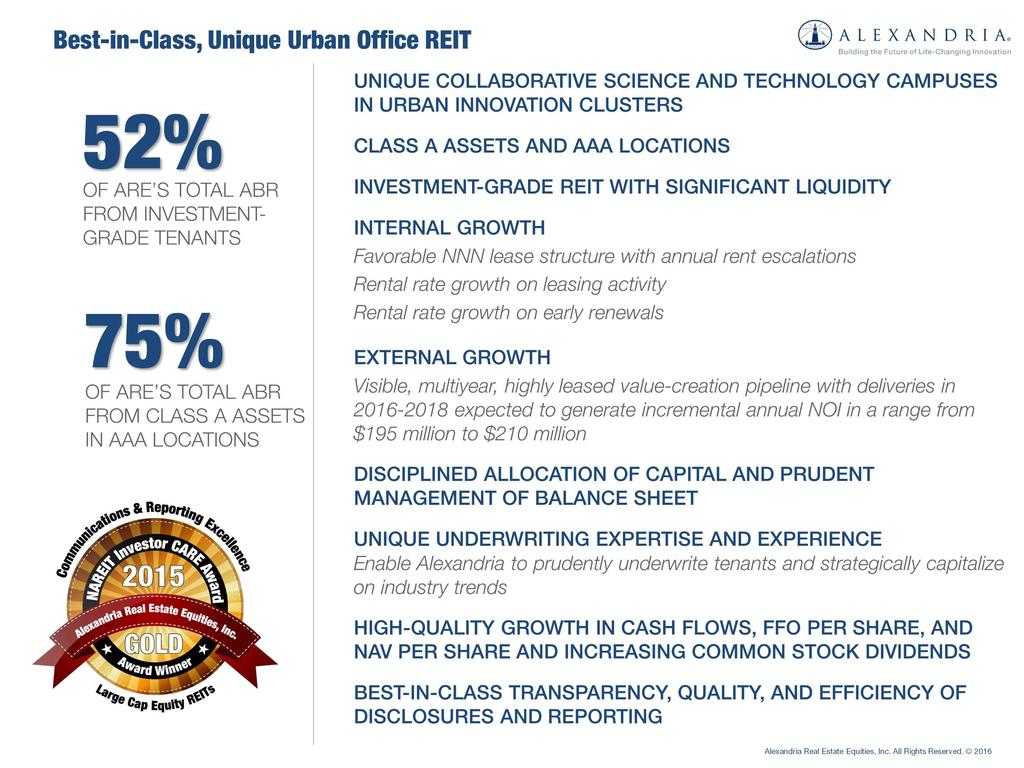
17 Company Profile March 3, 206 Alexandria Real Estate Equities, Inc. (NYSE:ARE) is an urban office REIT uniquely focused on world-class collaborative science and technology campuses in AAA innovation cluster locations, with a total market capitalization of. billion and an asset base in North America of 24.5 million square feet as of March 3, 206. The asset base in North America includes 8.9 million RSF of operating properties and development and redevelopment projects (under construction or pre-construction) and 5.6 million square feet of future ground-up development projects. Alexandria pioneered this niche in 994 and has since established a dominant market presence in key locations, including Greater Boston, San Francisco, New York City, San Diego, Seattle, Maryland, and Research Triangle Park. Alexandria has a longstanding and proven track record of developing Class A assets clustered in urban science and technology campuses that provide its innovative tenants with highly dynamic and collaborative environments that enhance their ability to successfully recruit and retain world-class talent and inspire productivity, efficiency, creativity, and success. We believe these advantages result in higher occupancy levels, longer lease terms, higher rental income, higher returns, and greater long-term asset value. For additional information on Alexandria, please visit Tenant base Alexandria is known for its high-quality and diverse tenant base, with approximately 52% of total annualized base rent as of March 3, 206, generated from investment-grade tenants a REIT industry-leading percentage. Among our Top 20 tenants, approximately 8% of total annualized base rent as of March 3, 206, is generated from investment-grade tenants. The impressive quality, diversity, breadth, and depth of our significant relationships with our tenants provide Alexandria with high-quality and stable cash flows. Alexandria s underwriting skills and long-term industry relationships positively distinguish us from all other publicly traded REITs and real estate companies. Executive/senior management team Alexandria s executive and senior management team has unique experience and expertise in creating highly dynamic and collaborative campuses in key urban science and technology cluster locations that inspire innovation. From the development of high-quality, sustainable real estate, to the ongoing cultivation of collaborative environments with unique amenities and events, the Alexandria team has a first-in-class reputation of excellence in its niche. Our sophisticated management team also includes regional market directors with leading reputations and longstanding relationships within the science and technology communities in their respective urban innovation clusters. We believe that our unparalleled expertise, experience, reputation, and key relationships with the real estate, science, and technology industries provide Alexandria significant competitive advantages in attracting new business opportunities. Alexandria s executive/senior management team, consisting of 24 individuals, averages more than 24 years of real estate experience, including more than 2 years with Alexandria. EXECUTIVE MANAGEMENT TEAM Joel S. Marcus Chairman, Chief Executive Officer & Founder Dean A. Shigenaga Executive Vice President, Chief Financial Officer & Treasurer Thomas J. Andrews Executive Vice President Regional Market Director Greater Boston Jennifer J. Banks Executive Vice President General Counsel & Corporate Secretary Vincent R. Ciruzzi Chief Development Officer Peter M. Moglia Chief Investment Officer Stephen A. Richardson Chief Operating Officer & Regional Market Director San Francisco Daniel J. Ryan Executive Vice President Regional Market Director San Diego & Strategic Operations Alexandria Real Estate Equities, Inc. All Rights Reserved
18 Investor Information March 3, 206 Corporate Headquarters 385 East Colorado Boulevard, Suite 299 Pasadena, California 90 New York Stock Exchange Trading Symbols Common stock: ARE Series D preferred stock: ARE PRD Series E preferred stock: ARE PRE Information Requests Phone: (626) corporateinformation@are.com Web: Equity research coverage Alexandria is currently covered by the following research analysts. This list may not be complete and is subject to change as firms initiate or discontinue coverage of our company. Please note that any opinions, estimates, or forecasts regarding our historical or predicted performance made by these analysts are theirs alone and do not represent opinions, estimates, or forecasts of Alexandria or its management. Alexandria does not by its reference or distribution of the information below imply its endorsement of or concurrence with any opinions, estimates, or forecasts of these analysts. Interested persons may obtain copies of analysts reports on their own as we do not distribute these reports. Several of these firms may from time-to-time own our stock and/or hold other long or short positions in our stock, and may provide compensated services to us. Bank of America Merrill Lynch Jamie Feldman / Jeffrey Spector (646) / (646) Green Street Advisors, Inc. Michael Knott / Kevin Tyler (949) / (949) Mitsubishi UFJ Securities (USA), Inc. Karin Ford / Steve Shaw (22) / (22) Robert W. Baird & Co., Incorporated David Rodgers / Richard Schiller (26) / (32) Barclays Capital Inc. Ross Smotrich / Peter Siciliano (22) / (22) JMP Securities JMP Group, Inc. Peter Martin / Brian Riley (45) / (45) Mizuho Securities USA Inc. Richard Anderson / Jieren Huang (22) / (20) Standard & Poor s Cathy Seifert (22) Citigroup Global Markets Inc. Michael Bilerman / Emmanuel Korchman (22) / (22) J.P. Morgan Securities LLC Anthony Paolone / Gene Nusinzon (22) / (22) RBC Capital Markets Michael Carroll / George Clark (440) / (440) UBS Securities LLC Ross Nussbaum / Nick Yulico (22) / (22) Evercore ISI Sheila McGrath / Nathan Crossett (22) / (22) Rating agencies Moody s Investors Service Philip Kibel / Merrie Frankel (22) / (22) Rating Baa2 Stable Outlook Standard & Poor s Fernanda Hernandez / Anita Ogbara (22) / (22) Rating BBBPositive Outlook Alexandria Real Estate Equities, Inc. All Rights Reserved

19 NAV, FFO, and Common Stock Dividends Per Share March 3, 206 Growth in NAV Per Share () () Growth in FFO Per Share Growth in Quarterly Common Stock Dividends Per Share Based upon Real Estate Securities Monthly by Green Street Advisors Inc. 206 Projected represents the midpoint of guidance for FFO per share attributable to Alexandria s common stockholders diluted, as adjusted. Alexandria Real Estate Equities, Inc. All Rights Reserved
 Represents 48.6% of total ABR. Office and tech office space compose 2.3% and 0.")
20 High-Quality, Diversified, and Innovative Tenants March 3, 206 Cash Flows from High-Quality, Diversified, and Innovative Tenants Top 20 Tenants () Solid Lease Duration Investment-Grade Tenants 8.2 8% Years High-Quality Tenant Base of ABR All Tenants Investment-Grade Tenants 52% of ABR () Represents 48.6% of total ABR. Office and tech office space compose 2.3% and 0.7% of total ABR, respectively. Alexandria Real Estate Equities, Inc. All Rights Reserved

21 Class A Assets in AAA Locations March 3, 206 High-Quality Cash Flows from Class A Assets in AAA Locations Focus in Key Locations Class A Assets in AAA Locations 75% of ARE s Total ABR % of ARE s Total ABR Alexandria Real Estate Equities, Inc. All Rights Reserved
 Average occupancy of operating properties in North America as of December 3 for the last 0 years, and the period ended March 3, 206. As of March 3, 206 Alexandria Real Estate Equities, Inc.")
22 Occupancy March 3, 206 Solid Demand for Class A Assets in AAA Locations Drives Solid Occupancy Current Occupancy of Operating Properties Across Key Locations Solid Historical Occupancy () 95% Over 0 Years () Average occupancy of operating properties in North America as of December 3 for the last 0 years, and the period ended March 3, 206. As of March 3, 206 Alexandria Real Estate Equities, Inc. All Rights Reserved
23 Financial and Asset Base Highlights March 3, 206 (Dollars in thousands, except for per share amounts) Three Months Ended (unless stated otherwise) 2/3/5 9/30/5 6/30/5 3/3/6 Selected financial data from consolidated financial statements and related information Total revenues 26,089 () 223,955 28,60 204,56 3/3/5 96,753 General and administrative expense as a percentage of total assets trailing 2 months 0.7% 0.7% 0.7% 0.7% 0.7% General and administrative expense as a percentage of total revenues trailing 2 months 7.0% 7.% 7.2% 7.2% 7.3% Operating margins Capitalized interest 70% Weighted-average interest rate for capitalization of interest during period 2,099 69% 3.60% 8,696 69% 3.37% 8,436 70% 3.34% 8,437 69% 0, % 3.54% Gross investments in real estate 9,8,058 8,945,26 8,787,478 8,526,845 8,42,86 Investments in unconsolidated real estate joint ventures 27,65 27,22 26,47 2,055 20,028 Total assets 8,97,532 8,88,07 8,72,700 8,497,542 8,379,538 Gross assets 0,348,24 0,96,356 9,972,440 9,702,567 9,533,368 Total unsecured debt 3,274,92 3,25,874 3,52,74 3,30,773 3,24,760 Total debt 4,09,499 3,935,692 4,289,588 4,065,67 3,878,243 Total liabilities 4,784,24 4,587,053 4,937,522 4,658,423 4,582,686 Closing stock price at end of period Dividend per share quarter/annualized 0.80/ / / / /2.96 Dividend payout ratio for the quarter 60% 58% 58% 59% 58% Dividend yield annualized 3.5% 3.4% 3.6% 3.5% 3.0% Total equity capitalization Total market capitalization,099,875 Common shares outstanding (in thousands) 7,008,376 6,949,924 6,446,634 6,640,80 7,386,28 0,885,66 0,736,222 0,706,427,264,37 72,549 7,79 7,689 7,545 72,874 Net (loss) income attributable to Alexandria s common stockholders (3,88) FFO attributable to Alexandria s common stockholders basic and diluted 65,40 FFO attributable to Alexandria s common stockholders diluted, as adjusted 97,078 95,805 95,048 93,620 9,332 AFFO attributable to Alexandria s common stockholders diluted 87,662 83,022 78,654 76,820 78,573 Earnings per share attributable to Alexandria s common stockholders basic and diluted 35,3 32,659 3,29 7,786 03,45 00,359 93,433 9,332 (0.05) FFO per share attributable to Alexandria s common stockholders diluted FFO per share attributable to Alexandria s common stockholders diluted, as adjusted AFFO per share attributable to Alexandria s common stockholders diluted () The decrease in total revenues from 4Q5 is primarily related to a 2.4 million reduction in tenant recoveries due to lower operating expenses and a 3.6 million decrease in investment gains. The increase in capitalized interest compared to 4Q5 is primarily driven by development activities on our 3.5 million RSF highly leased value-creation pipeline as well as an increase in the weighted-average interest rate for capitalization. See Transactions impacting net (loss) income and EPS attributable to Alexandria s common stockholders on page and footnote 4 on page 5. Alexandria Real Estate Equities, Inc. All Rights Reserved
24 Financial and Asset Base Highlights (continued) March 3, 206 (Dollars in thousands, except for per share and ABR per occupied RSF amounts) Three Months Ended (unless stated otherwise) 2/3/5 9/30/5 6/30/5 3/3/6 3/3/5 Operating statistics and related information Number of properties RSF (including development and redevelopment projects under construction) North America 8,903,424 8,874,070 8,744,025 7,68,209 7,330,534 Total rentable square feet North America 24,509,859 24,49,60 23,85,586 23,452,253 23,037,5 Total operating rentable square feet Asia,200,683,99,74,99,74,99,74,97,464 ABR per occupied RSF North America Occupancy of operating properties North America 97.3% 97.2% 96.2% 95.9% 96.8% Occupancy of operating and redevelopment properties North America 93.8% 93.7% 93.0% 95.9% 95.9% 388,872 (),02,238,02,756,95,379,022,669 Rental rate increases 33.6% 9.8% 7.5% 4.5% 30.8% Rental rate increases (cash basis) 6.9% 7.3% 8.8% 7.0% 8.5% 28, , , , ,286 NOI increase NOI increase (cash basis) 5.3%.3%.% 0.5% 2.3% 6.2% 2.0% 4.8% 4.7% 7.8% Adjusted EBITDA margins 65% 65% 65% 65% 64% Total leasing activity RSF Lease renewals and re-leasing of space change in average new rental rates over expiring rates: RSF Certain non-gaap and credit metric information Same property percentage change over comparable quarter from prior year: (4) Adjusted EBITDA quarter annualized 545,96 586,20 570, , ,088 Adjusted EBITDA trailing 2 months 558, ,6 525,944 50,827 48,743 Net debt (excluding unamortized deferred financing costs) 4,04,077 3,857,727 4,24,840 4,023,048 3,797,73 Net debt to Adjusted EBITDA quarter annualized 7.4x 6.6x 7.4x 7.5x 7.5x Net debt to Adjusted EBITDA trailing 2 months 7.2x 7.0x 8.x 8.0x 7.9x Fixed charge coverage ratio quarter annualized 3.3x 3.6x 3.5x 3.4x 3.3x Fixed charge coverage ratio trailing 2 months 3.4x 3.4x 3.4x 3.3x 3.3x Unencumbered NOI as a percentage of total NOI 8% 8% 79% 78% 82% () (4) Executed leases for 388,872 RSF during Q6, despite minimal contractual lease expirations in 206 and our highly pre-leased value-creation pipeline. Q6 rental rate increases were driven by four leases that generated average increases in rental rates of 47%, and 29% on a cash basis. Refer to our Guidance on page 6 for estimated rental rate growth for the year ending December 3, 206. Included in total leasing activity immediately above. Decrease from 4Q5 is primarily driven by the sales of partial interest in three core Class A assets to TIAA-CREF in December 205 at an aggregate sales price of 453. million and a cash capitalization rate of 4.6%. Alexandria Real Estate Equities, Inc. All Rights Reserved
 Rental Rate Increases:")

25 Key Operating Metrics March 3, 206 Favorable Lease Structure Percentage of triple net leases Same Property NOI Increase 96% Stable cash flows Percentage of leases containing annual rent escalations 95% Increasing cash flows Percentage of leases providing for the recapture of capital expenditures Lower capex burden 94% Adjusted EBITDA Margin () Rental Rate Increases: Renewed/Re-Leased Space 65% () Represents the three months ended March 3, 206, annualized. Q6 rental rate increases were driven by four leases that generated average increases in rental rates of 47%, and 29% on a cash basis. Refer to our Guidance on page 6 for estimated rental rate growth for the year ending December 3, 206. Alexandria Real Estate Equities, Inc. All Rights Reserved
26 Same Property Performance March 3, 206 Q6 Same Property Financial Data Percentage change over comparable period from prior year: Q6 Same Property Statistical Data Number of same properties 69 NOI increase 5.3% Rentable square feet NOI increase (cash basis) 6.2% Occupancy current-period average 94.6% 70% Occupancy same-period prior-year average 93.6% Operating margin 4,855,443 The tables below provide two alternative calculations of same property performance in comparison to our historical same property performance. Our reported same property performance is based upon a pool of operating assets and development and redevelopment projects recently placed into service to the extent that those assets were operating for the entirety of the comparable same property periods presented. The two alternative calculations presented below consist of (i) same property performance for the operating portfolio excluding assets that were recently developed or redeveloped, and (ii) the same property performance for the operating portfolio including those redevelopment projects that were either under construction or recently placed into service. Same property performance including redevelopment properties generally would have been higher than our method of reporting same property performance. Same property performance including redevelopment properties will, from time to time, have significant growth in NOI as a result of the completion of the conversion of non-laboratory space (with lower NOI) to office/laboratory space (with higher NOI) through redevelopment. We believe our method of reporting same property performance is a more useful presentation since it excludes the potential significant increases in performance as a result of completion of significant redevelopment projects. Operating Properties Same Property NOI Included in All Comparative Periods Recently Placed into Service Properties Under Construction Developments Redevelopments Development Redevelopment As reported Yes Yes () Yes () No No Operating portfolio Yes No No No No Including redevelopments Yes No Yes No Yes Percentage change in same property NOI over preceding period Percentage change in same property NOI over preceding period (cash basis) Same Property Q6 Same Property Q6 As reported.8% 4.5%.3% 5.3% As reported 5.4% 5.5% 4.7% 6.2% Operating portfolio.7% 4.8%.% 5.0% Operating portfolio 4.4% 3.3% 4.2% 5.2% Including redevelopments 8.4% 6.9% 3.% 4.9% Including redevelopments 9.6% 8.% 5.8% 5.2% () Development and redevelopment projects recently placed into service are included in the same property data for each of the year-over-year comparison periods only if the property was operating during both entire same property periods. For example, projects completed during 204 are included in 206 versus 205 same property performance (as a percentage change over 205). Alexandria Real Estate Equities, Inc. All Rights Reserved
27 Same Property Performance (continued) March 3, 206 (Dollars in thousands) Three Months Ended March 3, 205 Change 206 Same properties Non-same properties Total rental Same properties Non-same properties Total tenant recoveries 27,023 3,253 58,276 22,626 20,982 43,608 4,397 0,27 4, % ,07 8,526 52,597 42,204 6,90 48,394 5,205 5,26 2 4,739 4,75 Same properties Non-same properties Total revenues 7,05 44,984 26,089 64,842 3,9 96,753 6,263 3,073 9, Same properties Non-same properties Total rental operations 5,07 4,730 65,837 50,858 0,365 6, ,365 4, ,998 30,254 50,252 3,984 2,546 35,530 6,04 8,708 4, (6,055) (6,055) Same properties Non-same properties Total other income Same properties Non-same properties Consolidated net operating income Same properties Non-same properties Less: NOI of consolidated real estate JVs attributable to NCI Our share of NOI same properties Our share of straight-line rent revenue and amortization of acquired below-market leases Our share of NOI same properties (cash basis) () (8.3) (6,055) (6,055),068, ,998 25,267 45,265 3,984 22,406 36,390 6,04 2,86 8, % 9,998 3,984 6,04 5.3% (4,497) 5,50 (5,28) 08, ,735 (3.8) 6.2% Same properties Non-same properties Our share of NOI from unconsolidated real estate JVs Same properties Non-same properties Our share of total net operating income,867 2,336 4,203 % Change () () () Q6 same property NOI increased partially due to a.0% increase in our same property occupancy to 94.6% from 93.6%. Alexandria Real Estate Equities, Inc. All Rights Reserved
28 Leasing Activity March 3, 206 Three Months Ended Year Ended March 3, 206 (Dollars are per RSF) Including Straight-Line Rent December 3, 205 Including Straight-Line Rent Cash Basis Cash Basis Leasing activity: Renewed/re-leased space () Rental rate changes 33.6% 6.9% 9.6% 9.9% New rates Expiring rates Rentable square footage Number of leases Tenant improvements/leasing commissions Average lease terms 28,342 2,209, years years Developed/redeveloped/previously vacant space leased New rates Rentable square footage Number of leases Tenant improvements/leasing commissions ,530 7 Average lease terms ,762, years years Leasing activity summary (totals): New rates Rentable square footage 388,872 Number of leases Tenant improvements/leasing commissions ,972,042 4 Average lease terms years years Lease expirations: () Expiring rates Rentable square footage Number of leases ,566 2,80, Leasing activity includes 00% of results for properties managed by us. () Excludes 4 month-to-month leases for 27,08 RSF and 6 month-to-month leases for 30,80 RSF as of March 3, 206 and December 3, 205, respectively. Q6 rental rate increases were driven by four leases that generated average increases in rental rates of 47%, and 29% on a cash basis. Refer to our Guidance on page 6 for estimated rental rate growth for the year ending December 3, 206. During the three months ended March 3, 206, we granted tenant concessions/free rent averaging. months with respect to the 388,872 RSF leased. Alexandria Real Estate Equities, Inc. All Rights Reserved
29 Contractual Lease Expirations March 3, 206 Year Number of Leases () 798,034 Leased % ,344,2 8.5% ,86,899.8% ,393, % ,599,06 0.% ,536, % ,074,8 6.8% ,284,999 8.% , % , % Thereafter 39 3,373, % 48.0 Negotiating/ Anticipating Targeted for Redevelopment Remaining Expiring Leases Total () 38,803,845 46,76 87,364 San Francisco 27,05 50,400 5,62 4,456 San Diego Seattle Maryland Research Triangle Park ABR (per RSF) 207 Greater Boston New York City () Contractual Lease Expirations Market Percentage of Occupied RSF RSF ABR of Expiring Leases (per RSF) 207 Contractual Lease Expirations Leased Negotiating/ Anticipating Targeted for Redevelopment Remaining Expiring Leases Total ABR of Expiring Leases (per RSF) 42.97, , , , ,980 28,488 82, ,456 N/A 5,48 5,48 N/A 46,033 4,685 25,9 3, ,87 249, ,468 36,288 38, ,33 47,326 67, ,457 69,559 33,055 07, ,228 0, ,008 28,494 4,504 02, ,566 09,664, , Non-cluster markets 43,045 43, Asia 35,335 8,632 43, ,676 56,800 24,677 2, Total 50, ,38 446, , , ,269,048,567,344,2 Percentage of expiring leases 9% 25% % 56% 00% 5% 7% % 78% % Lease expirations include 00% of the RSF for properties managed by us. () Excludes 4 month-to-month leases for 27,08 RSF. Includes 25,409 RSF leased to Eli Lilly and Company at 0300 Campus Point Drive with a contractual expiration in 4Q6. This tenant will relocate and expand into 304,326 RSF at our recently acquired redevelopment project at 0290 Campus Point Drive. Alexandria Real Estate Equities, Inc. All Rights Reserved
30 Top 20 Tenants March 3, 206 (Dollars in thousands) 8% of ABR from Investment-Grade Tenants () Investment-Grade Ratings Remaining Lease Term in Years Tenant ARIAD Pharmaceuticals, Inc. 4.0 Aggregate RSF ABR 386, (4) Percentage of Aggregate ABR Fitch Moody s S&P 29, % 2 Novartis AG.9 564,873 29, AA Aa3 AA- 3 Illumina, Inc ,886 25, BBB 4 New York University ,224 20, Aa3 AA- 5 Eli Lilly and Company ,527 9, A A2 AA- 6 Amgen Inc ,369 7, BBB Baa A 7 Roche ,786 6, AA A AA 8 Dana-Farber Cancer Institute, Inc ,090 5, A 9 Celgene Corporation ,797 5, Baa2 BBB+ 0 United States Government ,47 4, AAA Aaa AA+ FibroGen, Inc ,249 4, Biogen Inc ,22 3, Baa A- 3 Massachusetts Institute of Technology ,620 2, Aaa AAA 4 GlaxoSmithKline plc ,604,098.8 A+ A2 A+ 5 Bristol-Myers Squibb Company ,36 0,742.7 A- A2 A+ 6 The Regents of the University of California ,633 0,5.7 AA Aa2 AA 7 Sanofi ,697 8,042.3 AA- A AA 8 Alnylam Pharmaceuticals, Inc ,424 7, Sumitomo Dainippon Pharma Co., Ltd ,232 6, Pfizer Inc ,348.0 A+ A AA Total/weighted average 8.2 5,798,45 6, , % ABR and RSF amounts include 00% of the properties managed by us. () (4) Represents ABR from investment-grade rated tenants as a percentage of ABR from top 20 tenants. Based on percentage of aggregate ABR in effect as of March 3, 206. IBM Watson Health, a digital health venture of IBM, currently subleases 63,86 RSF at 75 Binney Street with an initial lease term of 0 years. IBM holds investment-grade ratings of A+ (Fitch), Aa3 (Moody s), and AA- (S&P). As of March 3, 206, number of leases, RSF, and ABR consisted of the following: Number of leases Cambridge, MA San Diego, CA India RSF 425,020 46,033 93, ,873 ABR 26,266,434,602 29,302 Alexandria Real Estate Equities, Inc. All Rights Reserved

31 Summary of Properties and Occupancy March 3, 206 (Dollars in thousands, except per RSF amounts) Summary of properties RSF Market Operating Development Redevelopment Total % Total ABR Number of Properties Total Per RSF Greater Boston 4,462,540,3,392 59,783 5,635,75 28% ,394 36% 5.28 San Francisco 2,786, ,980 3,659, , ,079 62, , , ,858,5 590,887 55,362 3,964, , New York City San Diego Seattle % of Total 746, ,806,034, , Maryland 2,085,96 2,085, , Research Triangle Park,043,2,043, , Canada 322, , , Non-cluster markets 268, , , Properties held for sale 6,690 6, ,53 N/A 5,400,69 2,927, ,45 8,903, , ,200,683,200, , ,60,302 2,927, ,45 20,04,07 00% North America Asia Total ,674 00% RSF, number of properties, and ABR amounts include 00% of the properties managed by us. Summary of occupancy Operating Properties Market Greater Boston 3/3/ % 2/3/ % Operating and Redevelopment Properties 3/3/ % 3/3/6 2/3/ % 95.2 % 3/3/ % San Francisco New York City San Diego Seattle Maryland Research Triangle Park Canada Subtotal Non-cluster markets % 97.2% 96.8% 93.8% 93.7% 95.9% North America Occupancy includes 00% of properties managed by us. Alexandria Real Estate Equities, Inc. All Rights Reserved
32 Property Listing March 3, 206 (Dollars in thousands) RSF Market / Submarket / Address Greater Boston Cambridge/Inner Suburbs Alexandria Center at Kendall Square 50/60, 00, and 75/25 Binney Street, 6 and 25 First Street, 50 Second Street, 300 Third Street, and Hurley Street 225 Binney Street (consolidated joint venture 30% ownership) Alexandria Technology Square 00, 200, 300, 400, 500, 600, and 700 Technology Square 480/500 Arsenal Street 640 Memorial Drive 780/790 Memorial Drive 67 Sidney Street/99 Erie Street 79/96 Thirteenth Street Charlestown Navy Yard Cambridge/Inner Suburbs Longwood Medical Area 360 Longwood Avenue (unconsolidated joint venture 27.5% ownership) Route 28 Alexandria Park at 28 3, 6, and 8 Preston Court, 29, 35, and 44 Hartwell Avenue, 35, 45, and 47 Wiggins Avenue, and 60 Westview Street 9 Presidential Way 225 Second Avenue 00 Beaver Street 285 Bear Hill Road Route 28 Route 495/Worcester /30 Forbes Boulevard 20 Walkup Drive 30 Bearfoot Road Route 495/Worcester Greater Boston Operating Development Redevelopment,056,522 96,960 59,783 Total Occupancy Percentage Number of Properties 2,078,265 9 ABR Operating and Redevelopment Operating 62,309 % 94.6 % 305,22 305,22 3,278,8,635,8, , , ,504 99,658 54,549 25,309 3,82,649 96,960 59, , ,504 99,658 54,549 25,309 4,204, ,68 3,687 6,700 2, , ,367 5,432 43,799 9, , , ,69 44,892 2,500 82,330 26, ,874 44,892 2,500 82,330 26, ,874 2,074 4,02 3, , ,846 9,045 60, ,650 4,462,540,3,392 59,783 55,846 9,045 60, ,650 5,635, , ,765 4, ,394 () 97.6% % RSF, ABR, and occupancy include 00% of properties managed by us. () We have leased 75,924 RSF, or 52.4%, with delivery/occupancy scheduled for 2Q6. Alexandria Real Estate Equities, Inc. All Rights Reserved
33 Property Listing (continued) March 3, 206 (Dollars in thousands) RSF Market / Submarket / Address San Francisco Mission Bay/SoMa 409/499 Illinois Street (consolidated joint venture 60% ownership) 455/55 Third Street (unconsolidated joint venture 5% ownership) 50 Townsend Street 455 Mission Bay Boulevard South 500 Owens Street (consolidated joint venture 50.% ownership) 700 Owens Street 505 Brannan Street (consolidated joint venture 99.2% ownership) Mission Bay/SoMa South San Francisco Alexandria Technology Center Gateway 600, 630, 650, 68, 90, and 95 Gateway Boulevard 249/259/269 East Grand Avenue 400/450 East Jamie Court 500 Forbes Boulevard 7000 Shoreline Court 34/343 Oyster Point Boulevard 849/863 Mitten Road and 866 Malcolm Road South San Francisco Palo Alto/Stanford Research Park 2425 Garcia Avenue and 2400/2450 Bayshore Parkway 365 Porter Drive 3350 West Bayshore Road 2625/2627/263 Hanover Street Palo Alto/Stanford Research Park San Francisco New York City Manhattan Alexandria Center for Life Science 430 and 450 East 29th Street New York City Operating Total Occupancy Percentage Number of Properties Development Redevelopment 455,069 20,398 58,267 57,340 98, , ,000 50, , , , ,000 20,398 58,267 57,340 50,000,854, ,75 448,75 407,369 63,035 55,685 36,395 07,960 03,857,522,476 99,208 9,644 60,000 32, ,926 2,786, , , ,079 ABR Operating Operating and Redevelopment 28,27 9,999 7,077 0,79 55,526 % % 6 7, ,369 63,035 55,685 36,395 07,960 03,857,522, ,573 6,028 5,540 4,582 3,375 3,08 56,389 99,208 9,644 60,000 32, ,926 3,659, ,257 3,885,99,545,606 23,52 62, , , , , , % 99.7% RSF, ABR, and occupancy include 00% of properties managed by us. Alexandria Real Estate Equities, Inc. All Rights Reserved
34 Property Listing (continued) March 3, 206 (Dollars in thousands) RSF Market / Submarket / Address San Diego Torrey Pines ARE Spectrum 325 Merryfield Row and 303/3033 Science Park Road ARE Nautilus 3530/3550 John Hopkins Court and 3535/3565 General Atomics Court ARE Sunrise 093, 0933, and 0975 North Torrey Pines Road, 300 Science Park Road, and 0996 Torreyana Road 3545 Cray Court 9 North Torrey Pines Road Torrey Pines University Town Center 5200 Illumina Way Alexandria Center for Life Science at Campus Pointe 0290 and 0300 Campus Point Drive ARE Towne Centre 9363, 9373, 9393, and 9625 Towne Centre Drive ARE Esplanade 4755, 4757, and 4767 Nexus Center Drive, and 4796 Executive Drive 9880 Campus Point Drive University Town Center Sorrento Mesa 580/5820 and 638/646/650 Nancy Ridge Drive ARE Portola 675, 6225, and 6275 Nancy Ridge Drive 02/05 Barnes Canyon Road 7330 Carroll Road 587 Oberlin Drive Sorrento Mesa Sorrento Valley 025/035/045/055/065/075 Roselle Street 3985/4025/403/4045 Sorrento Valley Boulevard Sorrento Valley I-5 Corridor 32 Evening Creek Drive San Diego Operating Total Occupancy Percentage Number of Properties Development Redevelopment 02, , , ,9 24,9 23,526 6,556 72, ,77 233, , ,759 ABR Operating Operating and Redevelopment 4,486 % % 4 6, , ,845 6,556 72, , ,827 2,799 27, , , , , ,522 8, ,398 62,56 302,554 4, ,208 6,755 24, ,978 7,50,338, , ,482 7,50 2,62, ,774 49, ,90 05,82 60,90 05, ,027 2, ,52 66,244 33,87 420,295 48,880 48,880 02,392 66,244 33,87 469,75 2 0,472 2,43 973, ,655 03, 224,766 2,655 03, 224, ,798 2,392 5, ,780 2,858,5 590,887 55,362 09,780 3,964, % 80.% 2,495 94,997 () RSF, ABR, and occupancy include 00% of properties managed by us. () We are in active negotiations with a life science tenant for the 48,880 RSF currently in redevelopment at 05 Barnes Canyon Road. Alexandria Real Estate Equities, Inc. All Rights Reserved
35 Property Listing (continued) March 3, 206 (Dollars in thousands) RSF Market / Submarket / Address Seattle Lake Union 400 Dexter Avenue North 20/208 Eastlake Avenue East 66 Eastlake Avenue East 55 Eastlake Avenue East 99 East Blaine Street 29 Terry Avenue North 600 Fairview Avenue East Lake Union Elliott Bay 3000/308 Western Avenue 40 West Harrison/40 Elliott Avenue West Elliott Bay Seattle Maryland Rockville 9800 Medical Center Drive 330 Piccard Drive 500/550 East Gude Drive 4920/500 Broschart Road 405 Research Boulevard 5 Research Place 9920 Medical Center Drive 5 Research Court 230 Parklawn Drive Rockville Gaithersburg Alexandria Technology Center Gaithersburg I 9 West Watkins Mill Road and 90, 930, and 940 Clopper Road Alexandria Technology Center Gaithersburg II 708 Quince Orchard Road, 300 Quince Orchard Boulevard, and 9, 20, and 22 Firstfield Road 40 Professional Drive 950 Wind River Lane 620 Professional Drive Gaithersburg Beltsville 8000/9000/0000 Virginia Manor Road Northern Virginia 4225 Newbrook Drive Maryland Operating Total Occupancy Percentage Number of Properties Development Redevelopment 203,369 68,708 7,482 5,084 30,705 27,99 663, , , , ,369 68,708 7,482 5,084 30,705 27,99 95, ,746 35,75 82,92 746, ,806 47,746 35,75 82,92,034, ,436 3,5 90,489 86,703 7,669 63,852 58,733 54,906 49,85 889, ,40 237,37 ABR Operating Operating and Redevelopment 8,748 8,40 4,226 6,8,65,33 30,043 % % ,839,84 3,023 33, ,436 3,5 90,489 86,703 7,669 63,852 58,733 54,906 49,85 889, ,440 3,2,68,928 2,04 2, ,69 25, ,40 4 7, ,37 5 6, ,54 50,000 27, ,642 63,54 50,000 27, ,642 2,226,082,9 7, ,884 9,884 2, ,86 2,085,96 248,86 2,085, % 95.9% 5,38 50,273 RSF, ABR, and occupancy include 00% of properties managed by us. Alexandria Real Estate Equities, Inc. All Rights Reserved
36 Property Listing (continued) March 3, 206 (Dollars in thousands) RSF Market / Submarket / Address 86,870 86, ,47 35,677 58,47 35, ,537 2, ,000 96,626 8,956 82,48 77,395 6,547 32,20 30,22,043,2 00,000 96,626 8,956 82,48 77,395 6,547 32,20 30,22,043,2 5,062 3,56,644,488,2 2, , Canada 322, , , Non-cluster markets 268, , , Properties held for sale in North America 6020 Industrial Drive 306 Belmont Street and 350 Plantation Street Properties held for sale in North America 7,000 90,690 6,690 7,000 90,690 6, ,479 2,53 N/A N/A N/A N/A N/A N/A 5,400,69 2,927, ,45 8,903, , , ,355,200, , ,355,200, % % 6,60,302 2,927, ,45 20,04,07 98 Asia China India Asia () Total 3,484,977 5,508 7,485 Operating Operating and Redevelopment Redevelopment North America Total ABR Development Research Triangle Park Research Triangle Park Alexandria Technology Center Alston 00, 800, and 80 Capitola Drive 08/0/2/4 TW Alexander Drive Alexandria Innovation Center Research Triangle Park 700, 7020, and 7030 Kit Creek Road 6 Davis Drive 7 Triangle Drive 407 Davis Drive 2525 East NC Highway Keystone Park Drive 6040 George Watts Hill Drive 5 Triangle Drive 60 Quadrangle Drive Research Triangle Park Operating Occupancy Percentage Number of Properties 99.5 % 99.5 % 627,674 RSF, ABR, and occupancy include 00% of properties managed by us. () See page 5 for additional information. Alexandria Real Estate Equities, Inc. All Rights Reserved
37 Key Real Estate Metrics March 3, 206 Incremental Annual NOI by Year of Delivery from Development and Redevelopment Projects () TOTAL & M 75 M 20 M to 20 M RSF PERCENTAGE LEASED INITIAL CASH YIELD () = to 80 M.5M 90% 7.% + to 30 M 2.0M 72% Represents incremental annual NOI upon stabilization of our development and redevelopment projects, including our share of real estate joint venture development projects. Excludes NOI related to spaces delivered and in service prior to March 3, 206. Alexandria Real Estate Equities, Inc. All Rights Reserved
38 Disciplined Allocation of Capital and Management of Value-Creation Pipeline March 3, 206 () 206 Disciplined Allocation of Capital () 6% of Gross Investments in Real Estate in North America Value-Creation Pipeline Pre-Leased Percentage of Ground-Up Developments Since January, 2009 Ground-Up Developments Commenced & Delivered Since January, 2009 Single-Tenant Multi-Tenant 00% 38% Pre-Leased Pre-Leased 2.6M RSF 2.5M RSF Average Initial Stabilized Yield Average Initial Stabilized Yield (Cash Basis) 7.9% 7.6% Includes projected construction and acquisitions for the year ending December 3, 206. Refer to page 44 for additional details. Represents average pre-leased percentage at the time development commenced. Alexandria Real Estate Equities, Inc. All Rights Reserved

39 Sustainability March 3, 206 () Upon completion of 20 in-process LEED certification projects. Kilowatt-hour saving reflects our property at Alexandria Center for Life Science at Campus Pointe. Source: Conversion from the EPA clean energy website. Alexandria Real Estate Equities, Inc. All Rights Reserved
40 Investments in Real Estate March 3, 206 (Dollars in thousands, except per square foot amounts) Page Rental properties North America 27 Consolidated 7,559,726 Investments in Real Estate Noncontrolling ARE Share of Share of Unconsolidated Consolidated Real Estate Real Estate Joint Ventures Joint Ventures (322,442) Square Feet Consolidated Unconsolidated Real Estate Joint Ventures at 00% 84% 5,38, ,367 5,400,69 Total ARE Share Amount 7,092 7,308,376 % Total Per SF () 506 Development and redevelopment projects: Projects to be delivered by 4Q ,952 35, ,784 8,34,545 5,432,465, Projects to be delivered by 207 and ,86 (223) 67,62 555,25 6,63, ,980 2,036, ,06,38 (223) 02,994,208, ,928, ,42 3,502, ,665,864 (322,665) 74,086 8,57,285 8,066, ,779 8,903, ,42 (2,275) 22, ,606,435 5,606, Value-creation pipeline North America,340,280 (2,498) 02,994,430, ,534, ,42 9,09, Gross investments in real estate North America 8,900,006 (334,940) 74,086 8,739,52 00% 23,673, ,779 24,509, ,386 (,44) 6,945,200,683,200,683 54,666 Development and redevelopment projects Rental properties and development/redevelopment projects Future value-creation projects North America 4 Asia: Rental properties Land parcels 54,666 Gross investments in real estate Asia Gross investments in real estate Less: accumulated depreciation North America Less: accumulated depreciation Asia Investments in real estate 28,052 (,44) 26,6 9,8,058 (336,38) 74,086 8,955,763 (,358,820) 23,033 (7,772) 7,74, (33,76) 36 (2,55) 7,57 Square foot amounts include 00% of properties managed by us. () The per square foot amounts represent our investment in our real estate, including our partners share of consolidated and unconsolidated real estate joint ventures, divided by 00% of the rentable or developable square feet of the respective properties. In late April 206, we recognized an aggregate impairment charge of 53.0 million. See page 5 for net assets of 04.4 million after impairment charge recognized in April 206 related to our real estate investments in Asia. Alexandria Real Estate Equities, Inc. All Rights Reserved
41 Visible Growth Pipeline: Highly Leased Projects to Be Placed into Service by 4Q6 March 3, 206 (Dollars in thousands) Project RSF Percentage Total Leased/Negotiating Property/Market/Submarket Initial Stabilized 430 East 29th Street/New York City/Manhattan Dev 356,044 62,595 48,639 90% 0% 48, % 4Q2 4Q3 2Q Illumina Way, Bldg 6/San Diego/University Town Center Dev 295, ,609 00% % 295, % 3Q4 3Q6 3Q6 50/60 Binney Street/Greater Boston/Cambridge Dev 530, ,477 98% % 520, % Q5 4Q6 4Q6 360 Longwood Avenue/Greater Boston/Longwood Medical Area Dev 262,367 5,432 43,799 63% 3% 33, % 2Q2 3Q4 4Q Executive Drive/San Diego/University Town Center Dev 6,755 6,755 00% % 6, % 4Q5 4Q6 4Q Campus Point Drive/San Diego/University Town Center Redev 304, ,326 00% % 304, % 3Q5 4Q6 4Q6 Hurley Street/Greater Boston/Cambridge Redev 59,783 59,783 00% % 59, % 3Q5 4Q6 4Q6 68,4,465,977 2,084,388 90% 5%,973,847 95% In Service Total/weighted average CIP Total Leased Negotiating RSF % Project Start Our Share of Investment Property/Market/Submarket 00% 5200 Illumina Way, Bldg 6/San Diego/University Town Center 00% Unlevered Yields Cost to Complete Our Ownership Interest 430 East 29th Street/New York City/Manhattan In Service 382,277 CIP 72,775 Construction Financing 55,225 Total at Completion Other 8,93 Average Cash Initial Stabilized Cash Basis Initial Stabilized 463,245 7.% 6.6% 6.5% 4,675 69, % 7.0% 8.4% 500,000 3,725 08,965 50/60 Binney Street/Greater Boston/Cambridge 00% 327,786 72,24 () 360 Longwood Avenue/Greater Boston/Longwood Medical Area 27.5% 60,305 35,832 9, Executive Drive/San Diego/University Town Center 00% 5,978 26,222 42, % 6.8% 7.% 0290 Campus Point Drive/San Diego/University Town Center 00% 33,492 07,508 24, % 6.8% 7.0% Hurley Street/Greater Boston/Cambridge 00% 4, % 7.9% 8.6% Total/weighted average () Occupancy Dev/ Redev 442,582 2, ,784 8,37 28,304 88,627 8.% 8.2% 7.3% 7.3% 7.4% 7.8%,466,30 See page 56 for additional information related to our secured construction loans. See page 50 for additional information related to our unconsolidated real estate joint venture secured construction loan. Our projected cost at completion and unlevered yields are based upon our share of the investment in real estate, including costs incurred directly by us outside of the real estate joint venture. Development management fees earned from these development projects have been excluded from our estimate of unlevered yields. The RSF related to the project in the table above represents 00% of the project RSF. Alexandria Real Estate Equities, Inc. All Rights Reserved
 March 3, 206")


42 Visible Growth Pipeline: Highly Leased Projects to Be Placed into Service by 4Q6 (continued) March 3, East 29th Street New York City/Manhattan 62,595 RSF Roche/New York University/Others 5200 Illumina Way, Building 6 San Diego/University Town Center 295,609 RSF Illumina, Inc. 50 Binney Street Greater Boston/Cambridge 274,734 RSF Sanofi Genzyme 60 Binney Street Greater Boston/Cambridge 255,743 RSF bluebird bio, Inc. 360 Longwood Avenue 4796 Executive Drive 0290 Campus Point Drive Hurley Street Greater Boston/Longwood Medical Area 5,432 RSF Dana-Farber Cancer Institute, Inc. The Children s Hospital Corporation San Diego/University Town Center 6,755 RSF San Diego/University Town Center 304,326 RSF Greater Boston/Cambridge 59,783 RSF Otonomy, Inc. Eli Lilly and Company Editas Medicine, Inc. Alexandria Real Estate Equities, Inc. All Rights Reserved
43 Visible Growth Pipeline: Projects to Be Placed into Service by 207 and 208 March 3, 206 (Dollars in thousands) Project RSF Percentage Total Leased/Negotiating Property/Market/Submarket CIP Total Initial Stabilized 00 Binney Street/Greater Boston/Cambridge Dev 43,483 43,483 48% 26% 320, % 3Q5 4Q Townsend Street/San Francisco/Mission Bay/SoMa Dev 300, ,000 00% % 300, % 3Q5 3Q Brannan Street, Phase I/San Francisco/Mission Bay/SoMa Dev 50,000 50,000 00% % 50, % Q6 2H /55 Third Street/San Francisco/Mission Bay/SoMa Dev 422, ,980 00% % 422, % 3Q4 2Q/3Q Dexter Avenue North/Seattle/Lake Union Dev 287, ,806 56% 34% 259, % 2Q5 Q7 208 ARE Spectrum/San Diego/Torrey Pines Dev 02, , ,46 9% % 305,525 9 % 2Q6 2H ,56 62,56 % % % 3Q5 Q Q5 H Towne Centre Drive/San Diego/University Town Center Redev 05 Barnes Canyon Road/San Diego/Sorrento Mesa Redev In Service Total/weighted average Leased Negotiating RSF % 48,880 48,880 % 00% 48, % 02,938 2,036,828 2,39,766 72% 2%,807,662 84% () Project Start Our Share of Investment Property/Market/Submarket (4) (5) Unlevered Yields Cost to Complete Our Ownership Interest In Service Construction Financing CIP 535, % 7.0% 7.7% 77,753 60, , % 7.0% 7.2% 505 Brannan Street, Phase I/San Francisco/Mission Bay/SoMa 99.2% 29,528,472 4, % 7.0% 8.2% (5) (5) (5) 0, Dexter Avenue North/Seattle/Lake Union 00% ARE Spectrum/San Diego/Torrey Pines 00% 54, Towne Centre Drive/San Diego/University Town Center 00% 05 Barnes Canyon Road/San Diego/Sorrento Mesa 00% 4,850 TBD 68,494 63, , % 6.9% 7.2% 92,902 30, , % 6.% 6.4% 23,577 TBD (5) (5) (5) 6,840 TBD (5) (5) (5) 64,99 67,62 (4) 304,28 Initial Stabilized 00% 5.0% Initial Stabilized Cash Basis 50 Townsend Street/San Francisco/Mission Bay/SoMa (4) 88,869 Other Average Cash 00% 455/55 Third Street/San Francisco/Mission Bay/SoMa Total at Completion 00 Binney Street/Greater Boston/Cambridge Total/weighted average () Occupancy Dev/ Redev 555,25 304,28 TBD TBD Remaining 0% RSF includes 5% of retail space expected to be leased closer to initial occupancy. As of Q6, the ARE Spectrum project was expanded to include 325 Merryfield Row, an additional building aggregating 70,523 RSF. We expect to commence construction on the 325 Merryfield Row building in 2Q6, which is leased 00% to Vertex Pharmaceuticals Incorporated, with an estimated initial occupancy date in 2H7. Funding for this project is expected to be provided primarily by a secured construction loan that we closed in April 206 with commitments available for borrowing of million at a rate of LIBOR+200 bps. We have two, one-year options to extend the stated maturity date to April 20, 202, subject to certain conditions. The in-service and CIP costs are based on our share of the investment in real estate, including costs incurred directly by us outside of the joint venture. The RSF related to the project in the table above represents 00% of the project RSF. The design and budget of these projects are in process, and the estimated project costs with related yields are expected to be disclosed in the future. Alexandria Real Estate Equities, Inc. All Rights Reserved
 March 3, 206 00")


44 Visible Growth Pipeline: Projects to Be Placed into Service by 207 and 208 (continued) March 3, Binney Street Greater Boston/Cambridge 43,483 RSF 50 Townsend Street San Francisco/Mission Bay/SoMa 300,000 RSF 505 Brannan Street, Phase I San Francisco/Mission Bay/SoMa 50,000 RSF 455/55 Third Street San Francisco/Mission Bay/SoMa 422,980 RSF Bristol-Myers Squibb Company Stripe, Inc. Pinterest, Inc. Uber Technologies, Inc. 400 Dexter Avenue North ARE Spectrum 9625 Towne Centre Drive 05 Barnes Canyon Road Seattle/Lake Union 287,806 RSF San Diego/Torrey Pines 233,523 RSF Celgene Corporation The Medicines Company Vertex Pharmaceuticals Incorporated San Diego/University Town Center 62,56 RSF San Diego/Sorrento Mesa 48,880 RSF Marketing Negotiating Juno Therapeutics, Inc. Alexandria Real Estate Equities, Inc. All Rights Reserved
45 Key Future Projects March 3, 206 (dollars in thousands) Property/Market/Submarket Alexandria Technology Square /Greater Boston/Cambridge Our Ownership Interest 00% 505 Brannan Street, Phase II/San Francisco/Mission Bay/SoMa 99.2% Grand Avenue/San Francisco/South San Francisco Various Book Value Per SF () Square Feet 7,787 00, ,695 65, ,3 397, Eccles Avenue/San Francisco/South San Francisco (4) 00% 7,655 44, East 29th Street/New York City/Manhattan 00% 420, Illumina Way/San Diego/University Town Center 00% 0, , Campus Point Drive/San Diego/University Town Center 00% 7, , /65/66 Eastlake Avenue East/Seattle/Lake Union 00% 34,75 366, Fairview Avenue East/Seattle/Lake Union 00% 8,79 88, Davis Drive/Research Triangle Park/Research Triangle Park 00% 6,49,000,000 6 Greater Boston 00% 9,28 395, San Francisco 00% 95,620 San Diego 00% 24,862 93, Maryland 00% 2, ,72 28 Research Triangle Park 00% 4,49 76, Non-cluster Markets 00% 2, , ,867 5,606,435 Other: Future value-creation projects () (4) 42 The per square foot amounts represent our investment in our real estate, including our partners share of consolidated real estate joint ventures, divided by 00% of developable square feet of the respective properties. In March 206, Verily, Alphabet Inc. s life science subsidiary, entered into a sublease with Amgen Inc. for 407,369 RSF at 249/259/269 East Grand Avenue, with potential expansion space on the two additional land parcels located adjacent to/ surrounding the recently developed campus in South San Francisco. Includes a redeemable noncontrolling interest, aggregating 37% ownership in one of our consolidated real estate joint ventures, at our 23 East Grand Avenue property aggregating 275,500 RSF. Represents an additional parcel located near our 34/343 Oyster Point Boulevard properties and within walking distance of Roche s campus in South San Francisco. Alexandria Real Estate Equities, Inc. All Rights Reserved

46 Key Future Projects (continued) March 3, 206 Alexandria Real Estate Equities, Inc. All Rights Reserved

47 Key Future Projects (continued) March 3, 206 Alexandria Real Estate Equities, Inc. All Rights Reserved
48 Projected and Historical Construction Spending March 3, 206 (Dollars in thousands) Year Ending December 3, 206 Projected Construction Spending Development and redevelopment projects 589,000 Generic laboratory infrastructure/building improvement projects 6,000 Non-revenue-enhancing capital expenditures and tenant improvements 0,000 Total construction spending for the nine months ending December 3, ,000 Actual construction spending for the three months ended March 3, ,47 Guidance range for the year ending December 3, , ,000 Three Months Ended March 3, 206 Historical Construction Spending Total construction costs () 89,47 59,950 59,50 59,950 Three Months Ended March 3, 206 Recent Average Per RSF Increase in accrued construction (29,97) Total construction spending (cash basis) Additions to real estate Investments in unconsolidated real estate joint ventures 449 Total construction spending (cash basis) () Includes revenue-enhancing projects and non-revenue-enhancing capital expenditures shown in the table below. Non-Revenue-Enhancing Capital Expenditures, Tenant Improvements, and Leasing Costs () Non-revenue-enhancing capital expenditures Amount RSF Per RSF 2,38 6,845, ,093 08, ,353 2,475 28,342 Tenant improvements and leasing costs: Re-tenanted space Renewal space Total tenant improvements and leasing costs/weighted average () Excludes amounts that are recoverable from tenants, revenue-enhancing, or related to properties that have undergone redevelopment. Represents the average of 202 through 205 and three months ended March 3, 206, annualized. Alexandria Real Estate Equities, Inc. All Rights Reserved
49 Pro Rata Operating Information March 3, 206 (Dollars in thousands) Three Months Ended March 3, 206 Noncontrolling Share of Consolidated JVs Consolidated Total revenues Rental operations 26,089 (8,90) Our Share of Unconsolidated JVs,855 Our Total Share 209,754 65,837 (2,35) ,489 50,252 (6,055),068 45,265 General and administrative 5,88 (22) 36 5,202 Interest 24, ,54 Depreciation and amortization 70, ,308 Expenses: Impairment of real estate (2,30) 28,980 39,889 Equity in loss from unconsolidated real estate joint ventures (2,323) (397) Net income Net income attributable to noncontrolling interests Net income attributable to Alexandria Real Estate Equities, Inc. 28,980,465 39, ,234 9,966 (3,732) (4,030) 3,732 (298) 5,936 5,936 Dividends on preferred stock (5,907) (5,907) Preferred stock redemption charge (3,046) (3,046) (80) (80) Net income attributable to unvested restricted stock awards Net loss attributable to Alexandria's common stockholders () (3,88) () (3,88) Represents net income attributable to redeemable noncontrolling interests. These redeemable interests earn a fixed preferred return of 8.4% rather than a variable return based upon their ownership percentage of the joint venture. Consequently, these interests are excluded from our pro rata calculation. Alexandria Real Estate Equities, Inc. All Rights Reserved
50 Pro Rata Balance Sheet Information March 3, 206 (Dollars in thousands) March 3, 206 Noncontrolling Share of Consolidated JVs Consolidated Investments in real estate 7,74,466 Investments in unconsolidated real estate joint ventures 27,65 Cash and cash equivalents 46,97 Other assets Secured notes payable () 86,578 3,274,92 Total liabilities Redeemable noncontrolling interests Alexandria s stockholders equity Total liabilities and equity () 3,38 40,627 8,28 945,44 55,942 8,685,632 49, ,063 3,274,92 6, ,928 4,784,24 (20,27) 55,942 4,89,92 4,28 (4,28) 3,865,720 (307,353) 4,73,073 7,599,86 (20,27) 307,353 Total equity Our Total Share 692,742 3,865,720 Noncontrolling interests (34,842) 7,57 (27,65) (9,778) 8,97,532 Other liabilities () (33,76) (8,888) 956,704 Total assets Unsecured debt Our Share of Unconsolidated JVs 8,97,532 (307,353) (34,842) 55,942 3,865,720 8,685,632 Includes unamortized deferred financing costs. Alexandria Real Estate Equities, Inc. All Rights Reserved
51 Consolidated Joint Ventures Pro Rata Operating Information March 3, 206 (Dollars in thousands) Three Months Ended March 3, 206 Consolidated Real Estate Joint Ventures at 00% 225 Binney Street Total revenues 500 Owens Street 3,937 Rental operations 409/499 Illinois Street 3,047 9,670 Various Total 730 7, , ,00 3,322 2,062 6, ,284 Expenses: General and administrative Interest Depreciation and amortization Net income (loss) 976 2, ,332 3,054 3, (427) 5,2 6,940 NCI Share of Amounts Above () Total revenues Rental operations 225 Binney Street 500 Owens Street 409/499 Illinois Street 70% 49.9% 40% 2,756,52 Various 3,868 Total 45 8, , ,35 2,326,029 2,700 6,055 General and administrative Interest Expenses: Depreciation and amortization Net income (loss) () 684, ,222,476 3 (5) 2,30 3,732 Represents our partners share of operating results from consolidated real estate joint ventures. Excludes net income attributable to redeemable noncontrolling interests, aggregating 298 thousand. These redeemable interests earn a fixed preferred return of 8.4% rather than a variable return based upon their ownership percentage of the joint venture. Consequently, these interests are excluded from our pro rata calculation. Alexandria Real Estate Equities, Inc. All Rights Reserved
52 Consolidated Joint Ventures Pro Rata Balance Sheet Information March 3, 206 (Dollars in thousands) March 3, 206 Consolidated Real Estate Joint Ventures at 00% 225 Binney Street Investments in real estate 500 Owens Street 62, /499 Illinois Street 82,2 360,224 Various Total 20, ,57 Cash and cash equivalents 4,956 3,077 9,234 4,286 2,553 Other assets 6,968 6,376 23,820 0,53 47,37 Total assets Secured notes payable 74,408 Other liabilities Total liabilities Total liabilities and equity 393,278 35,8 794,44,288 29,3 0,395 54,866 3,872,288 29,3 0,395 54,866 4,28 70,536 3,872 Redeemable noncontrolling interests Total equity 9,574 74,408 80,286 9, , ,278 () 4,28 0, ,357 35,8 794,44 NCI Share of Amounts Above Investments in real estate Cash and cash equivalents Secured notes payable 3,739 40,979,536 4,878 Various 44,089 3,693 3,80 Total 4, ,529 33,76 8,888 2,9 9,778 45,695 57,3 6,750 34,842 Redeemable noncontrolling interests Total equity 40% 22,086 Total liabilities () 409/499 Illinois Street 49.9% Other liabilities Total liabilities and equity 500 Owens Street 70% 3,469 Other assets Total assets 225 Binney Street 2,7 5,632, ,27 2,7 5,632, ,27 4,28 9,375 40,063 45,587 2,328 22,086 45,695 57,3 6,750 () 4,28 307,353 34,842 Represents redeemable noncontrolling interests aggregating approximately 37% ownership in one of our consolidated real estate joint ventures. Excluding this entity, the remaining real estate joint venture partners have approximately 3% ownership in the various consolidated real estate joint ventures. Represents our partners share of balance sheet amounts from consolidated real estate joint ventures. Alexandria Real Estate Equities, Inc. All Rights Reserved
53 Unconsolidated Joint Ventures Pro Rata Operating Information March 3, 206 (Dollars in thousands) Three Months Ended March 3, 206 Unconsolidated Real Estate JVs at 00% 360 Longwood Avenue Total revenue 455/55 Third Street 6,253 Rental operations Total 6,364 2, ,687 3,770 (93) 3,677 Expenses: General and administrative Interest 2,495 2,495 Depreciation and amortization,668 32,800 Net loss (520) (225) (745) Our Share of Amounts Above Total revenue Rental operations 360 Longwood Avenue 455/55 Third Street 27.5% 5%,799 () 683 Total 56 04,6, (48),068 Expenses: General and administrative Interest Depreciation and amortization Net loss () (282) 67 (5) 743 (397) Includes property management fees earned by us. Alexandria Real Estate Equities, Inc. All Rights Reserved
54 Unconsolidated Joint Ventures Pro Rata Balance Sheet Information March 3, 206 (Dollars in thousands) March 3, 206 Unconsolidated Real Estate Joint Ventures at 00% 360 Longwood Avenue Investments in real estate Cash and cash equivalents Other assets Total assets Secured notes payable () 453,673 0,008 2,506 22,54 79,954 47, ,95 79,954 0,039 6,59 6,98 89,993 6,59 96,52 48,300 Total 2,402 Total equity 42,994 7, ,293 Total liabilities 20,008 Other liabilities Total liabilities and equity 455/55 Third Street 30,679 4, ,293 47, , ,95 Our Share of Amounts Above Investments in real estate Cash and cash equivalents Secured notes payable () 49,485 Total 77,522,225 6,70 Total equity 94,049 02,843 Total liabilities () 5% Other liabilities Total liabilities and equity 455/55 Third Street 27.5% 2,093 Other assets Total assets 360 Longwood Avenue 3,38,57 7,57 8,28 80,264 83,07 49,485 3,24 3,26 6,457 52,726 3,26 55,942 50,7 77,048 27,65 02,843 80,264 83,07 Includes unamortized deferred financing costs. Represents a non-recourse, secured construction loan with aggregate commitments of 23.2 million, of which 75.2 million bears interest at a fixed rate of 5.25% and 38.0 million bears interest at a floating rate of LIBOR+3.75%, with a floor of 5.25%. Borrowings under the floating rate tranche are subject to an interest rate cap on LIBOR of 3.50%. The maturity date of the loan is April, 207, with two, one-year options to extend the stated maturity date to April, 209, subject to certain conditions. The amount of 80.0 million classified as secured note payable as of March 3, 206, consists of 80.4 million of face value of the secured note payable net of 470 thousand of unamortized deferred financing costs. Amounts include costs incurred directly by us outside of the real estate joint ventures. Alexandria Real Estate Equities, Inc. All Rights Reserved
55 Real Estate Investments in Asia March 3, 206 (Dollars in thousands) In March 206, we recognized an impairment charge of 29.0 million for two land parcels in India that met the criteria for classification as held for sale. As of March 3, 206, we only had one binding sale agreement related to one land parcel. This land parcel was sold on May 2, 206, at a sales price of 7.5 million with no gain or loss. On April 22, 206, our Board of Directors approved the monetization of our remaining real estate investments in Asia in order to invest capital into our highly leased value-creation pipeline. As a result of this decision, we recognized an aggregate impairment charge of 53.0 million to reduce our net book value to fair value less cost to sell for all of our remaining investments in Asia. We believe our real estate investments in Asia will be monetized in several separate transactions over the next 2 months. The following is a summary of net assets and operating information of our real estate investments in Asia, including: (i) two land parcels aggregating 28 acres that were classified as held for sale as of March 3, 206, and (ii) eight operating properties aggregating.2 million RSF and land parcels aggregating 68 acres that met the criteria for classification as held for sale in late April 206 (in thousands): March 3, 206 Balance Sheet Information Total assets Total liabilities Total accumulated other comprehensive loss (2,866) () 49,787 Net assets as of March 3, ,345 Impairment recognized in April 206 Net assets after impairment recognized in April 206 (52,968) 04,377 Three Months Ended March 3, 206 Operating Information Total revenues 220,424 Operating expenses 3,29 (2,588) 63 General and administrative expense (684) (53) Depreciation expense (2,248) Impairment of real estate Net loss () (28,980) (3,28) Represents the cumulative foreign currency translation losses of 52.6 million and gains of.8 million related to our investments located in our India and China submarkets, respectively, that will be reclassified to net income only when realized upon sale or disposition. This amount includes a 29.0 million impairment charge we recognized in March 206 for two land parcels that met the criteria for classification as held for sale. The estimated sales price of these two land parcels is approximately.9 million. Represents estimated sales price of 3.0 million less costs to sell. Alexandria Real Estate Equities, Inc. All Rights Reserved
 Investment Type Public Cost Net Unrealized Gains 22,237 63,50 Tenant/Non-Tenant Mix")

56 Non-Real Estate Investments March 3, 206 (Dollars in thousands) Public/Private Investment Mix (Cost) Investment Type Public Cost Net Unrealized Gains 22,237 63,50 Tenant/Non-Tenant Mix (Cost) Number of Investments Total 85, Average Size of Investment Private Total 230, ,03 N/A 230,776 63,50 36,63.3M Alexandria Real Estate Equities, Inc. All Rights Reserved


57 Key Credit Metrics March 3, 206 Net Debt to Adjusted EBITDA () Liquidity 2B (in millions) Availability under our.5 billion unsecured senior line of credit, ,998 Remaining construction loan commitments Available-for-sale equity securities, at fair value Cash and cash equivalents Fixed Charge Coverage Ratio () Unencumbered NOI 8% () Quarter annualized. This amount includes remaining commitments available for borrowing aggregating million related to existing construction loans as of March 3, 206, and additional available construction loan commitments of million on a secured construction loan that we closed in April 206. This excludes 7.2 million of remaining commitments that were extinguished upon the repayment in April 206 of the outstanding 47.8 million balance of one construction loan. For the three months ended March 3, 206. Alexandria Real Estate Equities, Inc. All Rights Reserved

58 Summary of Debt March 3, 206 Debt maturities chart (Dollars in millions) () We have a one-year option to extend the stated maturity date of one secured note payable, aggregating 88. million, to August 23, 208, subject to certain conditions. Fixed-rate/hedged and unhedged variable-rate debt Weighted-Average (Dollars in thousands) Secured notes payable Fixed-Rate/Hedged Variable-Rate Debt Unsecured senior notes payable 359,935 Total Unhedged Variable-Rate Debt 456,643 Consolidated () 86, % , , % 5.2 2,03,284.5 billion unsecured senior line of credit 50,000 49, Unsecured Senior Bank Term Loan 597,035 Percentage of total debt () 347,602 3,485,856 85% 605,643 5% 347,602 Remaining Term (in years) 49.6 Total/weighted average Interest Rate 20.0% 2,03, Unsecured Senior Bank Term Loan Percentage 4,09,499 % 00% See footnote on page 9. Represents the weighted-average interest rate as of the end of the period plus the impact of debt premiums/discounts, interest rate swap agreements, and deferred financing costs. Alexandria Real Estate Equities, Inc. All Rights Reserved
(1) See Definitions and Reconciliations in our Supplemental Information. As of December 31, 2017, annual rental revenue from investment-grade tenants
 See Definitions and Reconciliations in our Supplemental Information. As of December 31, 2017, annual rental revenue from investment-grade tenants") Alexandria Real Estate Equities, Inc. All Rights Reserved. 208 Alexandria Real Estate Equities, Inc. All Rights Reserved. 208 i () See Definitions and Reconciliations in our Supplemental Information. As
Alexandria Real Estate Equities, Inc. All Rights Reserved. 208 Alexandria Real Estate Equities, Inc. All Rights Reserved. 208 i () See Definitions and Reconciliations in our Supplemental Information. As
Highwoods Reports Third Quarter 2017 Results
 FOR IMMEDIATE RELEASE Ref: 17-20 Contact: Brendan Maiorana Senior Vice President, Finance and Investor Relations 919-431-1529 Highwoods Reports Third Quarter 2017 Results $0.55 Net Income per Share $0.86
2014 Operating and Financial Highlights
 FINANCIAL HIGHLIGHTS > 2014 Operating and Financial Highlights Operating Results Executed 203 leasing transactions representing approximately 2.8 million square feet, the highest gross leasing volume in
Achieved record annual revenues of $110.0 million for 2018, representing an increase of 5.8%
 Clipper Realty Inc. Announces Fourth Quarter and Full-Year 2018 Results Reports Record Annual Revenues, Record Annual Income from Operations and Record Quarterly and Annual Adjusted Funds from Operations
Senior Housing Properties Trust Announces Fourth Quarter and Year End 2017 Results
 Senior Housing Properties Trust NEWS RELEASE Senior Housing Properties Trust Announces Fourth Quarter and Year End 2017 Results 2/27/2018 NEWTON, Mass.--(BUSINESS WIRE)-- Senior Housing Properties Trust
Highwoods Reports Third Quarter 2015 Results
 FOR IMMEDIATE RELEASE Ref: 15-22 Contact: Mark Mulhern Senior Vice President and Chief Financial Officer 919-875-6682 Reports Third Quarter 2015 Results $0.77 FFO per Share (Including $0.01 per Share of
Highwoods Reports Second Quarter 2018 Results
 FOR IMMEDIATE RELEASE Ref: 18-14 Contact: Brendan Maiorana Senior Vice President, Finance and Investor Relations 919-431-1529 Highwoods Reports Second Quarter 2018 Results $0.49 Net Income per Share $0.87
FIRST INDUSTRIAL REALTY TRUST REPORTS FIRST QUARTER 2018 RESULTS
 First Industrial Realty Trust, Inc. 311 South Wacker Drive Suite 3900 Chicago, IL 60606 312/344-4300 FAX: 312/922-9851 MEDIA RELEASE FIRST INDUSTRIAL REALTY TRUST REPORTS FIRST QUARTER 2018 RESULTS Occupancy
Clipper Realty Inc. Announces Third Quarter 2018 Results Reports Record Revenues, Income From Operations and Adjusted Funds From Operations
 Clipper Realty Inc. Announces Third Quarter 2018 Results Reports Record Revenues, Income From Operations and Adjusted Funds From Operations NEW YORK, November 1, 2018 /Business Wire/ -- Clipper Realty
Highwoods Reports Third Quarter 2018 Results
 FOR IMMEDIATE RELEASE Ref: 18-18 Contact: Brendan Maiorana Senior Vice President, Finance and Investor Relations 919-431-1529 Highwoods Reports Third Quarter 2018 Results $0.32 Net Income per Share $0.86
STAG INDUSTRIAL ANNOUNCES SECOND QUARTER 2018 RESULTS
 STAG INDUSTRIAL ANNOUNCES SECOND QUARTER 2018 RESULTS Boston, MA July 31, 2018 - STAG Industrial, Inc. (the Company ) (NYSE:STAG), today announced its financial and operating results for the quarter ended
Select Income REIT Announces Third Quarter 2017 Results
 FOR IMMEDIATE RELEASE Contact: Christopher Ranjitkar, Director, Investor Relations (617) 796-8320 Select Income REIT Announces Third Quarter 2017 Results Third Quarter Net Income of $0.35 Per Share Third
PS Business Parks, Inc. Reports Results for the Quarter Ended March 31, 2017
 News Release PS Business Parks, Inc. 701 Western Avenue Glendale, CA 91201-2349 psbusinessparks.com For Release: Immediately Date: April 25, 2017 Contact: Edward A. Stokx (818) 244-8080, Ext. 1649 PS Business
FOR IMMEDIATE RELEASE
 FOR IMMEDIATE RELEASE GLOBAL NET LEASE ANNOUNCES OPERATING RESULTS FOR SECOND QUARTER 2018 New York, August 8, 2018 Global Net Lease, Inc. (NYSE: GNL) ( GNL or the Company ), a real estate investment trust
Retail Opportunity Investments Corp. Reports Strong First Quarter Results & Raises FFO Guidance
 April 27, 2016 Retail Opportunity Investments Corp. Reports Strong First Quarter Results & Raises FFO Guidance $17.4% increase in FFO Per Diluted Share 7.6% Increase in Same-Center Cash Net Operating Income
FOR IMMEDIATE RELEASE
 FOR IMMEDIATE RELEASE American Finance Trust Announces Second Quarter Operating Results New York, August 9, - American Finance Trust, Inc. (Nasdaq: AFIN) ( AFIN or the Company ), a real estate investment
WP Glimcher Reports Second Quarter 2016 Results
 NEWS RELEASE WP Glimcher Reports Second Quarter 2016 Results COLUMBUS, OH August 3, 2016 WP Glimcher Inc. (NYSE: WPG) today reported financial and operating results for the second quarter ended June 30,
FOR IMMEDIATE RELEASE
 FOR IMMEDIATE RELEASE GLOBAL NET LEASE ANNOUNCES OPERATING RESULTS FOR THIRD QUARTER 2018 New York, November 7, 2018 Global Net Lease, Inc. (NYSE: GNL) ( GNL or the Company ), a real estate investment
Carter Validus Mission Critical REIT, Inc. Reports Second Quarter 2016 Results
 Carter Validus Mission Critical REIT, Inc. Reports Second Quarter 2016 Results TAMPA, FL (September 1, 2016) - Carter Validus Mission Critical REIT, Inc. (the Company ) announced today its operating results
Public Storage Reports Results for the Quarter Ended March 31, 2017
 News Release Public Storage 701 Western Avenue Glendale, CA 91201-2349 www.publicstorage.com For Release Immediately Date April 26, 2017 Contact Clemente Teng (818) 244-8080, Ext. 1141 Public Storage Reports
Highwoods Properties Reports Fourth Quarter and Full Year 2011 Results
 FOR IMMEDIATE RELEASE Ref: 12-06 Contact: Tabitha Zane Vice President, Investor Relations 919-431-1529 Highwoods Properties Reports Fourth Quarter and Full Year 2011 Results $0.70 FFO per Share for Fourth
Extra Space Storage Inc. Reports 2017 Fourth Quarter and Year-End Results
 Extra Space Storage Inc. Reports 2017 Fourth Quarter and Year-End Results February 20, 2018 SALT LAKE CITY, Feb. 20, 2018 /PRNewswire/ -- Extra Space Storage Inc. (NYSE: EXR) (the "Company"), a leading
Extra Space Storage Inc. Reports 2018 Fourth Quarter and Year-End Results
 Extra Space Storage Inc. Reports 2018 Fourth Quarter and Year-End Results February 20, 2019 SALT LAKE CITY, Feb. 20, 2019 /PRNewswire/ -- Extra Space Storage Inc. (NYSE: EXR) (the "Company"), a leading
Definitions. CPI is a lease in which base rent is adjusted based on changes in a consumer price index.
 Annualized Rental Income is rental revenue under our leases on Operating Properties on a straight-line basis, which includes the effect of rent escalations and any tenant concessions, such as free rent,
FOR IMMEDIATE RELEASE CONTACT: John Bucksbaum 312/ General Growth Properties, Inc. Reports Operating Results for the Third Quarter 2005
 News Release General Growth Properties, Inc. 110 North Wacker Drive Chicago, IL 60606 (312) 960-5000 FAX (312) 960-5475 FOR IMMEDIATE RELEASE CONTACT: John Bucksbaum 312/960-5005 Bernie Freibaum 312/960-5252
Select Income REIT Announces Second Quarter 2016 Results
 FOR IMMEDIATE RELEASE Contact: Christopher Ranjitkar, Director, Investor Relations (617) 796-8320 Select Income REIT Announces Second Quarter 2016 Results Second Quarter Net Income of $0.34 Per Share Second
EARNINGS PRESS RELEASE AND SUPPLEMENTAL INFORMATION
 EARNINGS PRESS RELEASE AND SUPPLEMENTAL INFORMATION First Quarter Ended Conference Call Information: Wednesday, May 2, 2012 3:00 p.m. Eastern Time / 12:00 p.m. Pacific Time Number: (800) 901-5241 or (617)
Front Yard Residential Corporation Reports Third Quarter 2018 Results
 Front Yard Residential Corporation Reports Third Quarter 2018 Results November 7, 2018 CHRISTIANSTED, U.S. Virgin Islands, Nov. 07, 2018 (GLOBE NEWSWIRE) -- Front Yard Residential Corporation ( Front Yard
NON-GAAP FINANCIAL MEASURES
 NON-GAAP FINANCIAL MEASURES Welltower Inc. (HCN) believes that revenues, net operating income from continuing operations (NOICO), net income and net income attributable to common stockholders (NICS), as
FOR IMMEDIATE RELEASE AUGUST 2, 2018 ARTIS REAL ESTATE INVESTMENT TRUST RELEASES SECOND QUARTER RESULTS
 FOR IMMEDIATE RELEASE AUGUST 2, 2018 ARTIS REAL ESTATE INVESTMENT TRUST RELEASES SECOND QUARTER RESULTS Today Artis Real Estate Investment Trust ( Artis or the "REIT") issued its financial results and
Industrial Income Trust Inc.
 UNITED STATES SECURITIES AND EXCHANGE COMMISSION Washington, D.C. 20549 FORM 8-K CURRENT REPORT Pursuant to Section 13 or 15(d) of The Securities Exchange Act of 1934 Date of Report (Date of earliest event
Highwoods Properties Reports Third Quarter Results. $0.58 FFO per Diluted Share (Excluding Debt Extinguishment Loss and Property Acquisition Costs)
") FOR IMMEDIATE RELEASE Ref: 10-28 Contact: Tabitha Zane Vice President, Investor Relations 919-431-1529 Highwoods Properties Reports Third Quarter Results $0.58 FFO per Diluted Share (Excluding Debt Extinguishment
FOR IMMEDIATE RELEASE Ref: 10-28 Contact: Tabitha Zane Vice President, Investor Relations 919-431-1529 Highwoods Properties Reports Third Quarter Results $0.58 FFO per Diluted Share (Excluding Debt Extinguishment
Front Yard Residential Corporation Announces Transformative Acquisition and Reports Second Quarter 2018 Results
 Front Yard Residential Corporation Announces Transformative Acquisition and Reports Second Quarter 2018 Results August 9, 2018 CHRISTIANSTED, U.S. Virgin Islands, Aug. 09, 2018 (GLOBE NEWSWIRE) -- Front
Industrial Income Trust Inc.
 UNITED STATES SECURITIES AND EXCHANGE COMMISSION Washington, D.C. 20549 FORM 8-K CURRENT REPORT Pursuant to Section 13 or 15(d) of The Securities Exchange Act of 1934 Date of Report (Date of earliest event
FIRST INDUSTRIAL REALTY TRUST REPORTS FIRST QUARTER 2019 RESULTS
 First Industrial Realty Trust, Inc. 1 North Wacker Drive Suite 4200 Chicago, IL 60606 312/344-4300 MEDIA RELEASE FIRST INDUSTRIAL REALTY TRUST REPORTS FIRST QUARTER 2019 RESULTS Signed 1.8 Million Square
PS Business Parks, Inc. Reports Results for the Quarter Ended September 30, 2018
 News Release PS Business Parks, Inc. 701 Western Avenue Glendale, CA 91201-2349 psbusinessparks.com For Release: Immediately Date: October 23, 2018 Contact: Jeff Hedges (818) 244-8080, Ext. 1649 PS Business
Senior Housing Properties Trust Announces Fourth Quarter and Year End 2018 Results
 Senior Housing Properties Trust NEWS RELEASE Senior Housing Properties Trust Announces Fourth Quarter and Year End 2018 Results 3/1/2019 Fourth Quarter Net Loss Attributable to Common Shareholders of $0.50
-- Expanding relationship with Brookdale by creating a $1.2 billion CCRC joint venture and amending existing Emeritus leases
 Page 1 of 11 Print Page Close Window News Release HCP Announces Results for Quarter Ended March 31, 2014 HIGHLIGHTS -- FFO per share was $0.75; FAD per share was $0.63; and EPS was $0.56 -- Achieved year-over-year
NEWS RELEASE For immediate release
 NEWS RELEASE For immediate release Laura Clark 904 598 7831 LauraClark@RegencyCenters.com Regency Centers Reports First Quarter 2018 Results JACKSONVILLE, FL. (April 30, 2018) Regency Centers Corporation
NEWS RELEASE For immediate release
 NEWS RELEASE For immediate release Laura Clark 904 598 7831 LauraClark@RegencyCenters.com Regency Centers Reports Second Quarter 2018 Results JACKSONVILLE, FL. (August 2, 2018) Regency Centers Corporation
FOR IMMEDIATE RELEASE: Equity One Reports Fourth Quarter and Year End 2014 Operating Results
 Equity One, Inc. For additional information: 410 Park Avenue, Suite 1220 Mark Langer, EVP and New York, NY 10022 Chief Financial Officer 212-796-1760 FOR IMMEDIATE RELEASE: Equity One Reports Fourth Quarter
January 23, NEW YORK--(BUSINESS WIRE)--Jan. 23, SL Green Realty Corp. (NYSE: SLG): Financial and Operating Highlights
--Jan. 23, SL Green Realty Corp. (NYSE: SLG): Financial and Operating Highlights") SL Green Realty Corp. Reports Fourth Quarter Loss Per Share of $0.73; Full Year 2018 Earnings Per Share of $2.67; Fourth Quarter and Full Year 2018 FFO of $1.61 and $6.62 Per Share January 23, 2019 NEW
SL Green Realty Corp. Reports Fourth Quarter Loss Per Share of $0.73; Full Year 2018 Earnings Per Share of $2.67; Fourth Quarter and Full Year 2018 FFO of $1.61 and $6.62 Per Share January 23, 2019 NEW
AGREE REALTY CORPORATION REPORTS OPERATING RESULTS FOR THE SECOND QUARTER 2015
 FOR IMMEDIATE RELEASE CONTACT: Joey Agree Chief Executive Officer (248) 737-4190 AGREE REALTY CORPORATION REPORTS OPERATING RESULTS FOR THE SECOND QUARTER 2015 BLOOMFIELD HILLS, MI (July 27, 2015) - Agree
PS Business Parks, Inc. Reports Results for the Quarter Ended March 31, 2018
 News Release PS Business Parks, Inc. 701 Western Avenue Glendale, CA 91201-2349 psbusinessparks.com For Release: Immediately Date: April 24, 2018 Contact: Maria R. Hawthorne (818) 244-8080, Ext. 1370 PS
General Growth Properties, Inc.
 General Growth Properties, Inc. Supplemental Financial Information For the Three and Nine Months Ended September 30, 2009 This presentation contains forward-looking statements. Actual results may differ
UNITED STATES SECURITIES AND EXCHANGE COMMISSION Washington, D.C FORM 10-Q
 UNITED STATES SECURITIES AND EXCHANGE COMMISSION Washington, D.C. 20549 FORM 10-Q ý QUARTERLY REPORT PURSUANT TO SECTION 13 OR 15(d) OF THE SECURITIES EXCHANGE ACT OF 1934 For the Quarterly Period Ended
PS Business Parks, Inc. Reports Results for the Quarter and Year Ended December 31, 2018
 News Release PS Business Parks, Inc. 701 Western Avenue Glendale, CA 91201-2349 psbusinessparks.com For Release: Immediately Date: February 20, 2019 Contact: Jeff Hedges (818) 244-8080, Ext. 1649 PS Business
SECURITIES AND EXCHANGE COMMISSION. Washington, D.C FORM 8-K CURRENT REPORT
 SECURITIES AND EXCHANGE COMMISSION Washington, D.C. 20549 FORM 8-K CURRENT REPORT PURSUANT TO SECTION 13 OR 15(d) OF THE SECURITIES EXCHANGE ACT OF 1934 Date of Report (Date of earliest event reported):
DCT INDUSTRIAL TRUST REPORTS FOURTH QUARTER AND FULL-YEAR 2017 RESULTS. Net Earnings of $0.22 per Diluted Share in Q4; $1.11 per Diluted Share in 2017
 Press Release FOR IMMEDIATE RELEASE: DCT INDUSTRIAL TRUST REPORTS FOURTH QUARTER AND FULL-YEAR 2017 RESULTS Net Earnings of $0.22 per Diluted Share in Q4; $1.11 per Diluted Share in 2017 FFO, as adjusted,
Glendale, California - PS Business Parks, Inc. (AMEX: PSB), reported operating results for the fourth quarter and the year ending December 31, 2001.
, reported operating results for the fourth quarter and the year ending December 31, 2001.") News Release PS Business Parks, Inc. 701 Western Avenue P.O. Box 25050 Glendale, CA 91221-5050 www.psbusinessparks.com For Release: Immediately Date: January 30, 2002 Contact: Mr. Jack Corrigan (818) 244-8080,
News Release PS Business Parks, Inc. 701 Western Avenue P.O. Box 25050 Glendale, CA 91221-5050 www.psbusinessparks.com For Release: Immediately Date: January 30, 2002 Contact: Mr. Jack Corrigan (818) 244-8080,
Government Properties Income Trust Announces 2013 Fourth Quarter and Year End Results
 February 18, 2014 Government Properties Income Trust Announces 2013 Fourth Quarter and Year End Results NEWTON, Mass.--(BUSINESS WIRE)-- Government Properties Income Trust (NYSE: GOV) today announced its
Extra Space Storage Inc. Reports 2017 Third Quarter Results
 Extra Space Storage Inc. Reports 2017 Third Quarter Results November 1, 2017 SALT LAKE CITY, Nov. 1, 2017 /PRNewswire/ -- Extra Space Storage Inc. (NYSE: EXR) (the "Company"), a leading owner and operator
... ARMADA HOFFLER PROPERTIES REPORTS FOURTH QUARTER 2013 RESULTS
 PRESS RELEASE.......................................... ARMADA HOFFLER PROPERTIES REPORTS FOURTH QUARTER 2013 RESULTS Core FFO of $7.1 Million, $0.22 Per Diluted Share Operating Property Portfolio at 94.4%
NEWS RELEASE For immediate release
 NEWS RELEASE For immediate release Laura Clark 904 598 7831 LauraClark@RegencyCenters.com Regency Centers Reports Third Quarter 2018 Results Company Increases 2018 Guidance JACKSONVILLE, FL. (October 25,
SAUL CENTERS, INC Wisconsin Avenue, Suite 1500, Bethesda, Maryland (301)
") SAUL CENTERS, INC. 7501 Wisconsin Avenue, Suite 1500, Bethesda, Maryland 20814-6522 (301) 986-6200 Saul Centers, Inc. Reports Third Quarter 2017 Earnings November 2, 2017, Bethesda, MD. Saul Centers, Inc.
SAUL CENTERS, INC. 7501 Wisconsin Avenue, Suite 1500, Bethesda, Maryland 20814-6522 (301) 986-6200 Saul Centers, Inc. Reports Third Quarter 2017 Earnings November 2, 2017, Bethesda, MD. Saul Centers, Inc.
SEC Reg. G Compliance - Non-GAAP Financial Measures
 SEC Reg. G Compliance - Non-GAAP Financial Measures Funds From Operations (FFO) Reconciliation, Including Non-Cash Items 1 ($ in 000s, except per share amounts) Tentative Estimates Preliminary and Midpoint
SAUL CENTERS, INC Wisconsin Avenue, Suite 1500, Bethesda, Maryland (301)
") May 3, 2018, Bethesda, MD. SAUL CENTERS, INC. 7501 Wisconsin Avenue, Suite 1500, Bethesda, Maryland 20814-6522 (301) 986-6200 Saul Centers, Inc. Reports First Quarter 2018 Earnings Saul Centers, Inc. (NYSE:
May 3, 2018, Bethesda, MD. SAUL CENTERS, INC. 7501 Wisconsin Avenue, Suite 1500, Bethesda, Maryland 20814-6522 (301) 986-6200 Saul Centers, Inc. Reports First Quarter 2018 Earnings Saul Centers, Inc. (NYSE:
Select Income REIT Announces 2012 First Quarter Results
 Announces 2012 First Quarter Results NEWTON, Mass.--(BUSINESS WIRE)-- (NYSE: SIR) today announced financial results for the quarter ended March 31, 2012. SIR was formed on December 19, 2011 as a wholly
Table of Contents Page
 Table of Contents Page Page Company, Common Stock, and Earnings Call Information 1 Debt Information Definitions 2-3 Debt Maturities 20 Financial Information Unsecured Public Debt Covenants 21 Balance Sheets
SUPPLEMENTAL INFORMATION
 SUPPLEMENTAL INFORMATION UNAUDITED FOURTH QUARTER 2018 STAG SUPPLEMENTAL INFORMATION FOURTH QUARTER 2018 1 Forward-Looking Statements This supplemental information package contains certain forward-looking
UNITED STATES SECURITIES AND EXCHANGE COMMISSION FORM 8-K GOVERNMENT PROPERTIES INCOME TRUST
 UNITED STATES SECURITIES AND EXCHANGE COMMISSION WASHINGTON, D.C. 20549 FORM 8-K CURRENT REPORT PURSUANT TO SECTION 13 OR 15(d) OF THE SECURITIES EXCHANGE ACT OF 1934 Date of Report (Date of earliest event
Select Income REIT Announces Second Quarter Results
 July 28, 2014 Announces Second Quarter Results Generates Normalized FFO of $0.72 Per Share Increases Rental Rates for New and Renewal Leases by 21% and Hawaii Rent Resets by 30.9% Increases Occupancy to
PRIMARIS RETAIL REIT Announces Third Quarter Results
 PRIMARIS RETAIL REIT Announces Third Quarter Results Toronto (Ontario) November 8, 2011 Primaris Retail REIT (TSX:PMZ.UN) is pleased to report positive operating results for the third quarter of 2011.
SMARTCENTRES REAL ESTATE INVESTMENT TRUST RELEASES SECOND QUARTER RESULTS FOR 2018 AND ANNOUNCES DISTRIBUTION INCREASE
 SMARTCENTRES REAL ESTATE INVESTMENT TRUST RELEASES SECOND QUARTER RESULTS FOR 2018 AND ANNOUNCES DISTRIBUTION INCREASE TORONTO, ONTARIO - (August 9, 2018) SmartCentres Real Estate Investment Trust ("SmartCentres"
Government Properties Income Trust Announces 2013 Second Quarter Results
 July 31, 2013 Government Properties Income Trust Announces 2013 Second Quarter Results NEWTON, Mass.--(BUSINESS WIRE)-- Government Properties Income Trust (NYSE: GOV) today announced its financial results
FORM 8-K TAUBMAN CENTERS, INC.
 UNITED STATES SECURITIES AND EXCHANGE COMMISSION Washington, D.C. 20549 FORM 8-K Current Report Pursuant to Section 13 or 15(d) of the Securities Exchange Act of 1934 Date of report (date of earliest event
CONSOLIDATED FINANCIAL STATEMENTS
 CONSOLIDATED FINANCIAL STATEMENTS Dundee Real Estate Investment Trust Consolidated Balance Sheets (unaudited) June 30, December 31, (in thousands of dollars) Note 2004 2003 Assets Rental properties 3,4
Strategic Storage Growth Trust, Inc. Reports 2018 Third Quarter Results
 FOR IMMEDIATE RELEASE Contacts Julie Leber Damon Elder Spotlight Marketing Communications Spotlight Marketing Communications 949.427.1391 949.427.1377 julie@spotlightmarcom.com damon@spotlightmarcom.com
SAUL CENTERS, INC Wisconsin Avenue, Suite 1500, Bethesda, Maryland (301)
") SAUL CENTERS, INC. 7501 Wisconsin Avenue, Suite 1500, Bethesda, Maryland 20814-6522 (301) 986-6200 Saul Centers, Inc. Reports Third Quarter 2016 Earnings November 1, 2016, Bethesda, MD. Saul Centers, Inc.
SAUL CENTERS, INC. 7501 Wisconsin Avenue, Suite 1500, Bethesda, Maryland 20814-6522 (301) 986-6200 Saul Centers, Inc. Reports Third Quarter 2016 Earnings November 1, 2016, Bethesda, MD. Saul Centers, Inc.
TAUBMAN CENTERS ISSUES STRONG FIRST QUARTER RESULTS
 Taubman Centers, Inc. 200 East Long Lake Road Suite 300 Bloomfield Hills, Michigan 48304-2324 T 248.258.6800 www.taubman.com TAUBMAN CENTERS ISSUES STRONG FIRST QUARTER RESULTS - Comparable Center Net
EastGroup Properties Announces Second Quarter 2018 Results
 EastGroup Properties Announces Second Quarter 2018 Results Contact: Marshall Loeb, President and CEO Brent Wood, CFO (601) 354-3555 Net Income Attributable to Common Stockholders of $.52 Per Share Compared
CHOICE PROPERTIES REAL ESTATE INVESTMENT TRUST. Management s Discussion and Analysis of Financial Condition and Results of Operations
 CHOICE PROPERTIES REAL ESTATE INVESTMENT TRUST Management s Discussion and Analysis of Financial Condition and Results of Operations (in thousands of Canadian dollars except where otherwise indicated)
Investor Presentation September 2017
 Investor Presentation September 2017 1 Table of Contents Company Overview & 2017 Guidance 3 6 Multifamily Fundamentals 7 11 Camden s Portfolio 12 22 Real Estate Transactions 23 29 Capital Structure & Liquidity
EARNINGS PRESS RELEASE AND SUPPLEMENTAL INFORMATION
 EARNINGS PRESS RELEASE AND SUPPLEMENTAL INFORMATION Fourth Quarter and Year Ended Conference Call Information: Thursday, February 7, 2013 3:00 p.m. Eastern Time / 12:00 p.m. Pacific Time Number: (866)
SAUL CENTERS, INC Wisconsin Avenue, Suite 1500, Bethesda, Maryland (301)
") SAUL CENTERS, INC. 7501 Wisconsin Avenue, Suite 1500, Bethesda, Maryland 20814-6522 (301) 986-6200 October 29, 2015, Bethesda, MD. Saul Centers, Inc. Reports Third Quarter 2015 Earnings Saul Centers, Inc.
SAUL CENTERS, INC. 7501 Wisconsin Avenue, Suite 1500, Bethesda, Maryland 20814-6522 (301) 986-6200 October 29, 2015, Bethesda, MD. Saul Centers, Inc. Reports Third Quarter 2015 Earnings Saul Centers, Inc.
AGREE REALTY CORPORATION REPORTS OPERATING RESULTS FOR THE FOURTH QUARTER AND FULL YEAR 2014
 FOR IMMEDIATE RELEASE CONTACT: Brian Dickman Chief Financial Officer (248) 737-4190 AGREE REALTY CORPORATION REPORTS OPERATING RESULTS FOR THE FOURTH QUARTER AND FULL YEAR 2014 BLOOMFIELD HILLS, MI (February
General Growth Properties, Inc.
 General Growth Properties, Inc. Supplemental Financial Information For the Three and Twelve Months Ended December 31, 2008 This presentation contains forward-looking statements. Actual results may differ
4th Quarter Quarterly Supplemental
 Quarterly Supplemental 4th Quarter 2017 The Hub Hillcrest Market San Diego, CA Aventura Shopping Center Aventura, FL 4S Commons Town San Diego, CA Investor Relations irinfo@regencycenters.com One Independent
Investor Presentation November 2017
 Investor Presentation November 2017 1 Table of Contents Company Overview & 2017 Highlights 3 6 Multifamily Fundamentals 7 11 Camden s Portfolio 12 22 Real Estate Transactions 23 29 Capital Structure &
Supplemental information provided by
 Supplemental information provided by Quarterly Supplemental 2nd Quarter 2015 Persimmon Place Grand Opening Dublin, CA Investor Relations irinfo@regencycenters.com One Independent Drive, Suite 114 Jacksonville,
Supplemental Financial Information. For the Three and Twelve months Ended December 31, 2011
 For the Three and Twelve months Ended 2011 2901 Butterfield Road Oak Brook, Illinois 60523 Telephone: (630) 218-8000 Facsimile: (630) 218-7357 www.inlandrealestate.com For the Three and Twelve months Ended
RESI Update 4 th Quarter 2016
 RESI Update 4 th Quarter 2016 Supplemental Investor Information George Ellison, CEO Robin Lowe, CFO 2017 Altisource Residential Corporation. All rights reserved. Forward Looking Statements This presentation
Supplemental Information September 30, 2017
 Conference Call 888-632-3384 ID - EastGroup October 20, 2017 11:00 a.m. Eastern Daylight Time webcast available at www.eastgroup.net Supplemental Information September 30, 2017 Steele Creek Commerce Park
Government Properties Income Trust Acquisition of First Potomac Realty Trust June 2017
 First Potomac Realty Trust property 11 Dupont Street NW, Washington, DC Square Feet: 150,805 Government Properties Income Trust Acquisition of First Potomac Realty Trust June 2017 Disclaimer. THIS PRESENTATION
UNITED STATES SECURITIES AND EXCHANGE COMMISSION Washington, DC FORM 8-K/A
 UNITED STATES SECURITIES AND EXCHANGE COMMISSION Washington, DC 20549 FORM 8-K/A CURRENT REPORT Pursuant to Section 13 or 15(d) of The Securities Exchange Act of 1934 Date of Report (Date of earliest event
Supplemental Information December 31, 2017
 Conference Call 888-632-3384 ID - EastGroup February 1, 2018 11:00 a.m. Eastern Standard Time webcast available at www.eastgroup.net Supplemental Information December 31, 2017 Alamo Ridge Business Park
Supplemental information provided by
 Supplemental information provided by Crossroad Commons Boulder, CO Quarterly Supplemental 3rd Quarter 2016 Investor Relations irinfo@regencycenters.com One Independent Drive, Suite 114 Jacksonville, FL
OPTIBASE LTD. ANNOUNCES THIRD QUARTER RESULTS
 Media Contacts: Amir Philips, CEO, Optibase Ltd. 011-972-73-7073-700 info@optibase-holdings.com Investor Relations Contact: Marybeth Csaby, for Optibase +1-917-664-3055 Marybeth.Csaby@gmail.com OPTIBASE
News Release. PS Business Parks, Inc. 701 Western Avenue P.O. Box Glendale, CA
 News Release PS Business Parks, Inc. 701 Western Avenue P.O. Box 25050 Glendale, CA 91221-5050 www.psbusinessparks.com For Release: Immediately Date: May 3, 2001 Contact: Mr. Jack Corrigan (818) 244-8080,
FIRST QUARTER Supplemental Operating and Financial Data. Camden Sotelo - Tempe, AZ
 FIRST QUARTER 2014 Supplemental Operating and Financial Data Camden Sotelo - Tempe, AZ Camden Las Olas - Ft. Lauderdale, FL Year Built - 2004 420 Apartment Homes 97% Average 1st Quarter 2014 Occupancy
Conference Call ID EastGroup October 19, :00 a.m. Eastern Time webcast available at EastGroup.net
 Table of Contents 2018 THIRD QUARTER Conference Call 877-876-9176 ID EastGroup October 19, 2018 11:00 a.m. Eastern Time webcast available at EastGroup.net Supplemental Information 2018 400 W. Parkway Place,
UDR Second Quarter 2011 Earnings Supplement
 Second Quarter 2011 Earnings Supplement Clockwise from left: Rivergate, 21 Chelsea Chelsea 21 Manhattan; View 14 Washington, D.C., Inc. (NYSE: ), has a demonstrated history of delivering superior and dependable
May 10, 2016 Halifax, Nova Scotia KILLAM APARTMENT REIT ANNOUNCES 20% INCREASE IN FFO PER UNIT IN Q1 2016
 May 10, 2016 Halifax, Nova Scotia KILLAM APARTMENT REIT ANNOUNCES 20% INCREASE IN FFO PER UNIT IN Q1 2016 Killam Apartment REIT (TSX: KMP.UN) ("Killam") is pleased to report its Q1 2016 results, including
Financial Supplement Table of Contents Fourth Quarter 2017
 Table of Contents Fourth Quarter 2017 Overview PAGE Corporate Information 3 Ownership Structure 5 Key Quarterly Financial Data 6 Consolidated Statements of Operations Earnings Release 8 2018 Outlook 11
Supplemental Information. December 31, 2009
 Supplemental Information December 31, 2009 Page Page Company, Product and Investor Information 1-5 Tenant Industry Profile & Largest Tenants Summary 22 Financial Information Same Property Performance 23
MANAGEMENT PRESENTATION. November 7, 2017
 MANAGEMENT PRESENTATION November 7, 2017 DISCLAIMER This presentation includes time-sensitive information that may be accurate only as of today s date, November 7, 2017. Estimates of future net income
DREAM GLOBAL ANNOUNCES FOURTH QUARTER RESULTS, 24% ANNUAL NET ASSET VALUE GROWTH AND OVER 6% FOURTH QUARTER COMPARATIVE NOI GROWTH
 DREAM GLOBAL ANNOUNCES FOURTH QUARTER RESULTS, 24% ANNUAL NET ASSET VALUE GROWTH AND OVER 6% FOURTH QUARTER COMPARATIVE NOI GROWTH TORONTO, FEBRUARY 20, 2019 DREAM GLOBAL REIT (TSX:DRG.UN, FRA:DRG) (or
3rd Quarter Quarterly Supplemental
 Quarterly Supplemental 3rd Quarter 2018 Mkt at Springwoods Village Spring, TX Calhoun Commons Minneapolis, MN Mellody Farm Vernon Hills, IL El Camino Shopping Center Woodland Hills, CA Mellody Farm Vernon
Listed on the New York Stock Exchange (KIM)
") Kimco Realty Reports Third Quarter 2017 Results Solid Operating Performance Leads Board to Approve Increase in Common Stock Dividend; Company Adds a New Signature Series Asset with the Acquisition of Whittwood
Kimco Realty Reports Third Quarter 2017 Results Solid Operating Performance Leads Board to Approve Increase in Common Stock Dividend; Company Adds a New Signature Series Asset with the Acquisition of Whittwood
Our Objectives. Our Strategy
 2005 Third Quarter Report» Management s Discussion and Analysis Management s Discussion and Analysis This Management s Discussion and Analysis has been dated as at November 3, 2005. All dollar amounts