RACEWAY RESIDENTIAL. A Highest and Best Use Analysis BY Brendan Callahan
|
|
|
- Alan Adams
- 6 years ago
- Views:
Transcription


1 RACEWAY RESIDENTIAL A Highest and Best Use Analysis BY Brendan Callahan JHU Practicum in Real Estate Development Professor David Sislen Spring 2009
2 TABLE OF CONTENTS I. PROJECT PROPOSAL 1 II. SITE AND CURRENT USE 2 III. DEMOGRAPHICS AND SOCIO-ECONOMIC INDICATORS 5 IV. DEVELOPMENT POTENTIAL 13 V. HIGHEST AND BEST USE ANALYSIS 21 VI. MARKET ANALYSIS 28 VII. RISK ANALYSIS 30 VIII. CONCLUSIONS/RECOMMENDATIONS 32 IX. REFERENCES 34 TABS: 1. PROFORMAS 2. MAPS 3. SITE PICTURES 4. RESIDENTIAL ZONING DISTRICTS 5. RENT COMPARABLES 6. SALES COMPARABLES 7. PIPELINE 8. APPENDIX: Parcel Owners and Tax Information
3 I. PROJECT PROPOSAL The Crofton Go-Kart Raceway located in Gambrills, MD is one of the last remaining parcels of land along the Route 3 corridor with significant road frontage that has not been rezoned to a higher density use. The current ownership purchased the six-acre tract of land in 1985 to develop its current use as a gokart track. The track has been in continuous operation for almost 25 years, and the ownership would like to investigate the site s potential as a redevelopment. It is a site looking for a use. The goal is to determine a use that will maximize the value of the land while also fulfilling community and county needs. This analysis is a feasibility study that investigates the highest and best use for the Go-Kart Raceway site through the lens of a residential developer with expertise in both for-sale housing and multifamily rental apartments. It will look at the potential to develop the site with single family detached houses, townhouses, or multifamily rental units. James Graaskamp (Univ. Wisconsin) believed a real estate project is feasible when the real estate analyst determines there is a reasonable likelihood of satisfying explicit objectives when a selected course of action is tested for fit to a context of specific and limited resources (Research Issues in Real Estate, 2000). The following analysis will identify the potential physical, political, financial, and market constraints that shape the site s highest and best use determination. The ultimate use will maximize the productivity of the site within its competitive landscape, which will in turn provide the current ownership with the highest land value for the subject property. 1
.")

.")


4 II. SITE AND CURRENT USE Site Description The subject property is located at 1050 Route 3 South in Gambrills, MD, which is located in the western part of Anne Arundel County (ACC). The town of Gambrills is a part of the greater Odenton area, and is adjacent to the towns of Crofton and Bowie. The property is located just inside the dividing line for what is considered the Odenton Small Area Plan (SAP). Properties located to the west of Route 3 are in the Odenton SAP, and to the east are in the Crofton SAP. Route 3 also serves as the boundary between District 4 and District 7 in AAC. The property lies within District 4 (Council member James Benoit), while the council member for District 7 is Ed Reilly. Gambrills is conveniently located between Baltimore (25 miles) and Washington, DC (35 miles) with easy access to both cities. The Route 3 corridor is a 10-mile, six lane, and north-south thoroughfare in AAC that serves as a connector to Interstate 97 to the north and Route 50 to the south. 2
 in 1985 to construct a go-cart track, which has been in continuous use to this day (See Site Photos Tab).")

5 The subject property is comprised of three contiguous parcels of land that total roughly six acres or 262,000 SF (Parcels 66, 67, and 357). The current owner, AG/KL Inc., purchased two of the vacant parcels (5.5 acres) in 1985 to construct a go-cart track, which has been in continuous use to this day (See Site Photos Tab). The remaining land-locked one-half acre was purchased when it became available for sale in The original site for the go-kart track was primarily wooded with the exception of a few small houses erected by squatters. A brief title review revealed that the site was once part of a larger 83- acre tract of land purchased by William G. Williams back in Over the years this large tract was divided amongst Mr. Williams heirs, who ultimately sold it to AG/KL, Inc. some sixty years later. Surrounding Uses (See Map 5) North: The adjacent land to the north of the site is densely wooded and zoned as open space due to the creek bed and wetlands. The open space appears to encroach on parts of Parcel 357 on the north side of the subject property. Continuing north across Evergreen Road is the Reliable Contracting sand and gravel site, which will be home to the proposed 100-acre mixed-use development called Waugh Chapel Village Phase II. The original Waugh Chapel Village development is just north of the Phase II section, and also includes a mix of uses including office, retail, and residential. South: The parcels abutting the subject property to the south are also located within the R1 zoning district and have a scattering of older single-family detached houses. These parcels total roughly 5.5 acres and have been mostly cleared. There is a significant slope on the southernmost parcel that slopes towards the subject property. 3

6 East: The land between the site and Route 3 South is a narrow strip with a utility easement across which high-tension power lines run in a north-south direction. Across Route 3 South, the median strip is comprised of a mix of C3 and C4 commercial uses. Directly across from the subject property is a Pizza Hut. North of the Pizza Hut is a 7/11 convenience store, and to the south is an auto repair shop followed by a Wendy s. Continuing further east across the Route 3 northbound side you will find more commercially zoned land with uses such as Dunkin Donuts and a neighborhood bank. West: The land adjacent to the west of the site is densely wooded residential property. No structures are on this 10-acre parcel of land, which is owned by BBSS (also known as Reliable Contracting). For detailed descriptions of the surrounding parcels including ownership and zoning districts, please refer to the Appendix. 4
7 III. DEMOGRAPHICS AND SOCIO-ECONOMIC INDICATORS Baltimore MSA The subject property is located in the Gambrills area of southern Anne Arundel County, within the Baltimore-Washington CMSA. The Baltimore-Washington CMSA is the fourth largest regional area in the country, ranking behind only New York, Los Angeles, and Chicago. According to the 2007 American Community Survey, the total population of the CMSA was approximately 8.1 million people. Although residents of the Gambrills area commute to work in both Washington and Baltimore, the site is technically within the Baltimore MSA (Joseph J. Blake and Associates, Inc.) Population Estimate Annual Growth From 2000 Baltimore, MD MSA 2,699, % Washington, DC MSA 5,451, % As of year-end 2008, the Baltimore MSA began showing signs that the national economic crisis was taking its toll on the metro. In the fourth quarter, the labor force contracted by 1.9% year-over-year, while unemployment jumped up to 5.4% from 3.5% a year earlier (Bureau of Labor Statistics). The job losses were led by the Construction, Financial, and Retail sectors with a combined loss of 22,800 jobs. The only bright spots in the labor force over this time period were the Government, Education, and Health Services sectors, which added 6,700 jobs in total. The Baltimore metro has an above average concentration in these fields led by the University of Maryland Medical Center, Johns Hopkins Hospital and Health System, and the Baltimore City and County Governments. Moody s Economy.com predicts the Baltimore MSA will shed 7,500 jobs in 2009, a loss of 0.6%. This source also predicts that between 2010 and 2012 the metro will benefit from the strongest job growth since the 1990s (REIS). The Baltimore MSA tallied roughly 2.5 million people in the 2000 Census with a workforce of 1.2 million. By the 2010 census, these demographics are projected to grow to 2.75 million and 1.45 million respectively. 5
8 The MSA is comprised of the following counties: Jurisdiction 1990 Population 2000 Population 2007 Population 2012 Population Anne Arundel County 427, , , ,405 Baltimore County 692, , , ,836 Baltimore City 736, , , ,354 Carroll County 123, , , ,301 Harford County 182, , , ,377 Howard County 187, , , ,753 Totals 2,348,219 2,512,431 2,651,989 2,746,026 Anne Arundel County Anne Arundel County is the fifth largest county by population in the state of Maryland. The County is bordered by the Chesapeake Bay to the east and is equidistant from Baltimore to the north and Washington, DC to the west. Anne Arundel County is home to 23 towns including the capitol city of Annapolis. Anne Arundel County has benefited from its natural setting on the Chesapeake Bay, historical appeal, and its proximity to both the Baltimore and Washington, DC areas. Although the surrounding MSA s have provided insulation from many of the ailings found in other counties around the country, recent data suggests new trends and changing dynamics of Anne Arundel County that are consistent nationally. The population in Anne Arundel County has grown over the last two decades, and is expected to continue this positive growth, albeit at a slower rate. According to the 2000 Census the population has increased 15% since 1990 and is anticipated to grow 8% by 2010 (see chart). Total Population (Est.) Total Population 427, , , ,950 % Increase 15% 8% Source: Dept. of Business and Economic Development, US Census 6
9 Even though the total population has been increasing at a healthy pace, new trends have emerged over the last two decades. The most notable trend is the increasing age of the population. In 1990 the dominant age group was the 25 to 34 cohort, but as you can see from the chart this group has migrated upwards in both the 2000 census and 2005 American Community Survey. The phenomenon is also captured in the increasing median age from 36 to 37.4 from 2000 and 2005 respectively. Population by Age (Est.) Under 5 years 7.4% 6.8% 7.0% 6.6% 5 to 9 years 7.0% 7.1% 6.7% 6.7% 10 to 14 years 6.3% 7.3% 7.5% 8.0% 15 to 19 years 6.9% 6.5% 6.8% 6.6% 20 to 24 years 7.9% 5.7% 5.5% 4.4% 25 to 34 years 18.7% 14.8% 12.3% 10.3% 35 to 44 years 16.8% 18.0% 16.8% 17.4% 45 to 54 years 11.9% 14.6% 15.3% 16.6% 55 to 59 years 4.3% 5.5% 6.5% 7.1% 60 to 64 years 3.9% 3.8% 5.0% 5.0% 65 to 74 years 5.7% 5.7% 5.9% 5.9% 75 to 84 years 2.5% 3.4% 3.7% 4.1% 85 years and over 0.6% 0.9% 1.0% 1.1% Median age (years) Source: US Census As the Baby Boomer population continues to get older this trend will continue for this decade as well as future ones. Today, approximately half of the population is in the 25 to 54 age group, but this stratum will continue to lose people to the 55 and up contingency. As of % of the population was 55 years of age or older, and is anticipated to grow to roughly 23% of the population by Another interesting trend in the demographics of the population is the increasing level of education in the County. From 1990 to 2005 the population with at least a bachelor s degree has increased by almost 10%. The statistic bodes well for companies looking to move into an area and needing an educated workforce. Education (Est.) High School Graduate 30.3% 27.9% 26.8% 25.6% Bachelor's Degree of higher 24.6% 30.6% 34.3% 37.3% Source: US Census 7
10 Besides the population and demographic changes, housing statistics for Anne Arundel County (see chart), such as increased housing stock and housing values, have mirrored similar national trends. Housing (Est.) Housing Units 149, , , ,780 Persons per household Owner Occupied 72.9% 75.5% 76.0% 77.4% Renter Occupied 27.1% 24.5% 24.0% 22.6% Source: US Census The housing boom of recent years has led to a substantial increase in the housing stock as well as housing values. Over a 15 year period starting in 1990 the housing stock in Anne Arundel County has added 28% more inventory, while prices have increased over 2.5 times. The biggest jump in housing values can be attributed in the time period from 2000 to 2005 when loans were cheap and everyone qualified for one. This is glaringly apparent when comparing the percentage of housing over $300,000 in value from 1990 to 2005 time period, which is 7.6% to 55.8% respectively. Housing Values (Est.) Less than $50, % 0.5% 1.4% 1.0% $50,000 to $99, % 8.6% 2.1% 0.8% $100,000 to $149, % 35.4% 4.9% 4.3% $150,000 to $199, % 23.8% 9.5% 7.5% $200,000 to $299, % 18.7% 26.2% 27.5% $300,000 to $499, % 9.4% 30.9% 31.8% $500,000 to $999, % 21.1% 23.0% $1,000,000 or more 0.4% 3.8% 4.1% Median (dollars) $127,900 $159,300 $329,500 $345,200 Source: US Census It is interesting to note that while the housing inventory and owner occupied percentages increased over this time period, the person per household actually decreased. A number of conclusions can be drawn from this including more people leaving their parent s homes to buy their own house or families deciding to have fewer children. Anne Arundel County has been an affluent county over the last few decades continually ranking in the top 100 wealthiest counties nationally (82 out of 100 as of 2007). Within the state of Maryland, Anne Arundel County is the fourth wealthiest behind Howard, Montgomery, and Calvert counties. In Anne Arundel the average household income has increased an astounding 42% from 1990 to 2005, or $52,311 to $74,098 respectively. This increase can be attributed to the 88% increase in the average wage per job from $24,656 to $46,454 over this same time period ( 8
11 Household Income (Est.) Less than $10, % 4.0% 3.4% 2.3% $10,000 to $14, % 2.7% 2.4% 1.7% $15,000 to $24, % 7.2% 7.2% 5.0% $25,000 to $34, % 9.1% 6.8% 4.7% $35,000 to $49, % 15.0% 13.5% 10.3% $50,000 to $74, % 24.0% 18.7% 18.4% $75,000 to $99, % 16.3% 15.9% 18.5% $100,000 to $149, % 14.5% 19.0% 23.5% $150,000 to $199, % 4.1% 7.0% 8.0% $200,000 or more 3.2% 6.1% 7.6% Average household income (dollars) $52,311 $74,098 $102,518 $113,412 Source: US Census and DemographicsNow.com In comparing the last two decades in Anne Arundel County, it is evident there has been a change in the composition of the population from the lower middle class to the upper middle class and higher. From 1990 to 2005 there was a paradigm shift from the $50,000 to $74,999 cohort to the $75,000 and above. In 1990 only 18.7% of the population made greater than $75,000, compared to 48% in This increased household income was one of the contributing factors that drove the housing values in addition to the sub prime and lax underwriting criteria of the times. Although the credit crisis has taken a toll on the area, the high levels of household income bode well for retailers and other commercial uses in the County. As mentioned previously, Anne Arundel County s proximity to both Baltimore and Washington, DC has enabled it to maintain a strong employment base and keep unemployment at levels below the national average. The total labor force has increased roughly 11% from 1990 to 2005, and is anticipated to continue this growth through the 2010 Census (see chart). Employment (Est.) Labor Force 245, , , ,954 Unemployment 3.2% 3.0% 3.5% Source: Bureau of Labor Statistics, US Census Although the labor force and unemployment rate have remained consistent over this time period, the characteristics of the job force have evolved (see chart below). In 1990 the top four employer groups were retail trade, public administration, educational, health, and social services, and manufacturing. The picture has changed in 2005 to education, health, and social services as the top group followed by professional, scientific, management, and administrative as the second largest. The remaining groups are public administration (due to the presence of the state government) and retail trade. The emergence of the professional group can be attributed to the increased levels of education noted previously. 9
12 Employment Groups (Est.) Agriculture, forestry, fishing and hunting, and mining 1.2% 0.2% 0.3% -0.3% Construction 9.1% 8.1% 9.0% 8.4% Manufacturing 10.5% 7.3% 5.6% 4.0% Wholesale trade 5.2% 3.8% 3.1% 2.4% Retail trade 16.8% 11.7% 11.6% 9.0% Transportation and warehousing, and utilities 5.1% 5.7% 5.3% 5.7% Information 2.5% 3.6% 2.3% 2.9% Finance, insurance, real estate, and rental and leasing 6.5% 6.4% 7.2% 7.2% Professional, scientific, management, and administrative 5.3% 12.1% 13.8% 17.2% Educational, health and social services 13.2% 17.1% 16.7% 18.6% Arts, entertainment, recreation, accommodation and food services 3.4% 6.6% 7.4% 9.0% Other services (except public administration) 7.4% 5.6% 4.8% 3.9% Public administration 13.8% 11.9% 12.9% 12.0% Source: US Census The top ten employers in AAC are as follows: Top Ten Employers Employer # of Employees Product or Service Ft. Meade 36,209 Dept. of Defense, NSA, DISA AAC Public Schools 14,041 Public Education K-12 BWI Airport 10,659 Regional Airport State of MD 8,879 State Government Services Northrop Grumman 8,000 Electronic Systems Sector AAC Government 4,266 Local Government Services Southwest Airlines 3,200 Airline, East Coast Flight Center AA Health System 2,800 Hospital Baltimore Washington Medical Center 2,544 Hospital US Naval Academy 2,052 Federal Naval Education Facility Source: Anne Arundel County Economic Development Corporation While the employment groups have shifted over the referenced time period, the commuting patterns have not changed as significantly. As you can see from the chart below, as of the 2000 Census 56% of the population that lived in Anne Arundel County also worked in the County. This figure has decreased slightly since the 1990 Census as more residents commute to the Washington DC area for higher paying jobs. Roughly 1/3 of the residents make the trek to the Baltimore or Washington areas for employment. County-to-County Commuting (Est.) Anne Arundel County 60.6% 56.3% 52.0% Baltimore Area 14.1% 14.1% 14.1% Washington, DC Area 19.3% 21.5% 23.7% Other 6.0% 8.1% 10.2% Source: 1990 & 2000 Decennial Census Fort Meade - Base Realignment and Closure Act The Base Realignment and Closure Act, or BRAC for short, is a process whereby military bases are evaluated and either closed or certain functions are realigned for greater efficiency. The impetus behind BRAC 2005 is two-fold. The main driver behind the plan is to restructure and transform the US Military 10
13 framework from a Cold War era posture to one that is suited to meet the needs and threats of the 21 st Century, which was spurred on by the actions of 9/11. The second driver behind BRAC is cost savings. The previous rounds have netted roughly $7 billion annually in savings that can be used to fund future resource needs. The 2005 BRAC was the fifth round since the process became official legislation with the BRAC Act of The 2005 BRAC called for 837 total actions that included closing 22 major bases and realigning 33 others. The Department of Defense is required to complete the recommendations by September 15, Fort Meade is located approximately 7-8 miles northwest of the subject site in Odenton, MD. As a result of the 2005 Base Realignment and Closure Act (BRAC), Ft. Meade was determined to be a net receiver of military personnel. The 2005 BRAC is anticipated to bring over 5,400 military personnel to Ft. Meade, in addition to over 7,000 civilian contract support positions. These positions will be a realignment of the Defense Information Systems Agency (DISA), Adjudication and Office of Hearings and Appeals, and the Department of Defense media activities. These three agencies combined will require almost 1.5 million square feet in additional space at an estimated cost of $350 million. By the time BRAC has reached full impact in 2012, over 11,000 on-base and 15,000 off-base jobs will be created, totaling more than 26,000 area jobs. BRAC and the consequential activities are forecasted to impact the Ft. Meade area and greater AAC economy by over $5 billion annually. See Map 6 for an overview of BRAC related activities. Crofton/Gambrills/Odenton The subject s neighborhood demographics essentially parallel the trends seen in the greater Anne Arundel County submarket. According to DeomgraphicsNow.com, a 5-mile radius around the subject property includes a population of 74,000, which is projected to grow to 78,000 by The average age of this demographic is 37 years old with an average household income of $118,000. Household income is projected to increase to $139,000 by 2013, which indicates a prosperous population in the immediate vicinity of the subject property. The affluence of the area is further advocated by an educational attainment of bachelor s degree or higher for 45% of this group, and an employment in white collar occupations for 76% of the population. Transportation Linkages In terms of transportation, the subject s neighborhood area offers good access throughout surrounding parts of suburban Maryland including convenient access to both Baltimore and Washington DC. Primary connectors include Route 3, Route 450, and Route 50. Approximately three miles north of the site, Route 3 intersects with Interstate 97, which provides a direct connection between Baltimore and Annapolis. 11
14 Similarly, Route 3 intersects with Route 50 roughly three miles to the south of the site, which provides connection to Washington, DC, Interstate 495 (Capitol Beltway), and Interstate 95. The public transportation in the area is limited; however, there is access to the MARC train system. The MARC system is a commuter train that runs to both Baltimore and Washington, DC (See Map 7 MARC Train Service). There is a MARC station approximately 9 miles from the site in Odenton, which connects to the DC metro system at both the New Carrolton and Union Station stops (See Map 8 WMATA Metro Map). The Odenton station is the busiest stop on the Penn Line and is currently in the process of being redeveloped as part of the Odenton Towne Centre master plan. 12
15 IV. DEVELOPMENT POTENTIAL Zoning and Land Use Planning AAC Anne Arundel County, MD (AAC) is a charter county that is granted planning and zoning powers by the Annotated Code of Maryland. The Code requires that the Office of Planning and Zoning prepare and periodically update a comprehensive plan to establish policies and recommendations to guide land use decisions over the next 10 to 20 year planning horizon. AAC has had a General Development Plan (GDP) since 1968 with updates in 1978, 1986, and AAC began working on the 2008 GDP in July 2007, and is currently working on the second round of revisions, which are slated for approval by Fall The goal of the 2008 GDP update is to continue to provide a solid growth management plan by guiding the majority of the new growth within the County s existing Priority Funding Areas, while also furthering the land use policies of the 1997 Plan. The 1997 GDP contained many recommendations on how the County might better manage growth, and conserve the environment, while also guiding where various developments should be located. Some of the major accomplishments of the 1997 GDP include: Completion and adoption of 16 Small Area Plans (SAP) The County was divided up into 16 communities and recommendations were made on how individual properties should be used and zoned (See Map 9 AAC Saps). These SAPs were also used as a vehicle for refining the County s Land Use Plan, and consolidated to form the County s 2004 (and current) Land Use Plan. Each SAP was followed with comprehensive zoning legislation to rezone properties according to the adopted Land Use Plan. Designation of Priority Funding Areas (See Map 10 Priority Funding Areas) the 1997 Smart Growth Areas Act required the State to target funding for growth-related projects (highways, water/sewer construction, etc.) to Priority Funding Areas in each local jurisdiction. This furthers the goal of directing new growth to the most suitable areas. Designation of Mixed-Use Areas Four new Mixed Use zoning categories were added to the Zoning Ordinance in 2001, which encourage a mix of retail, office, and residential uses in close proximity. As noted previously, the proposed site is located on the boundary between Crofton and Odenton. Therefore, to better understand the intended land uses along the Route 3 corridor, it is important to 13
16 analyze both the Crofton and Odenton Small Area Plans from the 2004 Land Use Plan. Neither plan directly addresses the envisioned land-use for the subject property. The site is located in the southernmost part of the Odenton Small Area Plan along Route 3 South (west side of Rt. 3). The Odenton SAP is considered one of the prime areas for economic growth within AAC. It offers a diverse mix of housing densities, from apartments in Piney Orchard and Seven Oaks, to large lot single-family homes in Gambrills. The southern part of Route 3 is primarily commercial development. Roughly 64% of the land in the Odenton SAP is residentially zoned, while only 5% is zoned for commercial or industrial uses. The remaining 31% is zoned as open space or rural/agricultural (See Map 11 Odenton SAP Zoning Map). The 2004 Odenton SAP proposed zoning changes that applied to parcels of land in the immediate vicinity of the site. The land just to the north of the site, where the current Reliable Contracting sand and gravel mining operation is located, has been changed to a commercial-based Mixed-Use zone (MXD-C) from Residential Low Density (RLD). The Reliable site is home to the new 100-acre mixed-use Waugh Chapel Village Phase II, which is currently under construction and being developed by Greenberg Gibbons (See Pipeline Tab for detail). This mixed-use development received community support on the condition that the focus on the draw for the retail be the local customer base, rather than a state-wide or regional customer base. Just north of this new development is the Waugh Chapel Village Phase I, which is a mix of uses approved in a R1 zone during a special legislative session by the County Council. In addition to the west side of Route 3 just to the north of the site, the median of Route 3 immediately across from the site was also changed in accordance with the Odenton SAP s direction. The median parcels are a hodge podge of uses that were all operating under low-density zoning (RLD & R1). Given the incongruity of the zoning and the uses in place, the SAP changed all median parcels to Commercial zones (C1 to C4). Lastly, just to the south of the site, two parcels totaling roughly five acres were changed from a residential RLD to a C4 commercial zone, under the reasoning that the properties face commercial uses in the median, and abut commercial uses to its south. While the site is not located in the Crofton SAP, it s proximity to its boundary warrants an understanding of the land use patterns and plans for the Crofton area as well. The Crofton SAP includes both sides of Route 3 (south of the site) up until the intersection with Route 424, at which point it only includes the North bound (east side) lane of Route 3 (See Map 12 Crofton SAP Map). The 2004 SAP for Crofton highlights multiple areas of concern near the site that indicate future land use patterns. They are as follows: 14
17 Route 3 North from Crofton Station (Rt. 424 & Rt. 3) to Johns Hopkins Road (opposite side of Route 3 from site) this area is a mixture of residential and institutional uses with highway commercial in the median. The plan recommends upgrading this section to a mixed-use zone with special design guidelines to encourage land assembly and consolidation of access for new development. Industrial Park and Commercial mixed-use area the west side of Route 3 (2 miles south of site) is envisioned to be redeveloped as a mixture of commercial and industrial uses accomplished through flexible overlay zones. This current area is a piecemeal of commercial and industrial uses with no continuity or design guidelines. Transportation Route 3 is proposed to be upgraded to a boulevard concept with commercial mixed-uses along the corridor. Additionally, the 2004 SAP calls for non-vehicular access ways to interconnect commercial areas on the east and west sides of Route 3. This includes a bridge that allows pedestrians and bicycle traffic to move between the two areas. The General Development Plan is a time consuming process with many parties involved. The process is spearheaded by the Planning and Zoning Office (P&Z) with input from numerous public forums as well as sanctioned background reports. A draft of the GDP is presented to the Planning Advisory Board, a five member board appointed by the County Executive, for another round of hearings. The Planning Advisory Board makes recommendations to the P&Z Office before it is put into final form for presentation to the County Council. The seven-member County Council then votes to approve the GDP (4 votes needed). Once the GDP is approved, letters are sent out to all real property owners in the County alerting them that the Comprehensive Zoning process will soon be initiated. The 2008 GDP is anticipated to be adopted by County Council by October 2009, which is immediately followed by the Comprehensive Zoning process. Comprehensive Zoning The General Development Plan does not attempt to define an allowable land use on every specific land parcel in the County. The GDP is used to guide development patterns and is implemented through mechanisms like Comprehensive Zoning. Comprehensive Zoning is a process that occurs after a new GDP or after a revision to an existing Land Use Plan has been approved, and involves parcel specific rezoning requests initiated by a member of the County Council. Comprehensive Zoning changes will be consistent with the written policies of the GDP and will also meet at least one of the following criteria: The change in zoning will allow a land use that will serve an identified community need; 15
18 The change in zoning will allow a land use that will serve an identified Countywide need; The change in zoning will allow a land use that is more consistent with the character of the area, given past or recent changes in character, or The change in zoning will correct a mistake made on the County s official zoning maps. Similar to the GDP process, the Comprehensive Zoning process is promulgated by the P&Z Office. At this point, individual property owners can make zoning requests to both their district council person and members of the P&Z staff for why his or her specific property warrants a zoning change. After public hearings and presentation to the Planning Advisory Board for recommendations, the district council person must then introduce a bill to the County Council for the requested zoning change. The bill must be voted on within a 95 day window or else the bill expires. Once approved, the County Zoning Map is updated to reflect the change in zoning for that property. Additional Rezoning Options If a property owner misses the opportunity to get a property rezoned through the Comprehensive Zoning process or has a request for rezoning voted down by the County Council, there are two additional ways to get a rezoning approved. The first option is a piecemeal rezoning in which the change or mistake rule is applied. An applicant seeking to change the zoning classification of a property must demonstrate either a change in the character of the neighborhood since the last comprehensive zoning, or a mistake in that comprehensive zoning. Proving change in the character of the neighborhood is difficult the closer in time to comprehensive zoning, and planning mistakes become more difficult as time passes and public records become unavailable. The second option for a zoning change is to directly petition the council member of the district the property lies in. The council member, if persuaded, can introduce another bill for the adoption of a new zoning classification for the property in question. Similar to the change or mistake rule, this process is more difficult the closer in time the request is to the comprehensive zoning. Both of these options are ultimately accomplished by a legislative action to amend the zoning map (Maryland Land Use Guide, 1992). Subdivision Subdivision can mean either the assemblage of land or the division of land into legal buildable lots. In Maryland, a preliminary plan of subdivision is required prior to the submission, approval, and recordation of a final record plat (final plat is recorded in the land records of the county). Preliminary plans of subdivision involve the professional preparation of engineering plans and the submission of detailed site, 16
19 access, and location information. This is also the stage at which a determination is made concerning the adequacy of public facilities (described in detail below) to serve the proposed development. At the time of approval of the preliminary subdivision plan, the county may impose conditions limiting the location or density of the development, require dedications or open space, or the construction of public infrastructure. Until the subdivision plan is approved and the plats are recorded, no property may be sold within the subdivision and no building permit to construct may be issued (Maryland Land Use Guide, 2006). Subdivision approval is an ex parte process with generally the following steps: Process preliminary plan pre file meeting with the P&Z staff and citizens in the community. Preparation of plans and reports include topography report, stormwater management plan, Forest Conservation Plan (Natural Resources Inventory and Forest Stand Delineation), Environmental reports, and Transportation studies. Development Review Committee various agencies will give input into the subdivision plan, such as Department of Public Works, Transportation, Utilities, Community Planning, Department of the Environment, and Permitting Services. The final step is a hearing in front of the Planning Advisory Board with recommendations from P&Z staff, citizen testimony, and questions from the PAB. At the end of the hearing, the PAB votes on approval of the application for subdivision. Adequate Public Facilities (APFs) As part of the subdivision approval process, a developer must conduct an APF study of the affects the proposed development will have on the surrounding infrastructure. Anne Arundel County is one of the 12 municipalities or counties in the state of Maryland that has implemented an adequate public facilities ordinance. The ordinance is designed to assure that public schools, roads, sewers, water for fire fighting, police and rescue response times and/or other infrastructure or services are adequate to support proposed new development. The AAC APF ordinance was passed in 1978 for schools, roads, water, sewer, and water for fire fighting. In a study done by the University of Maryland s National Center for Smart Growth Research and Education in 2006, AAC was found to be a strict school APF county, and also have long waiting periods. A long waiting period refers to counties that must wait five (5) or more years after APF-induced sub division denial (Adequate Public Facility Ordinances in Maryland, 2006). Once a developer receives APF approval, the infrastructure needs generated by the new development are paid through impact fees and/or construction of the public improvements by the developer. 17
20 Current Zoning and Land Use The subject property is currently zoned R1 (See Map 13 & 14 Current Zoning), which is a residential district that allows for a maximum net density of one dwelling unit per 40,000 SF, or roughly six dwelling units in total for the subject site (depending on the use). When the go-cart track was constructed 25 years ago, the use was allowed as a special exception under the R1 Zoning Ordinance for a Commercial Recreational Facility. On May 16, 1985 after a site plan review, the Zoning and Hearing Officer of Anne Arundel County granted the special exception with the condition that the applicant (AG/KL, Inc.) develop the site using the Zoning Office s recommendations (increased setbacks, landscaping, hours of operation, etc.). Since the initial special exception was granted in 1985, the R1 zone has undergone a number of significant changes. The Commercial Recreational Facility use is still allowed as a special exception in this zone; however, it no longer permits activities that include motorcycles, dirt bikes, or go-carts. This use is intended for: miniature golf; driving ranges; tennis, racquet, and handball barns or courts; artificial ski slopes; indoor soccer; bowling alleys; BMX bike, skateboard or roller blade parks; and skating rinks. Because the go-kart track use was permitted from the time it was developed until the zoning code changed, it is now operating as a legally non-conforming use, which the owner may have to register with the Office of Planning and Zoning should the Zoning Officer request it. One important thing to note, is that the current use of gas-powered go-carts is not permitted (special exception, conditional, or otherwise) under any of the commercial or residential districts in the Anne Arundel County Zoning Ordinance. The only exception is if it is part of an Amusement Park, which requires a minimum site area of 50 acres in the C4 zone. The use of electric go-carts in a Commercial Recreational Facility is permitted in the C2, C3, and C4 zones. Residential Districts There are eight (8) residential districts in Anne Arundel County that each allow for a host of uses out of the 72 potential uses in all. The districts are: RA (Rural Agricultural), RLD (Residential Low Density), R1, R2, R5, R10, R15, and R22. The R1-R22 districts allow for a max density in units per acre (i.e. R22 allows for 22 units per acre). Some of the more common residential uses are listed below in Table 1. Generally speaking, the denser the zoning the more productive the site will be. Using this rationale the analysis will focus on the current R1 zoning, and the denser R15 and R22 zones. Although the R1, R15, and R22 zones allow for a variety of uses, for the purposes of this study it is assumed that the potential developer is experienced in single family detached, townhouses, and multifamily uses. These three uses 18
21 will be analyzed to determine the highest and best use for subject property (See the Zoning Tab for a list of each district s uses). Table 1 - Residential District Uses Uses RA RLD R1 R2 R5 R10 R15 R22 Assisted Living Facilities SE SE SE SE SE SE Dwelling Units, Adult Independent P P P P P P P P Dwelling Units, Multifamily P P P Dwellings, single-family detached P P P P P P P Dwellings, townhouses C C C Housing for the elderly of moderate means SE SE SE SE SE Nursing Homes SE SE SE SE SE SE SE SE Commercial Recreational Facilities SE SE Source: Anne Arundel County Zoning Code, 2005 The R1 zone allows for 58 potential uses that range from airports and golf courses to roadside stands and volunteer fire stations. The zoning restrictions are summarized below: Table 2: R1 Bulk Regulations Minimum Lot Size: 40,000 SF Max Coverage by Structures: 25% of gross area Minimum width at front building restriction 125 feet line: Minimum Setbacks: Front Lot Line 40 feet Rear Lot Line 35 feet Side Lot Line 15 feet Combined Side Lot Lines 40 feet Corner Side Lot Line 40 feet Max Height: 45 feet Max Net Density: One dwelling unit per 40,000 SF Parking: 2 spaces/du Source: Anne Arundel County Zoning Code, 2005 The R15 district allows for the second most density per acre of the residential districts. This zone allows for a potential of 44 uses, and the zoning restriction are summarized below: Table 3: R15 Bulk Regulations Max Coverage by Structures: 45% of gross area Minimum Setbacks: Front Lot Line 20 feet Rear Lot Line 30 feet Side Lot Line 15 feet Corner Side Lot Line 20 feet Max Height: 55 feet if all setbacks are increased by one foot for each foot of height in excess of 40 feet Max Length of a Single Elevation: 250 feet Max Net Density: 15 dwelling units per acre Parking: Townhouses = 2.5 space/du Detached = 2 space/du Source: Anne Arundel County Zoning Code,
22 The R22 residential district allows for the most density per acre at 22 units. There are 39 potential uses in this district, and Table 4 below summarizes the bulk regulations for this zone: Table 4: R22 Bulk Regulations Max Coverage by Structures: 45% of gross area Minimum width at building restriction line for multiple dwelling structures: 125 feet Minimum Setbacks: Front Lot Line 20 feet Rear Lot Line 30 feet Side Lot Line 25 feet Corner Side Lot Line 30 feet Minimum distance between multifamily structures located on the same lot: Facades with windows 30 feet, increased by 25% of the amount by which the height exceeds 45 feet Facades without windows Max Height: Max Length of a Single Elevation: Max Net Density: Parking: Source: Anne Arundel County Zoning Code, feet, increased by 25% of the amount by which the height exceeds 45 feet None if all setbacks are increased by one foot for each two feet of height in excess of 45 feet 250 feet 22 dwelling units per acre Eff. & 1BD = 1 space/du 2BD = 2 spaces/du 3BD or more = 3 spaces/du 20
23 V. HIGHEST AND BEST USE ANALYSIS The Appraisal Institute defines highest and best use as the reasonably probable and legal use of vacant land or an improved property, which is physically possible, appropriately (market) supported, financially feasible, and that results in the highest value (The Appraisal of Real Estate, 12th Edition). The highest and best use analysis takes into consideration what is physically possible, legally permissible, financially feasible, and will maximize profitability of a particular site. Physically Possible The size, shape, location, utility availability, and terrain impose physical restraints upon the types of potential uses for the subject property. The subject property benefits from its relatively flat topography, but its proximity to the creek in the Open Space Zone just to the north of the site could raise potential environmental concerns and also hamper development potential. The creek is considered a non-tidal wetland, although it is not located in a 100- year floodplain. The presence of the wetlands requires a 25 foot buffer from any development. An environmental consultant will have to evaluate the extent of the wetland area and work with the MD Department of the Environment to catalog the natural resources on the site. For purposes of this analysis, it is assumed the wetlands that encroach on the north parcel (Parcel 357) will count towards the 15% forest conservation requirement. The subject property has approximately 440 feet of frontage along Route 3, which is considered a principal arterial roadway. While the visibility is a positive attribute of the site, the proximity to the highly traversed road could present noise issues. According to a recent report from CBRE, Route 3 South has an average daily traffic volume of 63,375 vehicles. Additionally, the subject property is within a few miles from the Capitol Raceway racetrack. This track is a drag strip that has been in operation for 40 years, and could present a noise issue for the select days of the week races are run. Any potential noise issues from Route 3 or the racetrack will have to be mitigated through construction techniques and landscaping barriers. The Reliable Contracting sand and gravel operation to the north of the site (future home to Phase II of Waugh Chapel Village) along with Constellation Energy, recently settled a $54 million fly ash lawsuit. Area residents sued Reliable and Constellation in 2007 alleging that the fly ash buried on the Reliable site had leaked into the groundwater and contaminated water supplies. Fly ash is a by-product of burning coal that Constellation had been dumping into the Reliable gravel pits to use as filler since An environmental consultant will have to evaluate the potential risk this may pose to the subject property. 21


24 The subject site s current use relies on a well and septic system for water and sewer. Any of the proposed residential uses would require significantly more water and sewer capacity than the current system can support. Additionally, a septic field requires a reserved area on the site that cannot be built upon, which would limit your amount of developable land. A change to a residential use would require the owner to extend public water and sewer to the site. The subject property is located in the Kings Heights/Odenton public water zone, which is in a planned service area according to the Department of Public Works (See Map 15 Planned Water Service). There is a water main on the north bound side of Route 3; however, it falls within the Crofton zone and cannot be tapped into. The closest accessible water pipe is located roughly half a mile north of the site at the Waugh Chapel Village Phase I. In order for the owner to minimize the cost of extending the water pipe to the subject property, he should wait until the developer of Waugh Chapel Phase II has extended the water system further down Route 3 South. The WC Phase II is currently under development review for the Commercial phase of the development. They have submitted a master plan and a grading/site work plan. The site and utility work is anticipated to start summer 2009 with an estimated 12-month completion date for this stage, which entails completion of the water pipe extension to WC Phase II by summer The subject site is also located in a planned area for sewer (See Map 16 Planned Sewer Service). There is an existing sewer line 200 yards north of the site that runs along Evergreen Road to support the singlefamily housing in the nearby neighborhood. A civil engineer will have to determine and evaluate the cost of bringing water and sewer service to the site. The estimated cost to hire a civil engineer to prepare a feasibility study of the site is $10,000. Please refer to Map 17 for a picture of the existing water and sewer pipes. 22
25 Aside from the potential environmental, noise, and water/sewer concerns, the property must also be analyzed to determine the maximum number of residential units the site is physically capable of supporting given the development restrictions of each zone. The site is approximately 262,000 gross square feet, of which 30% must remain as open space per the AAC Code, leaving roughly 183,000 of developable land (Please note, for the purposes of this analysis it is assumed that the recreational area requirement of 1,000 SF per unit for single family and townhouse units, and 20% of gross area for multifamily units, are both satisfied by the 30% open space constraint). Using some simplifying assumptions for the typical size of a townhouse, small lot single family home, and a footprint of a multifamily garden-style building, the maximum potential units can be derived as shown on Table 5. The R15 residential zone allows for a maximum of 90 single-family detached homes, however, using an average lot size of 3,750 SF the site will only potentially support up to 48 lots. On the other hand, the smaller lot townhouses can potentially support more than the R15 zone allows for at 129 units. Similar to the townhouses, the site potentially supports more multifamily units than the zoning allows for. In the R22 zone, a six-acre site only allows for a max of 132 units, but the site could support up to 168 total units based on a building footprint of 8,500 SF. Table 5: Zoning Calculation Parcel 66 Parcel 67 Parcel 357 TOTAL Acreage Gross Tract Area (SF) 187,308 49,658 24, ,796 Open Space Requirement (30%) (56,192) (14,898) (7,449) (78,539) Net Usable Area (SF) 131,116 34,761 17, ,257 Single Family Detached Lot (30' x 125') 3,750 3,750 3,750 Max Potential Detached Lots (Units) Townhouse Lot (20' x 70') 1,400 1,400 1,400 Max Potential Townhouse Lots (Units) * Multifamily Footprint (8 1,053 SF) 8,500 8,500 8,500 Max Potential Buildings Max Potential Multifamily Units ** * R15 zone max units for 6 acres capped at 90 total units * R22 zone max units for 6 acres capped at 132 total units 23
26 Legally Permissible The subject site is currently zoned R1, which allows for one dwelling unit per acre for a maximum of six units for the site. The R1 zone does not allow for townhomes or multifamily dwelling units. The existing improvements represent a legal non-conforming use of the site. In order for the owner to achieve maximum productivity of the site, the property must be up zoned. In the residential zones the maximum number of units will be achieved through either the R15 zone to maximize the total townhomes and single-family detached units on the site, or to the R22 zone for the maximum allowable multifamily units (See Table 6). As mentioned in the Zoning Analysis section of the study, Anne Arundel County is currently going through a revision to the General Development Plan that should be finalized by the end of the summer. Immediately preceding the ratification of the GDP, the County will begin the Comprehensive Zoning process during which time individual property owners can apply for a rezoning. Typically the zoning cases are heard by region of the county divided up into north, south, east, and west quadrants. This year it is anticipated that the Odenton Towne Centre cases will be heard first, in order to expedite land decisions by Fort Meade in preparation for BRAC. If this is the case, then the subject property s application will most likely be heard as part of the greater Odenton area during the earlier stages of the Comprehensive Zoning process. Otherwise, County Council has up to 95 days to vote on a zoning case, which puts the timing of the rezoning decision into the winter of 2009 or early The estimated cost for a land-use attorney for this process is approximately $10,000. The subject property s owner will have to take advantage of this timing to up zone the site to achieve maximum productivity for a legally permissible use. It should be noted that securing an up zoning of the subject property, while likely to happen due to the higher density surrounding uses, will potentially require approval from several parties. The details and arguments for the rezoning are ultimately the responsibility of the applicant, but it is imperative that the district council member and the Planning and Zoning staff have endorsed the request before the case is heard by the County Council. The service of a land-use attorney with a proven track record in Anne Arundel County will prove to be beneficial, as he or she will know the proper avenues to take when dealing with these groups. Additionally, since the property straddles the Gambrills/Crofton district boundaries, potential opposition may come from both jurisdictions. In 1985, when the original special exception case was heard, representatives from both the Gambrills Improvement Association and the Crofton Civic Association gave testimony. It is important to meet with groups that may present opposition to the case and work through their concerns before the hearing. The final group to recognize is 24
27 the subject site s adjacent property owners. Politically, it is difficult for the County Council to approve the rezoning request of an applicant if the applicant s neighbors are against it. In order to avoid this potential opposition, the owner will have to discuss the rezoning with the adjacent land owners as well. Table 6: Max Allowable Density for Site R1 R15 R22 Dwelling units, Multifamily (units) Not Allowed Dwellings, single-family detached (units) 6 90 Not Allowed Dwellings, townhouses (units) - Conditional Use Not Allowed 90 Not Allowed Source: Anne Arundel County Zoning Code, 2005 Financially Feasible Any use of the subject site which provides a financial return to the land in excess of the cost of the land and the amortized cost of capital, limits those uses which are financially feasible. For the single family detached use, it is assumed that the site physically supports 48 small lot singles with an average sales price of $540,750. The analysis further assumes that the acquisition, development, and construction loans are attainable at 65% loan-to-cost at a 6.5% note rate. At a pace of two sales per month, this project would take 24 months to sell out, and the entire project duration would be approximately 27 months start to finish. The townhouse financing is assumed to mirror the single family detached scenario utilizing a 65% loanto-cost loan at a 6.5% note rate. The site physically supports 90 townhouse units and features two different styles. The smaller style townhouse is 16 feet wide offered at a base of $325,000, and the larger unit is 22 feet wide offered at a base of $375,000. Since the townhouses are offered at a lower starting price, it is assumed they will sell three units per month, which would entail a sell out in 30 months. The entire duration of the project would last roughly 33 months. The for-sale scenarios were both underwritten assuming today s investment parameters, which entail a 10% return on revenue and a +22% IRR. Please refer to the Proforma tab of the study for further details. When the housing market was peaking from home builders bought as much land and built as many houses as fast as a lender would allow them to borrow the funds. After the bubble burst on the industry in 2006 many home builders were holding large tracts of raw land in their inventory. The lack of demand for new housing, shortage of available credit in the capital markets, and the carrying costs associated with owning undeveloped land forced many housing companies out of business. As a result, today s housing industry is markedly different with fewer active participants in the market. 25
28 The DR Horton and Ryan Homes of the world are no longer buying large tracts of land or bulk lots. They are only buying finished lots and paying as the units settle, as opposed to paying up front or on a scheduled take down. Since this study is analyzing the potential development of 48 small lot singles or 90 townhouses on the site, the likelihood of a national or regional home builder taking on the risk of developing so many lots is not to be expected. Thus, a land owner is required to take on the risk of developing finished lots and hoping to sell to one of the few home builders still active. The issue with the subject property is that the owner has no experience developing finished lots and therefore will not be able to secure a land development loan from a lender. The inability of the subject property s owner to obtain a loan in the current credit markets to develop the site and create value, coupled with the incapacity of home builders to purchase the subject site as raw land, makes the for-sale scenarios financially infeasible. On the other hand, there are currently a few lending sources that will finance the construction of a multifamily apartment complex. HUD s FHA program is still active and offering structures that are conducive to developing apartments. It is difficult in today s environment to meet the conservative underwriting requirements of both debt and equity providers, however, deals are still feasible and getting done, albeit at a slower pace. The multifamily analysis assumes a max density of 132 units for the subject site. As mentioned previously, the best financing option for this analysis is utilizing the FHA 221 (D) 4 program. The 221(D) 4 program is essentially a construction-perm loan that allows for up to a 90% loan-to-cost construction loan that becomes the permanent financing once the project is complete. At that point it is a 40-yr amortizing loan. As of April 27, 2009 FHA was quoting a 6.0% interest rate plus a mortgage insurance premium of 45 bps. The multifamily use analysis assumes an average rent of $1,811 per unit or $1.68 per square foot, and an average unit size is 1,080 SF. The proforma was underwritten to a 7% return on cost and a +20% levered IRR. Maximally Productive Thus far, it has been determined that the site physically supports 48 single family detached units, 90 townhouse units, and 132 multifamily units. Assuming the current R1 zone will be up zoned through the rezoning process to either the R15 or R22 districts, the proposed uses are also assumed to be legally permissible. If all three proposed uses were deemed to be financially feasible, the use that provided the highest land value to the owner would ultimately be the highest and best use for the subject property. Please refer to the Proforma Tab for a detailed analysis of each proposed use. 26
29 Table 8 below summarizes the results of the proformas run for each scenario. The highest land value for these uses is derived from the development of 90 townhouses at a value of roughly $3.125 million. For the purposes of this analysis, it is assumed that the land value attributed to the site is for unimproved land, except for the assumption that proper zoning is in place and public utilities are available. Table 8: Land Value Calculation Single Family Detached Townhouses Multifamily Max Units Average Sales Price/Rent per Unit $540,750 $367,500 $1,811 Average SF 2,400 1,950 1,080 Average Sales Price/Rent per SF $225 $188 $1.68 FAR Achieved Developer Return on Cost/Revenue 10% 10% 7% Levered IRR 36% 30% 20% Developer Profit $2,594,767 $3,306,030 $12,678,741 Hold Period (yrs) LAND VALUE $2,513,000 $3,125,000 $2,739,000 per unit $52,354 $34,722 $20,750 per acre $418,136 $519,967 $455,740 27
30 VI. MARKET ANALYSIS Since multifamily units have been determined to be the only financially feasible use for the site, we must also justify the need for rental units within the market landscape. According to Delta Associates Fourth Quarter Apartment Report, the demand for rental housing has moderated as job growth in the Baltimore MSA has cooled and supply has increased. The stabilized Class A vacancy has increased to 4.7% from 3.4% a year ago, which is still well below the national average of 6.1%. Average effective rents in the MSA are $1,362, up 1.3% from last year, primarily driven by the 3.6% increase in rents in the northern Baltimore suburbs. The supply pipeline metro-wide has recently trended downward with some 3,338 units planned to deliver in the next 36 months. Although the pipeline has moderated, Delta projects that supply will slightly exceed the number of units that will be absorbed over this 36 month time period. According to REIS, 11 sales for $273 million were recorded in 2008 for the Baltimore MSA. The mean sales price was $100,984 per unit, and the average cap rate fell to 6.9% from 7.8% in The Crofton/Gambrills/Odenton sub market has a limited number of multifamily properties, especially in the immediate vicinity of the subject property. The Class A properties that would compete with the site total approximately 2,409 units, and currently average 7.0% vacancy (See market survey in Rent Comp tab). The average rent is approximately $1,427. The most recent sale in the sub market is Keswick Park Apartments, which is located approximately 1.5 miles from the subject property. Keswick Park was built in 1991 and features 406 units. The asset was sold in June 2008 for $68.1 million ($168,000 per unit) on a reported 5.4% cap rate. For detailed information on rent and sales competitors, please refer to the Rent and Sales Comp Tabs. Taking a statistical approach to the supply and demand analysis, Table 9 below calculates that from 2008 to 2013 there will be an estimated net demand for an additional 557 multifamily units. This calculation is based on household formation in AAC, and the projected number of multifamily units currently either under construction or in the planning stages. Since the proposed project for the site is only for 132 multifamily units, the market should absorb this increase in supply with relative ease. 28
31 Table 9: Residential Demand for 1050 Route 3 South, Gambrills, MD Source Baltimore MSA Household Growth 974,067 1,015,723 1,049,552 1 Anne Arundel County Household Growth 178, , ,259 1 Projected Household Formation by ,692 multiplied by % of Multifamily Permits 43.2% 2 Total New Multifamily Units 2,459 multiplied by (Frictional Vacancy + Replacement) 10% 3 Total Gross Multifamily Demand 2,705 less Supply (under Construction & Planned): Annapolis Towne Centre Waugh Chapel Village Phase II Bembe Beach Road 56 4 Obery Court 64 4 Odenton Towne Centre and Surrounding Area 1,500 5 Total Supply Pipeline 2,148 Sub Market Demand/(Excess Supply) 557 Sources: 1. US Census Bureau: County Quick Facts; DemographicsNow.com 2. SOCDS Building Permits Database 3. Assuming 5% for each factor 4. REIS Apartment Asset Advisor, Q Independent Research - CBRE 29
32 VII. RISK ANALYSIS Market Risk The demand for multifamily apartments as an asset class drives the availability of investment capital for development, as well as reversion values. Financing Risk As of the writing of this study, there remains a lack of available construction financing from the credit markets. Construction Hard Cost Risk The pricing of materials continues to fluctuate as supply and demand for materials changes with market cycles. Public Water and Sewer Risk As mentioned in the Physically Possible section, the availability to extend the existing water and sewer pipes to the site remains a risk. The cost to extend the pipes from the current locations would most likely be cost prohibitive. The site is currently on well and septic, which would not support a high density residential use. Site Rezoning Risk The analysis has assumed that achieving a zoning change during the upcoming Comprehensive Zoning process is easily achieved. There remains a risk that the County Council, the Planning Advisory Board, or the Planning and Zoning staff disagree with the owner s reasoning for the zoning change. The current political environment could also have an impact on the decision. Environmental Risk The Reliable site to the north recently settled a lawsuit that claimed fly-ash on the site had contaminated ground water in the area. There is a risk that the subject property will have to go through a ground water remediation process. Route 3 Noise Risk The noise emanating from the traffic on Route 3 plus the noise from the Capitol Raceway racetrack, may exceed the 66 dba decibel threshold for residential development. If a noise study concludes noise levels above this limit, then the developer must implement noise mitigation measures to bring the decibel level below the threshold. Noise mitigation measures include increased setbacks and additional open space or landscaping requirements. Route 3 Boulevard Concept Risk The volume of traffic on Route 3 has increased significantly over the past decade. The State Highway Administration is currently reviewing a Boulevard concept, which would entail an auxiliary lane on the left side from Rt. 424 to Rt. 32. The risk is that the final design for Route 3 hiders the ingress and egress of the subject property. The SHA is projecting the completion of the planning stage by 2010 with project engineering to follow. 30
33 District Boundary Risk The subject property lies on the border of District 4 (Benoit) and District 7 (Reilly). There is a risk that the political climate for development varies between the districts, and the proximity to both boundaries will bring increased scrutiny from both council members. Subdivision Approval Risk If a subdivision approval is not granted due to failing the adequate public facilities test, the developer is required to wait six years before resubmitting the subdivision plans. Impact Fee Risk In 2008 Anne Arundel County Executive John Leopold helped pass legislation revising the current impact fee schedule. The revisions put the residential impact fees on a sliding scale by square footage, and also set the fees for the next three years. The 2009 base fees will double by 2010, and will go up by a factor of 5 by For a 1000 SF unit: $1,532; $3,065; $7,
34 VIII. CONCLUSIONS/RECOMMENDATIONS The subject property s location in Anne Arundel County, Maryland and proximity to both Baltimore and Washington, DC make the site an attractive investment opportunity for residential developers. The property is one of the last remaining parcels of land with significant frontage along the Route 3 corridor that has yet to be developed as a higher use. In the highest and best use section of the study, it was determined that the townhouse scenario would produce the highest land value for the site; However, since developing for-sale product is not currently financially feasible, multifamily apartments are deemed to be the highest and best use. As mentioned previously, the current R1 zoning will have to be changed to R22 in order to accommodate the use of multifamily units on the site. Given the current timing of the 2008 GDP, the owner should engage a land-use attorney this summer to assist with the application for rezoning during the Comprehensive Zoning process, which is anticipated to occur in the fall of Additionally, a civil engineer should also be engaged at this time to perform a feasibility study on the types of uses the site will allow for, including the ability and cost to extend public water and sewer to the property. The combined cost of the attorney and civil engineer are approximately $20,000. It is important to note that the site s current use as a go-kart track is the highest and best use for the R1 zoning. The site s ability to produce cash flow will prove to be beneficial as the apartment development scenario is vetted. A change in zoning will not affect the current use. The site s neighborhood has changed to retail and commercial oriented uses over the past decade to absorb the consumer demand from the affluent community. The focus on investment in retail and commercial uses coupled with a healthy increase in population has led to a shortage of multifamily rental units in the subject s area. The site s owner should take advantage of the in-balance between supply and demand of rental units and begin discussions with potential apartment developers. Additionally, the site s proximity to the planned Waugh Chapel Phase II will prove to be a boon to the site s development potential. The Waugh Chapel development is primarily retail oriented with a grocery store anchor, which will serve the apartment renters well. The Phase II will also bring the public water and sewer lines closer to the subject property, making the extension to the site less costly. The owner should also investigate the potential to assemble more land from the adjacent lots. The parcels of land to the south of the property total roughly six acres, which would effectively double the current site acreage, and thus, the max number of rental units. At a total of 12 acres, the combined site could potentially allow for 264 apartment units. Since there are certain fixed costs associated with developing 32
35 a garden-style apartment complex, an increase in units creates economies of scale as well as additional revenue. The reduced development costs and increased revenue would in turn produce a higher land value. In order to facilitate a combined redevelopment, the zoning of the south parcels would also need to be changed from R1 to R22. 33
36 IX. REFERRENCES Interviews: David Sislen, Real Estate Entrepreneur; Bristol Capital Corporation; April 16, 2009 and March 25, John Igbinovia, Planning and Zoning Engineer; AAC Planning and Zoning Office; April 15, 2009 Matthew Morgan, Civil Engineer; Morris & Ritchie Associates; April 14, Harry Blumenthal, Land-Use Attorney; Blumenthal, Delavan & Williams, P.A.; April 13, Gretchen Dudney, Development Consultant; March 30, Tom Martens, Market Study Consultant; Economics Research Associates; March 30, David Plott, Land-Use Attorney; Linowes and Blocher, LLP; March 30, Vivian Marsh, Development Review for Waugh Chapel Phase II; AAC Planning and Zoning Office; March 16, Mike Fox, Long-Rang Planning; AAC Planning and Zoning Office; March 6, 2009 and February 11, Web: consulting.com/clients.htm State Highway Administration
37 Literature: Joseph J. Blake and Associates, Inc., Market Demographics. REIS, Apartment Asset Advisor Q Maryland Land Use Guide, 1992 & Adequate Public Facility Ordinances in Maryland, The Appraisal of Real Estate, 12th Edition, by the Appraisal Institute. Delta Associates, Q4 Apartment and Condo Market. Research Issues in Real Estate, Volume 6, Essays in Honor of James Graaskamp: 10 Years After, edited by James Delisle and Elaine Worzala. Korpacz Real Estate Investor Survey, Q Fulton Research, Residential Market Trends Q
38 TAB 1: PROFORMAS
39 SINGLE FAMILY DETACHED
40 RACEWAY SINGLE FAMILY DETACHED 48 UNITS 30-Apr-09 PROFIT SUMMARY PERCENT TOTAL OF REVENUE TOTAL PER UNIT TOTAL SALES PRICE - BASE UNIT 95.24% 24,720, ,000 TOTAL OPTION REVENUE 4.76% 1,236,000 25,750 TOTAL SALES PRICE - GARAGES/STORAGE UNITS 0.00% TOTAL SALES PROCEEDS % 25,956, , DEVELOPMENT COSTS 6.86% 1,780,585 37,096 SALES COSTS 8.85% 2,296,492 47,844 FINANCING COSTS 4.50% 1,167,190 24,316 FINISHED PAD COSTS 18.67% 4,845, ,938 STRUCTURES COSTS 39.84% 10,339, ,411 OPTION COSTS 3.53% 915,556 19,074 DEVELOPMENT FEE 2.00% 519,120 10,815 PROFIT RESERVE 4.21% 1,092,627 22,763 SETTLEMENT COSTS 1.56% 404,940 8, TOTAL PROJECT COSTS 90.00% 23,361, , TOTAL PROJECT PROFIT 10.00% 2,594,767 54,058 =========== =========== =================== RETURN ON REVENUE 10.00% RETURN ON REVENUE =========== INCLUDING FEES DEVELOPER IRR 36.04% ===========
41 RACEWAY SINGLE FAMILY DETACHED 30-Apr-09 Version 33 03/28/07 UNITS(DETAIL BELOW) 48 OPTION REVENUE AS A % OF BASE REVENUE 5.00% CONSTRUCTION LOAN APR 6.50% OPTION COST OF GOODS SOLD % 65% 2ND TRUST LOAN HARD COST/SQ.FT. $70 2ND TRUST LOAN APR EQUITY RETURN RATE 8.00% LOAN TO VALUE (not including land) 75% $1,347,514 THIRD PARTY EQUITY RATE LAND ESCALATOR VARIABLE CORE FACTOR MAXIMUM CUMULATIVE A&D LOAN BALANCE $2,636,677 SALES FEE 1.50% MAXIMUM CUMULATIVE CONSTR. LOAN BALANCE $3,638,639 SELLER POINTS/CLOSING COSTS 1.50% MAXIMUM CUMULATIVE LOAN BALANCE $6,275,316 ADDTL EACH SETTLEMENT (OUTSIDE BROKER) $ - MINIMUM CUMULATIVE WORKING CAPITAL/PROFIT $12,612 % OF SALES USING A BROKER COOP 50.00% SALES REVENUE ESCALATION (ANNUAL RATE) 0.00% SALES PER MONTH 2.00 SALES START DATE 1 SALES ACTIVITY DURATION 24 SITE START DATE 1 SITE ENDING DATE 22 CONSTRUCTION ACTIVITY DURATION 19 PROJECT DURATION 27 CLOSING MONTH Jan-10 AVERAGE TOTAL SALES PRICE 540,750 REPAYMENT % ON TOTAL SALES PRICE - BANK OF AMERICA % REPAYMENT PER UNIT - CONSTRUCTION 418,931 REPAYMENT PER UNIT - A&D 121,819 DEVELOPER EQUITY CONTRIBUTION 3,715,000 DEVELOPER PROFIT SHARE % 3RD PARTY EQUITY CONTRIBUTION 3RD PARTY PROFIT SHARE GENERAL REQUIREMENTS/MONTH 68,000 MONTHS TO MONTH MONTH Notes UNIT DELIVERY SCHEDULE UNITS COMPL START COMPL BUILDING BUILDING BUILDING BUILDING BUILDING BUILDING BUILDING BUILDING BUILDING 9 0 X X X 0 BUILDING 1 X X X 0 BUILDING 11 0 X X X 0 BUILDING 12 0 X X X 0 BUILDING 13 0 X X X 0 BUILDING 14 0 X X X 0 BUILDING 15 0 X X X 0 BUILDING 16 0 X X X 0 BUILDING 17 0 X X X 0 BUILDING 18 0 X X X 0 BUILDING 19 0 X X X 0 BUILDING 2 X X X 0 BUILDING 21 0 X X X 0 BUILDING 22 0 X X X 0 BUILDING 23 0 X X X 0 BUILDING 24 0 X X X 0 BUILDING 25 0 X X X =========
42 PROFITABILITY ASSUMPTIONS 48 UNITS TOTAL SALES ASSUMPTIONS: UNIT SALES SALES AVERAGE PRICE NET SELLABLE UNIT TYPES: UNITS SQ FT PRICE PRICE PER UNIT PER SQ. FT SQ FT 100' Lot Size 48 2, ,000 24,720, ,200 Notes ,720, , ,200 Total 0 Unsellable Sq. Ft. 115,200 Gross Sellable Sq. Ft 2,400 Avg Unit Size 215 Avg. Price Per Sq. Ft. OPTION REVENUE 1,236,000 25,750 5% of Avg. Sales Price STRUCTURED PARKING EXTERNAL GARAGES 0 STORAGE UNITS TOTAL SALES REVENUE 25,956, ,750 =========== ========== TOTAL SALES REVENUE WITH ESCALATOR 25,956,000 ===========
43 COST ASSUMPTIONS: Notes DEVELOPMENT COSTS Architecture and Engineering Structural Engineering 90,000 Structural Inspections 10,000 MEP Engineering 125,000 Utility Design 10,000 Architectural 415,000 Architectural - 3rd Party Review (includes Fair Housing Compliance) 25,000 Fire Protection 10,000 Reproduction Costs 15,000 Civil Engineering 125,000 Soil Testing 15,000 Environmental 5,000 Wetlands Testing 5,000 Landscape/ Land Design 20,000 Traffic 10,000 MEP Inspections 15,000 Energy Star Testing & Certification 3,500 Architectural Inspections 10,000 Sound Engineering 10,000 Architectural Redesign/Upgrade 0 Interior Design/FFE - Furniture, Fixtures, Equipment 0 Land Use Legal 20,000 Legal - Other 25,000 Accounting 11,475 Real Estate Tax 75,000 Business License Tax MD 300 General Liability Insurance 428,274 Builder Risk Insurance 40,320 Bonds 1% of Site Work 15,000 Title and Recording 2.00% percentaqe of land cost 50,260 Systems Charge 9,456 Development Salaries $ 6, ,000 Owner Contingency 0% 0 Misc. Development Costs 25, TOTAL DEVELOPMENT COSTS 1,780,585 37, SALES COSTS Sales Center Set Up 10,000 Sales Center Expenses 115,000 Model Set Up Model Expenses 325,000 Brochures 60,000 Advertising 375,000 Sales Salaries 450,000 Photography / Artwork 7,500 Corporate Marketing 25,000 Seller's Costs Broker Co-op Fee 3.0% 389,340 Points & Closing Costs 389,340 Association Fees & Expenses 36,000 R.W.C. Warranties 51,912 Seller's Contributions 19,200 Design Center Expenses 43, TOTAL SALES COSTS 2,296,492 47, Notes FINANCING COSTS Interest 330,914 Origination Fee 50 Basis Pts. 84,940 Extension Fees due at month Extension Fees due at month 0 Extension Fees due at month 0 Extension Fees due at month 0 Extension Fees due at month 0 Extension Fees due at month 0 Extension Fees due at month 0 Extension Fees due at month 0 Extension Fees due at month 0 Letter of Credit Fees X Bank Inspection Fees per month $ 300 5,700 Appraisal 6,000 Loan Legal 20,000 Development Loan Interest 75,000 2nd Trust Loan Interest 0 0 Developer Equity Return 643,933 3rd Party Equity Return 0 Bank Service Charges/Interest Income TOTAL FINANCING COSTS 1,167,190 24,
44 FINISHED PAD COSTS Escalator % Amount LAND 1 2,513,000 2,513, ,354 LAND due at month LAND due at month LAND due at month LAND due at month LAND due at month LAND due at month LAND due at month LAND due at month LAND due at month LAND KICKER due at month 1 DEFERRED PAYMENT 0.00% LAND BROKER PERMITS AND FEES 17,334 Tap Fees 561,600 $11,700 per unit SDC Charges Impact Fees 170,415 From AAC Building Permit Fee Schedule Misc. Permits & Fees 50,000 Rec Facilities Fees Advertising Fees 50,000 Site Permit Service Fee 0 SITE IMPROVEMENTS - per construction feasibilty 1,500,000 31, TOTAL FINISHED PAD COSTS 4,845, , STRUCTURES COSTS STRUCTURES - per construction feasibility 8,064, ,000 $70 PSF STRUCTURED PARKING - per construction feasibility EXTERNAL GARAGES - per construction feasibility CLUBHOUSE - per construction feasibility GENERAL REQUIREMENTS - per construction feasibility $ 68,000 1,700,000 35,417 PERMITS AND FEES 1,179 Building Permits 56, % of value above $25,000 Permit Service Fee Permits and Fees - GARAGES Permits and Fees - CLUBHOUSE BUILDER'S OVERHEAD 519,120 10, TOTAL STRUCTURES COSTS 10,339, , OPTION COSTS 915,556 19, DEVELOPMENT FEE 519,120 10, PROFIT RESERVE Original Feasibility 5% of Total Costs 1,092,627 22, SETTLEMENT COSTS Sales Fees - 1.5% 389,340 Development Overhead Fees - $600/unit 0 Settlement Department Fees - $325/unit 15,600 Warranty Fund - $250/unit 0 Customer Service Fund % less warranty fee TOTAL SETTLEMENT COSTS 404,940 8, TOTAL PROJECT COSTS 23,361, ,692 ========== ==========
45 TOWNHOUSES
46 RACEWAY TOWNHOMES 90 UNITS 30-Apr-09 PROFIT SUMMARY PERCENT TOTAL OF REVENUE TOTAL PER UNIT TOTAL SALES PRICE - BASE UNIT 95.24% 31,500, ,000 TOTAL OPTION REVENUE 4.76% 1,575,000 17,500 TOTAL SALES PRICE - GARAGES/STORAGE UNITS 0.00% TOTAL SALES PROCEEDS % 33,075, , DEVELOPMENT COSTS 6.02% 1,990,503 22,117 SALES COSTS 7.89% 2,610,400 29,004 FINANCING COSTS 5.01% 1,657,813 18,420 FINISHED PAD COSTS 17.98% 5,948,415 66,094 STRUCTURES COSTS 43.78% 14,479, ,879 OPTION COSTS 3.53% 1,166,667 12,963 PROFIT RESERVE 4.20% 1,390,663 15,452 SETTLEMENT COSTS 1.59% 525,375 5, TOTAL PROJECT COSTS 90.00% 29,768, , TOTAL PROJECT PROFIT 10.00% 3,306,030 36,734 =========== =========== ================== RETURN ON REVENUE 10.00% RETURN ON REVENUE =========== INCLUDING FEES DEVELOPER IRR 30.43% ===========
47 RACEWAY TOWNHOMES 30-Apr-09 Version 33 03/28/07 UNITS(DETAIL BELOW) 90 OPTION REVENUE AS A % OF BASE REVENUE 5.00% CONSTRUCTION LOAN APR 6.50% OPTION COST OF GOODS SOLD % 65% 2ND TRUST LOAN HARD COST/SQ.FT. $70 2ND TRUST LOAN APR EQUITY RETURN RATE 8.00% LOAN TO VALUE (not including land) 75% $1,518,532 THIRD PARTY EQUITY RATE LAND ESCALATOR VARIABLE CORE FACTOR MAXIMUM CUMULATIVE A&D LOAN BALANCE $2,597,698 SALES FEE 1.50% MAXIMUM CUMULATIVE CONSTR. LOAN BALANCE $5,790,823 SELLER POINTS/CLOSING COSTS 1.50% MAXIMUM CUMULATIVE LOAN BALANCE $8,381,400 ADDTL EACH SETTLEMENT (OUTSIDE BROKER) $ - MINIMUM CUMULATIVE WORKING CAPITAL/PROFIT $27,099 % OF SALES USING A BROKER COOP 50.00% SALES REVENUE ESCALATION (ANNUAL RATE) 0.00% SALES PER MONTH 3.00 SALES START DATE 1 SALES ACTIVITY DURATION 30 SITE START DATE 1 SITE ENDING DATE 23 CONSTRUCTION ACTIVITY DURATION 26 PROJECT DURATION 33 CLOSING MONTH Jan-10 AVERAGE TOTAL SALES PRICE 367,500 REPAYMENT % ON TOTAL SALES PRICE - BANK OF AMERICA % REPAYMENT PER UNIT - CONSTRUCTION 303,006 REPAYMENT PER UNIT - A&D 64,494 DEVELOPER EQUITY CONTRIBUTION 4,610,000 DEVELOPER PROFIT SHARE % 3RD PARTY EQUITY CONTRIBUTION 3RD PARTY PROFIT SHARE GENERAL REQUIREMENTS/MONTH 68,000 MONTHS TO MONTH MONTH Notes UNIT DELIVERY SCHEDULE UNITS COMPL START COMPL BUILDING BUILDING BUILDING BUILDING BUILDING BUILDING BUILDING BUILDING BUILDING BUILDING BUILDING BUILDING BUILDING BUILDING BUILDING BUILDING 16 0 X X X 0 BUILDING 17 0 X X X 0 BUILDING 18 0 X X X 0 BUILDING 19 0 X X X 0 BUILDING 2 X X X 0 BUILDING 21 0 X X X 0 BUILDING 22 0 X X X 0 BUILDING 23 0 X X X 0 BUILDING 24 0 X X X 0 BUILDING 25 0 X X X =========
48 PROFITABILITY ASSUMPTIONS 90 UNITS TOTAL SALES ASSUMPTIONS: UNIT SALES SALES AVERAGE PRICE NET SELLABLE UNIT TYPES: UNITS SQ FT PRICE PRICE PER UNIT PER SQ. FT SQ FT 16'x40' front loaded, integral garage 45 1, ,000 14,625, ,500 22'x40' front loaded, integral garage 45 2, ,000 16,875, ,000 Notes ,500, , ,500 Total 0 Unsellable Sq. Ft. 175,500 Gross Sellable Sq. Ft 1,950 Avg Unit Size 181 Avg. Price Per Sq. Ft. OPTION REVENUE 1,575,000 17,500 5% of Avg. Sales Price STRUCTURED PARKING EXTERNAL GARAGES 0 STORAGE UNITS TOTAL SALES REVENUE 33,075, ,500 =========== ========== TOTAL SALES REVENUE WITH ESCALATOR 33,075,000 ===========
49 COST ASSUMPTIONS: Notes DEVELOPMENT COSTS Architecture and Engineering Structural Engineering 90,000 Structural Inspections 10,000 MEP Engineering 125,000 Utility Design 10,000 Architectural 415,000 Architectural - 3rd Party Review (includes Fair Housing Compliance) 25,000 Fire Protection 10,000 Reproduction Costs 15,000 Civil Engineering 125,000 Soil Testing 15,000 Environmental 5,000 Wetlands Testing 5,000 Landscape/ Land Design 20,000 Traffic 10,000 MEP Inspections 15,000 Energy Star Testing & Certification 3,500 Architectural Inspections 10,000 Sound Engineering 10,000 Architectural Redesign/Upgrade 0 Interior Design/FFE - Furniture, Fixtures, Equipment 0 Land Use Legal 20,000 Legal - Other 25,000 Accounting 14,025 Real Estate Tax 75,000 Business License Tax MD 300 General Liability Insurance 545,738 Builder Risk Insurance 73,710 Bonds 1% of Site Work 15,000 Title and Recording 2.00% percentaqe of land cost 62,500 Systems Charge 17,730 Development Salaries $ 6, ,000 Owner Contingency 0% 0 Misc. Development Costs 25, TOTAL DEVELOPMENT COSTS 1,990,503 22, SALES COSTS Sales Center Set Up 10,000 Sales Center Expenses 115,000 Model Set Up Model Expenses 325,000 Brochures 60,000 Advertising 375,000 Sales Salaries 450,000 Photography / Artwork 7,500 Corporate Marketing 25,000 Seller's Costs Broker Co-op Fee 3.0% 496,125 Points & Closing Costs 496,125 Association Fees & Expenses 67,500 R.W.C. Warranties 66,150 Seller's Contributions 36,000 Design Center Expenses 81, TOTAL SALES COSTS 2,610,400 29, Notes FINANCING COSTS Interest 454,667 Origination Fee 50 Basis Pts. 109,568 Extension Fees due at month Extension Fees due at month 37 (0) Extension Fees due at month 0 Extension Fees due at month 0 Extension Fees due at month 0 Extension Fees due at month 0 Extension Fees due at month 0 Extension Fees due at month 0 Extension Fees due at month 0 Letter of Credit Fees X Bank Inspection Fees per month $ 300 7,800 Appraisal 6,000 Loan Legal 20,000 Development Loan Interest 75,000 2nd Trust Loan Interest 0 0 Developer Equity Return 983,467 3rd Party Equity Return 0 Bank Service Charges/Interest Income TOTAL FINANCING COSTS 1,657,813 18,
50 FINISHED PAD COSTS Escalator % Amount LAND 1 3,125,000 3,125, ,722 LAND due at month LAND due at month LAND due at month LAND due at month LAND due at month LAND due at month LAND due at month LAND due at month LAND due at month LAND KICKER due at month 1 DEFERRED PAYMENT 0.00% LAND BROKER PERMITS AND FEES 14,705 Tap Fees 1,053,000 $11,700 per unit SDC Charges Impact Fees 170,415 From AAC Building Permit Fee Schedule Misc. Permits & Fees 50,000 Rec Facilities Fees Advertising Fees 50,000 Site Permit Service Fee 0 SITE IMPROVEMENTS - per construction feasibilty 1,500,000 16, TOTAL FINISHED PAD COSTS 5,948,415 66, STRUCTURES COSTS STRUCTURES - per construction feasibility 12,285, ,500 $70 PSF STRUCTURED PARKING - per construction feasibility EXTERNAL GARAGES - per construction feasibility CLUBHOUSE - per construction feasibility GENERAL REQUIREMENTS - per construction feasibility $ 68,000 2,108,000 23,422 PERMITS AND FEES 957 Building Permits 86, % of value above $25,000 Permit Service Fee Permits and Fees - GARAGES Permits and Fees - CLUBHOUSE BUILDER'S OVERHEAD TOTAL STRUCTURES COSTS 14,479, , OPTION COSTS 1,166,667 12, DEVELOPMENT FEE PROFIT RESERVE Original Feasibility 5% of Total Costs 1,390,663 15, SETTLEMENT COSTS Sales Fees - 1.5% 496,125 Development Overhead Fees - $600/unit 0 Settlement Department Fees - $325/unit 29,250 Warranty Fund - $250/unit 0 Customer Service Fund % less warranty fee TOTAL SETTLEMENT COSTS 525,375 5, TOTAL PROJECT COSTS 29,768, ,766 ========== ==========
51 APARTMENTS
52 RACEWAY APARTMENTS PREPARED BY: Callahan Anne Arundel County, MD DATE: 30-Apr-09 ASSUMPTIONS Project Number Number of Dwelling Units 132 Gross Square Feet 171,060 1,296 gsf on average 1,080 nrsf on average ESCALATION RATES (Enter as Decimal): Current to Stabilized - Rents 0.00% Current to Stabilized - Expenses 0.00% DATES (Use formula) After Stabilization - Rents 3.00% All start dates assume first day of month After Stabilization - Expenses 3.00% All completion dates assume the last day of the month Preferred Equity Rate 10.00% Preferred Equity Accrual Date 3 (1=Const Closing,2=Const Compl,3=Stabilization) Investor Investment Percent % Developer Investment Percent 0.00% Investor Cash Flow Percent 50.00% Developer Cash Flow Percent 50.00% Construction Start 01-Jan-10 Const Loan Interest Cutoff 01-Jan-12 Current Year - Rents 01-Apr Jan-10 = Construction Start Current Year - Expenses 01-Apr-09 9 = Months to Const. Start Stabilized Year - Rents 01-Jan = No. of Months in Construction Period Stabilized Year - Expenses 01-Jan = Mos. to Stabilized Year - Rents Const Loan Interest Rate % 37 = Mos. to Stabilized Year - Expenses Perm Loan Interest Rate % = Escalation Rate to Stabilized Year - Rents Construction Loan Fees 0.00% = Escalation Rate to Stabilized Year - Expenses Permanent Loan Fees 2.00% Equity Fees 0.00% Lease Start: 8/4/2011 Management Fee Rate 3.50% Units per M: 15 Vacancy at Stabilization 5.00% Months to St: 8.80 Replacement Reserve/Unit 556 Stabilization: 4/24/2012 Average O/S Bal-Const Loan 55.00% Average O/S Bal-Equity % Interest Only(yrs) 0 Length of Perm Financing(yrs) 40 Construction Contingency and Fees Percentages: Contingency 5.00% Builder O/H 2.00% Builder Fee 4.00% Developer Fee 3.00% SCROLL DOWN AND INPUT INTO HIGHLIGHTED AREAS 1/7
53 :: RACEWAY APARTMENTS Anne Arundel County, MD UNIT RENTS CURRENT SURVEY RENTS NET MONTHLY TOTAL RENT TOTAL RENTABLE RENT MONTHLY PER RENTABLE TYPE OF UNIT UNITS SQ FT PER UNIT RENT SQ FT SQ FT RENTAL REVENUES: 1 BR/1BA 35% ,350 62, ,800 2 BR/2BA 52% 69 1,200 1, , ,800 3 BR/2BA 13% 17 1,350 2,200 37, , RENT PREMIUMS: UNITS AMOUNT/UNIT PER MONTH Fireplace 45% ,500 Views 45% Levels 45% Balconies 0% GROSS MONTHLY RENTS 132 (TOTAL UNITS) 239, ,550 ============ =========== ========== AVERAGES 1,080 (S.F.) 1,811 (RENT/UNIT) 1.68 WITH premiums ============ =========== ========== OTHER REVENUE: GROSS ANNUAL RENTS 2,868,900 =========== Misc Income ,920 Retail Space.0 Parking OTHER MONTHLY REVENUES 7,920 =========== ========== OTHER ANNUAL REVENUE 95,040 2,963,940 GROSS ANNUAL REVENUE =========== ========== 2/7
54 :: RACEWAY APARTMENTS Anne Arundel County, MD CURRENT EXPENSES PER UNIT CURRENT PER PER ENTRY EXPENSE SQ FT UNIT OPERATING EXPENSES: Rental Expense , Salary Expense 1, , ,350 Administrative Expenses , Maintenance Expense , Mgmt Fee % , Total Controllable 441, , Utilities , Taxes 2, , ,000 Insurance , Other 50 6, Total Operating Exp. 801, , OTHER TRANSACTIONS: Replacement Reserve/Unit 73, Other Total Other Transaction 73, TOTAL EXPENSES 875, ,629 ============ ============ =========== TOTAL CONTROLLABLE EXPENSES 441, ,348 ============ ============ =========== TOTAL NON-CONTROLLABLE EXPENSES 433, ,281 ============ ============ =========== 3/7
55 :: RACEWAY APARTMENTS Anne Arundel County, MD NOI SUMMARY CURRENT STABILIZED Apr-09 Jan-13 OPERATING REVENUE: Gross Rental Revenue 2,868,900 2,868,900 Less Vacancy 5.00% 143, ,445 Net Rental Revenue 2,725,455 2,725,455 Other Revenue 95,040 95, Total Operating Revenue 2,820,495 2,820, OPERATING EXPENSES: Rental Expense 39,600 39,600 Salary Expense 178, ,200 Administrative Expenses 39,600 39,600 Maintenance Expense 85,800 85,800 Management Fee 98,717 98, Total Controllable 441, , Utilities 59,400 59,400 Taxes 264, ,000 Insurance 29,700 29,700 Other 6,600 6, Total Operating Expense 801, , OTHER TRANSACTIONS: Replacement Reserve 73,392 73,392 Other Total Other Transaction 73,392 73, TOTAL EXPENSES 875, , NET OPERATING INCOME 1,945,486 1,945,486 ============ ============ RETURN ON COST 7.0% 7.0% ============ ============ :: CURRENT STABILIZED 4/7
56 RACEWAY APARTMENTS Anne Arundel County, MD SOURCES AND USES PROJECT % REPC BUDGET PER UNIT PER SQ FT COST SOURCES: Construction Loan 24,450, , % 0 24,477,370 Replacement Cost (90%) First Mortgage 24,450, , % % 24,851,815 Debt Service Ratio (1.11%) Capital Contributions 3,368,913 25, % 7.053% Constant Developer Contributions % Other % Land 2,739, % Other % Dev Fee.00% Other % Total 2,739,000 Construction Loan Repayment (24,450,000) (185,227) % TOTAL SOURCES 27,818, , % USES: CONSTRUCTION CONTRACT: 01 General Requirements % 02 Site Improvements 1,200,000 9, % 03 Structures 12,540,000 95, % 04 Clubhouse % 05 Accessory Structures % 06 Garage % 07 Other Costs % Subtotal 13,740, , % 22 Bonds 100, % 24 Permits Tap & Other Fees % 25 Change Orders % 26 Cost Escalation % 27 Contingency 5.00% 687,000 5, % Subtotal 14,527, , % 28 Off-Site Contribution % 29 Builder's O/H 2.00% 291,000 2, % 29 Builder's Fee 4.00% 593,000 4, % Construction Contract 15,411, , % OWNERS CONSTRUCTION COSTS 30 Permits Tap & Other Fees 1,848,000 14, % 30 Off-Site Contribution % 30 Upgraded Unit Finishes % 30 Clubhouse Furnishings 350,000 2, % 30 Contingency 850,000 6, % 30 Owners Construction Costs 3,048,000 23, % DESIGN & ENGINEERING: 51 Design 850,000 6, % 51 Engineering 250,000 1, % 51 Reproduction 50, % 51 Fair Housing/Peer Review 10, % 51 Inspection 50, % 51 Contingency 100, % 51 Design & Engineering 1,310,000 9, % 5/7
57 :: PROJECT % REPC BUDGET PER UNIT PER SQ FT COST FINANCING FEES & INTEREST Const Period Interest 1,636,113 12, % 52 Const Period Equity Return % 52 Development Loan Int Expense 100, % 52 Const Loan Fees 0.00% % 52 Perm Loan Fees 2.00% 489,000 3, % 52 Equity Fees 0.00% % 52 Letter of Credit Fees 50, % 52 Lender Inspect/Engineering 35, % 52 Interest Income % 52 Contingency % 52 Other % Financing Fees & Interest 2,310,113 17, % DEVELOPERS COSTS: 53 Real Estate Taxes 200,000 1, % 53 Insurance 250,000 1, % 53 Title and Recording 375,000 2, % 53 Legal-Const Loan Closing 75, % 53 Legal-Perm Loan Closing 75, % 53 Zoning / Land Use 100, % 53 Development Travel 5, % 53 Miscellaneous Costs 10, % 53 Cost Certification 35, % 53 Tax Returns-Accounting 15, % 53 Appraisal 16, % 53 Marketing Costs 132,000 1, % 53 Contingency 250,000 1, % 53 Prepaid R/E Taxes 500,000 3, % 53 Lease-up Fee 52, % Developers Costs 2,090,800 15, % OPERATING RESERVE: 55 Operating Deficit Reserve 100, % LAND: 57 Land 2,739,000 20, % 20,750 DEVELOPERS FEE: 58 Developer's Fee 3.00% 810,000 6, % TOTAL REPLACEMENT COST 27,818, , % EXCESS (SHORTFALL) % ============ ============ =========== =========== 6/7
58 :: RACEWAY APARTMENTS Anne Arundel County, MD 10 YEAR PROFORMA STABILIZED Jan-13 Jan-14 Jan-15 Jan-16 Jan-17 Jan-18 Jan-19 Jan-20 Jan-21 Jan Gross Rental Revenues 2,868,900 2,954,967 3,043,616 3,134,924 3,228,972 3,325,841 3,425,616 3,528,384 3,634,236 3,743,263 Less 5.00% 143, , , , , , , , , ,163 Net Rental Revenue 2,725,455 2,807,219 2,891,435 2,978,178 3,067,523 3,159,549 3,254,335 3,351,965 3,452,524 3,556,100 Other Income 95,040 97, , , , , , , , , Operating Income 2,820,495 2,905,110 2,992,263 3,082,031 3,174,492 3,269,727 3,367,818 3,468,852 3,572,918 3,680,106 Operating Expenses 801, , , , , , , ,888 1,015,465 1,045,929 Other Transactions (Repl Res) 73,392 73,392 73,392 73,392 73,392 73,392 73,392 73,392 73,392 73, Total Expenses 875, , , , ,619 1,002,686 1,030,565 1,059,280 1,088,857 1,119, NOI (Before Debt Service) 1,945,486 2,006,052 2,068,435 2,132,690 2,198,873 2,267,041 2,337,253 2,409,572 2,484,061 2,560, Fixed Debt Service 1,741,881 1,741,881 1,741,881 1,741,881 1,741,881 1,741,881 1,741,881 1,741,881 1,741,881 1,741,881 Other Debt Service Reserves CASH FLOW AFTER DEBT SERVICE 203, , , , , , , , , ,904 ============ ============ =========== =========== ========== ========== ========= ========= ========= ============= Debt Service Coverage Return on Equity 6.04% 7.84% 9.69% 11.60% 13.56% 15.59% 17.67% 19.82% 22.03% 24.31% Sale YR 10 Exit Cap 7.5% Disposition Value 35,197,467 Sales Cost 3.0% (1,055,924) Net Residual 34,141,543 Debt Repayment (23,085,331) Net Residual after Debt Repay 11,056,212 UNLEVERED IRR 9.35% (27,818,913) 1,945,486 2,006,052 2,068,435 2,132,690 2,198,873 2,267,041 2,337,253 2,409,572 2,484,061 36,702,328 LEVERED IRR 20.48% (3,368,913) 203, , , , , , , , ,180 11,875,116 7/7
59 TAB 2: MAPS

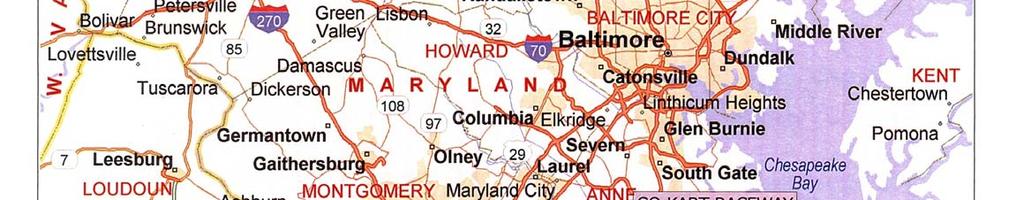
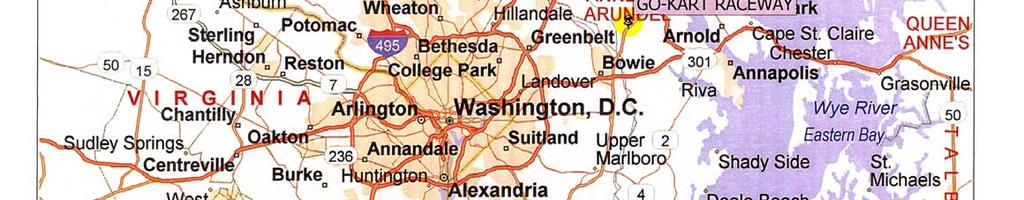
60 Map 1: Regional View
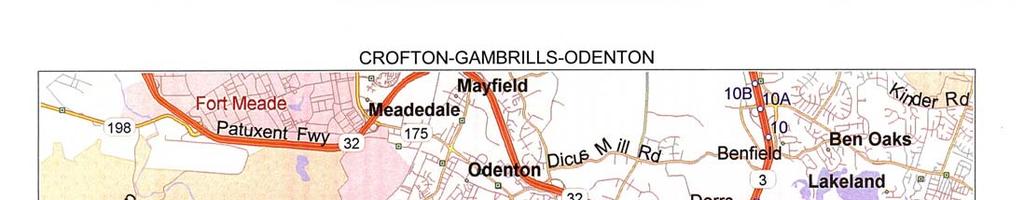
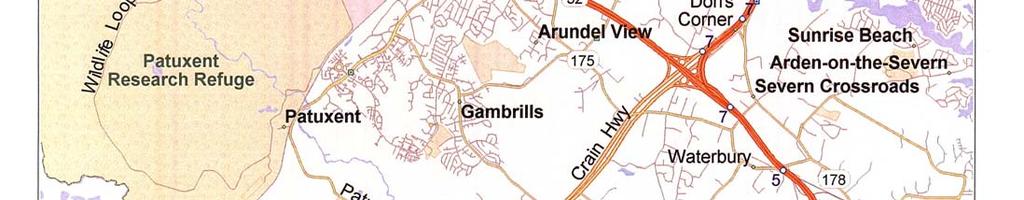
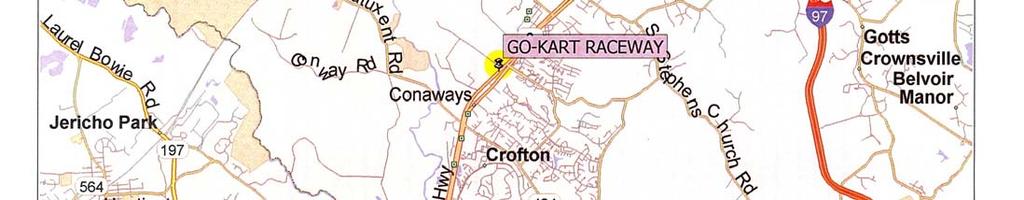
61 Map 2: Crofton-Gambrills-Odenton
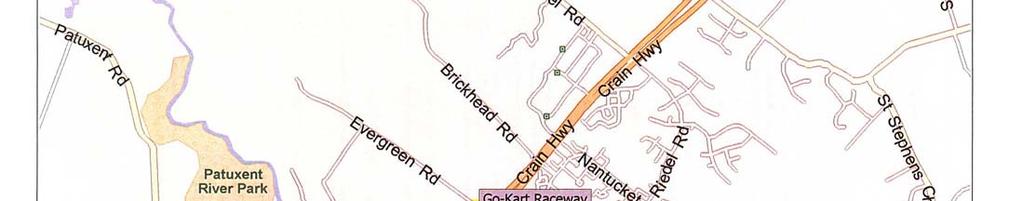
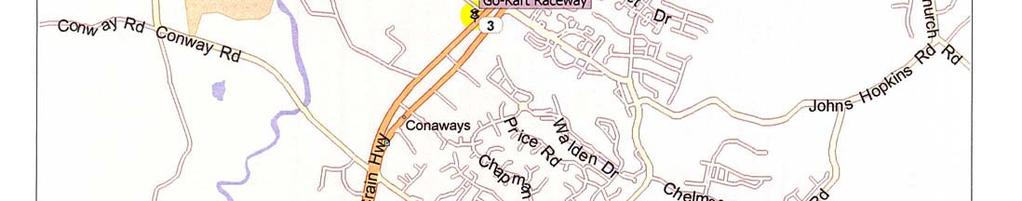

62 Map 3: Neighborhood


63 Map 4: Land Parcels Parcel Acres 187,308 SF Parcel Acres 24,829 SF Parcel Acres 49,658 SF
 Creek East Adjacent Use: Shoreline Seafood (C3) East Adjacent Use: 7-11 Gas Station (C4) South Adjacent Use: 4 Single Family Detached Houses (R1) East Adjacent Use: Pizza Hut")
64 Map 5: Surrounding Uses North Adjacent Use: Wooded, Vacant Land (R1) Reliable Contracting Plant Future Site of Waugh Chapel Village Phase II (MXD-C) West Adjacent Use: Wooded, Vacant Land (R1) Subject Property (R1) Creek East Adjacent Use: Shoreline Seafood (C3) East Adjacent Use: 7-11 Gas Station (C4) South Adjacent Use: 4 Single Family Detached Houses (R1) East Adjacent Use: Pizza Hut (C3) East Adjacent Use: Auto Repair (C3) East Adjacent Use: Boston Market (C3) East Adjacent Use: Wendy s (C3)

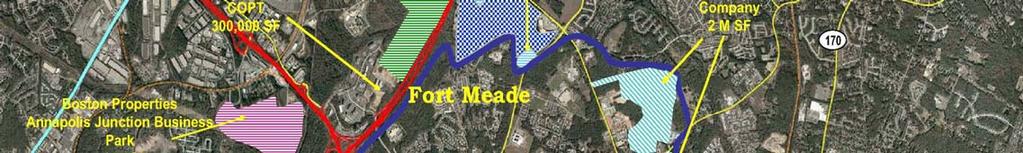
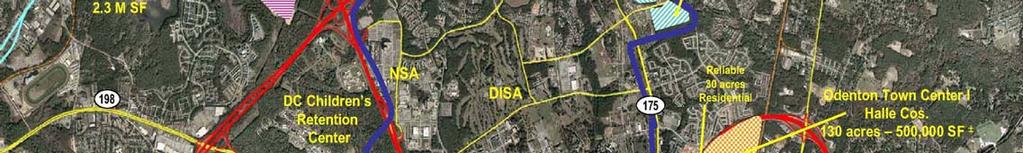
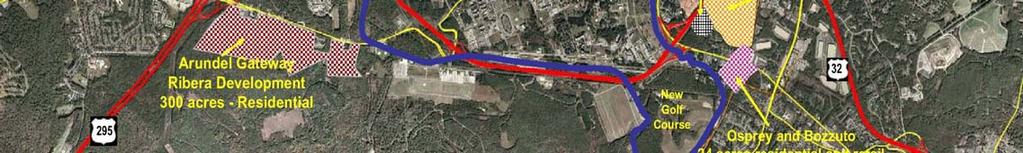
65 Map 6: BRAC

66 Map 7: MARC Train Service Subject Property

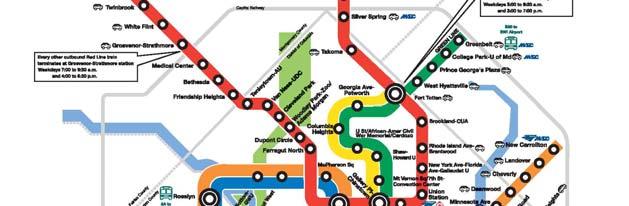
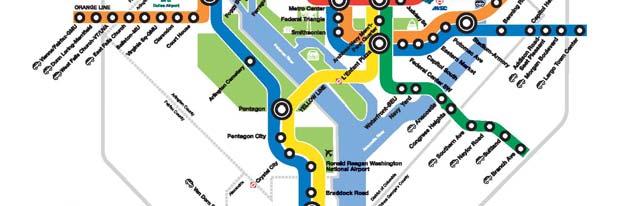
67 Map 8: WMATA Metro Map


68 Map 9: Anne Arundel County SAPs


69 Map 10: Priority Funding Areas Subject Property

70 Map 11: Odenton SAP
71 Map 12: Crofton SAP


72 Map 13: Current Zoning MXD-C Open Space Subject Site R1 C4 C3 R5 C2


73 Site Map 14: Current Zoning


74 Map 15: Planned Water Service Shaded area is a Planned Water Service Area Subject Property


75 Map 16: Planned Sewer Service Shaded area is a Planned Sewer Service Area Subject Property Evergreen Road

76 Map 17: Existing Water & Sewer Lines Sewer Line Subject Site Water Line
2014 Plan of Conservation and Development. Development Plan & Policies
 The Town of Hebron Section 3 2014 Plan of Conservation and Development Development Plan & Policies C. Residential Districts I. Residential Land Analysis This section of the plan uses the land use and vacant
Appendix A: Guide to Zoning Categories Prince George's County, Maryland
 Appendix A: Guide to Zoning Categories Prince George's County, Maryland RESIDENTIAL ZONES 1 Updated November 2010 R-O-S: Reserved Open Space - Provides for permanent maintenance of certain areas of land
Land Use. Land Use Categories. Chart 5.1. Nepeuskun Existing Land Use Inventory. Overview
 Land Use State Comprehensive Planning Requirements for this Chapter A compilation of objectives, policies, goals, maps and programs to guide the future development and redevelopment of public and private
Appendix D HOUSING WORK GROUP REPORT JULY 10, 2002
 Appendix D HOUSING WORK GROUP REPORT JULY 10, 2002 Work Group Assignment At the 20/20 forum in April 2001, the community expressed a need for housing policies which will protect both the Town s social
2014 Plan of Conservation and Development
 The Town of Hebron Section 1 2014 Plan of Conservation and Development Community Profile Introduction (Final: 8/29/13) The Community Profile section of the Plan of Conservation and Development is intended
Article Optional Method Requirements
 Article 59-6. Optional Method Requirements [DIV. 6.1. MPDU DEVELOPMENT IN RURAL RESIDENTIAL AND RESIDENTIAL ZONES Sec. 6.1.1. General Requirements... 6 2 Sec. 6.1.2. General Site and Building Type Mix...
Anne Arundel County General Development Plan Background Report on Land Use
 Anne Arundel County General Development Plan 2008 Background Report on Land Use June 2008 I. Introduction Decisions and policies regarding land use are one of the most important components of a local comprehensive
P o p u l a t i o n, L a n d U s e, a n d Z o n i n g
 P o p u l a t i o n, L a n d U s e, a n d Z o n i n g The Town of Upper Marlboro is located only 15 miles southeast of the District of Columbia, in the central portion of Prince George s County in the
Existing Land Use. Typical densities for single-family detached residential development in Cumberland County: 1
 Existing Land Use A description of existing land use in Cumberland County is fundamental to understanding the character of the County and its development related issues. Economic factors, development trends,
Provide a diversity of housing types, responsive to household size, income and age needs.
 8 The City of San Mateo is a highly desirable place to live. Housing costs are comparably high. For these reasons, there is a strong and growing need for affordable housing. This chapter addresses the
Burlington Unincorporated Community Plan
 Burlington Unincorporated Community Plan June 30, 2010 Meeting Page 1 of 24 Table of Contents (Page numbers to be inserted) I. Background a. Location and Community Description b. Planning of Unincorporated
Marion County Board of County Commissioners
 Marion County Board of County Commissioners Date: 12/29/2015 P&Z: 12/28/2015 BCC: 1/12/2016 Item Number 160113Z Type of Application Rezoning Request From: A-1 (General Agriculture) To: PUD (Planned Unit
Addressing the Impact of Housing for Virginia s Economy
 Addressing the Impact of Housing for Virginia s Economy A REPORT FOR VIRGINIA S HOUSING POLICY ADVISORY COUNCIL NOVEMBER 2017 Appendix Report 2: Housing the Commonwealth's Future Workforce 2014-2024 Jeannette
8Land Use. The Land Use Plan consists of the following elements:
 8Land Use 1. Introduction The Land Use Plan consists of the following elements: 1. Introduction 2. Existing Conditions 3. Opportunities for Redevelopment 4. Land Use Projections 5. Future Land Use Policies
STAFF REPORT. Permit Number: Unlimited. Kitsap County Board of Commissioners; Kitsap County Planning Commission
 STAFF REPORT Permit Number: 15 00550 Unlimited DATE: March 2, 2016 TO: FROM: Kitsap County Board of Commissioners; Kitsap County Planning Commission Katrina Knutson, AICP, Senior Planner, DCD and Jeff
Residential Capacity Estimate
 Residential Capacity Estimate Montgomery County Department of Park & Planning Research & Technology Center January 2005 Current plans allow 75,000 more housing units. by Matthew Greene, Research Planner
MHC 2012 Housing Tax Credit Cycle MARKET STUDY GUIDE
 MHC 2012 Housing Tax Credit Cycle MARKET STUDY GUIDE I. DATA SOURCES 1. Acceptable data sources include: a. The 2000 Census b. Data from state or local planning bodies c. Data purchased commercially from
Town of Cary, North Carolina Rezoning Staff Report 14-REZ-31 Cary Park PDD Amendment (Waterford II) Town Council Meeting January 15, 2015
 Town Council Meeting January 15, 2015") Town of Cary, North Carolina Rezoning Staff Report 14-REZ-31 Cary Park PDD Amendment (Waterford II) Town Council Meeting January 15, 2015 REQUEST To amend the Town of Cary Official Zoning Map by amending
Town of Cary, North Carolina Rezoning Staff Report 14-REZ-31 Cary Park PDD Amendment (Waterford II) Town Council Meeting January 15, 2015 REQUEST To amend the Town of Cary Official Zoning Map by amending
Generic Environmental Impact Statement. Build-Out Analysis. City of Buffalo, New York. Prepared by:
 Generic Environmental Impact Statement Build-Out Analysis City of Buffalo, New York 2015 Prepared by: TABLE OF CONTENTS 1.0 INTRODUCTION 1 2.0 METHODOLOGY 2 3.0 EXISTING LAND USE 3 4.0 EXISTING ZONING
Chapter 5: Testing the Vision. Where is residential growth most likely to occur in the District? Chapter 5: Testing the Vision
 Chapter 5: Testing the Vision The East Anchorage Vision, and the subsequent strategies and actions set forth by the Plan are not merely conceptual. They are based on critical analyses that considered how
Technology Park Planned Unit Development Technology Park PUD-IP
 Technology Park Planned Unit Development Technology Park PUD-IP Rob Anderson Community Development Director Planned Unit Development Background 2 Planned Unit Development (PUD) means a mixed use redevelopment
HOUSING ELEMENT Inventory Analysis
 HOUSING ELEMENT Inventory Analysis 2.100 INVENTORY Age of Housing Stock Table 2.25 shows when Plantation's housing stock was constructed. The latest available data with this kind of breakdown is 2010.
PLANNING COMMISSION REPORT Regular Agenda Public Hearing Item
 PC Staff Report 11/12/12 Item No. 2B- 1 PLANNING COMMISSION REPORT Regular Agenda Public Hearing Item ITEM NO. 2B: A TO GPI; 110 ACRES; E OF K-10 & N OF W 6 TH ST (MKM) : Consider a request to rezone approximately
Table of Contents. Appendix...22
 Table Contents 1. Background 3 1.1 Purpose.3 1.2 Data Sources 3 1.3 Data Aggregation...4 1.4 Principles Methodology.. 5 2. Existing Population, Dwelling Units and Employment 6 2.1 Population.6 2.1.1 Distribution
9. REZONING NO Vicinity of the northwest corner of 143 rd Street and Metcalf Avenue
 9. REZONING NO. 2002-15 Vicinity of the northwest corner of 143 rd Street and Metcalf Avenue 1. APPLICANT: Andrew Schlagel is the applicant for this request. 2. REQUESTED ACTION: The applicant is requesting
MEMORANDUM Planning Commission Travis Parker, Planning Director DATE: April 4, 2018 Lakewood Zoning Amendments Housing and Mixed Use
 MEMORANDUM TO: FROM: Travis Parker, Planning Director DATE: April 4, 2018 SUBJECT: Lakewood Zoning Amendments Housing and Mixed Use In August 2017, the Lakewood Development Dialogue process began with
Financial Impact Statement There are no immediate financial impacts associated with the adoption of this report.
 STAFF REPORT Planning and Development Department Subject: Application by RYC Property to rezone a portion of lands on John Murray Dr. and Megan Lynn Dr. from R2 to R3 and to enter into a Development Agreement
AFFORDABLE WORKFORCE HOUSING REPORT OF THE WORKING GROUP Recommendations for our Region Approved February 22, 2006
 AFFORDABLE WORKFORCE HOUSING REPORT OF THE WORKING GROUP Recommendations for our Region Approved February 22, 2006 www.rrregion.org RAPPAHANNOCK RAPIDAN REGIONAL COMMISSION WORKFORCE HOUSING WORKING GROUP
1057 Canton RD Marietta, GA 30066
 1057 Canton RD Marietta, GA 30066 +/- 1.49 Acres Presently Zoned LI $350,000 With all utilities available. Very little lot prep necessary for most uses. Two Level steppes descending from the street level.
STAFF REPORT. Permit Number: Lee. Kitsap County Board of Commissioners; Kitsap County Planning Commission
 STAFF REPORT Permit Number: 15 00689 Lee DATE: March 2, 2016 TO: FROM: Kitsap County Board of Commissioners; Kitsap County Planning Commission Katrina Knutson, AICP, Senior Planner, DCD and Jeff Arango,
Zoning Articles Proposed for 2019 Annual Town Meeting
 February 19, 2019 Zoning Articles Proposed for 2019 Annual Town Meeting The proposed zoning changes described in this document have been submitted into the 2019 annual town meeting warrant. The Planning
HISTORIC PERKIOMEN BRIDGE HOTEL
 HISTORIC PERKIOMEN BRIDGE HOTEL 1 E. MAIN STREET COLLEGEVILLE, PA 19486 Monika Polakevic Senior Advisor 215.757.2500 x108 monika.polakevic@svn.com Chichi E. Ahia Executive Director/ Principal 215.757.2500
TASK 2 INITIAL REVIEW AND ANALYSIS U.S. 301/GALL BOULEVARD CORRIDOR FORM-BASED CODE
 TASK 2 INITIAL REVIEW AND ANALYSIS U.S. 301/GALL BOULEVARD CORRIDOR FORM-BASED CODE INTRODUCTION Using the framework established by the U.S. 301/Gall Boulevard Corridor Regulating Plan (Regulating Plan),
Open Space Model Ordinance
 Open Space Model Ordinance Section I. Background Open space development has numerous environmental and community benefits, including: 1) Reduces the impervious cover in a development. Impervious cover
DRAFT Plan Incentives. Part A: Basic Discount
 DRAFT 2030 Plan Incentives July 26, 2006 Part A: Basic Discount In order for a development to be eligible for any 2030 Land Resource Management Plan Discounts it must be located in the Urban Corridor and
CHAPTER 2 VACANT AND REDEVELOPABLE LAND INVENTORY
 CHAPTER 2 VACANT AND REDEVELOPABLE LAND INVENTORY CHAPTER 2: VACANT AND REDEVELOPABLE LAND INVENTORY INTRODUCTION One of the initial tasks of the Regional Land Use Study was to evaluate whether there is
Salem HNA and EOA Advisory Committee Meeting #6
 Salem HNA and EOA Advisory Committee Meeting #6 Residential Land Policies Employment Land Policies Policy Discussions with the Committee Outcome of today s meeting Direction from this Committee on proposed
Approval of Takoma Amended Joint Development Agreement and Compact Public Hearing
 Planning, Program Development and Real Estate Committee Item IV - B March 13, 2014 Approval of Takoma Amended Joint Development Agreement and Compact Public Hearing Washington Metropolitan Area Transit
PLANNING COMMISSION REPORT Regular Agenda - Public Hearing Item
 Z-14-00056 Item No. 1-1 PLANNING COMMISSION REPORT Regular Agenda - Public Hearing Item PC Staff Report 4/21/2014 ITEM NO. 1: RSO TO CN1;.126 ACRES; 512 & 514 LOCUST ST (DRG) Z-14-00056: Consider a request
Town of Cary, North Carolina Rezoning Staff Report 12-REZ-27 Morris Branch Town Council Public Hearing January 24, 2013
 Town of Cary, North Carolina Rezoning Staff Report 12-REZ-27 Morris Branch Town Council Public Hearing January 24, 2013 REQUEST To amend the Town of Cary Official Zoning Map to rezone approximately 9.0
POPULATION FORECASTS
 POPULATION FORECASTS Between 2015 and 2045, the total population is projected to increase by 373,125 residents to reach 2.2 million. Some areas will see major increases, while other areas will see very
PLANNING RATIONALE REPORT
 PLANNING RATIONALE REPORT Zoning By-law Amendment Application 2920 Danbury Way Prepared for: Bravar Custom Builders Inc. and Village View Estates Ltd. by: 6393 Roslyn Street Ottawa (Orleans), Ontario K1C
FINAL DRAFT 12/1/16, Rev. to 7/18/17
 FINAL DRAFT 12/1/16, Rev. to 7/18/17 (As Adopted 8/8/17 Effective 9/1/17) SHELTON PLANNING AND ZONING COMMISSION Proposed Amendments to Zoning Regulations I. Amend Section 23 PERMITTED USES by inserting
Planning Department Oconee County, Georgia STAFF REPORT
 Planning Department Oconee County, Georgia STAFF REPORT REZONE CASE #: 7332 DATE: November 28, 2017 STAFF REPORT BY: Gabriel Quintas, Planner APPLICANT NAME: Smith Planning Group PROPERTY OWNER: John Hadden
ARTICLE OPTIONAL METHOD REGULATIONS
 ARTICLE 59-6. OPTIONAL METHOD REGULATIONS DIV. 6.1. MPDU DEVELOPMENT IN RURAL RESIDENTIAL AND RESIDENTIAL ZONES SEC. 6.1.1. GENERAL REQUIREMENTS... 6 2 SEC. 6.1.2. GENERAL SITE AND BUILDING T PE MIX...
Mohave County General Plan
 63 64 65 66 67 68 69 70 71 The Land Use Diagram is not the County's zoning map. 13 It is a guide to future land use patterns. Zoning and area plan designations may be more restrictive than the land use
Arch-Laclede s Landing Station
 Arch-Laclede s Landing Station This station profile describes existing conditions around the Arch-Laclede s Landing MetroLink Station. This is one of a set of profiles for each of the MetroLink System
APPENDIX A. Market Study Standards and Requirements
 APPENDIX A Market Study Standards and Requirements Section 42(m)(1)(A)(iii) of the IRS Code and Section IV(A)(2) of the 2018 Qualified Allocation Plan (QAP) require market studies for all low-income housing
DEPARTMENT OF PLANNING & ZONING COMPREHENSIVE PLANNING LAND PRESERVATION FOREST CONSERVATION GIS
 DEPARTMENT OF PLANNING & ZONING COMPREHENSIVE PLANNING LAND PRESERVATION FOREST CONSERVATION GIS September 8, 2017 Case #: RZ-17-005 Application for Map Amendment Staff Report and Analysis Property Owner(s)
Implementation. Approved Master Plan and SMA for Henson Creek-South Potomac 103
 Implementation Approved Master Plan and SMA for Henson Creek-South Potomac 103 104 Approved Master Plan and SMA for Henson Creek-South Potomac Sectional Map Amendment The land use recommendations in the
MONTGOMERY COUNTY PLANNING DEPARTMENT THE MARYLAND-NATIONAL CAPITAL PARK AND PLANNING COMMISSION
 MONTGOMERY COUNTY PLANNING DEPARTMENT THE MARYLAND-NATIONAL CAPITAL PARK AND PLANNING COMMISSION MCPB Item No. 8 Date: 03-07-13 Sonoma, Preliminary Plan, 120130040 Melissa Williams, Senior Planner, Melissa.williams@montgomeryplanning.org,
3804 Wilson Boulevard (Staples Site) Special General Land Use Plan Study
 Special General Land Use Plan Study") 1 3804 Wilson Boulevard (Staples Site) Special General Land Use Plan Study Long Range Committee of the Planning Commission Meeting May 16, 2018 Department of Community Planning, Housing and Development
1 3804 Wilson Boulevard (Staples Site) Special General Land Use Plan Study Long Range Committee of the Planning Commission Meeting May 16, 2018 Department of Community Planning, Housing and Development
Article XII. R-1 Agricultural-Low Density Residential District
 Article XII R-1 Agricultural-Low Density Residential District Section 1200. Declaration of Legislative Intent In expansion of the Declaration of Legislative Intent and Statement of Community Development
A. Location. A MRD District may be permitted throughout the County provided it meets the standards established herein.
 752. Multi-Residential District (MRD) The Multi-Residential (MRD) District is intended to provide opportunities for rural, suburban and urban density mixed-residential developments consistent with the
DEVELOPMENT DEPARTMENT STAFF REPORT STAFF REPORT DRESDEN DRIVE TOWNHOMES DCI
 DEVELOPMENT DEPARTMENT STAFF REPORT Meeting Date: September 13, 2018 Item #: PZ2018-319 STAFF REPORT DRESDEN DRIVE TOWNHOMES DCI Request: Project Name: Development of Community Compact (DCI) and six concurrent
PLANNED UNIT DEVELOPMENTS
 PLANNED UNIT DEVELOPMENTS SECTION 9.01 DESCRIPTION AND PURPOSE. A. The purpose of a planned unit development (PUD) is to permit greater flexibility in development than is generally possible under standard
Staff Report: Date: Applicant: Property Identification: Acreage of Request: Current Zoning of Requested Area: Requested Action: Attached:
 Staff Report: Completed by Jeff Palmer Director of Planning & Zoning Date: November 7, 2018, Updated November 20, 2018 Applicant: Greg Smith, Oberer Land Developer agent for Ronald Montgomery ET AL Property
Existing Conditions: Economic Market Assessment
 Existing Conditions: Economic Market Assessment Introduction The US 24/40 Corridor Study examined existing conditions as they related to economic and commercial market assessments, existing land use, and
HOUSING & RESIDENTIAL AREAS
 CHAPTER 10: HOUSING & RESIDENTIAL AREAS OVERVIEW With almost 90% of Ridgefield zoned for residential uses, the patterns and form of residential development can greatly affect Ridgefield s character. This
Prince George s County Zoning Ordinance and Subdivision Regulations Rewrite March 13, 2017
 Prince George s County Zoning Ordinance and Subdivision Regulations Rewrite March 13, 2017 The Maryland National Capital Park & Planning Commission 1 Worksessions Schedule Topic Date Zone Structure January
RECOMMENDATION REPORT
 DEPARTMENT OF CITY PLANNING RECOMMENDATION REPORT City Planning Commission Date: August 27, 2009 Time: After 8:30 AM Place: City Hall 200 North Spring Street Los Angeles, CA 90012 Public Hearing: Completed
O-I (Office-Institutional) and AG-1(Agricultural)
 and AG-1(Agricultural)") PROPERTY INFORMATION ADDRESS 3503 and 3505 Bethany Bend DISTRICT, LAND LOTS 2/1 973 and 974 OVERLAY DISTRICT State Route 9 PETITION NUMBERS EXISTING ZONING O-I (Office-Institutional) and AG-1(Agricultural)
PROPERTY INFORMATION ADDRESS 3503 and 3505 Bethany Bend DISTRICT, LAND LOTS 2/1 973 and 974 OVERLAY DISTRICT State Route 9 PETITION NUMBERS EXISTING ZONING O-I (Office-Institutional) and AG-1(Agricultural)
R E S O L U T I O N. 1. Request: A Departure from Parking and Loading Standards (DPLS-449) for 32 parking spaces.
 for 32 parking spaces.") R E S O L U T I O N WHEREAS, the Prince George s County Planning Board has reviewed Departure from Parking and Loading Standards No. DPLS-449 requesting a departure to allow a reduction of 32 parking spaces
R E S O L U T I O N WHEREAS, the Prince George s County Planning Board has reviewed Departure from Parking and Loading Standards No. DPLS-449 requesting a departure to allow a reduction of 32 parking spaces
Staff Report: Date: Applicant: Property Identification: Acreage of Request: Current Zoning of Requested Area: Requested Action: Attached:
 Staff Report: Completed by Jeff Palmer Director of Planning & Zoning Date: November 7, 2018 Applicant: Greg Smith, Oberer Land Developer agent for Ronald Montgomery ET AL Property Identification: Frontage
Pueblo Regional Development Plan, Addendum
 Pueblo Regional Development Plan, Addendum August 2014 Table of Contents Factual Foundation.1 Land Demand Analysis....1 Population Trends 2 Housing Trends..3 Employment Trends 4 Future Land Demand Summary.5
Comprehensive Plan /24/01
 IV The is a central component of the Comprehensive Plan. It is an extension of the general goals and policies of the community, as well as a reflection of previous development decisions and the physical
Valuing Diamonds in the Rough: Utilizing Highest and Best Use Valuation Principles in a Mass Appraisal Environment
 Valuing Diamonds in the Rough: Utilizing Highest and Best Use Valuation Principles in a Mass Appraisal Environment Topics of Discussion Revaluation of a former industrial district at the height of a building
Chapter 10: Implementation
 Chapter 10: Introduction Once the Comprehensive Plan has been adopted by the City of Oakdale, the City can begin to implement the goals and strategies to make this vision a reality. This chapter will set
ARTICLE B ZONING DISTRICTS
 ARTICLE B ZONING DISTRICTS Sec. 8-3021 Established. In order to protect the character of existing neighborhoods; to prevent excessive density of population in areas which are not adequately served with
PEACHTREE INDUSTRIAL BOULEVARD small area study
 PEACHTREE INDUSTRIAL BOULEVARD small area study EXECUTIVE SUMMARY: MARKET RESEARCH FINDINGS DUNWOODY CITY COUNCIL RETREAT JUNE 4, 2018 STUDY SCOPE AND GOALS Bleakly Advisory Group (BAG) was retained to
CHAPTER 7 HOUSING. Housing May
 CHAPTER 7 HOUSING Housing has been identified as an important or very important topic to be discussed within the master plan by 74% of the survey respondents in Shelburne and 65% of the respondents in
RESEARCH BRIEF. Oct. 31, 2012 Volume 2, Issue 3
 RESEARCH BRIEF Oct. 31, 2012 Volume 2, Issue 3 PDR programs affect landowners conversion decision in Maryland PDR programs pay farmers to give up their right to convert their farmland to residential and
Bylaw No , being "Official Community Plan Bylaw, 2016" Schedule "A" DRAFT
 Bylaw No. 2600-2016, being "Official Community Plan Bylaw, 2016" Schedule "A" Urban Structure + Growth Plan Urban Structure Land use and growth management are among the most powerful policy tools at the
PD No. 15 Authorized Hearing
 PD No. 15 Authorized Hearing Community Meeting No. 2 February 19, 2019 6:30 p.m. Hyer Elementary School Cafetorium 8385 Durham St Andrew Ruegg Senior Planner PD No. 15 Authorized Hearing On September 7,
CHAPTER 2: HOUSING. 2.1 Introduction. 2.2 Existing Housing Characteristics
 CHAPTER 2: HOUSING 2.1 Introduction Housing Characteristics are related to the social and economic conditions of a community s residents and are an important element of a comprehensive plan. Information
PLANNING COMMISSION STAFF REPORT
 PLANNING COMMISSION STAFF REPORT REZONING CASE: RZ-15-002 REPORT DATE: January 26, 2016 CASE NAME: Thursday Lunch Club Rezoning PLANNING COMMISSION DATE: February 17, 2016 ADDRESS OF REZONING PROPOSAL:
Absent: Major Chris Hanson, Volk Field John Ross, Jackson County Emergency Management; Paul Wydeven, Wisconsin Department of Transportation
 Monroe County/Fort McCoy Joint Land Use Study (JLUS) Technical Advisory Group (TAG) December 8, 2011, 2:00 4:00 p.m. Angelo Town Hall, 14123 Co. Hwy. I, Sparta, WI Meeting Minutes Attendance: Bryan Law,
STAFF REPORT. Permit Number: Gonzalez. Kitsap County Board of Commissioners; Kitsap County Planning Commission
 STAFF REPORT Permit Number: 15 00657 Gonzalez DATE: March 2, 2016 TO: FROM: Kitsap County Board of Commissioners; Kitsap County Planning Commission Katrina Knutson, AICP, Senior Planner, DCD and Jeff Arango,
To: Ogunquit Planning Board From: Lee Jay Feldman, Director of Planning Date: April 18, 2018 Re: Senior/Affordable Multi-Family Housing Assessment
 To: Ogunquit Planning Board From: Lee Jay Feldman, Director of Planning Date: April 18, 2018 Re: Senior/Affordable Multi-Family Housing Assessment I. Introduction The Planning Board held a workshop on
Town of Cary, North Carolina Rezoning Staff Report 14-REZ-20 Habitat for Humanity Evans Road Town Council Meeting October 16, 2014
 Town of Cary, North Carolina Rezoning Staff Report 14-REZ-20 Habitat for Humanity Evans Road Town Council Meeting October 16, 2014 REQUEST To amend the Town of Cary Official Zoning Map by rezoning 0.53
DISTRICT COUNCIL FOR PRINCE GEORGE'S COUNTY, MARYLAND OFFICE OF THE ZONING HEARING EXAMINER ZONING MAP AMENDMENT A DECISION
 DISTRICT COUNCIL FOR PRINCE GEORGE'S COUNTY, MARYLAND OFFICE OF THE ZONING HEARING EXAMINER ZONING MAP AMENDMENT A-10029 DECISION Application: R-R to C-M Zone Applicant: Santos, LLC Opposition: Richard
MEMORANDUM. City Council. David J. Deutsch City Manager. Resolution R TLBT, LLC Annapolis Road Annexation Plan. DATE: September 3, 2015
 MEMORANDUM TO: FROM: RE: City Council David J. Deutsch City Manager Resolution R-66-15 TLBT, LLC 13401 Annapolis Road Annexation Plan DATE: September 3, 2015 In accordance with the Annotated Code of Maryland,
MONTGOMERY COUNTY PLANNING DEPARTMENT THE MARYLAND-NATIONAL CAPITAL PARK AND PLANNING COMMISSION
 MONTGOMERY COUNTY PLANNING DEPARTMENT THE MARYLAND-NATIONAL CAPITAL PARK AND PLANNING COMMISSION MCPB Item No.: Date: 11-12-15 15931 Frederick Road (CarMax) Annexation Request ANX2015-00145 Patrick Butler,
Analysis of Infill Development Potential Under the Green Line TOD Ordinance
 Analysis of Infill Development Potential Under the Green Line TOD Ordinance Prepared for the Los Angeles County Second Supervisorial District Office and the Department of Regional Planning Solimar Research
CREEKSIDE TOWNHOMES Chevy Chase, Maryland Site Plan No Preliminary Plan No
 +1 (301) 656 5901 info@nova-habitat.com CREEKSIDE TOWNHOMES Chevy Chase, Maryland Site Plan No. 820160050 Preliminary Plan No. 120160130 Application Statement of Justification October 28, 2015 Nova-Habitat,
Chapter 1: Community & Planning Context
 Chapter 1: Community & Planning Context Yesterday, Today & Tomorrow Comprehensive Plan 2040 2 INTRODUCTION The City of Lauderdale is a small town with a long history. Nestled between Saint Paul and Minneapolis,
GOALS, OBJECTIVES, AND STRATEGIES
 GOALS, OBJECTIVES, AND STRATEGIES What follows is a series of goals, recommendations and actions that reflect the themes outlined in the Mineral Springs Vision Plan (incorporated into this document as
STAFF REPORT. Community Development Director PO Box 4755 Beaverton, OR 97076
 STAFF REPORT HEARING DATE: July 7, 2010 TO: Planning Commission STAFF: Jana Fox, Assistant Planner PROPOSAL: Southeast Beaverton Office Commercial Zoning Map Amendment (ZMA2010-0006) LOCATION: The subject
PLANNING COMMISSION STAFF REPORT
 PLANNING COMMISSION STAFF REPORT REZONING CASE: RZ-16-001 REPORT DATE: March 8, 2016 CASE NAME: Trailbreak Partners Rezoning PLANNING COMMISSION DATE: March 16, 2016 ADDRESSES OF REZONING PROPOSAL: 5501
City of Valdosta Land Development Regulations
 Chapter 206 Section 206-1 Base Zoning Districts Standards for Uses, Structures, and Property Development (B) (C) Principal Uses and Structures. Principal uses and structures permitted in each base zoning
Master Plan Review SILVER SPRING CBD. Approved and Adopted February Updated January 2013
 Master Plan Review SILVER SPRING CBD Approved and Adopted February 2000 BACKGROUND ZONING CODE REWRITE In 2007, the Montgomery County Council directed the Planning Department to undertake a comprehensive
4. facilitate the construction of streets, utilities and public services in a more economical and efficient manner;
 PVPC MODEL BYLAW BY-RIGHT CLUSTER ZONING BYLAW Prepared by Pioneer Valley Planning Commission Revised: October 2001 1.00 Development 1.01 Development Allowed By Right Development in accordance with this
City of Grande Prairie Development Services Department
 City of Grande Prairie Development Services Department COUNTRYSIDE SOUTH OUTLINE PLAN Prepared by: GPEC Consulting Ltd. #202, 10712-100th Street Grande Prairie, AB Council Resolution of August 20, 2001
Affordable Housing Case Studies: Massachusetts & Maryland
 The Bay State Old Line State Affordable Housing Case Studies: Massachusetts & Maryland Martin A. Bierbaum, Ph.D.-J.D. Growth & Infrastructure Conference Bradenton, Florida November 2014 Guiding Questions
A. Land Use Relationships
 Chapter 9 Land Use Plan A. Land Use Relationships Development patterns in Colleyville have evolved from basic agricultural and residential land uses, predominate during the early stages of Colleyville
Detroit Neighborhood Housing Markets
 Detroit Neighborhood Housing Markets Market Study 2016 In 2016, Capital Impact s Detroit Program worked with local and national experts to determine the residential market demand across income levels for
City of Peachtree City. Annexation Review Process
 City of Peachtree City Annexation Review Process Page 1 Annexation Review Process Step One: Initial annexation information The following information is to be completed by the property owner and/ or their
Amendment to the Zoning and Subdivision Ordinances; Consider Repeal Cluster Development Standards
 2 Board of Supervisors Meg Bohmke, Chairman Gary F. Snellings, Vice Chairman Jack R. Cavalier Thomas C. Coen L. Mark Dudenhefer Wendy E. Maurer Cindy C. Shelton February 28, 2018 Thomas C. Foley County
Procedures For Collecting and Monitoring Data
 DRAFT Kitsap County Buildable Lands Program Procedures For Collecting and Monitoring Data Page 1 12/1/05 Introduction This procedures report is intended to provide guidelines for Kitsap County and its
Industrial Real Estate Portfolio
 Industrial Real Estate Portfolio Portfolio Coverage Page 7 6565 Echo Avenue, Reno, NV Property Summary Address: Size (SF): Office Finish: HVAC Space: Year Built: 2003 Site Area: 6565 Echo Avenue Reno,