Economic & Housing Market Forecast
|
|
|
- Octavia Weaver
- 5 years ago
- Views:
Transcription


1 Economic & Housing Market Forecast Presented by Ryan Brault - Regional Director October 2 nd,
2 The Economy Overall US 2
3 State of the Economy Job Growth Rate Remaining Strong Unemployment Rate Holding at Low Levels Housing Production Continues to be Strong High Consumer Confidence Rising Interest Rates 3
4 Unemployment Rate Trend Unemployment Rate Trend 19.0% 17.0% 15.0% 13.0% 11.0% 9.0% Expanded Unemployment Rate (U-6) 7.7% 7.0% 5.0% 3.0% Official Unemployment Rate 3.9% Source: U. S. Bureau of Labor Statistics 4
5 ISM Purchasing Managers Index ISM - Purchasing Managers Index, GROWTH NO GROWTH RECESSION Source: Institute of Supply Management 5
6 Consumer Confidence Index Long Term Trend Consumer Confidence Index, 2001-Present GROWTH STATIC RECESSION Q01 2Q02 2Q03 2Q04 2Q05 2Q06 2Q07 2Q08 2Q09 2Q10 2Q11 2Q12 2Q13 2Q14 2Q15 2Q16 2Q17 2Q18 Source: Conference Board 6

7 Mortgage Rates Will Rise as Inflation Rises 7
8 Mortgage Rate Trend History 9% Key Interest Rate History, Yr Rate 10 Year T-Bill Fed Funds Rate 8% 7% 6% 5% 4% 4.57% 3% 2% 1% 0% Source: Freddie Mac Primary Mortgage Market Survey, Federal Reserve Bank of NY 8

9 30 Year Fixed Rate Mortgages - History and Forecast 9
10 Refinancing Trends Refinancing Percentage of All Mortgages 70% 65% 60% 67.0% 61.8% 65.3% 66.0% 59.4% 62.7% 55% 50% 51.6% 53.0% 54.8% 50.2% 45% 40% 43.2% 35% 36.7% 30% Source: Mortgage Bankers Association 10

11 Median Annual Home Price - History and Forecast 11
12 Median Annual Home Price Changes - History and Forecast 12

13 Median Household Income - History and Forecast 13
14 Median Home Price Affordability & Home Buyer Power Affordability & Home Buying Power $400,000 Existing Home Price New Home Price Existing Home Affordability New Home Affordability 80.0% $350,000 $300,000 $250,000 $200,000 $150,000 $100,000 $50, % 60.0% 50.0% 40.0% 30.0% 20.0% 10.0% % of Households That Can Afford Median Price Home $0 0.0% Source: Freddie Mac Primary Mortgage Market Survey, Metrostudy 14

15 Longest US Economic Expansions 15

16 Annual Residential Permit Activity 16
17 Year-over-Year Percent Changes of Major Housing Components 15.0% Improvement Deterioration Neutral 13.1% 10.0% 5.0% 7.8% 5.9% 6.7% 2.8% 3.1% 4.2% 10.2% 3.3% 1.7% 1.1% 0.0% -5.0% -5.2% -2.9% -2.4% -10.0% -15.0% -12.1% 17
18 Vacant Developed Lot Inventory & Annual Starts 1,400,000 1,200,000 1,000, , , , ,000 0 VDL Inventory Annual Starts 18
19 Annualized Starts & Closings 450, , , , , , , ,000 50,000 0 Annual Starts Annual Closings 19
20 Annualized Starts & Closings by Price Range 30% 25% 20% 15% 10% 5% 0% <$150k $150K- $250k $250k- $300k $300k- $400k $400k- $500k $500k- $600k $600k- $700k $700k- $800k $800k+ Annual Starts Annual Closings 20
21 Annualized Starts & Closings by State 100,000 90,000 80,000 70,000 60,000 50,000 40,000 30,000 20,000 10,000 0 Annual Starts Annual Closings 21
22 Annual Starts and Closings by Market Dallas/Ft.Worth Houston Central Florida Atlanta Phoenix/Tucson Southern California Denver/Colorado Springs Northern California Austin Salt Lake City Raleigh/Durham Charlotte Central California San Antonio Philadelphia Region Las Vegas Tampa Seattle Suburban Maryland Northern Virginia Nashville Jacksonville South Florida Twin Cities Chicago Sarasota/Bradenton Indianapolis N Jersey-NY Suburbs Boise San Diego Portland Naples/Ft.Myers NC Triad Reno St.George/Mesquite Albuquerque South Florida Condo Annual Starts Annual Closings 0 5,000 10,000 15,000 20,000 25,000 30,000 35,000 40,
23 Residential Remodeling Index Top 20 Remodeling Markets 2Q18 23


24 Residential Remodeling Index Bottom 20 Remodeling Markets 2Q18 24
25 Residential Remodeling Index One Year Forecast 25

26 Residential Remodeling Index Longer Term Outlook 26

27 Residential Remodeling Index National Index & Forecast 27
28 Conclusions 28

29 Conclusions THE RISING IMPACT OF TARIFFS 4Q 17 20%+ tariff imposed on Lumber imports. 1Q 18 10% tariff imposed on aluminum imports. 1Q 18 25% tariff imposed on steel imports. ECONOMIC IMPACT OF TARIFFS ON $150B IN CHINESE IMPORTS Increase in construction costs by at least $2,000 per house. Increase in construction timelines. 29

30 Conclusions THE HEADLINES 30
31 Conclusions INFLATION WILL BE IMPACTED BY DEBT, WHICH LEADS TO In Trillions of Dollars $10.00 $9.00 $8.00 $7.00 $6.00 $5.00 $4.00 $3.00 $2.00 $1.00 $0.00 Change in US Debt From Taking to Leaving Office $8.59 $8.28 $5.85 $1.86 $1.55 $1.40 $0.12 $0.22 $0.30 Nixon Ford Carter Reagan GHWBush Clinton GWBush Obama Trump* Reduced economic growth Higher interest rates Weaker Dollar Higher taxes Higher risk of financial collapse 31
32 Jun-76 Dec-76 Jun-77 Dec-77 Jun-78 Dec-78 Jun-79 Dec-79 Jun-80 Dec-80 Jun-81 Dec-81 Jun-82 Dec-82 Jun-83 Dec-83 Jun-84 Dec-84 Jun-85 Dec-85 Jun-86 Dec-86 Jun-87 Dec-87 Jun-88 Dec-88 Jun-89 Dec-89 Jun-90 Dec-90 Jun-91 Dec-91 Jun-92 Dec-92 Jun-93 Dec-93 Jun-94 Dec-94 Jun-95 Dec-95 Jun-96 Dec-96 Jun-97 Dec-97 Jun-98 Dec-98 Jun-99 Dec-99 Jun-00 Dec-00 Jun-01 Dec-01 Jun-02 Dec-02 Jun-03 Dec-03 Jun-04 Dec-04 Jun-05 Dec-05 Jun-06 Dec-06 Jun-07 Dec-07 Jun-08 Dec-08 Jun-09 Dec-09 Jun-10 Dec-10 Jun-11 Dec-11 Jun-12 Dec-12 Jun-13 Dec-13 Jun-14 Dec-14 Jun-15 Dec-15 Jun-16 Dec-16 Jun-17 Dec-17 Jun-18 Conclusions 2-10 YEAR TREASURY SPREAD AS PREDICTOR OF RECESSION TREASURY YIELD SPREAD (DIFFERENCE BETWEEN THE 2-YEAR AND 10-YEAR TREASURY YIELDS Source: FRED Economic Data (Federal Reserve Bank of St. Louis) 32

33 Conclusions Trade War Impacts 33

34 Conclusions Trade War Impacts 34

35 Conclusions NAFTA Breakup Impacts 35
36 Conclusions Homeownership By Age Group - US 36

37 Conclusions Population by Age & Generation - US 37

38 Conclusions Household Distribution & Buying Patterns by Generation 38

39 Population Growth Continuing Trend of Population Moving West and South Source: US Census Bureau 39
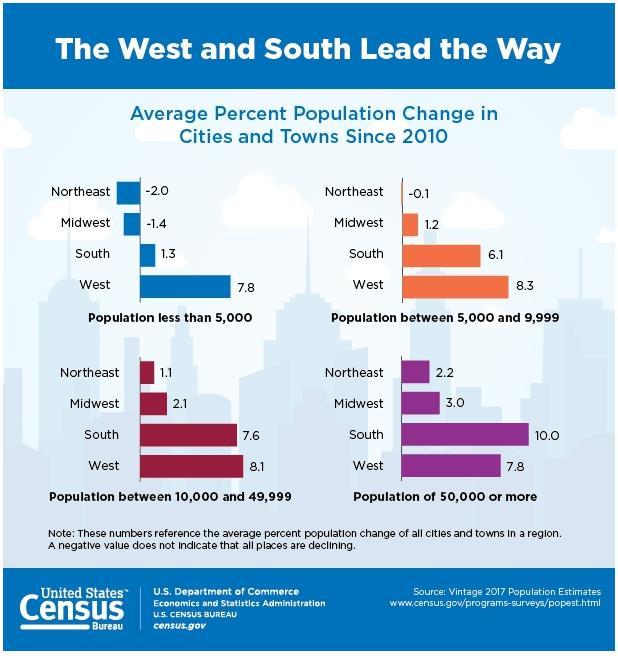
40 Population Growth 40
41 Conclusions 41

42 Case Schiller Market Comparison YOY Building Momentum Losing Momentum 42
43 HOUSING SUPPLY AND DEMAND TRENDS AND FORECASTS 155,000,000 HOUSING DEMAND AND SUPPLY PATTERNS United States 145,000,000 Units Demand/Supplied 135,000, ,000, ,000, ,000,000 95,000,000 Jan-90 Jan-91 Jan-92 Jan-93 Jan-94 Jan-95 Jan-96 Jan-97 Jan-98 Jan-99 Jan-00 Jan-01 Jan-02 Jan-03 Jan-04 Jan-05 Jan-06 Jan-07 Jan-08 Jan-09 Jan-10 Jan-11 Jan-12 Jan-13 Jan-14 Jan-15 Jan-16 Jan-17 Jan-18 Jan-19 prj Jan-20 prj Jan-21 prj Jan-22 prj Jan-23 prj Jan-24 prj Total Housing Supply Total Housing Demand * Over/Under supply measures based on current jobs-to-housing relationship relative to long-term relationship betw een jobs and housing. Source: Bureau of Labor Statistics; Moody's Analytics; Metrostudy 43
44 HOUSING VALUE AND AFFORDABILITY $350,000 HOUSING VALUATION PATTERNS United States $300,000 Median Housing Value $250,000 $200,000 $150,000 $100,000 $50,000 Jan-90 Jan-91 Jan-92 Jan-93 Jan-94 Jan-95 Jan-96 Jan-97 Jan-98 Jan-99 Jan-00 Jan-01 Jan-02 Jan-03 Jan-04 Jan-05 Jan-06 Jan-07 Jan-08 Jan-09 Jan-10 Jan-11 Jan-12 Jan-13 Jan-14 Jan-15 Jan-16 Jan-17 Jan-18 Jan-19 prj Jan-20 prj Jan-21 prj Jan-22 prj Jan-23 prj Jan-24 prj Historical/Forecast Home Price Income Supported Home Price Source: Bureau of Labor Statistics; Moody's Analytics; Metrostudy 44
45 RESIDENTIAL MARKET OPPORTUNITY/RISK INDEX United States 2nd Quarter 2018 Housing Housing Market is Over/ Median Ann. Price Equilibrium 30-Yr. Median Market is Over/ O/R Index Home Mkt. Land Mkt. Buy/Sell Year Demand Supply Underbuilt Home Price Change Home Price Mtg. Rate HH Income Undervalued (100=Equil.) Health Health Land ,002, ,734,934 2,732, % Overbuilt $99,635 - $88, % $31,468 $10, % Overvalued 94.9 Weak Weak Sell ,189, ,697,494 4,507, % Overbuilt $101, % $96, % $32,107 $4, % Overvalued 95.5 Weak Weak Sell ,707, ,810,312 5,103, % Overbuilt $104, % $106, % $32,662 $2, % Undervalued 97.3 Weak Weak Sell ,862, ,033,106 4,170, % Overbuilt $105, % $119, % $33,466 $14, % Undervalued Weak Stable Buy/Sell ,232, ,391,644 2,158, % Overbuilt $107, % $110, % $34,516 $3, % Undervalued 99.5 Weak Stable Buy/Sell ,222, ,711, , % Overbuilt $108, % $118, % $35,807 $10, % Undervalued Stable Stable Buy/Sell ,654, ,123, , % Underbuilt $113, % $123, % $37,266 $10, % Undervalued Stable Stable Buy/Sell ,745, ,551,380 2,194, % Underbuilt $118, % $132, % $39,097 $13, % Undervalued Stable Strong Buy ,935, ,148,108 3,787, % Underbuilt $125, % $147, % $41,110 $21, % Undervalued Stable Strong Buy ,031, ,796,260 5,235, % Underbuilt $132, % $147, % $43,315 $14, % Undervalued Strong Strong Buy ,862, ,374,142 6,488, % Underbuilt $143, % $142, % $44,521 $ % Overvalued Strong Strong Buy ,154, ,994,452 5,160, % Underbuilt $155, % $157, % $45,073 $2, % Undervalued Strong Strong Buy ,043, ,728,775 2,314, % Underbuilt $170, % $163, % $45,071 $6, % Overvalued Strong Stable Buy/Sell ,992, ,611, , % Underbuilt $186, % $177, % $45,657 $8, % Overvalued 98.8 Strong Stable Buy/Sell ,566, ,664,252 97, % Overbuilt $210, % $181, % $46,927 $29, % Overvalued 95.8 Stable Weak Sell ,941, ,790, , % Underbuilt $239, % $186, % $48,783 $53, % Overvalued 93.4 Stable Weak Sell ,455, ,614, , % Underbuilt $250, % $181, % $50,972 $68, % Overvalued 92.2 Weak Weak Sell ,158, ,005,330 1,153, % Underbuilt $249,635 (0.2%) $189, % $53,014 $59, % Overvalued 93.4 Weak Weak Sell ,698, ,903, , % Overbuilt $216,563 (13.2%) $197, % $53,746 $19, % Overvalued 97.3 Weak Weak Sell ,327, ,482,243 6,154, % Overbuilt $190,142 (12.2%) $216, % $53,084 $26, % Undervalued Weak Stable Buy/Sell ,671, ,082,274 7,410, % Overbuilt $195, % $219, % $52,492 $24, % Undervalued 98.9 Weak Stable Buy/Sell ,426, ,702,632 6,276, % Overbuilt $187,477 (4.2%) $225, % $52,793 $38, % Undervalued Stable Stable Buy/Sell ,798, ,527,203 4,728, % Overbuilt $194, % $251, % $53,640 $56, % Undervalued Stable Strong Buy ,080, ,512,560 3,432, % Overbuilt $215, % $247, % $54,809 $31, % Undervalued Stable Stable Buy/Sell ,539, ,554,511 2,014, % Overbuilt $227, % $246, % $56,205 $18, % Undervalued Strong Stable Buy/Sell ,289, ,725, , % Overbuilt $240, % $264, % $58,112 $24, % Undervalued Stable Stable Buy/Sell ,702, ,919, , % Underbuilt $253, % $280, % $60,011 $26, % Undervalued Stable Strong Buy ,873, ,189,153 1,684, % Underbuilt $269, % $277, % $61,962 $7, % Undervalued Stable Stable Buy/Sell 2018est 141,951, ,570,183 2,381, % Underbuilt $285, % $263, % $64,441 $22, % Overvalued 98.9 Strong Stable Buy/Sell 2019prj 143,653, ,036,076 2,616, % Underbuilt $291, % $248, % $66,661 $43, % Overvalued 96.9 Stable Weak Sell 2020prj 144,647, ,554,162 2,092, % Underbuilt $294, % $246, % $68,457 $48, % Overvalued 96.1 Stable Weak Sell 2021prj 144,471, ,996, , % Underbuilt $295, % $249, % $69,415 $45, % Overvalued 95.6 Weak Weak Sell 2022prj 143,505, ,294,303 1,788, % Overbuilt $290,871 (1.5%) $257, % $70,109 $33, % Overvalued 95.7 Weak Weak Sell 2023prj 142,009, ,397,569 4,387, % Overbuilt $284,472 (2.2%) $267, % $70,670 $16, % Overvalued 96.1 Weak Weak Sell 45
46 MARKET OPPORTUNITY RANKINGS SELECT METRO AREAS IN THE UNITED STATES 2nd Quarter Est. Jobs & Housing 2018 Jobs-to-Housing 2018 Home Prices Median Year 2018 Year 2018 Near- Year 2006 Non-Farm Equili- Equili- H.Hold Under/(Over) Under/(Over) Term Under/(Over) REGION Jobs Housing Ratio brium Median brium Income Supplied Valued Risk Valued - United States 148,823, ,570, to to 1.0 $285,347 $263,113 $64, % -7.8% Moderate -27.4% 1 San Luis Obispo-Paso Robles-Arroyo Grande, CA CBSA 119, , to to 1.0 $612,604 $597,362 $75, % -2.5% Low -38.6% 2 Trenton, NJ CBSA 272, , to to 1.0 $274,192 $282,867 $82, % 3.2% Low -25.6% 3 San Francisco-Redwood City-South San Francisco, CA MD 1,135, , to to 1.0 $1,450,825 $1,291,039 $117, % -11.0% Low -22.6% 4 Riverside-San Bernardino-Ontario, CA CBSA 1,496,161 1,553, to to 1.0 $344,400 $284,060 $61, % -17.5% Low -40.7% 5 West Palm Beach-Boca Raton-Delray Beach, FL MD 635, , to to 1.0 $359,011 $342,061 $66, % -4.7% Low -39.9% 6 Merced, CA CBSA 68,308 86, to to 1.0 $253,978 $217,047 $51, % -14.5% Low -47.5% 7 New York-Newark-Jersey City, NY-NJ-PA CBSA 9,783,262 8,063, to to 1.0 $479,285 $519,691 $79, % 8.4% Low -33.3% 8 Stockton-Lodi, CA CBSA 238, , to to 1.0 $367,955 $314,125 $63, % -14.6% Low -45.1% 9 Modesto, CA CBSA 177, , to to 1.0 $312,372 $260,990 $57, % -16.4% Low -43.9% 10 Miami-Fort Lauderdale-West Palm Beach, FL CBSA 2,678,205 2,601, to to 1.0 $350,286 $326,858 $56, % -6.7% Low -41.0% 11 Fresno, CA CBSA 352, , to to 1.0 $265,008 $234,771 $52, % -11.4% Low -40.4% 12 Cape Coral-Fort Myers, FL CBSA 265, , to to 1.0 $250,119 $212,158 $56, % -15.2% Low -41.8% 13 Oakland-Hayward-Berkeley, CA MD 1,183,076 1,036, to to 1.0 $813,278 $743,169 $98, % -8.6% Low -36.6% 14 San Antonio-New Braunfels, TX CBSA 1,065, , to to 1.0 $214,873 $187,532 $60, % -12.7% Low -9.3% 15 Baltimore-Columbia-Towson, MD CBSA 1,413,085 1,204, to to 1.0 $269,852 $290,196 $85, % 7.5% Low -32.4% 16 Boston-Cambridge-Nashua, MA-NH NECTA 2,786,673 1,970, to to 1.0 $484,207 $466,413 $90, % -3.7% Low -22.1% 17 Atlanta-Sandy Springs-Roswell, GA CBSA 2,814,512 2,458, to to 1.0 $199,198 $174,685 $68, % -12.3% Low -19.1% 18 Salinas, CA CBSA 141, , to to 1.0 $602,684 $523,799 $68, % -13.1% Low -40.7% 19 Deltona-Daytona Beach-Ormond Beach, FL CBSA 205, , to to 1.0 $200,422 $172,048 $49, % -14.2% Low -40.2% 20 North Port-Sarasota-Bradenton, FL CBSA 309, , to to 1.0 $285,105 $273,870 $56, % -3.9% Low -42.2% 21 San Diego-Carlsbad, CA CBSA 1,476,536 1,218, to to 1.0 $624,545 $577,027 $75, % -7.6% Low -35.0% 22 Chicago-Naperville-Elgin, IL-IN-WI CBSA 4,755,211 4,001, to to 1.0 $258,411 $257,874 $72, % -0.2% Low -27.8% 23 Detroit-Warren-Dearborn, MI CBSA 2,044,839 2,020, to to 1.0 $185,703 $161,795 $62, % -12.9% Low -13.1% 24 Provo-Orem, UT CBSA 258, , to to 1.0 $341,036 $293,616 $77, % -13.9% Low -5.7% 25 Cincinnati, OH-KY-IN CBSA 1,113, , to to 1.0 $170,036 $160,705 $64, % -5.5% Low -10.6% 46
47 MARKET OPPORTUNITY RANKINGS SELECT METRO AREAS IN THE UNITED STATES 2nd Quarter Est. Jobs & Housing 2018 Jobs-to-Housing 2018 Home Prices Median Year 2018 Year 2018 Near- Year 2006 Non-Farm Equili- Equili- H.Hold Under/(Over) Under/(Over) Term Under/(Over) REGION Jobs Housing Ratio brium Median brium Income Supplied Valued Risk Valued 76 El Paso, TX CBSA 318, , to to 1.0 $156,000 $148,687 $45, % -4.7% High -19.4% 77 Columbia, SC CBSA 401, , to to 1.0 $167,946 $166,117 $57, % -1.1% High -10.7% 78 Winston-Salem, NC CBSA 266, , to to 1.0 $156,072 $145,920 $50, % -6.5% High -10.9% 79 Dallas-Fort Worth-Arlington, TX CBSA 3,710,883 2,896, to to 1.0 $254,911 $198,228 $69, % -22.2% High -4.1% 80 Palm Bay-Melbourne-Titusville, FL CBSA 219, , to to 1.0 $221,584 $172,835 $54, % -22.0% High -36.8% 81 Waco, TX CBSA 123, , to to 1.0 $150,775 $127,632 $48, % -15.3% High -4.3% 82 Bakersfield, CA CBSA 261, , to to 1.0 $240,544 $216,295 $51, % -10.1% High -45.7% 83 Austin-Round Rock, TX CBSA 1,063, , to to 1.0 $306,537 $272,210 $77, % -11.2% High -4.5% 84 Memphis, TN-MS-AR CBSA 654, , to to 1.0 $172,611 $152,941 $54, % -11.4% High -14.9% 85 Baton Rouge, LA CBSA 409, , to to 1.0 $198,460 $191,770 $57, % -3.4% High -24.0% 86 Spokane-Spokane Valley, WA CBSA 250, , to to 1.0 $230,811 $213,853 $57, % -7.3% High -24.9% 87 Houston-The Woodlands-Sugar Land, TX CBSA 3,094,996 2,648, to to 1.0 $225,530 $199,818 $65, % -11.4% High -9.0% 88 Huntsville, AL CBSA 239, , to to 1.0 $199,066 $190,679 $61, % -4.2% High -10.7% 89 Virginia Beach-Norfolk-Newport News, VA-NC CBSA 793, , to to 1.0 $229,023 $225,937 $68, % -1.3% High -28.4% 90 Birmingham-Hoover, AL CBSA 540, , to to 1.0 $197,902 $179,207 $56, % -9.4% High -11.7% 91 Greensboro-High Point, NC CBSA 366, , to to 1.0 $164,074 $153,105 $48, % -6.7% High -13.5% 92 Des Moines-West Des Moines, IA CBSA 373, , to to 1.0 $200,889 $189,661 $70, % -5.6% High -9.9% 93 Albuquerque, NM CBSA 396, , to to 1.0 $207,430 $202,360 $55, % -2.4% High -17.9% 94 San Jose-Sunnyvale-Santa Clara, CA CBSA 1,119, , to to 1.0 $1,381,169 $1,022,838 $121, % -25.9% High -24.7% 95 Little Rock-North Little Rock-Conway, AR CBSA 363, , to to 1.0 $145,586 $140,957 $52, % -3.2% High -12.8% 96 Myrtle Beach-Conway-North Myrtle Beach, SC-NC CBSA 171, , to to 1.0 $212,722 $224,379 $50, % 5.5% High -27.4% 97 Tucson, AZ CBSA 384, , to to 1.0 $225,207 $207,429 $50, % -7.9% High -35.7% 98 Omaha-Council Bluffs, NE-IA CBSA 504, , to to 1.0 $180,774 $167,833 $64, % -7.2% High -12.8% 99 Killeen-Temple, TX CBSA 146, , to to 1.0 $163,085 $140,314 $56, % -14.0% High 4.7% 100 College Station-Bryan, TX CBSA 120, , to to 1.0 $210,928 $168,038 $45, % -20.3% High -0.1% 47
48 KEY TAKEAWAYS FOR 2018 AND BEYOND Tax reform is hurting high priced markets California, New York, Washington Tariffs hurt the economy especially the new home industry. Rising mortgage rates are just beginning, and inflationary pressures are slowly building. National debt will slow economic growth. The national housing market will continue to be significantly under supplied. The national housing market will become increasingly over valued, but the risk of a price collapse is small due to under supply. The surge in the remodeling/renovation market will continue. Uncertainty spawned by policies of the current administration may bring forward the pending recession. Overall, we re in the bottom of the 7 th inning of a challenging and rewarding housing market in an environment of under supply and increasing costs.
49 now you know 49
50 Follow Up Questions Ryan Brault Regional Director (480) John Ralston Director of Business Development (602) S. Alma School Rd, #9750 Mesa, AZ
California s Housing Market: How Much Froth Is Out There?
 California s Housing Market: How Much Froth Is Out There? Conference Underwriter Polling Question: What Will Most Likely Occur to California s Housing Prices in the Next 2 Years? 1. Bubble Bursts 15% or
VSIP POSITION LISTING American Federation of Government Employees
 HQ Washington, DC Office of Public Housing Investments Public Housing Revitalization Specialist GS 15 11 Public Housing Revitalization Specialist GS 14 14 Public Housing Revitalization Specialist GS 13
MAMA Risk Summary Data through 2011 Q3
 MAMA Risk Summary Data through 2011 Q3 Table of Contents Report Contents... 2 Summary... 3 MAMA Risk Summary Indicators for Largest 50 Metro Areas... 4 Home Prices Risk Indicator Summary Map... 6 Employment
Housing Affordability: Local and National Perspectives
 University of Pennsylvania ScholarlyCommons 2018 ADRF Network Research Conference Presentations ADRF Network Research Conference Presentations 11-2018 Housing Affordability: Local and National Perspectives
NATIONAL ASSOCIATION OF REALTORS RESEARCH DIVISION
 NATIONAL ASSOCIATION OF REALTORS RESEARCH DIVISION COMMERCIAL REAL ESTATE Positive Demand Overcomes Weak Economic Performance in 2014.Q1 George Ratiu Director, Quantitative & Commercial Research First
U.S. Economic and Institutional Apartment Market Overview and Outlook. January 7, 2015
 U.S. Economic and Institutional Apartment Market Overview and Outlook January 7, 2015 Emerging Economic Trends Inflation Adjusted Crude Oil Prices In Alignment with Long-Term Average Price per Barrel (Nov.
LUXURY MARKET REPORT. - May
 LUXURY MARKET REPORT - May 2018 - www.luxuryhomeing.com THIS IS YOUR LUXURY MARKET REPORT MAP OF LUXURY RESIDENTIAL MARKETS Welcome to the Luxury Report, your guide to luxury real estate market data and
U.S. GDP (2012 Q Q2)
") U.S. GDP (2012 Q3 2014 Q2) U. S. Employment Employment Recovery Following the Last Two Downturns Rail Traffic: Containers Rail Traffic: Commodities Select Rail Traffic Residential Mortgages Pipeline of
U.S. GDP (2012 Q3 2014 Q2) U. S. Employment Employment Recovery Following the Last Two Downturns Rail Traffic: Containers Rail Traffic: Commodities Select Rail Traffic Residential Mortgages Pipeline of
The Gains from Right to Rent
 The Gains from Right to Rent Dean Baker and Hye Jin Rho July 2009 Center for Economic and Policy Research 1611 Connecticut Avenue, NW, Suite 400 Washington, D.C. 20009 202-293-5380 www.cepr.net CEPR The
The U.S. Housing Confidence Index
 March 2018 www.pulsenomics.com 2014-2018 Pulsenomics LLC Pulsenomics, Housing Confidence Survey, and Housing Confidence Index are trademarks of Pulsenomics LLC. HCI Each Housing Confidence Index (HCI)
Recovery? Growth? Jobs? Capital Investment?
 Recovery? Growth? Jobs? Capital Investment? Turning the Corner? Presented by Dr. Ivan Miestchovich, Jr., Director Institute for Economic Development & Real Estate Research The University of New Orleans
LUXURY MARKET REPORT. - March
 LUXURY MARKET REPORT - March 2018 - www.luxuryhomeing.com THIS IS YOUR LUXURY MARKET REPORT MAP OF LUXURY RESIDENTIAL MARKETS Welcome to the Luxury Report, your guide to luxury real estate market data
Housing, Construction, and Remodeling Update. Toby Morrison Director of Insights Metrostudy October 12, 2013
 Housing, Construction, and Remodeling Update Toby Morrison Director of Insights Metrostudy October 12, 2013 New Home Sales (Units) "Pro-Worthy" R&R Projects New Homes Sales and Remodeling Are Firmly on
February 2012 Real Estate Data
 1 of 10 4/4/2012 1:45 PM Real Estate Trends ly Housing Summary Official Site of the Hi! Sign In Sign Up 0 Listings 0 es Mobile Apps National Association of REALTORS Find Homes http://www.fortlauderdalebeachproperty.com
STOCKTON, DETROIT, RIVERSIDE-SAN BERNARDINO POST TOP METRO FORECLOSURE RATES ACCORDING TO REALTYTRAC Q METROPOLITAN FORECLOSURE MARKET REPORT
 STOCKTON, DETROIT, RIVERSIDE-SAN BERNARDINO POST TOP METRO FORECLOSURE RATES ACCORDING TO REALTYTRAC Q3 2007 METROPOLITAN FORECLOSURE MARKET REPORT California, Florida and Ohio Cities Account for 17 of
LUXURY MARKET REPORT. - March
 LUXURY MARKET REPORT - March 2018 - www.luxuryhomemarketing.com THIS IS YOUR LUXURY MARKET REPORT MAP OF LUXURY RESIDENTIAL MARKETS Welcome to the Luxury Market Report, your guide to luxury real estate
OUR DETAIL IS RETAIL.
 OUR DETAIL IS RETAIL. GILBERT GROUP ADVANTAGE Rooted with local knowledge and experience strengthened by national reach. PROPERTY MANAGEMENT PROJECT LEASING TENANT REPRESENTATION GILBERT GROUP ABOUT US
Securitization Reports Update: The Outlook for U.S. Home Prices
 Securitization Global Markets Research North America United States Asset-Backed Securities 15 June 2009 Securitization Reports Update: The Outlook for U.S. Home Prices Market Update Table of contents Introduction...
National Housing Trends
 National Housing Trends 34% America s Choice of Best Long Term Investment 26% 17% 15% 6% Real Estate Stocks / Mutual Funds Gold Savings Accounts / CDs Bonds Gallup 2018 Housing Affordability 197 Index
LUXURY MARKET REPORT. - February
 LUXURY MARKET REPORT - February 2018 - www.luxuryhomeing.com THIS IS YOUR LUXURY MARKET REPORT MAP OF LUXURY RESIDENTIAL MARKETS Welcome to the Luxury Report, your guide to luxury real estate market data
Guide for Estimating Affordability and Cap Exclusions for 2018 Deliveries
 Guide for Estimating Affordability and Exclusions for 2018 Deliveries This is a reference guide for how the percentage excluded from the scorecard cap for an individual deal is calculated. The Multifamily
STATE OF THE MULTIFAMILY MARKET MACRO VIEW
 STATE OF THE MULTIFAMILY MARKET MACRO VIEW JEANETTE I. RICE, CRE AMERICAS HEAD OF MULTIFAMILY RESEARCH APRIL 19, 2018 Westchester/ Fairfield 2 JEANETTE I. RICE STATE OF U.S. MULTIFAMILY MARKET KEY INVESTMENT
Citi Global Property CEO Conference March 2016
 Citi Global Property CEO Conference March 2016 1 Table of Contents Company Overview 3 6 Multifamily Fundamentals 7 11 Camden s Portfolio 12 18 Real Estate Transactions 19 25 Capital Structure & Liquidity
List of 2009 Round Allocations
 List of 2009 Round Allocations CDFI 601 Thirteenth Street, NW, Suite 200, South, Washington, DC 20005 (202) 622-8662 9 10 CDFI 601 Thirteenth Street, NW, Suite 200, South, Washington, DC 20005 (202) 622-8662
National Housing Trends
 National Housing Trends 34% America s Choice of Best Long Term Investment 26% 17% 15% 6% Real Estate Stocks / Mutual Funds Gold Savings Accounts / CDs Bonds Gallup 2018 Total Existing Home Sales in thousands
Naturally Occurring Affordable Housing
 Naturally Occurring Affordable Housing NAAHL Annual Conference December 1, 2016 page 1 Slicing And Dicing Rental Housing U.S. Rental Housing Inventory By Units Rent Subsidized 3.3 Million 8% Market Rate
RETAIL REPORT VIEWPOINT 2018 / COMMERCIAL REAL ESTATE TRENDS. By: Hugh F. Kelly, PhD, CRE IRR.COM AN INTEGRA REALTY RESOURCES PUBLICATION
 RETAIL REPORT VIEWPOINT 2018 / COMMERCIAL REAL ESTATE TRENDS By: Hugh F. Kelly, PhD, CRE Nowhere do we hear more discussion of disruption as in the retail property sector. Ecommerce has a powerful effect,
REALTOR.COM MARKET OUTLOOK
 REALTOR.COM MARKET OUTLOOK Realtor.com Economics May 2018 MOST COMPETITIVE SEASON ON RECORD Key expectations from realtor.com Existing Home Sales Struggle to Break Out Supply: Inventory, Prices, Affordability
LUXURY MARKET REPORT. - January
 LUXURY MARKET REPORT - January 2018 - www.luxuryhomemarketing.com THIS IS YOUR LUXURY MARKET REPORT MAP OF LUXURY RESIDENTIAL MARKETS Welcome to the Luxury Market Report, your guide to luxury real estate
2017 RESIDENTIAL REAL ESTATE MARKET REPORT
 2017 RESIDENTIAL REAL ESTATE MARKET REPORT Published January 26, 2018 Our market reports have been focused on the effects of low inventory on our housing market and for good reason. December 2017 marked
Investor Presentation September 2014
 Investor Presentation September 2014 1 Forward-Looking Statements In addition to historical information, this presentation contains forward-looking statements under the federal securities law. These statements
Market Trends and Outlook
 Residential Remodeling Market Trends and Outlook Kermit Baker Remodeling Futures Conference April 3, 2012 Remodeling Market Overview 1. Home improvement spending totaled an estimated $290 billion last
Apartments: A $1.3 Trillion Market
 Apartments: A $1.3 Trillion Market A Research Report from the National Multi Housing Council Prepared by the Rosen Consulting Group Kenneth T. Rosen Susan U. Persin Daniel T. VanDyke Jeanine Kranitz This
LUXURY MARKET REPORT. - November
 LUXURY MARKET REPORT - November 2018 - www.luxuryhomeing.com THIS IS YOUR LUXURY MARKET REPORT MAP OF LUXURY RESIDENTIAL MARKETS Welcome to the Luxury Report, your guide to luxury real estate market data
Investor Presentation February 2015
 Investor Presentation February 2015 1 Forward-Looking Statements In addition to historical information, this presentation contains forward-looking statements under the federal securities law. These statements
The Link Between Middle-Income Housing Affordability and Affordable Housing
 REBIC 2017 FORUM UNCC Downtown Charlotte Campus Wendell Cox 1 February 2017 The Link Between Middle-Income Housing Affordability and Affordable Housing The Link Between Middle-Income Housing Affordability
Emerging Trends in Real Estate 2014
 Emerging Trends in Real Estate 2014 Emerging Trends is the industry s most predictive forecast 35th annual outlook Based on over 1,000 interviews and surveys of industry leaders Sponsored by PwC and the
Metropolitan Area Statistics
 Metropolitan Area Statistics Apartment Completions 1Q 2011 1Q 2012 % Chg Atlanta - - n/a Boston 133 39-71% Chicago - 20 n/a Cleveland - - n/a Columbus - 272 n/a Dallas-Ft. Worth 604 1,059 75% Denver 328
MULTIFAMILY REPORT VIEWPOINT 2018 / COMMERCIAL REAL ESTATE TRENDS. By: Hugh F. Kelly, PhD, CRE IRR.COM AN INTEGRA REALTY RESOURCES PUBLICATION
 MULTIFAMILY REPORT VIEWPOINT 2018 / COMMERCIAL REAL ESTATE TRENDS By: Hugh F. Kelly, PhD, CRE Just when the upcycle for rental apartments seemed to be approaching its peak, along came the Tax Act of 2017,
OFFICE REPORT VIEWPOINT 2018 / COMMERCIAL REAL ESTATE TRENDS. By: Hugh F. Kelly, PhD, CRE IRR.COM AN INTEGRA REALTY RESOURCES PUBLICATION
 OFFICE REPORT VIEWPOINT 2018 / COMMERCIAL REAL ESTATE TRENDS By: Hugh F. Kelly, PhD, CRE The Office workplace is at the nexus of powerful cross-currents. Pricing has made CBD acquisitions, especially in
SPECIAL REPORT. Single-Family Rent Index: H Review
 SPECIAL REPORT Rent Index: H1 2018 Review FEBRUARY 2018 1 National Overview Single-family rentals make up one-half of all residential rentals but are an overlooked segment of the housing market. Much like
OFFICE OF PERSONNEL MANAGEMENT. 5 CFR Part 531 RIN 3206-AN64. General Schedule Locality Pay Areas
 This document is scheduled to be published in the Federal Register on 12/07/2018 and available online at https://federalregister.gov/d/2018-26519, and on govinfo.gov Billing Code: 6325-39-P OFFICE OF PERSONNEL
TARRANT COUNTY HOUSING ASSISTANCE OFFICE 2018 LANDLORD SEMINAR
 TARRANT COUNTY HOUSING ASSISTANCE OFFICE 2018 LANDLORD SEMINAR 1 HUD UPDATES 2 UNIFORM PHYSICAL CONDITION STANDARDS FOR VOUCHERS UPCS-V Improved method for Inspecting housing unit Reduce subjectivity to
Real gross domestic product California vs. United States
 Real gross domestic product California vs. United States Percent change, year ago 6 4 U.S. California 2 0-2 -4-6 2001 2002 2003 2004 2005 2006 2007 2008 2009 2010 2011 Source: Bureau of Economic Analysis.
April 4, p.m. Eastern
 April 4, 2017 2 p.m. Eastern Worldwide ERC would like to thank today s sponsor: 2017 Worldwide ERC Tips and Tools for Understanding the U.S. Real Estate Market, and Its Impact on Your Relocation Program
Growing Demand for Smaller Industrial Properties
 Growing Demand for Smaller Industrial Properties Moderator: Lew Friedland, Colony Capital Panelists: Rene Circ, CoStar Portfolio Strategy Brian Fiumara, CBRE Andrew Mele, Trammell Crow Company #crec15
The State of the Commercial Real Estate Industry: Mid-Year 2010 Retail Review & Outlook
 The State of the Commercial Real Estate Industry: Mid-Year 2010 Retail Review & Outlook Copyright 2010 CoStar Realty Information, Inc. No reproduction or distribution without permission. The following
U.S. Multifamily MarketView
 U.S. Multifamily MarketView CBRE Global Research and Consulting VACANCY RATE.% NET ABSORPTION 7, Units RENTABLE COMPLETIONS 8,55 Units Y-o-Y RENT CHANGE.% Arrows indicate change from previous year. Total
County of Sonoma Agenda Item Summary Report
 Revision No. 20151201-1 County of Sonoma Agenda Item Summary Report Agenda Item Number: 32 (This Section for use by Clerk of the Board Only.) Clerk of the Board 575 Administration Drive Santa Rosa, CA
Target Market Analysis - Background
 Target Market Analysis - Background Ø A primary tool for Placemaking analysis Ø Qualitative measure of market potential Ø Use of Cluster Analysis to determine likely target markets (ESRI: Tapestry & Experian:
Real Estate Update. elearning series. Upcoming elearning series. Year-End Planning. September 16
 Real Estate Update Upcoming elearning series Year-End Planning September 16 Kevin Russell Senior Vice President, Sales & Account Management, Cartus Home Loans Renee Carnes-Rook Vice President, Real Estate
Positioned for Performance. j u n e Fine Arts Building Berkeley, CA
 Positioned for Performance j u n e 2009 Fine Arts Building Berkeley, CA Trump Place New York, NY 180 Riverside Equity Residential has a portfolio of high-quality assets focused in high-growth markets where
Joint Center for Housing Studies. Harvard University
 Joint Center for Housing Studies Harvard University Re-Weighting the Number of Households Undertaking Home Improvements in the 2013 American Housing Survey to Correct for Shifting Data Collection Periods
ULI Houston Suburban Trends Marketplace Gadi Kaufmann, CEO RCLCO
 ULI Houston Suburban Trends Marketplace 2016 Gadi Kaufmann, CEO RCLCO April 7, 2016 gkaufmann@rclco.com www.rclco.com BEST MINDS IN REAL ESTATE Best Minds in Real Estate : A multidisciplinary team The
Multifamily National Report. February 2019
 Multifamily National Report February 2019 Multifamily Growth: No Signs of Slowing U.S. multifamily rents rose $2 in February to $1,426 and year-over-year growth remained at 3., as January was revised upward
IRVINE, Calif. May 8, 2014
 ALL-CASH SHARE OF U.S. RESIDENTIAL SALES REACHES NEW HIGH IN FIRST QUARTER EVEN AS INSTITUTIONAL INVESTOR SHARE OF SALES DROPS TO LOWEST LEVEL SINCE Q1 2012 May 5, 2014 By RealtyTrac Staff All-Cash Purchases
Investor Presentation March 2017
 Investor Presentation March 2017 1 Table of Contents Company Overview & 2016 Highlights 3 6 Multifamily Fundamentals 7 11 Camden s Portfolio 12 21 Real Estate Transactions 22 28 Capital Structure & Liquidity
Pennsbury Professional Center 201 Woolston Drive Morrisville, PA
 Pennsbury Professional Center 201 Woolston Drive Morrisville, PA A VALUE-ADD MEDICAL OFFICE OPPORTUNITY WITH CONVENIENT ACCESS TO ROUTE 1 AND DENSE SURROUNDING POPULATION INVESTMENT SUMMARY Page 1 EXECUTIVE
2018 Housing Market Outlook. Central Coast Realty Group Business Symposium February 22, 2018 Oscar Wei Senior Economist
 2018 Housing Market Outlook Central Coast Realty Group Business Symposium February 22, 2018 Oscar Wei Senior Economist Overview Economic Update California Housing Market Outlook Regional Housing Market
Brad O Connor, Ph.D. Chief Economist FloridaRealtors
 Brad O Connor, Ph.D. Chief Economist FloridaRealtors brado@floridarealtors.org Overall, statewide sales growth has been stagnant since Q4 of 2015 Produced by Florida Realtors Research with data provided
2016 ECONOMIC AND HOUSING MARKET FORECAST
 2016 ECONOMIC AND HOUSING MARKET FORECAST April 06, 2016 San Francisco Association of REALTORS Oscar Wei, Senior Economist of C.A.R. OVERVIEW Economic Outlook California Housing Market Outlook Regional
A SIMULATION: MEASURING THE EFFECT OF HOUSING STIMULUS PROGRAMS ON FUTURE HOUSE PRICES
 Research Brief April 2010 First American CoreLogic A SIMULATION: MEASURING THE EFFECT OF HOUSING STIMULUS PROGRAMS ON FUTURE HOUSE PRICES www.facorelogic.com 800.345.7334 2009 First American CoreLogic,
OFFICE OF PERSONNEL MANAGEMENT. 5 CFR Part 531 RIN: 3206-AM88. General Schedule Locality Pay Areas
 This document is scheduled to be published in the Federal Register on 10/27/2015 and available online at http://federalregister.gov/a/2015-27380, and on FDsys.gov 6325-39 OFFICE OF PERSONNEL MANAGEMENT
U.S. Home Price Insights Report
 U.S. Home Price Insights Report FEATURING CORELOGIC HPI Through September 2015 with Forecasts From October 2015 CoreLogic HPI National Overview With the September release, the CoreLogic HPI posted a gain
Metropolitan Area Statistics (1Q 2013)
") Metropolitan Area Statistics (1Q 2013) Apartment Completions 1Q 2012 1Q 2013 % Chg Atlanta 487 1,460 200% Boston 360 373 4% Chicago 611 92-85% Cleveland 7 54 671 Columbus - 459 n/a Dallas-Ft. Worth 1,327
Metropolitan Area Statistics (1Q 2013) Apartment Completions 1Q 2012 1Q 2013 % Chg Atlanta 487 1,460 200% Boston 360 373 4% Chicago 611 92-85% Cleveland 7 54 671 Columbus - 459 n/a Dallas-Ft. Worth 1,327
MANAGEMENT PRESENTATION
 MANAGEMENT PRESENTATION SEPTEMBER 2014 RUF.U (USD) RUF.UN (CAD) RUF.DB.U (USD) Bear Creek Apartments, Dallas, TX AGENDA Valley Ranch Apartments, Dallas, TX 1. PURE ADVANTAGE Who we are 2. PURE PLAY What
Foreclosures Continue to Bring Home Prices Down * FNC releases Q Update of Market Distress and Foreclosure Discount
 Foreclosures Continue to Bring Home Prices Down * FNC releases Q4 2011 Update of Market Distress and Foreclosure Discount The latest FNC Residential Price Index (RPI), released Monday, indicates that U.S.
Cycle Monitor Real Estate Market Cycles
 Cycle Monitor Real Estate Market Cycles Second Quarter 0 Analysis August 0 Physical Market Cycle Analysis of All Five Major Property Types in More Than 0 MSAs. Economic and job growth continue at a moderate
Cycle Forecast Real Estate Market Cycles Second Quarter 2018 Estimates
 Cycle Forecast Real Estate Market Cycles Second Quarter 20 Estimates The Congressional Budget Office (CBO) is forecasting Gross Domestic Product (GDP) at rates below 2.0% for the next 0 years and employment
PACE LAW SCHOOL LAND USE & SUSTAINABLE DEVELOPMENT CONFERENCE
 PACE LAW SCHOOL LAND USE & SUSTAINABLE DEVELOPMENT CONFERENCE PRESENTED BY: WILLIAM V. CUDDY, JR. December 8, 2016 Multifamily Residential Development as a driver and consequence of economic development
MANAGEMENT PRESENTATION JUNE Bear Creek Apartments, Dallas, TX
 MANAGEMENT PRESENTATION JUNE 2014 Bear Creek Apartments, Dallas, TX AGENDA Valley Ranch Apartments, Dallas, TX 1. PURE ADVANTAGE Who we are 2. PURE PLAY What we do 3. PURE STRATEGY How we do it 4. PURE
Zillow Group Uncovers
 Zillow Group Uncovers Economic Trends in MF Housing Svenja Gudell, Zillow Chief Economist @SvenjaGudell svenjag@zillow.com June 15-18, 2016 Moscone Convention Center San Francisco Rents continue to grow,
SAVI TALKS HOUSING: How Indy s affordable housing market is changing and why it matters. Photo courtesy of Near East Area Renewal
 SAVI TALKS HOUSING: How Indy s affordable housing market is changing and why it matters Photo courtesy of Near East Area Renewal Getting past the misperception Pruiett - Igoe Pruitt-Igoe, built in 1954
Municipal Finance: Conditions, Local Responses, and Outlook for the Future
 Municipal Finance: Conditions, Local Responses, and Outlook for the Future Chris Hoene, Director, Policy & Research, National League of Cities Michael A. Pagano, Dean, College of Urban Planning & Public
August 14, Tucson s Investment Grade
 August 14, 2014 Tucson s Investment Grade Let s take a look at what Tucson features for national investors. Tucson has the large investment properties to offer. The largest transactions in the past decade
EL PASO MULTIFAMILY REPORT THIRD QUARTER 2017
 MULTIFAMILY REPORT THIRD QUARTER 2017 MARKET AT A GLANCE OCCUPANCY RATE 92.2% Up 60 bps since 3Q16 ASKING RENT $ 774 Unchanged since 3Q16 CONCESSIONS 1.6% Unchanged since 3Q16 OCCUPANCY AND RENT TRENDS
2017 Mid-Year Residential Real Estate Update Boise Regional REALTORS July 20, 2017 Mid-Year Residential Real Estate Update
 2017 Mid-Year Residential Real Estate Update 2017 Boise Regional REALTORS y 20, 2017 In 2015, Ada County surpassed $2 billion in total dollar volume sold. The first year since 2006. 2017 Boise Regional
U.S. MULTIFAMILY MARKETVIEW FIGURES Q4 2016
 U.S. MULTIFAMILY MARKETVIEW FIGURES Q4 2016 U.S. MULTIFAMILY MARKETVIEW Q4 2016 2016 DELIVERS IMPRESSIVE DEMAND AND NEW SUPPLY TOTALS Vacancy Rate 4.9% Net Absorption* 201,000 Units Rentable Completions*
Fannie Mae Affordable Lender Meeting
 Fannie Mae Affordable Lender Meeting MAH Madness November 13, 2017 2017 Fannie Mae. Trademarks of Fannie Mae. Millions Our Stat Sheet Team Name: Multifamily Affordable Housing (MAH) $5,000 $4,500 $4,000
Is US Housing Over- or Under-Priced?
 January 4, 2011 Is US Housing Over- or Under-Priced? Some Historical Perspective by Gleb Nechayev CBRE Econometric Advisers Boston, Mass. Gleb.Nechayev@CBRE.com William C. Wheaton Department of Economics
Housing Outlook: Where Do
 Housing Outlook: Where Do We Go From Here? May 2, 2011 JohnBurns Burns, CEO 949 870 1200 Research Management Unparalleled Industry Expertise Consulting Management 2 The current national downturn mirrors
Economic and Housing Market Outlook ( ) October 31, Contra Costa AOR
 October 31, Contra Costa AOR") Economic and Housing Market Outlook (2012 2013) Contra Costa AOR October 31, 2012 Oscar Wei Senior Research Analyst California Association of REALTORS Overview US and California Economies California Housing
Economic and Housing Market Outlook (2012 2013) Contra Costa AOR October 31, 2012 Oscar Wei Senior Research Analyst California Association of REALTORS Overview US and California Economies California Housing
TEXAS HOUSING INSIGHT
 TEXAS HOUSING INSIGHT JAMES P. GAINES CHIEF ECONOMIST WESLEY MILLER RESEARCH ASSOCIATE PAIGE WOODSON RESEARCH INTERN LUIS B. TORRES RESEARCH ECONOMIST 2 1 2 0 ANNUAL SUMMARY TECHNICAL REPORT Annual Summary...
HB , Appendix 5 PAGE 29 GUARANTEED HOUSING PROGRAM INCOME LIMITS
 HB - 1-3555, Appendix 5 PAGE 29 Bakersfield, CA MSA Chico, CA MSA El Centro, CA MSA Fresno, CA MSA VERY LOW INCOME 31300 31300 31300 31300 41300 41300 41300 41300 LOW INCOME 50100 50100 50100 50100 66150
TEXAS HOUSING INSIGHT
 TEXAS HOUSING INSIGHT JAMES P. GAINES CHIEF ECONOMIST WAYNE DAY RESEARCH ASSOCIATE LUIS B. TORRES RESEARCH ECONOMIST TECHNICAL REPORT 2 1 2 0 OCTOBER 2016 TR Contents About this Report... 3 August 2016
Rural Development Single Family Housing Guaranteed Loan Program Indiana Income Limits per Household Size
 Rural Development Single Family Housing Guaranteed Loan Program Indiana Income Limits per Household Size WA ME OR CA NV ID AZ UT MT WY CO NM ND SD NE KS MN WI IA MO OK AR IL MS MI OH IN KY TN AL GA WV
To the Eastside Economic Forecast
 To the Eastside Economic Forecast HOUSING MARKET OUTLOOK Trusted Analysis for Executive Decisions Presented by: John Burns, CEO 949-870-1210 jburns@realestateconsulting.com 1 Today s Mission is the Same
WESTCHESTER COUNTY MARKET OVERVIEW AND DEVELOPMENT TRENDS
 WESTCHESTER COUNTY MARKET OVERVIEW AND DEVELOPMENT TRENDS PACE LAND USE LAW CENTER ANNUAL CONFERENCE PRESENTED BY: WILLIAM V. CUDDY, JR. December, 2017 PAGE 0 MULTIFAMILY RESIDENTIAL AND ECONOMIC DEVELOPMENT
U.S. DEPARTMENT OF HUD 04/11/2017 STATE: CALIFORNIA ADJUSTED HOME INCOME LIMITS
 Bakersfield, CA MSA Chico, CA MSA El Centro, CA MSA Fresno, CA MSA Hanford-Corcoran, CA MSA 30% LIMITS 13200 15050 16950 18800 20350 21850 23350 24850 VERY LOW INCOME 21950 25050 28200 31300 33850 36350
The Housing Market Report Card October 20, 2011 Tim Sullivan, Principal
 The Housing Market Report Card October 20, 2011 Tim Sullivan, Principal 1 The Housing Market Report Card For the School of Rock Hard Knocks October 26, 2011 Tim Sullivan, Principal 2 Agenda 1. Housing
Liquidity of an asset is the speed at which it can be
 Liquidity of Texas Homes on Market Speaks Volumes Ali Anari and Gerald Klassen November 17, 2016 Publication 2147 Liquidity of an asset is the speed at which it can be exchanged for cash without affecting
11/2/09 5:25 PM. AS SOME TOP METRO FORECLOSURE ACTIVITY RATES DECREASE, NEW FORECLOSURE HOT SPOTS EMERGE IN Q By RealtyTrac Staff
 AS SOME TOP METRO FORECLOSURE ACTIVITY RATES... Check out our NEW Features! Home Join Search Agents Loans Home Value Home Resources Login Learn Why Join? FREE Trial FREE Credit Score Feedback Help FREE
The State of the Nation s Housing 2007: A Sneak Peek
 The State of the Nation s Housing 2007: A Sneak Peek Eric Belsky Remodeling Futures Conference April 10, 2007 Do Not Distribute Embargoed Until June 11, 2007 www.jchs.harvard.edu The Homebuilding Correction
Emerging Trends in Real Estate 2016
 Emerging Trends in Real Estate 2016 PwC ULI 12 Month Outlook on Trends 37 th Edition 1,800+ Real Estate leaders surveyed 75 Cities Profitability outlook 2010 17.7% 60.6% 21.6% Abysmal to Poor Fair Good
National Property Type Cycle Locations. Retail 1st Tier Regional Mall. Industrial R&D Flex Retail Factory Outlet+1 Retail Neighborhood/Community
 Cycle Monitor Real Estate Market Cycles Third Quarter 0 Analysis November 0 Physical Market Cycle Analysis of All Five Major Property Types in More Than 0 MSAs. International turmoil, slow European Union
National Foreclosure Report
 National Foreclosure Report OCTOBER 20 1.5% In October, the foreclosure inventory was down 1.5 percent from September 20, representing 48 months of consecutive year-overyear declines. Improved economic
Rx for Real Estate. elearning series. Upcoming elearning series
 Upcoming elearning series Kevin Russell Senior Vice President, Sales & Account Management Cartus Home Loans Donna Barber Manager, Sales/Account Management Support, Global Implementation Services, Cartus
Real estate prices bottom, but remain stagnant
 Real estate prices bottom, but remain stagnant United States Index 2000Q4 = 100 200 180 Commercial RE prices 160 140 House prices 120 100 2001 2002 2003 2004 2005 Sources: Standard & Poor's and Fiserv,
BuildZoom & Urban Economics Lab Index. Quarterly Report: 2015 Q1
 BuildZoom & Urban Economics Lab Index Quarterly Report: 2015 Q1 BuildZoom & Urban Economics Lab Index: First Quarter 2015 Remodeling of existing homes is an indicator of economic health whose importance
The Home Builders Association of Greater Austin 2019 Housing Forecast
 The Home Builders Association of Greater Austin 219 Housing Forecast (11.26.18) 1 November 6, 218 Austin, TX College Station, TX San Antonio, TX Naples, FL Charlottesville, VA Salinas, CA Lafayette, LA