Inside the MLS. Outside the MLS. Finding Deals. Really, How I Find Deals 4/2/2012. Wholesaling Process For Wholesalers
|
|
|
- Barnard Mitchell
- 5 years ago
- Views:
Transcription


1 Finding Deals James Orr Daily Marketing Checklist For Real Estate Entrepreneurs Wholesaling Process For Wholesalers Find Deals Collect Fees Analyze Deals Sell Deals Negotiate Deals Control Deals Really, How I Find Deals Two Primary Groups For Finding Deals Do it yourself or hire someone else to do it for you Will cover as much as possible for both: Outside the MLS Inside the MLS Will focus on how you can do it yourself Inside the MLS Outside the MLS 1


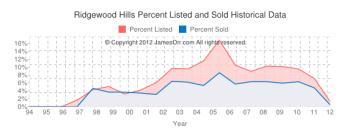
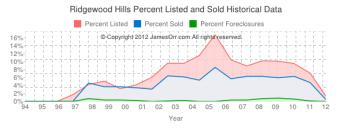
2 Why Outside The MLS? Why Outside the MLS? No and low money down transactions Creative financing without banks Improved cash flow Negotiate in a vacuum Lease-Purchases Inside MLS My Favorite Way Of Finding Deals Outside The MLS Mail Stats Mail Log (With More Stats) 2


3 Cost To Mail Morning Discipline System Import/update properties into my website s system each morning That s where I keep track of properties You may do this manually using the full MLS if you have access or lists of properties from your agent As of making these slides I am only doing this for all properties in Fort Collins and Loveland May be expanding it Sort Into Subdivisions Through a combination of automated and manual matching, I sort each property into its official subdivision Use subdivision data so this is important Can t rely on agents doing it correctly Old Town Fort Collins is a mess! Actually a very complicated problem with lots of other quirky issues About 850 subdivisions in Fort Collins and Loveland alone Properties To Analyze Universal Property Search Key 3

 5.")

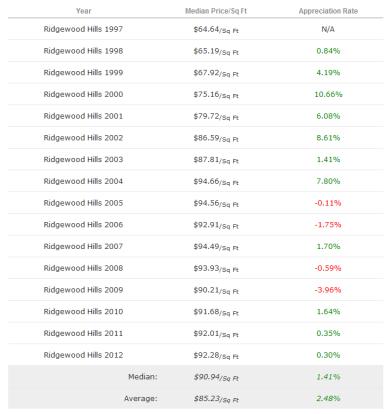
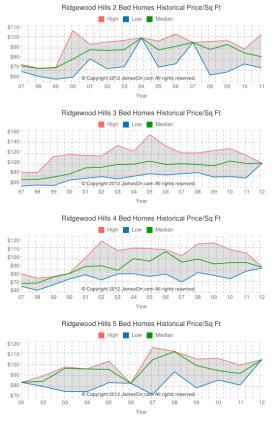
4 Start At Top Analyze Each Property Primarily For Two Different Types of Buyer: Buy, Fix and Resell Focused on value Profit A, B and C» A = Price/Total Sq Ft» B = List Price to Accessed Market Value» C = Price/Finished Sq Ft Buy, Rent and Hold Focused on income Net Operating Income Profit A Calculation 1. Take 20 most recent sales in subdivision 2. Calculate sold price/total sq ft 3. Sort the list by sold price/total sq ft 4. Pick the middle most one (median) 5. Compare median sold price/total sq ft in that subdivision to list price/total sq ft of the property you are analyzing to determine the difference 6. Multiply the difference by the total sq ft of the property you re analyzing to get a gross estimate of possible profit Profit A Calculation Example Best Properties Using Profit A Profit C Best Properties Using Profit C Similar to Profit A, except use sold price/finished square foot instead of total square foot 4

5 Profit B Compare list price to the market value that the county has for tax purposes Best Properties Using Profit B Interesting Lists Profit A, B and C are all positive Other signs of motivation and lists from the MLS you can find: REO, HUD and other owner Lease-Purchase and owner financing Free and clear Short sale Vacant Described as fixer upper, handyman special, TLC, etc in notes Pull Up MLS Sheet Read the MLS sheet and look at photos Determine if it is: Fixer Upper We get paid for adding value fixer uppers represent an opportunity Just Paint and Carpet (Light Fixer Upper) Typically these REOs will be bought by owner occupants for very close to retail Short sales can still be good candidates for these especially with listing agent cooperation Not A Fixer Upper Unless there is another way to add value (and there are other ways), these tend not to be high probability deals Determine Likely Debt If properly motivated, could they even accept our offer? Free and Clear or Mortgaged Usually do this on the public records tab in the MLS Review Property History Are they selling it for what they bought it for? Less than what they bought it for? Did someone recently buy it and then relist it for sale for a much higher price? 5
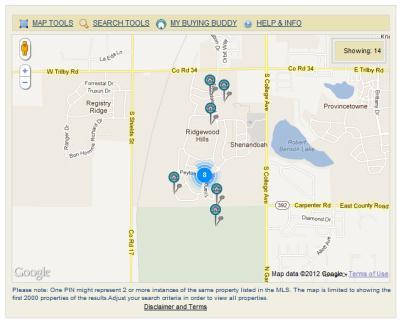
6 Subdivision Map Homes For Sale In Subdivision By Price 6
7 7
8 8
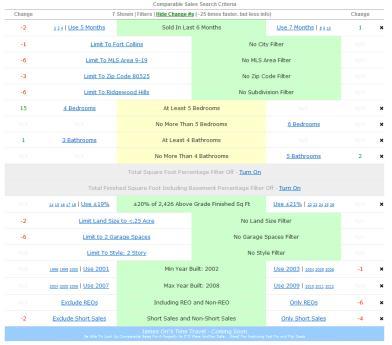
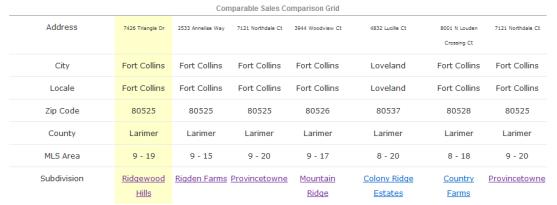
9 Looks Interesting? Determine ARV Comparable Sales Table 9


10 Comparable Sales Table Comparable Sales Table Comparable Sales Table Comparable Sales Tools Comparable Sales Plus a bunch more, but you get the idea There is both a science and art to determining value Enter Your ARV, FMR and Repairs 10


11 Improvement Estimator Cash Offer Calculation Example How Does This Home Compare? To other homes for sale in the same subdivision? Price Price/Sq Ft Price/Above Grade Finished Sq Ft To other homes that sold in the same subdivision recently? Price Price/Sq Ft Price/Above Grade Finished Sq Ft Report on this in both gauge and list format just scroll through drill down to see details as desired. 11


")

12 Calculate Net Operating Income Relatively unusual to do this calculation on single family homes Automatic on each property Then calculate: Capitalization Rate First Year Cash on Cash Return 5 Year Internal Rate of Return Allows you to then sort the entire MLS by most profitable cash flow properties Capitalization Rate Divide Net Operating Income (for the year) by purchase price to calculate Capitalization Rate Can sort the entire MLS by highest Capitalization Rate since I do this for every property 12


13 Best Properties By Capitalization Rate Cash on Cash Return - Year 1 Next, determine what your cash return on investment would be in year 1 for 3 different down payment amounts 20%, 25% and 30% down 2 different closing costs scenarios Seller paying all closing costs and you (as buyer) paying all closing costs 2 different property management scenarios Self managed versus professionally managed That s a total of 12 different Cash on Cash return on investment calculations for year 1. Best Properties By Cash on Cash 5 Year Internal Rate of Return Next, determine what your internal rate of return would be buying the property with 20% down selling it in 5 years later collecting cash flow for the 5 year period Based on the following economic model and assumptions 13


14 This is most like how I personally analyze properties for my own portfolio. Best Properties By 5 Year IRR Popular Fort Collins Subdivisions The 5 sided offer scale: PV FV N I/year PMT Got to start thinking in multiple dimensions to maximize deal flow 14


15 100:10:3:1 Rule Real Estate Riches by Dr. Dolf De Roos 50:1 No Down Payment by Carleton Sheets 30:10:3:1 Millionaire Real Estate Investor by Gary Keller et al 30:1 Weekend Millionaire's Frequently Asked Real Estate Questions by Mike Summey and Roger Dawson Outside the MLS different than inside the MLS Subject To Installment Land Contract Rent To Own Loan Assumption Wrap Financing Owner Financing Do you get the deed at the beginning? Y Y Y N N Y Down payment required? U S S U U S Paying down on loan? U U U N U U Requires traditional bank credit approval? N N U N N N Triggers "Due On Sale" clause? N U N S S U Allows you to refinance with new Y Y Y S U Y loan? Must seller foreclose to get you out? Y Y Y S S Y Does all of your monthly payment apply N N N N N N toward purchase? Does part of your monthly payment apply toward purchase? U U U S U U Does all of your down payment apply toward purchase? Y Y Y U U Y Do you need an attorney to buy with this strategy? Y Y Y Y Y Y Is the down payment non-refundable? Y Y Y U Y Y Are the entire monthly payments non-refundable? Y Y Y Y Y Y Good in a market where home values are going up? Y Y Y Y Y Y Good in a market where home values are going down? S S S U S S Good in a market where interest rates are going up? U U U S S U Good in a market where interest rates are going down? U U U Y U U Requires seller credit approval? Y Y U U U S Do you get tax benefits of ownership? Y Y Y N S U Does buyer default harm seller? Y Y S Y Y Y Saves expense of moving twice? Y Y Y Y Y Y Can be a long term solution in one step? Y S Y S S N Does real estate agent typically get commission Y Y Y N N Y up front? 15
GUIDE. The Shields Team of Keller Williams Realty (423)
") GUIDE The Shields Team of Keller Williams Realty (423) 896-1232 www.tricityrealestateforsale.com theshieldsteam@gmail.com Shields Team At The Shields Team, we also love real estate--the land, the homes,
GUIDE The Shields Team of Keller Williams Realty (423) 896-1232 www.tricityrealestateforsale.com theshieldsteam@gmail.com Shields Team At The Shields Team, we also love real estate--the land, the homes,
By Gary Massari, Founder of Make Money Now Real Estate
 , Founder of Make Money Now Real Estate Table of Contents What Is Wholesaling?...- 2 - Income Potential from Wholesaling...- 3 - What Do You Need to Get Started?...- 4 - Profit Potential... - 5 - Using
FACT 2: Only 8-12% Of These Properties Are Actually Good Investment Deals
 HOW TO FIND THE MOST PROFITABLE REAL ESTATE DEALS IN YOUR MARKET BEFORE YOUR COMPETITION FACT 1: 80% Of All Homes Sold In The US Are Sold Via The MLS FACT 2: Only 8-12% Of These Properties Are Actually
Welcome and Congratulations!
 Welcome and Congratulations! What s Coming 14 Fast Financing Formulas Creative Financing Combos Creative Financing Do s & Don ts Replays (with corresponding documents, forms and bonuses) posted in members
Deal Analysis & Appraisal Checklist
 STAGE 1 GATHERING PROPERTY INFORMATION o Research the Seller o Fill out the "Seller Lead Sheet" o Research the Agent o Pull up or Printout the MLS Property Listing Sheet o Fill out the "Agent Lead Sheet"
Lease Options 101. Edward O Daniel
 Lease Options 101 Edward O Daniel Agenda Introduction to lease options Sandwich lease options Learn multiple ways to profit in the deal Handling the paperwork involved Scenarios Property owner selling
Who are we? Our Services. About the Auctions. Auction Lists Drive Reports Bidding Live Auction Results Title Checks
 Who are we? Our Services Auction Lists Drive Reports Bidding Live Auction Results Title Checks BuyLowAz provides investors with a daily list of properties going to Auction. The daily list includes opening
5 Magic Paths to. in Real Estate. Making a Fortune JAMES E.A. LUMLEY. John Wiley & Sons, Inc.
 5 Magic Paths to Making a Fortune in Real Estate S E C O N D E D I T I O N JAMES E.A. LUMLEY John Wiley & Sons, Inc. 5 Magic Paths to Making a Fortune in Real Estate S E C O N D E D I T I O N JAMES E.A.
Lead Generation Analytics & Automation Investment Tools
 Advanced Technology for the Successful Investor Lead Generation Analytics & Automation Investment Tools www.realestateiq.co REAL ESTATEIQ Advanced Technology that Works for All Investors Residential Real
REAL ESTATE WHOLESALING BIBLE. The Fastest. Easiest Way. t Get Started in. Real Estate. Investing THAN MERRILL WILEY
 REAL ESTATE WHOLESALING BIBLE The Fastest. Easiest Way t Get Started in Real Estate Investing THAN MERRILL WILEY Contents Introduction 1 The Shrinking Middle Class in America 1 How I Got Started Investing
Deal Analyzer For Flips
 Preview Of What You Will Learn Sections: Introduction...5 Using This Manual...7 Section 1: General Property Information...8 Section 2: Property Values & Pricing......9 Section 3: Financing Costs...12 Section
Ninety percent of all millionaires become so through owning real estate. -Andrew Carnegie
 1 P age Copyright 2013 Christopherseder.com. All rights reserved. No part of this book may be reproduced, transmitted by any means, electronic, mechanical, photocopy, and recording or otherwise without
Hi, I m. Tell me a little more about your home here.
 First, Introduce Yourself. Hi, I m. Tell me a little more about your home here. Start walking through the home with them. Now, ask them Why did you buy this home in the first place? Wait for them to tell
Building Wealth in Chunks
 www.futuremoneytrends.com Building Wealth in Chunks Cash Flow for Life July 2015 Dear Reader, This month s Cash Flow for Life Letter will be a bit more laborious than our others. However, the profits with
Why is real estate investing the
 9669_Shemin_01.w.qxd 9/19/02 11:40 AM Page 7 C H A P T E R 1 Act as if it were impossible to fail. DOROTHEA BRANDE Real Estate: The Best Wealth Builder in the Universe Why is real estate investing the
Wholesaling Step by Step. Edward O Daniel
 Wholesaling Step by Step Edward O Daniel Agenda Marketing for sellers Taking seller calls Analyzing deals and making appointments Handling the paperwork Getting PAID!!!! Goal of this call My goal for this
Foreclosure Sales Nearly Double from Prior Year Despite Jump in Sales, Foreclosure Delays Remain at Record Levels
 Foreclosure Sales Nearly Double from Despite Jump in Sales, Foreclosure Delays Remain at Record Levels Discovery Bay, CA, April 13, 2010 - ForeclosureRadar (www.foreclosureradar.com), the only website
GOVERNMENT PROPERTY AUCTIONS E-BOOK
 GOVERNMENT PROPERTY AUCTIONS E-BOOK Creative Strategies To Increase Your Property Portfolio Check us out on Facebook! www.governmentpropertyauctions.com.au Table of contents: Government Property 1 Auctions
The 7 Critical Steps for Getting Started in Real Estate Investing
 JumpStartREI.com presents The 7 Critical Steps for Getting Started in Real Estate Investing Your Instructor: Socorro Curiel Master Coach Real Estate Investor Educator Socorro@JumpStartREI.com Why are so
Village Street Multifamily
 For more information contact: Managing Director ejordan@northeastpcg.com Drew Kirkland Senior Associate (857) 990-6802 dkirkland@northeastpcg.com Francis Saenz Licensed Associate (857) 990-6803 fsaenz@northeastpcg.com
The Hidden Potential Working with Investors. Wendy Patton
 The Hidden Potential Working with Investors Wendy Patton Wendy Patton Novi, Michigan Regional Instructor 2 Tell Keller Williams University what you think! Simply enter www.evalfr.com into any mobile device
Flow Chart- Researching Real Estate
 Flow Chart- Researching Real Estate 1. Generate Lead (20 + Methods) 2. Gather Data 3. Analyze Data 4. Assess Maximum Price to Pay (Comparable Analysis & Discount Worksheet/Term Worksheet OR Cash Flow Analysis)
Contents. off the fence. It s a good life!
 I hope you enjoy the latest edition of Brian Buffini s Real Estate Report. The goal of this piece is to help you stay educated on today s market and position yourself as a true professional and your clients
MAKING MONEY AS A PROBATE PROPERTY INVESTOR LEON MCKENZIE
 ver stop to think about all of the different types of property we accumulate throughout our lifetime what happens to it when we are no longer around? Ever wonder what happens to property that is owned
Record Number of Foreclosures Cancelled Auction investors see fewer deals, better margins
 Record Number of Foreclosures Cancelled Auction investors see fewer deals, better margins Discovery Bay, CA, July 13, 2010 - ForeclosureRadar (www.foreclosureradar.com), the only website that tracks every
The Arizona Swimming Pool Permit Process
 Before you begin the process of submitting your swimming pool application to your local municipality you must first create your site map. A site map is simply a scaled drawing of your property that includes
Industry Partners Conference. The Scenario. The Escrow That Actually Closes
 Industry Partners Conference 2013 The Scenario The Escrow That Actually Closes An Exclusive Residential Listing Agreement is executed using DocuSign. The listing agent s contact is Margaret Windsor, the
Summary Statistics. Closed Sales. Paid in Cash. Median Sale Price. Average Sale Price. Dollar Volume. Median Time to Sale.
 Summary Statistics July 216 July 215 Paid in Cash 24,83 26,165-8.% 6,48 8,533-24.9% $223,238 $199,999 11.6% Average Sale Price Dollar Volume $299,292 $277,17 8.% $7.2 Billion $7.3 Billion -.6% Median Percent
Begin by developing a strong marketing plan. The cornerstone will be internet driven
 Wednesday, February 16, 2011 Chuck Fethe, Realtor Keller Williams Realty 11121 Kingston Pike, Ste, C Knoxville, TN 37934 Hello and Welcome, You re ready to sell your property. And, while you re looking
Summary Statistics. Closed Sales. Paid in Cash. Median Sale Price. Average Sale Price. Dollar Volume. Median Time to Sale.
 ly Market Detail - January 217 Summary Statistics January 217 January 216 Paid in Cash 7,29 6,791 6.2% 4,298 4,28 2.1% $161, $151, 6.6% Average Sale Price Dollar Volume $244,52 $235,221 4.% $1.8 Billion
Summary Statistics. Closed Sales. Paid in Cash. Median Sale Price. Average Sale Price. Dollar Volume. Median Time to Sale.
 Summary Statistics November 216 November 215 Paid in Cash 19,763 17,523 12.8% 5,827 6,65-11.8% $22, $199,99 1.% Average Sale Price Dollar Volume $29,49 $273,155 6.2% $5.7 Billion $4.8 Billion 19.8% Median
Summary Statistics. Closed Sales. Paid in Cash. Median Sale Price. Average Sale Price. Dollar Volume. Median Time to Sale.
 ly Market Detail - September 217 Summary Statistics September 217 September 216 Paid in Cash 18,3 22,653-2.4% 4,698 6,344-25.9% $239,9 $223, 7.6% Average Sale Price Dollar Volume $36,77 $289,781 5.9% $5.5
Summary Statistics. Closed Sales. Paid in Cash. Median Sale Price. Average Sale Price. Dollar Volume. Median Time to Sale.
 ly Market Detail - March 217 Summary Statistics March 217 March 216 Paid in Cash 25,921 23,714 9.3% 7,567 7,594 -.4% $231,9 $29,969 1.4% Average Sale Price Dollar Volume $318,115 $285,868 11.3% $8.2 Billion
JEFFREY SAMUELS. Welcome! Maximize Your Real Estate Value!
 Welcome! We look forward to speaking with you about the future sale of your home. We are confident you will feel that the programs we outline for you will provide you with the greatest possibility of selling
Summary Statistics. Closed Sales. Paid in Cash. Median Sale Price. Average Sale Price. Dollar Volume. Median Time to Sale.
 Summary Statistics January 219 January 218 Paid in Cash 15,526 16,561-6.2% 4,556 5,34-9.5% $249,9 $24, 4.1% Average Sale Price Dollar Volume $34,241 $334,381 1.8% $5.3 Billion $5.5 Billion -4.6% Median
Summary Statistics. Closed Sales. Paid in Cash. Median Sale Price. Average Sale Price. Dollar Volume. Median Time to Sale.
 ly Market Detail - January 218 Summary Statistics January 218 January 217 Paid in Cash 7,634 7,29 5.9% 4,328 4,298.7% $179,9 $161, 11.7% Average Sale Price Dollar Volume $286,44 $244,52 17.1% $2.2 Billion
To make money in short-sale foreclosures you must
 C H A P T E R1 Make Money in Short-Sale Foreclosures To make money in short-sale foreclosures you must first understand foreclosures. Two strategies to make money in foreclosures are quick cash and long-term
7 PRINCIPLES OF THE INVEST FOUR MORE STRATEGY
 7 PRINCIPLES OF THE INVEST FOUR MORE STRATEGY INVESTING IN REAL ESTATE CAN BRING INCREDIBLE RETURNS. YOU HAVE COMPLETE CONTROL OVER YOUR INVESTMENT, UNLIKE THE STOCK MARKET OR MUTUAL FUNDS. YOUR INVESTMENT
MLSSAZ: Comparative Market Analysis (CMA) in Flexmls
 in Flexmls") MLSSAZ: Comparative Market Analysis (CMA) in Flexmls Class Objectives Utilize property research tools to assist you in obtaining listing information. Use search results to create a CMA.. MLS Technical
MLSSAZ: Comparative Market Analysis (CMA) in Flexmls Class Objectives Utilize property research tools to assist you in obtaining listing information. Use search results to create a CMA.. MLS Technical
A wall between the great room and kitchen adds formality to this floorplan, but an open doorway helps keep things casual.
 A wall between the great room and kitchen adds formality to this floorplan, but an open doorway helps keep things casual. Lindal cedar homes of seattle photo Go with the Flow When a floorplan flows well
Summary Statistics. Closed Sales. Paid in Cash. Median Sale Price. Average Sale Price. Dollar Volume. Median Time to Sale.
 Summary Statistics November 218 November 217 Paid in Cash 2,578 19,983 3.% 5,338 5,372 -.6% $255, $24, 6.3% Average Sale Price Dollar Volume $331,711 $314,76 5.4% $6.8 Billion $6.3 Billion 8.5% Median
Presented by. Socorro Curiel Master Coach
 JumpStartREI.com presents Higher Profits - Lower Risks in Real Estate Investing Presented by Socorro Curiel Master Coach www.jumpstartrei.com Why are so many people INTRIGUED by Real Estate Investing?
Buyers Guide to REO Properties
 2010 Buyers Guide to REO Properties Mike Bridges Property Express CRM 2/22/2010 Table of Contents Table of Contents... 2 Introduction... 3 What are REO Properties?... 3 The Buying Process... 3 Select a
Midstate Office Park
 For more information contact: Managing Director ejordan@northeastpcg.com Drew Kirkland Licensed Associate (857) 990-6802 dkirkland@northeastpcg.com Francis Saenz Investment Associate (857) 990-6803 fsaenz@northeastpcg.com
Summary Statistics. Closed Sales. Paid in Cash. New Pending Sales. New Listings. Median Sale Price. Average Sale Price. Median Time to Contract
 Monthly Market Detail - 216 Summary Statistics 216 215 Paid in Cash 1,863 1,796 3.7% 1,113 1,134-1.9% New Pending Sales 2,6 2,55.2% 3,11 3,92.3% $16, $147,995 8.1% Average Sale Price $192,637 $178,796
Summary Statistics. Closed Sales. Paid in Cash. Median Sale Price. Average Sale Price. Dollar Volume. Median Time to Sale.
 Summary Statistics February 8 February 7 Paid in Cash 8.%.% $8, $8, -6.8% Average Sale Price Dollar Volume $9,76 $7, -.7% $79,68 $9, 6.% Median Percent of Original List Price Received 97.% 9.%.% Median
Summary Statistics. Closed Sales. Paid in Cash. Median Sale Price. Average Sale Price. Dollar Volume. Median Time to Sale.
 ly Market Detail - May 218 Summary Statistics May 218 May 217 Paid in Cash 12,25 11,551 4.1% 6,24 6,285-1.3% $188, $177,6 5.9% Average Sale Price Dollar Volume $282,262 $261,48 7.9% $3.4 Billion $3. Billion
Summary Statistics. Closed Sales. Paid in Cash. Median Sale Price. Average Sale Price. Dollar Volume. Median Time to Sale.
 ly Market Detail - 213 Summary Statistics 213 212 Paid in Cash 225,46 23,85 11.% 11,334 92,853 9.1% $168,5 $145, 16.2% Average Sale Price Dollar Volume $246,86 $22,89 11.8% $55.5 Billion $44.7 Billion
Summary Statistics. Closed Sales. Paid in Cash. Median Sale Price. Average Sale Price. Dollar Volume. Median Time to Sale.
 Summary Statistics November 8 November 7 Paid in Cash 8.% 66.7% $,7 $7, -6.% Average Sale Price Dollar Volume $6,87 $8,7-7.% $8, $, 66.% Median Percent of Original List Price Received 8.6% 9.% -.% Median
Summary Statistics. Closed Sales. Paid in Cash. Median Sale Price. Average Sale Price. Dollar Volume. Median Time to Sale.
 ly Market Detail - Q1 216 Summary Statistics Q1 216 Q1 215 Paid in Cash 57,913 57,742.3% 2,133 23,724-15.1% $23,5 $182, 11.8% Average Sale Price Dollar Volume $285,447 $266,453 7.1% $16.5 Billion $15.4
The top 25 blogs for beginner real estate estate investors to learn the ins and from their shrewd investment strategies - including real estate
 Real Estate: 25 Best Strategies For Real Estate Investing, Home Buying And Flipping Houses (Real Estate, Real Estate Investing, Home Buying, Flipping Houses,... Income, Investing, Entrepreneurship) By
LeaseCalcs: Expand Without Reducing Profits? Yes!
 LeaseCalcs: Expand Without Reducing Profits? Yes! Marc A. Maiona July 8, 2014 Can you Expand Without Reducing Profits? Yes, it is possible! Thinking a bit more strategically can yield a P&L neutral expansion.
Circular Gardens Apartments
 For more information contact: Managing Director ejordan@northeastpcg.com Bradley Balletto Regional Manager (203) 307-1574 bballetto@northeastpcg.com Mallory Chila Licensed Associate (203) 307-1578 mchila@northeastpcg.com
Summary Statistics. Closed Sales. Paid in Cash. Median Sale Price. Average Sale Price. Dollar Volume. Median Time to Sale.
 ly Market Detail - Q1 217 Summary Statistics Q1 217 Q1 216 Paid in Cash 6,69 57,779 5.% 18,678 2,133-7.2% $226, $24,74 1.7% Average Sale Price Dollar Volume $311,2 $286,99 8.8% $18.9 Billion $16.5 Billion
Determining Your Offer Price
 Determining Your Offer Price When you prepare an offer to purchase a home, you already know the seller s asking price. But what price are you going to offer and how do you come up with that figure? Determining
Summary Statistics. Closed Sales. Paid in Cash. New Pending Sales. New Listings. Median Sale Price. Average Sale Price. Median Days on Market
 Summary Statistics November 214 November 213 Paid in Cash 77 783-1.7% 64 632-4.4% New Pending Sales 959 916 4.7% 1,248 1,493-16.4% $53, $49,225 7.7% Average Sale Price $64,3 $58,348 9.7% Median Days on
The Real Estate Wholesaling Bible: The Fastest, Easiest Way To Get Started In Real Estate Investing Free Ebooks PDF
 The Real Estate Wholesaling Bible: The Fastest, Easiest Way To Get Started In Real Estate Investing Free Ebooks PDF Learn how to make money wholesaling real estate without ever swinging a hammer or dealing
Message What we are offering? Media
 D.C. Fawcett The Nation s Leading Short Sale Automator To generate low cost, direct response leads of distressed commercial deals before they re listed and before your competition knows about them. Goldmining
OUR BRRRR STRATEGY Buy Rehab Rent Refinance Repeat
 OUR BRRRR STRATEGY Buy Rehab Rent Refinance Repeat ANDREW SYRIOS Our company is a big fan of the BRRRR method of real estate investment that Brandon Turner coined and BiggerPockets. In this article, I
VIP SELLER PROGRAM. 146 Step System to get your home sold fast and for top dollar. Lisa Elly-Nicholson, Realtor. Keller Williams Realty Chesterfield
 146 Step System to get your home sold fast and for top dollar Lisa Elly-Nicholson, Realtor Keller Williams Realty Chesterfield Cell: 636-227-9093 Office: 636-534-8100 Email: Lisa.Nicholson@kw.com Elly-NicholsonTeam.com
Summary Statistics. Closed Sales. Paid in Cash. New Pending Sales. New Listings. Median Sale Price. Average Sale Price. Median Days on Market
 ly Market Detail - April Summary Statistics April April Paid in Cash.%.% New Pending Sales 9 -.9% -.% $, $,.% Average Sale Price $, $,.7% Median Days on Market 7-7.% Average Percent of Original List Price
Summary Statistics. Closed Sales. Paid in Cash. Median Sale Price. Average Sale Price. Dollar Volume. Median Time to Sale.
 Summary Statistics Q3 218 Q3 217 Paid in Cash 28,894 26,39 9.5% 14,3 13,783 3.8% $182,5 $171,945 6.1% Average Sale Price Dollar Volume $254,582 $239,736 6.2% $7.4 Billion $6.3 Billion 16.3% Median Percent
How Selling Your House to a Real Estate Investor Stacks Up Against Your Other Options
 How Selling Your House to a Real Estate Investor Stacks Up Against Your Other Options Pros, cons, costs, and timeline of each option So, you need to sell your house. Selling in a market like today s can
Grove Street Apartments
 For more information contact: Managing Director ejordan@northeastpcg.com Bradley Balletto Regional Manager (203) 307-1574 bballetto@northeastpcg.com Mallory Chila Licensed Associate 203-307-2578 mchila@northeastpcg.com
Full CMA. Cover Page Tab
 CMA A Comparable Market Analysis (CMA) is a comparison between properties that are like a property you re trying to sell. A CMA is used in pricing a property you compare the property you re trying to sell
LeaseCalcs: Blend and Extend Failure
 LeaseCalcs: Blend and Extend Failure Marc A. Maiona June 6, 2016 Blend and extend failure reduced rent but reduced profits, too. Will your blend and extend strategy help or hurt profitability? Roughly
Thank you for giving me the opportunity to discuss the future sale of your home!
 Thank you for giving me the opportunity to discuss the future sale of your home! Enclosed is my exclusive Pre-Listing Package. I am confident you will feel that the programs I outline for you will provide
THIRTY-ISH WAYS TO FINDS A DEAL. Stephen McKee Chief Operating Officer Rehab Loan Group
 THIRTY-ISH WAYS TO FINDS A DEAL Stephen McKee Chief Operating Officer Rehab Loan Group Southern California REAL ESTATE AGENTS WHO SELL FLIPS Use Proper tyradar.com s Transfer Search option. S e a r c h
Summary Statistics. Closed Sales. Paid in Cash. New Pending Sales. New Listings. Median Sale Price. Average Sale Price. Median Days on Market
 ly Market Detail - June Summary Statistics June June Paid in Cash.% N/A New Pending Sales.%.% $,9 $,.% Average Sale Price $, $,.% Median Days on Market 7.% Average Percent of Original List Price Received
Summary Statistics. Closed Sales. Paid in Cash. Median Sale Price. Average Sale Price. Dollar Volume. Median Time to Sale.
 Summary Statistics June 217 June 216 Paid in Cash 2,2 1,885 7.2% 378 356 6.2% $245, $229,9 6.6% Average Sale Price Dollar Volume $38,695 $286,8 7.6% $623.6 Million $54.6 Million 15.3% Median Percent of
Summary Statistics. Closed Sales. Paid in Cash. Median Sale Price. Average Sale Price. Dollar Volume. Median Time to Sale.
 Summary Statistics June 217 June 216 Paid in Cash 1,692 1,85-6.3% 341 444-23.2% $355, $325, 9.2% Average Sale Price Dollar Volume $426,34 $377,929 12.8% $721.3 Million $682.2 Million 5.7% Median Percent
Summary Statistics. Closed Sales. Paid in Cash. Median Sale Price. Average Sale Price. Dollar Volume. Median Time to Sale.
 ly Market Detail - June 217 Summary Statistics June 217 June 216 Paid in Cash 1,62 1,635-2.% 93 963-6.2% $16, $149,25 7.2% Average Sale Price Dollar Volume $214,677 $188,27 14.% $343.9 Million $37.8 Million
Summary Statistics. Closed Sales. Paid in Cash. Median Sale Price. Average Sale Price. Dollar Volume. Median Time to Sale.
 ly Market Detail - May 217 Summary Statistics May 217 May 216 Paid in Cash 431 411 4.9% 85 13-17.5% $215, $185, 16.2% Average Sale Price Dollar Volume $238,517 $214,566 11.2% $12.8 Million $88.2 Million
Summary Statistics. Closed Sales. Paid in Cash. Median Sale Price. Average Sale Price. Dollar Volume. Median Time to Sale.
 ly Market Detail - April 216 Summary Statistics April 216 April 215 Paid in Cash 881 914-3.6% 271 316-14.2% $179,9 $155, 16.1% Average Sale Price Dollar Volume $216,31 $193,311 11.8% $19.3 Million $176.7
Valbridge Valuation Advisory
 Valbridge Valuation Advisory Re: Attn: Multi-Family Property Taxes Lenders and Purchasers Cash is king, and property taxes can kill the cash flow of a multi-family property. What does that mean to you?
Cash Flow for Life #3 September 2014
 Cash Flow for Life #3 September 2014 NOTE: Hold CTRL when clicking a link so it opens in a new browser window. Dear, Cash flow, cash flow, cash flow, I said as my 4-year-old son looked up in my eyes. We
Summary Statistics. Closed Sales. Paid in Cash. Median Sale Price. Average Sale Price. Dollar Volume. Median Time to Sale.
 ly Market Detail - November 216 Summary Statistics November 216 November 215 Paid in Cash 184 159 15.7% 47 45 4.4% $339,95 $329, 3.3% Average Sale Price Dollar Volume $671,917 $521,441 28.9% $123.6 Million
HOMEBUYER DISCLOSURE STATEMENT (MAMMOTH LAKES HOUSING, INC.)
") HOMEBUYER DISCLOSURE STATEMENT (MAMMOTH LAKES HOUSING, INC.) Mammoth Lakes Housing, Inc. ("MLH") has made it possible for low and moderate income households like yours to buy a house at a price that is
HOMEBUYER DISCLOSURE STATEMENT (MAMMOTH LAKES HOUSING, INC.) Mammoth Lakes Housing, Inc. ("MLH") has made it possible for low and moderate income households like yours to buy a house at a price that is
Summary Statistics. Closed Sales. Paid in Cash. Median Sale Price. Average Sale Price. Dollar Volume. Median Time to Sale.
 Summary Statistics September 216 September 215 Paid in Cash 215 21 2.4% 35 62-43.5% $374,186 $379, -1.3% Average Sale Price Dollar Volume $646,345 $574,329 12.5% $139. Million $12.6 Million 15.2% Median
Home buying tips / Eight steps to buying your home
 Home buying tips / Eight steps to buying your home The below info is to provide guidance mainly to new buyers. As your agent I will help and guide you with all of the below so you can focus on enjoying
Episode 17 Get Creative! Out of the Box Ways to Structure Real Estate Deals
 https://www.spousesflippinghouses.com Hosted by: Doug & Andrea Van Soest Episode 17 Get Creative! Out of the Box Ways to Structure Real Estate Deals Doug: Welcome back to Spouses Flipping Houses podcast.
Summary Statistics. Closed Sales. Paid in Cash. Median Sale Price. Average Sale Price. Dollar Volume. Median Time to Sale.
 ly Market Detail - July 216 Summary Statistics July 216 July 215 Paid in Cash 41 431-4.9% 151 28-27.4% $178,25 $175,9 1.3% Average Sale Price Dollar Volume $27,771 $21,414 3.2% $85.2 Million $86.8 Million
Summary Statistics. Closed Sales. Paid in Cash. Median Sale Price. Average Sale Price. Dollar Volume. Median Time to Sale.
 ly Market Detail - October 216 Summary Statistics October 216 October 215 Paid in Cash 329 347-5.2% 114 138-17.4% $38, $39, -2.6% Average Sale Price Dollar Volume $67,156 $72,396-7.% $22.5 Million $25.
Summary Statistics. Closed Sales. Paid in Cash. Median Sale Price. Average Sale Price. Dollar Volume. Median Time to Sale.
 ly Market Detail - February 216 Summary Statistics February 216 February 215 Paid in Cash 913 972-6.1% 571 711-19.7% $144,95 $128, 13.2% Average Sale Price Dollar Volume $26,993 $217,41-4.8% $188.4 Million
Summary Statistics. Closed Sales. Paid in Cash. Median Sale Price. Average Sale Price. Dollar Volume. Median Time to Sale.
 ly Market Detail - July 216 Summary Statistics July 216 July 215 Paid in Cash 11 28-6.7% 9 25-64.% $85,5 $76, 12.5% Average Sale Price Dollar Volume $1,5 $79,625 26.2% $1.1 Million $2.2 Million -5.4% Median
Summary Statistics. Closed Sales. Paid in Cash. Median Sale Price. Average Sale Price. Dollar Volume. Median Time to Sale.
 ly Market Detail - July 216 Summary Statistics July 216 July 215 Paid in Cash 22 19 15.8% 2 18 11.1% $71,25 $76, -6.3% Average Sale Price Dollar Volume $82,25 $76,77 7.1% $1.8 Million $1.5 Million 24.%
Summary Statistics. Closed Sales. Paid in Cash. Median Sale Price. Average Sale Price. Dollar Volume. Median Time to Sale.
 ly Market Detail - May 216 Summary Statistics May 216 May 215 Paid in Cash 1,275 1,251 1.9% 728 842-13.5% $165,5 $15,95 9.6% Average Sale Price Dollar Volume $267,595 $25,933 6.6% $341.2 Million $313.9
Summary Statistics. Closed Sales. Paid in Cash. Median Sale Price. Average Sale Price. Dollar Volume. Median Time to Sale.
 ly Market Detail - May 216 Summary Statistics May 216 May 215 Paid in Cash 242 249-2.8% 76 113-32.7% $33, $285, 15.8% Average Sale Price Dollar Volume $395,514 $47,619-3.% $95.7 Million $11.5 Million -5.7%
Summary Statistics. Closed Sales. Paid in Cash. Median Sale Price. Average Sale Price. Dollar Volume. Median Time to Sale.
 ly Market Detail - June 216 Summary Statistics June 216 June 215 Paid in Cash 1,177 1,342-12.3% 346 463-25.3% $23,5 $21, 9.8% Average Sale Price Dollar Volume $323,891 $35,961 5.9% $381.2 Million $41.6
Summary Statistics. Closed Sales. Paid in Cash. Median Sale Price. Average Sale Price. Dollar Volume. Median Time to Sale.
 ly Market Detail - October 217 Summary Statistics October 217 October 216 Paid in Cash 229 26 11.2% 93 87 6.9% $221,17 $19, 16.4% Average Sale Price Dollar Volume $326,449 $272,452 19.8% $74.8 Million
Summary Statistics. Closed Sales. Paid in Cash. Median Sale Price. Average Sale Price. Dollar Volume. Median Time to Contract. Median Time to Sale
 Summary Statistics April 217 April 216 Paid in Cash 1,651 1,76-3.2% 341 46-16.% $229,99 $28, 1.6% Average Sale Price Dollar Volume $275,842 $26,786 5.8% $455.4 Million $444.9 Million 2.4% Median Percent
Summary Statistics. Closed Sales. Paid in Cash. Median Sale Price. Average Sale Price. Dollar Volume. Median Time to Sale.
 ly Market Detail - March 216 Summary Statistics March 216 March 215 Paid in Cash 4,128 4,313-4.3% 1,357 1,724-21.3% $292,25 $275, 6.3% Average Sale Price Dollar Volume $434,683 $44,392 7.5% $1.8 Billion
Summary Statistics. Closed Sales. Paid in Cash. Median Sale Price. Average Sale Price. Dollar Volume. Median Time to Sale.
 ly Market Detail - November 217 Summary Statistics November 217 November 216 Paid in Cash 19,99 19,725 1.3% 5,375 5,827-7.8% $24, $22, 9.1% Average Sale Price Dollar Volume $314,632 $29,579 8.3% $6.3 Billion
Summary Statistics. Closed Sales. Paid in Cash. Median Sale Price. Average Sale Price. Dollar Volume. Median Time to Sale.
 ly Market Detail - December 217 Summary Statistics December 217 December 216 Paid in Cash 9,193 8,673 6.% 4,774 4,842-1.4% $18, $166,9 7.8% Average Sale Price Dollar Volume $261,64 $235,44 11.1% $2.4 Billion
Summary Statistics. Closed Sales. Paid in Cash. Median Sale Price. Average Sale Price. Dollar Volume. Median Time to Sale.
 ly Market Detail - September 216 Summary Statistics September 216 September 215 Paid in Cash 8,818 9,179-3.9% 4,917 5,477-1.2% $16, $15, 6.7% Average Sale Price Dollar Volume $221,69 $228,336-2.9% $2.
Summary Statistics. Closed Sales. Paid in Cash. Median Sale Price. Average Sale Price. Dollar Volume. Median Time to Contract. Median Time to Sale
 ly Market Detail - May 217 Summary Statistics May 217 May 216 Paid in Cash 238 25-4.8% 112 16-3.% $186,25 $166,75 11.7% Average Sale Price Dollar Volume $21,554 $23,591-8.7% $5.1 Million $57.6 Million
Summary Statistics. Closed Sales. Paid in Cash. Median Sale Price. Average Sale Price. Dollar Volume. Median Time to Contract. Median Time to Sale
 ly Market Detail - May 217 Summary Statistics May 217 May 216 Paid in Cash 987 958 3.% 235 267-12.% $211, $185, 14.1% Average Sale Price Dollar Volume $25,67 $225,61 11.1% $247.4 Million $216.1 Million
Summary Statistics. Closed Sales. Paid in Cash. Median Sale Price. Average Sale Price. Dollar Volume. Median Time to Contract. Median Time to Sale
 ly Market Detail - November 217 Summary Statistics November 217 November 216 Paid in Cash 1,115 1,257-11.3% 218 34-28.3% $35, $318, 1.1% Average Sale Price Dollar Volume $427,257 $387,744 1.2% $476.4 Million
Summary Statistics. Closed Sales. Paid in Cash. Median Sale Price. Average Sale Price. Dollar Volume. Median Time to Contract. Median Time to Sale
 ly Market Detail - April 217 Summary Statistics April 217 April 216 Paid in Cash 1,4 1,463-4.3% 299 378-2.9% $33, $31, 6.5% Average Sale Price Dollar Volume $397,5 $377,965 5.% $555.8 Million $553. Million.5%
Summary Statistics. Closed Sales. Paid in Cash. Median Sale Price. Average Sale Price. Dollar Volume. Median Time to Sale.
 ly Market Detail - 216 Summary Statistics 216 215 Paid in Cash 268,731 266,29.9% 8,84 95,65-16.3% $219,9 $196, 12.2% Average Sale Price Dollar Volume $293,581 $276,482 6.2% $78.9 Billion $73.6 Billion