Foreclosure Report, July 2008
|
|
|
- Osborne O’Brien’
- 5 years ago
- Views:
Transcription

1 Foreclosure Report, y 2008
2 provides real estate professionals and investors with comprehensive property information, including owner name and phone number, building details, comparable sales, foreclosure listings, zoning, violations, maps, mailing lists, and photos. offers the transparency essential to evaluate real estate and make informed decisions. For a free basic account, visit In this monthly report, provides charts, tables, and metrics about residential foreclosures (a.k.a. trustee sales) in four key metro areas (New York City, Miami, Los Angeles, and Seattle). The time period includes numbers from the past two years, with emphasis on y For the purposes of this report, a foreclosure is defined as a property scheduled for auction for the first time during the period. The report focuses on new foreclosures rather than properties that have been in and out of foreclosure or those that have had auctions postponed. We are still in the middle of a housing hurricane where foreclosure activity remains high, home p r i c e s h a v e declined, and the number of sales transactions has fallen dramatically. A c r i s i s f o r homeowners; a p o t e n t i a l opportunity for investors. Bill Staniford, CEO Key Takeaways (New York City, Miami, Los Angeles, and Seattle) Foreclosures increase in all four regions; LA and Miami reach two-year highs Compared to y 2007, the Los Angeles foreclosure rate was on top with a 249% increase, followed by Seattle with 156%, Miami up 137%, and New York City up 67%. One in every 526 LA County homes scheduled in y In Los Angeles, one in every 526 homes was scheduled for a first time foreclosure auction in y In comparison, New York City registers one in every 10,000 homes scheduled for foreclosure auction. Queens dominates New York City foreclosure activity In y, the top New York City zip codes for foreclosure activity were in Queens (specifically Jamaica and St. Albans). Exacerbating the situation, overall residential sales transactions in these zip codes dropped by 40% in the first two quarters of 2008 compared to the first two quarters of 2007, and the median sale price dropped to $413,000 from $452,000 for this area. Lien amount exceeds $2 billion for new LA County foreclosures in y This is the first month during the last two years in which the total aggregate lien amount from new LA County foreclosures has exceeded $2 billion. In Los Angeles County, the sum of the aggregate lien amounts for properties scheduled for trustee sales in y 2008 was $2,249,303,843. Note: All data is aggregated from government records and legal notices and is supplied as-is for informational purposes. It should not be used for purposes of making investment decisions. In this report, a foreclosure is defined as a property scheduled to have a foreclosure auction take place during the period for the first time. It focuses on new foreclosures rather than properties that have been in and out of foreclosure or those that had auctions delayed or postponed. Lien amounts are not always known. will not be liable for any losses or damages arising from or in any way related to this report, including without limitation any errors therein
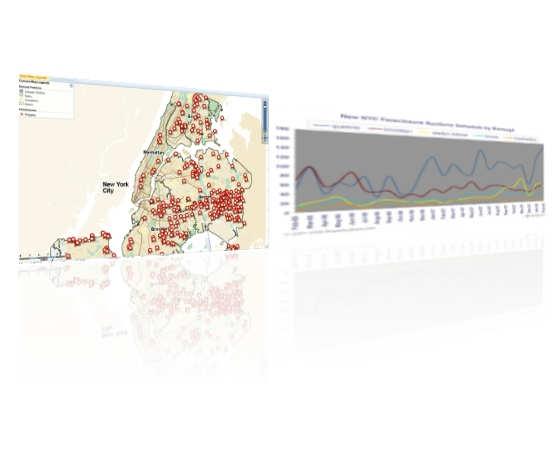
3 Four Region Comparison (Los Angeles, Miami, NYC, Seattle) Comparison to e 2008 Foreclosure activity increased in all four regions when compared to e Seattle (up 34%) and Los Angeles (up 29%) recorded the month s highest climb in new foreclosures among the four regions. Los Angeles (5,982) and Miami (1,099) reached a two-year peak this month. Comparison to y 2007 All four regions saw their numbers rise over the same month last year, with new Los Angeles New Residential Foreclosures, y 2008 Los Angeles 5,982 Miami 2,677 New York City 338 Seattle Foreclosures/Household, y 2008 Los Angeles 0.19% Miami 0.14% New York City 0.01% Seattle 0.03% 0.00% 0.05% 0.10% 0.15% 0.20% 0.25% % Change 2007 New York City % Seattle % Los Angeles 1,715 1,897 1,709 2,154 2,443 2,030 3,868 2,537 2,478 4,544 5,308 4,653 5, % Miami , % foreclosures up 249%, Seattle up 156%, Miami up 137%, and New York City up 67%. Foreclosures/Household Los Angeles (0.19%) and Miami (0.14%) had the highest monthly foreclosure rate per household in y. In Los Angeles, one in every 526 homes was scheduled for a foreclosure auction. In comparison, New York City has one in every 10,000 homes scheduled for foreclosure auction in y. New York City Foreclosures New York City New York City s monthly foreclosure level remains high when New NYC Foreclosure Auctions Scheduled compared to the last few years. The y 2008 number of 338 new auctions exceeds the y 2007 number (203) by 67%, and the y 2006 (147) number by 130%. However, New York City's foreclosure level is diminutive when compared to other cities like Los Angeles and Miami

4 The combination o f i n c r e a s i n g foreclosures, 40% drops in overall residential sales transactions, and d e c r e a s e s i n median sale prices is a potent and f i n a n c i a l l y devastating mixture in New York City s troubled areas such a s J a m a i c a, Q u e e n s. Ashleigh Rose C l a r k, D a t a Acquisition Manager NYC Borough Overview Staten Island saw the highest monthly increase in the number of new foreclosures both compared to the previous month (86%) and to the same month last year (218%). Although y decreased by 5% from the prior month, Queens remains responsible for most of New York City s foreclosure activity, with single and twofamily dwellings being the most common property types scheduled for auction. Brooklyn reached a two-year high this month with 63 new auctions scheduled, while the Bronx had a surprising, but positive decrease of 19%. Compared to y 2007, Queens is up 82%, Brooklyn 26%, Bronx 16% and Manhattan 8%. Building Type New Foreclosures Average Lien Total Lien Single Family 133 $391,854 $50,549,203 Two Families 122 $470,446 $56,453,580 Three or More Families 49 $613,460 $24,538,400 Condo 15 $193,777 $1,937,773 Coop 19 $243,971 $3,659,576 Total 338 $436,746 $137,138,532 New NYC Foreclosure Auctions Schedule by Borough Queens Brooklyn Staten Island Bronx Manhattan Borough Queens Brooklyn Staten Island Bronx Manhattan NYC Total Central Harlem Manhattan, NYC Foreclosures Per Household Staten Island continues to show the highest percentage of foreclosures per household among the five boroughs, 354% higher than Brooklyn, 533% higher than the Bronx and 1611% higher than Manhattan. Borough New Foreclosures Households Foreclosures / Household Staten Island , % Queens , % Brooklyn , % Bronx , % Manhattan , % Total 338 3,018, % Address: 236W 139 Street Loan Amount $1,695,503 Sq. Ft.: 3,030 Built:
5 Top 15 zip codes in New York City: New York City's top zip code table has seen little change in the past few months, with the zip codes of Jamaica, South Jamaica and St. Albans (11434, 11433, 11412, 11413) invariably among the top contenders. Exacerbating the situation, overall residential sales transactions in these zip codes dropped by 40% in the first two quarters of 2008 compared to the first two quarters of 2007, and the median sale price dropped to $413,000 from $452,000 for this area. Zip Code Neighborhood Borough New Foreclosures Total Lien Average Lien Jamaica, South Jamaica, Hollis, St. Albans Queens 15 $418,196 $6,272, Jamaica, South Jamaica, Hollis, St. Albans Queens 13 $396,225 $4,754, Jamaica, South Jamaica, Hollis, St. Albans Queens 11 $370,211 $4,072, Jamaica, South Jamaica, Hollis, St. Albans Queens 10 $375,645 $3,756, Howard Beach, Ozone Park, South Ozone Park Queens 10 $503,406 $5,034, Bedford Stuyvesant, Tompkins Park North, Stuyvesant Heights Brooklyn 9 $602,456 $5,422, Maspeth, Middle Village, Ridgewood, Glendale Queens 8 $345,228 $2,761, Flatbush, Rugby, Farragut, Northeast Flatbush Brooklyn 8 $337,550 $2,700, Mid-Island Staten island 8 $363,053 $2,904, North Island Staten island 7 $308,529 $2,159, Woodhaven, Richmond Hill, Kew Gardens Queens 7 $512,633 $3,588, The Rockaways, Broad Channel Queens 7 $439,484 $3,076, North Island Staten island 7 $343,847 $2,406, Ocean Hill, Brownsville Brooklyn 7 $443,293 $2,659, Jamaica, South Jamaica, Hollis, St. Albans Queens 7 $396,778 $2,777,449 Lis Pendens in New York City Commonly known as pre-foreclosures, lis pendens represent the first filing in the foreclosure process. Most lis pendens are resolved before ever going to auction but they serve as a good indicator of future foreclosure auction levels. For the purposes of this report, we are counting the first time a lis penden is filed on a residential property with a new index number. We don t count further filings on the same property or amendments to prior filings, as this would over count the same property. Monthly Change New York City % Lis Pendens in NYC in y 2008 New York City With foreclosure filings in y 2008, Lis Pendens in New York City continue at a high level compared to months in prior years. Although it has decreased by 1% from the previous month, the current number is still 100% higher than in y

6 Top 15 zip codes in New York City for Lis Pendens: Four of the five tip zip codes for lis pendens filings were in Brooklyn. Zip Code Neighborhood Borough Lis Pendens New Los Angeles foreclosure activity has started to spread from the Antelope Valley and South Central to areas of the San Fernando Valley and even wealthier places such as M a l i b u, S a n t a M o n i c a, a n d Manhattan Beach, often with liens well over $1 million. Robert Sarb, Product Manager, Brooklyn Bedford Stuyvesant, Tompkins Park North, Stuyvesant Heights Brooklyn East New York, New Lots, City Line, Starrett City Brooklyn Ocean Hill, Brownsville Brooklyn Canarsie, Flatlands, ine Park, Mill Basin, Bergen Beach Queens Jamaica, South Jamaica, Hollis, St. Albans Queens Laurelton, Cambria Heights, Queens Village, Glen Oaks Brooklyn East New York, New Lots, City Line, Starrett City Queens Jamaica, South Jamaica, Hollis, St. Albans Bronx Soundview, Castle Hill, Union Port, Parkchester Queens Jamaica, South Jamaica, Hollis, St. Albans Queens The Rockaways, Broad Channel Bronx Morris Park, Pelham Parkway, Bronxdale, Van Nest, Laconia Staten island North Island Brooklyn Bedford Stuyvesant, Tompkins Park North, Stuyvesant Heights Brooklyn Flatbush, Ocean Parkway, Midwood 17 Los Angeles Los Angeles Los Angeles reached another two-year record this month with 5,982 new trustee sales, up 249% from the same month last year. The monthly aggregate lien amount from new properties scheduled for trustee sale this month passed the $2 billion threshold to also reach a twoyear high. New Foreclosure Auctions in Los Angeles 6,000 5,000 4,000 3,000 2,000 1, Monthly Change Los Angeles County 1,715 1,897 1,709 2,154 2,443 2,030 3,868 2,537 2,478 4,544 5,308 4,653 5, % North Hollywood, CA Address: 4629 Alatar Drive Loan Amount $1,352,000 Bed/Baths: 3/2 Sq. Ft.: 2,377 Built: Top 15 Zip Codes in Los Angeles On top of the list we continue to have zip codes from Palmdale/Lancaster. We are also seeing new trustee sales beginning to occur in wealthier neighborhoods such as Malibu, Santa Monica, Manhattan Beach and West Hollywood with individual liens commonly surpassing $1,000,000. Zip Code City New Trustee Sales Average owed* Lancaster 220 $250, Palmdale 211 $268, Norwalk 112 $363, Palmdale 108 $291, Los Angeles 101 $395, Los Angeles 98 $365, Long Beach 94 $359, Palmdale 90 $369, Lancaster 90 $235, Lancaster 88 $300, Los Angeles 88 $344, Los Angeles 84 $403, La Puente 74 $355, Los Angeles 73 $414, Los Angeles 73 $420,687 6
7 Miami Miami foreclosures rose by a dramatic 20% this month over last month, passing 1000 new monthly scheduled foreclosure auctions for possibly the first t i m e e v e r. Roxana Ognean, Foreclosure Product Team, Miami-Dade County The number of new foreclosures has reached a two year peak in Miami this month. The current number (1,099) is 137% higher than a year ago (464). Compared to the previous month the number of new foreclosures increased by 20%. Monthly Change Miami-Dade , % Top 15 zip codes in Miami New Foreclosure Auctions in Miami Zip Code Neighborhood New Foreclosures Miami, Perrine, Quail Heights, Country Lakes Crossing, Kendall, Miami Hialeah Homestead Homestead, Leisure City, Naranja Miami East Perrine Ives estates Miami Miami Shaores, N Miami Beach Miami Miami Miami Beach Homestead Miami 23 Seattle Seattle There were 190 new foreclosure auctions scheduled in y 2008, up 34% from the 142 new foreclosures in e 2008, and up 157% compared to y New Foreclosure Auctions in Seattle
8 Monthly Change Seattle % Top 10 zip codes in Seattle Zip Code Neighborhood New Foreclosures Average owed Auburn 9 $29, Burien, Seatac, Seattle, Tukwila 9 $11, Covington Kent, Lake Sawyer 9 $21, Algona, Auburn, Federal Way 9 $15, Des Moines, Nomandy Park, Seatac, Redondo Beach 8 $16, Cascade, Fairwood, Renton 7 $50, Bryn Mawr, Seattle, Skyway, Tukwila 7 $12, Des Moines, Nomandy Park, Seatac, Redondo Beach 7 $18, Kent 7 $54, Four Corners, Maple Valley, Wilderness Village 6 $65,
PropertyShark.com. Foreclosure Report, May 2008
 PropertyShark.com Foreclosure Report, 28 Monthly Foreclosure Report, 28 PropertyShark.com provides real estate professionals and investors with comprehensive property information, including owner name
PropertyShark.com. Foreclosure Report, Q Covering: Los Angeles, Miami, New York City, Seattle
 PropertyShark.com Foreclosure Report, Covering: Los Angeles, Miami,, Quarterly Foreclosure Report, PropertyShark.com provides real estate professionals and investors with comprehensive property information,
PropertyShark.com. Foreclosure Report, April Covering: Los Angeles, Miami, New York City, Seattle
 PropertyShark.com Foreclosure Report, il 29 Covering:, Miami,, Seattle Monthly Foreclosure Report, il 29 PropertyShark.com provides real estate professionals and investors with comprehensive property information
PropertyShark.com Monthly Foreclosures Report
 PropertyShark.com Monthly Foreclosures Report February, 28 Scope: In this monthly report, PropertyShark.com provides charts, tables, and metrics about residential foreclosures (a.k.a. trustee sales) in
PropertyShark.com. Long Island Foreclosure Report, Q2 2009
 PropertyShark.com Long Island Foreclosure Report, Long Island Foreclosure Report, PropertyShark.com provides real estate professionals and investors with comprehensive property information, including owner
Third Quarter 2018 Market Report Brooklyn Residential
 Market Report Brooklyn Residential Data Highlights Cover Property: halstead.com WEB# 18921216# The median apartment price fell 3% in Brooklyn over the past year. Co-op prices rose in Brooklyn, while condo
BROOKLYN RESIDENTIAL MARKET REPORT
 2017 SECOND BROOKLYN RESIDENTIAL MARKET REPORT QUARTER Data Highlights Cover Property: halstead.com WEB# 13291164 While down from last quarter s record $947,732, the average apartment price in Brooklyn
The State of Renters & Their Homes
 FORECLOSURES FINDING #14 The number of pre-foreclosure notices issued to one- to four-unit properties and condominiums in 2015 fell from the previous year. Pre-foreclosure notices for one- to four-unit
Third Quarter 2018 Market Report Brooklyn Residential
 Market Report Brooklyn Residential Data Highlights Cover Property: BrownHarrisStevens.com WEB# 18360052 The median apartment price fell 3% in Brooklyn over the past year. Co-op prices rose in Brooklyn,
State of Land Use and the Built Environment
 State of Land Use and the Built Environment The city approved more units for construction in 214 than in 213, but the level remained below that of the mid-2s. Meanwhile, city-initiated rezonings all but
1. Contract Authorization - Electrical Repair Services
 QUEENS LIBRARY BUILDINGS AND GROUNDS COMMITTEE THURSDAY, NOVEMBER 10, 2016 Central Library 89-11 Merrick Blvd., Jamaica, NY 11432 AGENDA 6:00 PM BUILDINGS AND GROUNDS COMMITTEE - REGULAR MEETING Hon. Robert
DRAFT. Multi-Family. Sales. Report. 3Q18 New York City. Presented by the Tri-State Investment Sales Group. For more information please contact:
 DRAFT 3Q18 New York City Multi-Family For more information please contact: Sales James Nelson James Kinsey Principal, Head of Tri-State Investment Sales Principal, Senior Director of Tri-State Investment
IV. Data on New York City s Housing and Neighborhoods. Chapter 1. Housing Stock*
 Total Housing Units (Thousands) IV. Data on New York City s Housing and Neighborhoods 1,000 800 600 400 200 0 Chapter 1. Housing Stock* Chart 1-1 Total Housing Units in the Five Boroughs 2000 2002 Bronx
ARE DOB-ECB VIOLATIONS INCREASING?
 STATE OF NYC NEIGHBORHOODS ARE DOB-ECB VIOLATIONS INCREASING? A Closer Look at Ongoing Enforcement with DOB Compliance Data Are DOB-ECB Violations Increasing? 1 MAP OF NYC COMMUNITY BOARDS Bronx Brooklyn
BROOKLYN RESIDENTIAL MARKET REPORT
 2017 THIRD BROOKLYN RESIDENTIAL MARKET REPORT QUARTER Data Highlights Cover Property: halstead.com WEB# 15453135 The average apartment price fell for the second straight quarter in Brooklyn, but remained
BROOKLYN RESIDENTIAL MARKET REPORT
 2016 THIRD BROOKLYN RESIDENTIAL MARKET REPORT QUARTER Data Highlights Cover Property: halstead.com WEB# 15363401 Apartment prices reached new records, fueled by a surge of luxury new development closings
Second Quarter 2018 Market Report Brooklyn Residential
 Market Report Brooklyn Residential Data Highlights Cover Property: BrownHarrisStevens.com WEB# 18689997 Brooklyn apartment prices averaged $869,587 in the second quarter, 4% less than a year ago. New development
Chapter 8. Housing Quality
 Chapter 8. Housing Quality Information on the quality of New York City s housing stock presented in this chapter is derived from two sources. First, data on the age of the housing stock, housing maintenance
san francisco Report Q A quarterly analysis of residential sales in san francisco County
 san francisco Report Q2 2015 A quarterly analysis of residential sales in san francisco County 2 2-3 4 5 6 7-8 9 10 Highlights Residential Stats House versus Condo Sales Price Range Transaction Luxury
Fourth Quarter 2017 BROOKLYN RESIDENTIAL MARKET REPORT
 Fourth Quarter 2017 BROOKLYN RESIDENTIAL MARKET REPORT Data Highlights Cover Property: BrownHarrisStevens.com WEB# 16254860 The average apartment price fell 5% in Brooklyn from a year ago, as buyers favored
Fourth Quarter 2018 Market Report Brooklyn Residential
 Market Report Brooklyn Residential Data Highlights Cover Property: BrownHarrisStevens.com WEB# 19024015 The average apartment price in Brooklyn was slightly lower than a year ago. Prices were higher over
Key Findings on the Affordability of Rental Housing from New York City s Housing and Vacancy Survey 2008
 Furman Center for real estate & urban policy New York University school of law n wagner school of public service 110 West 3rd Street, Suite 209, New York, NY 10012 n Tel: (212) 998-6713 n www.furmancenter.org
First Quarter 2016 BROOKLYN RESIDENTIAL MARKET REPORT
 First Quarter 2016 BROOKLYN RESIDENTIAL MARKET REPORT Data Highlights Cover Property: BrownHarrisStevens.com WEB# 14381790 Apartment prices averaged 5% more than a year ago BrownHarrisStevens.com WEB#
Who Really Benefits from New York City s Rent Regulation System? Henry O. Pollakowski
 Civic Report No. 34 Who Really Benefits from New York City s Rent Regulation System? Henry O. Pollakowski Housing Economist, MIT Center for Real Estate Editor, Journal of Housing Economics C C i CENTER
LUXURY MARKET REPORT. - March
 LUXURY MARKET REPORT - March 2018 - www.luxuryhomemarketing.com THIS IS YOUR LUXURY MARKET REPORT MAP OF LUXURY RESIDENTIAL MARKETS Welcome to the Luxury Market Report, your guide to luxury real estate
LUXURY MARKET REPORT. - March
 LUXURY MARKET REPORT - March 2018 - www.luxuryhomeing.com THIS IS YOUR LUXURY MARKET REPORT MAP OF LUXURY RESIDENTIAL MARKETS Welcome to the Luxury Report, your guide to luxury real estate market data
2nd Quarter Flatbush Fort Greene Brooklyn. A comprehensive analysis of the residential real estate market in Brooklyn.
 Prospect Park South Red Hook Sheepshead Bay Sunset Park Williamsburg Windsor Terrace Bath Beach Bensonhurst Bay Ridge Bedford - Stuyvesant Boerum Hill Brooklyn Heights Bushwick Carroll Gardens Clinton
ECONOMIC CURRENTS. Vol. 4, Issue 3. THE Introduction SOUTH FLORIDA ECONOMIC QUARTERLY
 ECONOMIC CURRENTS THE Introduction SOUTH FLORIDA ECONOMIC QUARTERLY Vol. 4, Issue 3 Economic Currents provides an overview of the South Florida regional economy. The report presents current employment,
CB Richard Ellis. Los Angeles Multi-Housing Experts
 Team Lustig Bower CB Richard Ellis Los Angeles Multi-Housing Experts 310.550.2600 Multi-Housing Overview by Team Lustig-Bower Apartments: Sales Volume Cap Rates Price Per Unit Employment Growth Apartment
ECONOMIC CURRENTS. Vol. 5 Issue 2 SOUTH FLORIDA ECONOMIC QUARTERLY. Key Findings, 2 nd Quarter, 2015
 ECONOMIC CURRENTS THE Introduction SOUTH FLORIDA ECONOMIC QUARTERLY Economic Currents provides an overview of the South Florida regional economy. The report presents current employment, economic and real
LUXURY MARKET REPORT. - May
 LUXURY MARKET REPORT - May 2018 - www.luxuryhomeing.com THIS IS YOUR LUXURY MARKET REPORT MAP OF LUXURY RESIDENTIAL MARKETS Welcome to the Luxury Report, your guide to luxury real estate market data and
Quarterly Market Report Q3 2015
 Quarterly Market Report Q3 05 Welcome to the StreetEasy Quarterly Market Report We re pleased to present our Quarterly Market Report, powered by New York City s largest and most comprehensive database
One Host, One Home: New York City (February 2017 Update)
") One Host, One Home: New York City (February 2017 Update) Key Figures About Airbnb s NYC Community Today, we re releasing updated information about the Airbnb community in New York City. This covers the
One Host, One Home: New York City (February 2017 Update) Key Figures About Airbnb s NYC Community Today, we re releasing updated information about the Airbnb community in New York City. This covers the
Manhattan Beach. Mike Rossi BRE: Commercial Investments Cell:
 1026 Manhattan Beach Blvd, Manhattan Beach CA 90266 Manhattan Beach For more information: Mike Rossi BRE: 01089100 Commercial Investments Cell: 310.849.9601 mrossi90266@gmail.com 2015, NW Real Estate,
3rd Quarter Flatbush Fort Greene Brooklyn. A comprehensive analysis of the residential real estate market in Brooklyn.
 Prospect Park South Red Hook Sheepshead Bay Sunset Park Williamsburg Windsor Terrace The Corcoran Report Bath Beach Bensonhurst Bay Ridge Bedford - Stuyvesant Boerum Hill Brooklyn Heights Bushwick Carroll
One Host, One Home: New York City (January 2018 Update)
") One Host, One Home: New York City (January 2018 Update) Key Figures About Airbnb s NYC Community Today, we re releasing updated information about the Airbnb community in New York City. This covers the
One Host, One Home: New York City (January 2018 Update) Key Figures About Airbnb s NYC Community Today, we re releasing updated information about the Airbnb community in New York City. This covers the
New Development Report
 New Development Report 2018 First Quarter MANHATTAN $ 2,513 $ 2,185 $ 2,152 3.7% YoY PER SQ. FT. ACTIVE PER SQ. FT. CONTRACT SIGNED PER SQ. FT. CLOSED 1% YoY 4.1% YoY BROOKLYN $ 1,475 PER SQ. FT. ACTIVE
Foreclosures Continue to Bring Home Prices Down * FNC releases Q Update of Market Distress and Foreclosure Discount
 Foreclosures Continue to Bring Home Prices Down * FNC releases Q4 2011 Update of Market Distress and Foreclosure Discount The latest FNC Residential Price Index (RPI), released Monday, indicates that U.S.
U.S. Foreclosure Activity Increases 2 Percent in July Boosted by 6 Percent Increase in Foreclosure Starts
 August 13, 2013 By RealtyTrac Staff U.S. Foreclosure Activity Increases 2 Percent in July Boosted by 6 Percent Increase in Foreclosure Starts Bank Repossessions Up 4 Percent From Previous Month, 29 States
BONDREPORT QTR BONDREPORT QTR BONDNEWYORK.COM
 BONDREPORT QTR 4 2017 WELCOME TO THE 19 TH EDITION OF THE BOND REPORT It has been quite the year on many fronts, and by all indications, 2017 has no intention of going quietly. The market has continued
MANHATTAN RESIDENTIAL MARKET REPORT FIRST QUARTER
 2018 MANHATTAN RESIDENTIAL MARKET REPORT FIRST QUARTER Data Highlights FIRST QUARTER 2018 Cover Property: halstead.com WEB# 18230107 The average price for all apartments fell 8% from a year ago to $1,987,045,
CALIFORNIA FORECLOSURE ACTIVITY MIXED
 CALIFORNIA FORECLOSURE ACTIVITY MIXED Foreclosure delays may be behind current peak in foreclosure activity Discovery Bay, CA, September 16, 2008 ForeclosureRadar (www.foreclosureradar.com), the only website
One Host, One Home: New York City (April 2018 Update)
") One Host, One Home: New York City (April 2018 Update) Key Figures About Airbnb s NYC Community Today, we re releasing updated information about the Airbnb community in New York City. This covers the time
One Host, One Home: New York City (April 2018 Update) Key Figures About Airbnb s NYC Community Today, we re releasing updated information about the Airbnb community in New York City. This covers the time
Canarsie basement. Near the L train, B 24 and Belt Pkwy
 3/06/17 1 of 5 pages BROOKLYN 1 487 Powell St Brick 1 fam, att. reno.3 brms, 1.5 bath. Brownsville Fin bsmt with laundry room. Parking in front. 2 110 E 53 rd St Det 2 family.2 over 2 bedrooms, 2 full
Communities at the Crossroads: A Survey of Five First-Ring Suburbs
 Communities at the Crossroads: A Survey of Five First-Ring Suburbs 19 inner ring suburbs of Cleveland Inner-ring Suburban Key Challenges Bottom feeding flippers and speculators Increase in vacant homes
L U X U R Y M A R K E T R E P O R T 2 Q
 L U X U R Y M A R K E T R E P O R T 2 Q 2 1 8 The quarterly Luxury Market Report provided by Trump International Realty is a resource compiling pertinent data and analytics to give you a pulse on the current
Six Consecutive Quarters Of Positive Absorption As Asking Rents Increase
 OFFICE GREATER LOS ANGELES BASIN MARKET REPORT Six Consecutive Quarters Of Positive Absorption As Asking Rents Increase EXECUTIVE SUMMARY MARKET INDICATORS - VACANCY 15.3% NET ABSORPTION +789,2 CONSTRUCTION
Increasing Foreclosures Could Hurt Demand for Homes, Slowing Housing Recovery
 Release Date: April 22, 2010 February 2010 Quinn W. Eddins, Director of Research New Radar Logic data packages are available at /productsservices_analytics.html Increasing Foreclosures Could Hurt Demand
INVESTORS PURCHASE RECORD NUMBER OF FORECLOSURES AT AUCTION
 INVESTORS PURCHASE RECORD NUMBER OF FORECLOSURES AT AUCTION April Foreclosure Notices Drop from March Record Levels Discovery Bay, CA, May 12, 2009 ForeclosureRadar (www.foreclosureradar.com), the only
TABLE OF CONTENTS 03 INTRODUCTION 04 NOTABLE TRENDS 05 MEAN RENTAL PRICES 07 PRICE TRENDS
 TABLE OF CONTENTS 03 INTRODUCTION 04 NOTABLE TRENDS 05 MEAN RENTAL PRICES 07 PRICE TRENDS 07 LONG ISLAND CITY 07 ASTORIA 07 RIDGEWOOD 07 FLUSHING 08 REGO PARK 08 FOREST HILLS 08 JACKSON HEIGHTS 12 THE
MANHATTAN RESIDENTIAL MARKET REPORT
 2017 FOURTH MANHATTAN RESIDENTIAL MARKET REPORT QUARTER Data Highlights FOURTH QUARTER 2017 Cover Property: halstead.com WEB# 17690202 The average apartment price fell for the second straight quarter,
LUXURY MARKET REPORT. - January
 LUXURY MARKET REPORT - January 2018 - www.luxuryhomemarketing.com THIS IS YOUR LUXURY MARKET REPORT MAP OF LUXURY RESIDENTIAL MARKETS Welcome to the Luxury Market Report, your guide to luxury real estate
ECONOMIC CURRENTS. Vol. 3, Issue 3 SOUTH FLORIDA ECONOMIC QUARTERLY. Introduction
 ECONOMIC CURRENTS THE Introduction SOUTH FLORIDA ECONOMIC QUARTERLY Economic Currents provides an overview of the South Florida regional economy. The report presents current employment, economic and real
3-BUILDING BROOKLYN PACKAGE
 3-BUILDING BROOKLYN PACKAGE 538 Bainbridge Street Brooklyn, NY 11233 1430 Dekalb Avenue Brooklyn, NY 11237 743 MacDonough Street Brooklyn, NY 11233 Ocean Hill & Bushwick 3-Story Buildings 15,335± SF 18
Report on Nevada s Housing Market
 July Report on Nevada s Housing Market This series of reports on Nevada s Housing Market is co-presented by the Lied Institute for Real Estate Studies at the University of Nevada, Las Vegas and the State
California Housing Market Update. Monthly Sales and Price Statistics January 2018
 California Housing Market Update Monthly Sales and Price Statistics January 2018 Sales Started with a Slight Decrease California, Jan. 2018 Sales: 388,800 Units, -2.9% YTD, -2.9% YTY 700,000 600,000 500,000
First Quarter 2019 Market Report Manhattan Residential
 Market Report Manhattan Residential Data Highlights Cover Property: Halstead.com WEB# 19451837 The average price for a resale apartment declined 3% over the past year to $1,575,059. New development prices
Queens Rental Market Report June 2016 mns.com
 Queens Rental Market Report June 2016 TABLE OF CONTENTS 03 Introduction 04 A Quick Look 10 Queens Price Trends 11 Neighborhood Price Trends 11 Long Island City 12 Astoria 13 Ridgewood 14 Flushing 15 Rego
Fourth Quarter 2018 Market Report Manhattan Residential
 Market Report Manhattan Residential Data Highlights Cover Property: Halstead.com WEB# 19041474 A pickup in luxury new development closings pushed the average price higher than a year ago. The median apartment
Queens Rental Market Report November 2015 mns.com
 Queens Rental Market Report November 2015 TABLE OF CONTENTS 03 Introduction 04 A Quick Look 05 Mean Queens Rental Prices 10 Queens Price Trends 11 Neighborhood Price Trends 11 Long Island City 12 Astoria
OFFICE QUICK STATS SUMMARY & OUTLOOK MARKET TRENDS VACANCY & NET ABSORPTION ECONOMIC STATS
 LOS ANGELES NORTH OFFICE FOURTH QUARTER 217 QUICK STATS Direct Vacancy 11.8% Overall Vacancy 12.5% Lease Rate FSG $2.75 Gross Absorption Under Construction MARKET TRENDS Current Quarter 1,6,941 SF 89,158
Manhattan Residential. THIRD quarter
 2015 Manhattan Residential MARket Report THIRD quarter Data Highlights Cover Property: halstead.com WEB# 13231035 $995,000 New record median price for Manhattan apartments. Reported sales up 9% from. halstead.com
Q SOUTHWEST REGION
 Quarterly Indicators SOUTHWEST REGION Monthly Snapshot Includes the Durango Area Association of REALTORS, Four Corners Board of REALTORS, Pagosa Springs Area Association of REALTORS and the San Luis Valley
LUXURY MARKET REPORT. - February
 LUXURY MARKET REPORT - February 2018 - www.luxuryhomeing.com THIS IS YOUR LUXURY MARKET REPORT MAP OF LUXURY RESIDENTIAL MARKETS Welcome to the Luxury Report, your guide to luxury real estate market data
UNHP // Views from the Northwest Bronx Blog Series Charts and Images #ViewsNWBX
 UNHP // Views from the Northwest Bronx Blog Series Charts and Images #ViewsNWBX The northwest Bronx is a series of neighborhoods from the Cross Bronx expressway to the County line, dominated by multifamily
M A N H A T T A N 69 THE FURMAN CENTER FOR REAL ESTATE & URBAN POLICY. Financial District Greenwich Village/Soho
 M A N H A T T A N Page Financial District 301 72 Greenwich Village/Soho 302 73 Lower East Side/Chinatown 303 74 Clinton/Chelsea 304 75 69 THE FURMAN CENTER FOR REAL ESTATE & URBAN POLICY Midtown 305 76
San Fernando Valley and Ventura County Witness Declining Vacancy
 OFFICE SAN FERNANDO & VENTURA MARKET REPORT San Fernando Valley and Ventura County Witness Declining MARKET OVERVIEW The San Fernando Valley and Ventura County office market saw total vacancy decrease
Residential December 2009
 Residential December 2009 Karl L. Guntermann Fred E. Taylor Professor of Real Estate Adam Nowak Research Associate Year End Review The dramatic decline in Phoenix house prices caused by an unprecedented
New Development Year-End Report
 New Development Year-End Report MANHATTAN 2,775 PER SQ. FT. ACTIVE 2,268 BROOKLYN 1,34 PER SQ. FT. ACTIVE 1,335 PER SQ. FT. CONTRACT SIGNED PER SQ. FT. CONTRACT SIGNED 1,98 1,167 PER SQ. FT. CLOSED PER
Multifamily Property For Sale Asking Price Index Trends
 Multifamily Property For Sale Asking Price Index Trends Feb 11 prior YOY $134,167 1.0% 5.5% $158,866 0.7% 6.7% $157,655 0.6% 6.2% $136,264 2.3% 10.7% Current Los Angeles market trends data indicates a
MANHATTAN RESIDENTIAL MARKET REPORT SECOND QUARTER
 2017 MANHATTAN RESIDENTIAL MARKET REPORT SECOND QUARTER Data Highlights SECOND QUARTER 2017 Cover Property: halstead.com WEB# 16183475 New records were set for average and median apartment prices, as high-end
Monthly Indicators. Monthly Snapshot. March % % 0.0%
 Monthly Indicators 2017 We can comfortably consider the first quarter to have been a good start for residential real estate in 2017. There was certainly plenty to worry over when the year began. Aside
Instructions for Form NYC-RPT Real Property Transfer Tax Return
 Instructions for Form NYC-RPT Page 1 Instructions for Form NYC-RPT Real Property Transfer Tax Return IMPORTANT 1. Always submit pages 1-4 of the return. Attach Schedules A through H, Schedule M and Schedule
New Development Report
 New Development Report 2017 Third Quarter MANHATTAN $ 2,537 PER SQ. FT. ACTIVE $ 2,138 PER SQ. FT. CONTRACT SIGNED $ 2,096 PER SQ. FT. CLOSED BROOKLYN $ 1,468 PER SQ. FT. ACTIVE $ 1,423 PER SQ. FT. CONTRACT
Q brooklyn. the corcoran report. peter comitini comitini.comsm
 Q2. brooklyn the corcoran report peter comitini comitini.comsm peter@comitini.com 212. 444.7844 MID YEAR brooklyn snapshot Brooklyn has seen a more modest increase in compared to the exuberant early part
>> Rents Rise To Highest Point Ever
 Research & Forecast Report SAN FERNANDO VALLEY & VENTURA COUNTY INDUSTRIAL Accelerating success. >> Rents Rise To Highest Point Ever Key Takeaways > Asking rental rates rose $.2 P NNN to $.69 P NNN. Rents
Data through September 2011 Published on December 2, % 20.1% 20.0% 19.3% 18.9% 7.7% 7.3% 7.6% 7.4% 7.4%
 Economic Snapshot a publication of the Santa Clarita Valley Economic Development Corporation Data through September 2011 Published on December 2, 2011 WHAT S INSIDE Commercial Real Estate 1 Residential
Residential October 2009
 Residential October 2009 Karl L. Guntermann Fred E. Taylor Professor of Real Estate Adam Nowak Research Associate Summary The latest data for July 2009 reveals that house prices declined by 28 percent
M A N H AT T A N N E W D E V E L O P M E N T R E P O R T S E C O N D Q U A R T E R
 TM M A N H AT TA N N E W D E V E L O P M E N T R E P O R T 2012 SECOND QUARTER 1 MNS 1 1 5 E A S T 2 3 RD S T R E E T, N E W Y O R K, N Y 1 0 0 1 0 212.475.9000 INFO@MNS.COM MNS.COM TABLE OF CONTENTS Introduction
SECOND QUARTER 2007 QUARTERLY MARKET REPORT
 SECOND QUARTER 2007 QUARTERLY MARKET REPORT QUARTERLY MARKET REPORT Manhattan The average sale price for Manhattan apartments set a new record in the second quarter, reaching $1,300,212. This figure was
Residential March 2010
 Residential March 2010 Karl L. Guntermann Fred E. Taylor Professor of Real Estate Adam Nowak Research Associate The latest data for December 2009 reveals that overall house prices declined by 13 percent
Market Report Miami Q2 2013
 Market Report Q2 at a Glance $ $219,000 Median Price Median price jumped 25.1% since last year and last quarter. This was the largest year over year median price gain since 2012Q1. Average price increased
39 THE FURMAN CENTER FOR REAL ESTATE & URBAN POLICY. Page
 BRONX Mott Haven/Melrose Hunts Point/Longwood Morrisania/Crotona Highbridge/Concourse Fordham/University Heights Belmont/East Tremont Kingsbridge Heights/Bedford Riverdale/Fieldston Parkchester/Soundview
Clean and Sober Addiction Recovery Housing in: WASHINGTON STATE Vacancy Sum 41 reported vacancies as of: February 24 th, 2013
 Clean and Sum : Kubota Gardens Fairhaven House of Myrrh 60 th Avenue S0. Seattle / Skyways, WA 1-(866) 346-7186 Total Occupancy:6 : Wright Park The Spragues Housing 639 N. Sprague Ave., Tacoma. WA (253)
Queens Rental Market Report February 2018 mns.com
 Queens Rental Market Report February 2018 TABLE OF CONTENTS 03 Introduction 04 A Quick Look 10 Queens Price Trends 11 Neighborhood Price Trends 11 Long Island City 12 Astoria 13 Ridgewood 14 Flushing 15
Residential January 2010
 Residential January 2010 Karl L. Guntermann Fred E. Taylor Professor of Real Estate Adam Nowak Research Associate Another improvement to the ASU-RSI is introduced this month with new indices for foreclosure
State of the Nation s Housing 2008: A Preview
 State of the Nation s Housing 28: A Preview Eric S. Belsky Remodeling Futures Conference April 15, 28 www.jchs.harvard.edu The Housing Market Has Suffered Steep Declines Percent Change Median Existing
Manhattan New Dev. Market Report nd Quarter mns.com
 Manhattan New Dev. Market Report 2014 2nd Quarter TABLE OF CONTENTS Manhattan New Development Report 2Q14 TABLE OF CONTENTS 03 Introduction 04 Market Snapshot 09 Neighborhood Trends 09 Battery Park City
Brooklyn Rental Market Report June 2013 mns.com
 Brooklyn Rental Market Report June 2013 TABLE OF CONTENTS 03 Introduction 04 A Quick Look 05 Mean Brooklyn Rental Prices 07 Brooklyn Price Trends 08 Neighborhood Price Trends 08 Bay Ridge 09 Bedford-Stuyvesant
Brooklyn Rental Market Report July 2016 mns.com
 Brooklyn Rental Market Report July 2016 TABLE OF CONTENTS 03 Introduction 04 A Quick Look 05 Mean Brooklyn Rental Prices 10 Brooklyn Price Trends 11 Neighborhood Price Trends 11 Bay Ridge 12 Bedford-Stuyvesant
Multifamily Metro Outlook: New York Spring 2018
 Overview The New York City metro is the nation s largest apartment market with 2.2 million rental units, of which 47 percent are rent-stabilized and 1.2 percent rent-controlled. As anticipated, a glut
UPGRADING PRIVATE PROPERTY AT PUBLIC EXPENSE The Rising Cost of J-51
 UPGRADING PRIVATE PROPERTY AT PUBLIC EXPENSE The Rising Cost of J-51 POLICY BRIEF By Tom Waters and Victor Bach June 2012 The Community Service Society of New York (CSS) draws on a 168-year history of
2018 Year-End Manhattan Market Report
 THE CITYREALTY YEAR-END REPORT DECEMBER DECEMBER Year-End Manhattan Market Report CityRealty is the website for NYC real estate, providing high-quality listings and tailored agent matching for prospective
Weekly Market Activity Report
 Weekly Market Report A RESEARCH TOOL FROM THE MINNEAPOLIS AREA ASSOCIATION OF REALTORS BROUGHT TO YOU BY THE UNIQUE DATA-SHARING TRADITIONS OF THE REALTOR COMMUNITY For Week Ending September 5, 2015 Publish
INDUSTRIAL QUICK STATS SUMMARY & OUTLOOK MARKET TRENDS VACANCY & NET ABSORPTION ECONOMIC STATS. Current Quarter. Direct Vacancy 2.
 ORANGE COUNTY INDUSTRIAL SECOND QUARTER 218 QUICK STATS Direct Vacancy 2.2% Overall Vacancy 2.5% Lease Rate NNN $.95 Gross Absorption Under Construction MARKET TRENDS Current Quarter 2,956,71 SF 1,367,18
CONSTRUCTION OUTLOOK UPDATE
 buildingcongress.com MARCH 08 CONSTRUCTION OUTLOOK UPDATE FIVE YEARS, FIVE BOROUGHS A review of 0-07 construction starts data for New York City shows construction activity increasingly diversified throughout
ECONOMIC CURRENTS. Vol. 3, Issue 1. THE SOUTH FLORIDA ECONOMIC QUARTERLY Introduction
 ECONOMIC CURRENTS THE SOUTH FLORIDA ECONOMIC QUARTERLY Introduction Economic Currents provides an overview of the South Florida regional economy. The report contains current employment, economic and real
Volume II Edition III Mid Summer update
 The Realtors Canadians Trust www.arizonaforcanadians.com Volume II Edition III Mid Summer update In This Edition What is happening in the market today? Where is the market heading? The Buying Process Our
Santa Clara County Real Estate Market Overview Dynamics
 Santa Clara County Real Estate Market Overview Dynamics Data from sources deemed reliable, but may contain errors and subject to revision. All numbers should be considered approximate. Jan-90 Sep-90 May-91
MANHATTAN NEW DEVELOPMENT REPORT 2012 FIRST QUARTER 1 MNS 115 EAST 23 RD STREET, NEW YORK, NY MNS.
 TM MANHATTAN NEW DEVELOPMENT REPORT 2012 FIRST QUARTER 1 TABLE OF CONTENTS Introduction 3 Market Snapshot 4 Neighborhood Price Trends Harlem 9 Upper West Side 10 Upper East Side 11 Midtown West 12 Midtown