2019 Economic & Market Forecast. Santa Clara County Association of Realtors November 16, 2018 Leslie Appleton-Young SVP & Chief Economist
|
|
|
- Peregrine Perry
- 5 years ago
- Views:
Transcription

1 2019 Economic & Market Forecast Santa Clara County Association of Realtors November 16, 2018 Leslie Appleton-Young SVP & Chief Economist
2 Value of Strategic Thinking: You will be surprised by the future, but you won t be surprised that you are surprised
3 2008
4 The CA Housing Market Recovery 100% 90% 80% 70% 60% 50% 40% 30% 20% 10% 0% Equity Sales Short Sale REO Equity Sales (Aug 2018) = 98.4% Equity Sales Vs. Distressed Sales REO Sales (Aug 2018) = 0.9% Short Sales (Aug 2018) = 0.3% Note: Not including transactions in foreclosure. SERIES: Distressed Sales, Not Seasonally Adjusted SOURCE: CALIFORNIA ASSOCIATION OF REALTORS
5 2018
6 Macro Economic Update


7 U.S. Economy: Our Biggest Strength 3.5% 4.0% 2.2% GDP 2018-Q3 3.7% Consumption 2018-Q3 1.7% Core CPI September 2018 Unemployment October 2018 Job Growth October 2018
 $ 4% 3% 2% 1% 0% -1% -2% -3% 2009 Largest Annual Drop since 1946 (-2.8%) 3.")
8 Growth Reflects Strong Fiscal Stimulus GDP : 2.3%; 2018 Q3: 3.5% 6% 5% ANNUALLY QUARTERLY Annual Percent Change, Chain-type (2009) $ 4% 3% 2% 1% 0% -1% -2% -3% 2009 Largest Annual Drop since 1946 (-2.8%) 3.5% -4% Q1-11 Q4-11 Q3-12 Q2-13 Q1-14 Q4-14 Q3-15 Q2-16 Q1-17 Q4-17 Q3-18 SERIES: GDP SOURCE: US Dept. of Commerce, Bureau of Economic Analysis


9 CA Employment: All-Time High 18,000 17,000 California Nonfarm Employment 4.0% 3.5% Nonfarm Employment Growth 16,000 15,000 14,000 13,000 12,000 11,000 10,000 Jan-00 Feb-01 Mar-02 Apr-03 May-04 Jun-05 Jul-06 Aug-07 Sep-08 Oct-09 Nov-10 Dec-11 Jan-13 Feb-14 Mar-15 Apr-16 May-17 Jun % 2.5% 2.0% 2.0% 1.5% 1.0% 0.5% 0.0% Jan-11 Jun-11 Nov-11 Apr-12 Sep-12 Feb-13 Jul-13 Dec-13 May-14 Oct-14 Mar-15 Aug-15 Jan-16 Jun-16 Nov-16 Apr-17 Sep-17 Feb-18 Jul-18 California U.S.

10 Unemployment Lowest in 40+ Years Kern Fresno Los Angeles Monterey Sacramento Santa Cruz Solano San Diego Contra Costa Alameda Orange Napa Sonoma Santa Clara San Francisco Marin San Mateo September 2018 Unemployment Rates 3.9% 3.6% 3.5% 3.5% 3.2% 2.9% 2.8% 2.8% 2.5% 2.4% 2.4% 2.2% 2.2% 2.1% 4.8% 9.6% 9.1% 0.0% 2.0% 4.0% 6.0% 8.0% 10.0% 12.0% SERIES: Civilian Unemployment Rate SOURCE: CA Employment Development Division

11 Consumer Confidence Highest in 18 Years October 2018: INDEX, 100= SERIES: Consumer Confidence SOURCE: The Conference Board

12 Inflation Remains Low September 2018: All Items 2.3% YTY; Core +2.2% YTY Annual Percent Change All Items Core SERIES: Consumer Price Index SOURCE: US Bureau of Labor Statistics
13 Rates in 2018: 30 Yr. Now Above 5% 1 st Time since 2011 Nov 5: 5.05% SERIES: Average 30 Yr. Fixed Mortgage Rates SOURCE: Mortgage News Daily
14 Fed Has Raised rates 8 Times Since Dec January 2012 November 2018 MONTHLY 5.10% Bankrate WEEKLY FRM ARM Fed Raise Rate the 1 st time since mid Fed Funds Rate 0 SERIES: 30Yr FRM, 5Yr ARM, Fed Funds Rate (Target Rate) SOURCE: Freddie Mac, St. Louis Fed
15 RISING Rates Hit Pocketbooks Hard Median Price $595K $3,200 $2,800 $2,400 $2,000 MONTHLY MORTGAGE $2,013 $2,144 20% Downpayment $2,279 $2,419 $2,563 $2,711 $2,862 $3,017 $1,600 $1,200 $800 $400 $0 3.0% 3.5% 4.0% 4.5% 5.0% 5.5% 6.0% 6.5% INTEREST RATE SERIES: Housing Affordability Index SOURCE: CALIFORNIA ASSOCIATION OF REALTORS

16 RISING Rates Hit Pocketbooks Hard Median Price $595K $160,000 $140,000 $120,000 $107,956 20% Downpayment $124,203 $118,614 $113,196 Minimum Qualifying Income $135,871 $129,958 $141,936 $148,145 $100,000 $80,000 $60,000 $40,000 $20,000 $0 3.0% 3.5% 4.0% 4.5% 5.0% 5.5% 6.0% 6.5% INTEREST RATE SERIES: Housing Affordability Index SOURCE: CALIFORNIA ASSOCIATION OF REALTORS
17 Tax Reform: Homeownership Took a Hit 7 tax brackets 0%, 10%, 12%, 22%, 24%, 32%, 35%, and 37% MID Caps at $750K Existing loans grandfathered SALT capped at $10K Double standard deduction Expand child tax credit $2K 401K still deductible 2 nd Homes survived Eliminate HELOC deduction Cap gains exclusion survives 1031 exchange survives Pass-through income deduction of 20% Maintains expense deductions Corporate rate of 21%
18 Consequences? Lock in effect on MID cap Less supply, eroded affordability Raises costs for $937K + Less price pressure at top end Rents rise at bottom end More money in pockets Might not translate to prices at bottom -> no incentive to own SALT cap will affect roughly half of the market not totally offset by lower tax rates This Photo by Unknown Author is licensed under CC BY-SA
19 Growth is good, but has its side effects too Higher Demand Full Employment Potential Inflation


20 There s also the bond market to consider Tax Cuts Bigger Deficits More Potential Inflation
21 And then there s this (Jan 2018 Nov 2018) (9/1/18 11/5/18) 26, ,443 25,462 SERIES: Dow 30 SOURCE: Yahoo Finance
22
23 Market Shift: Home Sales Softening Region Aug-18 Jul-18 Aug-17 MTM YTY U.S. 4,750,000 4,750,000 4,800, % -1.0% Northeast 600, , , % -1.6% Midwest 1,210,000 1,180,000 1,210, % 0.0% South 1,950,000 1,970,000 1,920, % 1.6% West 990,000 1,040,000 1,060, % -6.6% SERIES: Existing Single-Family Home Sales SOURCE: NATIONAL ASSOCIATION OF REALTORS
24 Regional Price Gains Slowing Region Aug-18 Jul-18 Aug-17 MTM YTY U.S. $267,300 $271,900 $254, % 4.9% Northeast $291,300 $310,800 $286, % 1.8% Midwest $210,200 $210,900 $203, % 3.5% South $234,200 $239,600 $225, % 3.8% West $397,400 $397,700 $378, % 5.1% SERIES: Existing Single-Family Home Sales SOURCE: NATIONAL ASSOCIATION OF REALTORS
25 Q: How long can the eoncomy be strong if housing isn t?
26 Concerns Going Forward Fiscal stimulus wears off Global growth outlook weakening US growth outpacing global growth strong dollar hurts emerging market economies Trade wars/immigration restrictions (H-1B visas) Stock market sell-off could impact financial conditions that slow growth Markets hate uncertainty
27 Bay Area Economic Profile 19 th largest economy - $748B GDP Per capital GDP = $80,000 Highest of any similar MSA 4.3% growth over last 3 years -- 2X as fast as U.S. +26% employment growth since last recession 750,000 tech workers as of July 2017 July 2016-July 2017 Net outflow o 45,670 to other parts of U.S. Net inflow of 58,156 form outside of the U.S.
28 California Realtors & Their Industry
29 C.A.R. Membership Up & Sales Flat Home Sales Membership Sales Peaks: 1978, 1988, , 2009 Membership Peaks: 1980, 1990, 2006, , , , , , , , , , ,000 50,
30
31 Member Productivity is Low ½ What It Was in Peak: Number of Transactions Long Run Average: Trough: : : 4.2 0
32 CA Housing Market: A Shift is Afoot
33 CA Buyers On the Sidelines Do you think it's a good time to buy a home in California? Do you think it's a good time to sell a home in California? 78% 57% 43% 22% Yes No Yes No Do you think it's a good time to buy a home in California? (n=300) Do you think it's a good time to sell a home in California? (n=300) SERIES: 2018 Google Consumer Poll SOURCE: CALIFORNIA ASSOCIATION OF REALTORS
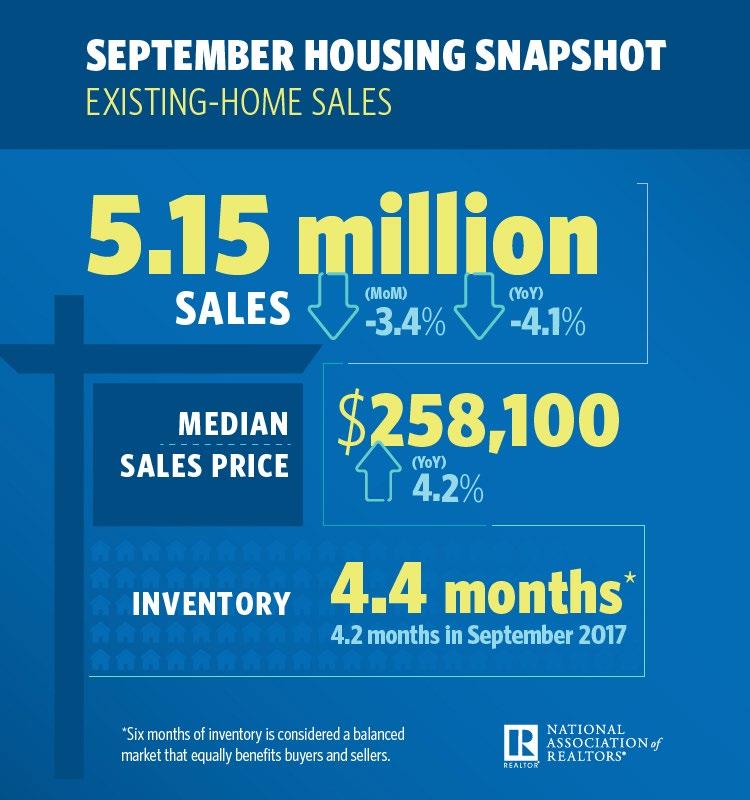
34 October Market Snapshot Sales: 397,060 down for 6 consecutive months YTD down 3.7% Below 400,000 for the last three Price: $572,000 gains in mid-single digits Unsold inventory 3.6 months

35 October Sales Off 7.9% YTY 6 months of declines CA October 2018 Sales: 397,060 Units, -3.7% YTD, -7.9% YTY 700, , , , , , ,000 - Oct-17: 431,070 Oct-18: 397,060 SERIES: Sales of Existing Single Family Homes SOURCE: CALIFORNIA ASSOCIATION OF REALTORS *Sales are seasonally adjusted and annualized
 -25% Dec-09 Dec-10 Dec-11 Dec-12 Dec-13 Dec-14 Dec-15 Dec-16 Dec-17 SERIES: Sales of Existing Single Family Homes SOURCE: CALIFORNIA ASSOCIATION")
36 CA: Declining Trend in Home Sales 25% 20% 15% 10% 5% 0% -5% -10% -15% -20% Year-over-Year % Chg 6 per. Mov. Avg. (Year-over-Year % Chg) -25% Dec-09 Dec-10 Dec-11 Dec-12 Dec-13 Dec-14 Dec-15 Dec-16 Dec-17 SERIES: Sales of Existing Single Family Homes SOURCE: CALIFORNIA ASSOCIATION OF REALTORS *Sales are seasonally adjusted and annualized

37 Bay Area Sales Down 3% from Last Year 30% Bay Area 6 per. Mov. Avg. (Bay Area) 20% YoY % chg. 10% 0% -10% -3.0% -20% -30% SERIES: Sales of Existing Single Family Homes SOURCE: CALIFORNIA ASSOCIATION OF REALTORS *Sales are not seasonally adjusted and annualized
38 Sales Declined in Sub-Million Dollar Markets October 2018 (Year-to-Year) 25% 20% 19.1% 15% 10% 5% 0% 1.6% -5% -10% -15% -11.1% -6.6% -8.5% -2.1% -2.2% -20% -25% -20.6% SERIES: Sales of Existing Detached Homes SOURCE: CALIFORNIA ASSOCIATION OF REALTORS
39 Bay Area: 4 Counties are up YTD but not by much Region Oct-17 Oct-18 YTD % Chg. YTY% Chg. Alameda % -8.6% Contra Costa % -10.0% Marin % 18.8% Napa % 30.0% San Francisco % 5.2% San Mateo % 13.5% Santa Clara % -5.8% Solano % -21.5% Sonoma % 19.2% Bay Area 4,436 4, % -3.0% SERIES: Median Price of Existing Detached Homes SOURCE: CALIFORNIA ASSOCIATION OF REALTORS
40 Home Prices Still Rising Gains Moderating California, October 2018: $572,000, -1.2% MTM, +4.7% YTY $700,000 $600,000 P:May-07 $594,530 Oct-17: $546,430 Oct-18: $572,000 $500,000 $400,000 $300,000 T: Feb-09 $245,230-59% from peak $200,000 $100,000 $- SERIES: Median Price of Existing Single Family Homes SOURCE: CALIFORNIA ASSOCIATION OF REALTORS

41 Price Per Square Increased from Last Year, but Virtually Unchanged from September October 2018: $282, Down 0.0% MTM, Up 4.4% YTY PRICE PER SQ. FT. $400 $350 $300 $250 $200 $150 $100 $50 $0 Oct-17: $270 Oct-18: $282 SERIES: Median Price Per Square Feet of Existing Single Family Homes SOURCE: CALIFORNIA ASSOCIATION OF REALTORS

42 Sales Price -to-list Price Hit the Lowest Level in 21 Months October 2018: 98.1%, -0.4% MTM, -0.8% YTY 100% Oct-17: 98.9% Oct-18: 98.1% Sales-to-List Price Ratio 98% 96% 94% 92% 90% SERIES: Sales to List Ratio of Existing Single Family Homes SOURCE: CALIFORNIA ASSOCIATION OF REALTORS
43 Bay Area: Peak v. Current Price Region Peak Month Peak Price Oct-18 %Chg Fr Peak Alameda May-07 $709,420 $900, % Contra Costa May-07 $698,420 $657, % Marin Jun-07 $1,149,390 $1,450, % Napa Jun-07 $729,170 $709, % San Francisco May-07 $972,010 $1,600, % San Mateo Oct-07 $1,020,000 $1,588, % Santa Clara Oct-07 $865,000 $1,290, % Solano Jun-07 $492,800 $430, % Sonoma Jan-06 $650,330 $650, % Bay Area May-07 $789,250 $958, % SERIES: Median Price of Existing Detached Homes SOURCE: CALIFORNIA ASSOCIATION OF REALTORS
44 So Cal: Orange & SD Above Prior Peak Region Peak Month Peak Price Aug-18 %Chg Fr Peak Orange Jun-07 $775,420 $838, % San Diego May-06 $622,380 $660, % Los Angeles Sep-07 $625,812 $607, % So CA Jun-07 $589,710 $555, % Ventura Aug-06 $710,910 $660, % Riverside Jun-06 $431,710 $400, % San Bernardino Aug-06 $350,290 $290, % SERIES: Median Price of Existing Detached Homes SOURCE: CALIFORNIA ASSOCIATION OF REALTORS
45 Central Coast: SC & SLO Region Peak Month Peak Price Aug-18 %Chg Fr Peak Santa Cruz Oct-07 $865,000 $917, % San Luis Obispo Oct-05 $619,950 $630, % Monterey Aug-07 $777,000 $599, % Santa Barbara Jul-07 $878,120 $572, % SERIES: Median Price of Existing Detached Homes SOURCE: CALIFORNIA ASSOCIATION OF REALTORS
46 Central Valley: All Below Prior Peak Region Peak Month Peak Price Aug-18 %Chg Fr Peak Sacramento County Aug-05 $394,450 $369, % Madera County Feb-08 $275,000 $254, % Placer County Aug-05 $527,990 $475, % Fresno County Jun-06 $313,500 $280, % San Joaquin County Jun-06 $426,830 $380, % Tulare County Dec-05 $269,710 $239, % Stanislaus County Sep-05 $370,100 $319, % San Benito County May-05 $671,190 $575, % Kings County Mar-06 $268,050 $227, % Merced County Oct-05 $344,610 $288, % Kern County Jun-06 $299,920 $247, % Glenn County Feb-07 $312,500 $225, % SERIES: Median Price of Existing Detached Homes SOURCE: CALIFORNIA ASSOCIATION OF REALTORS

47 Inventory Index Dipped in October October 2017: 3.0 Months; October 2018: 3.6 Months Note: Unsold Inventory Index represents the number of months it would take to sell the remaining inventory for the month in question. The remaining inventory for the month is defined as the number of properties that were Active, Pending, and Contingent (when available) and divide the sum by the number of Sold properties for the month in question. SERIES: Unsold Inventory Index of Existing Single Family Homes SOURCE: CALIFORNIA ASSOCIATION OF REALTORS
48 Unsold Inventory by Bay Area County Oct-17 Oct-18 6 Unsold Inventory Index Alameda Contra Costa Marin Napa San Francisco San Mateo Santa Clara Solano Sonoma SERIES: UII of Existing Single Family Homes SOURCE: CALIFORNIA ASSOCIATION OF REALTORS
49 Active Listings: Up 7 th Consecutive Month Year-over-Year % Chg 35% 30% 25% 20% 15% 10% 5% 0% -5% -10% -15% -20% 28.0% SERIES: Active Listing of Existing Single Family Homes SOURCE: CALIFORNIA ASSOCIATION OF REALTORS

50 Statewide Inventory Up Across the Board Oct 2018 Active Listing 50% 40% 30% 31.7% 43.9% 40.1% 30.7% 28.0% 20% 10% 0% 14.5% 9.1% -10% -6.2% SERIES: Active Listings of Existing Single Family Homes SOURCE: CALIFORNIA ASSOCIATION OF REALTORS

51 Inventory Highest at High End 10 Unsold Inventory Index Oct-17 Oct-18 SERIES: Unsold Inventory Index of Existing Single Family Homes SOURCE: CALIFORNIA ASSOCIATION OF REALTORS

52 Reduced-Price Listings Rise With Actives Share of Listings with a Reduced Price: 43.6%; Median Reduction Amount: -4.4% 50% 45% 40% 35% 30% 25% 20% 15% 10% 5% 0% 1/1/2010 4/1/2010 7/1/ /1/2010 1/1/2011 4/1/2011 7/1/ /1/2011 1/1/2012 4/1/2012 7/1/ /1/2012 1/1/2013 4/1/2013 Reduced-Price Listings 7/1/ /1/2013 1/1/2014 4/1/2014 7/1/ /1/2014 1/1/2015 4/1/2015 7/1/2015 Median Reduction 10/1/2015 1/1/2016 4/1/2016 7/1/ /1/2016 1/1/2017 4/1/2017 7/1/ /1/2017 1/1/ % 10% 9% 8% 7% 6% 4.4% 5% 4% 3% 2% 1% 0% 4/1/2018 7/1/ /1/2018 SERIES: Listing Price of Existing Single Family Homes SOURCE: CALIFORNIA ASSOCIATION OF REALTORS

53 Days on Market Rising as Market Slows California, October 2018: 26.0 Days DAYS ON MARKET SERIES: Median Time of Market of Existing Single Family Homes SOURCE: CALIFORNIA ASSOCIATION OF REALTORS
54 Days on Market by County Oct-17 Oct-18 Days on Market Alameda Contra Costa Marin Napa San Francisco San Mateo Santa Clara Solano Sonoma SERIES: Days on Market of Existing Single Family Homes SOURCE: CALIFORNIA ASSOCIATION OF REALTORS
55 At some point a supply problem becomes a demand problem. Joel Singer, CEO C.A.R.
56 San Francisco Bay Area

57 Sales Lagging -2.4% YTD SF Bay Area, Oct Sales: 4,301 Units, -2.4% YTD, -3.0% YTY 8,000 7,000 6,000 5,000 4,000 3,000 2,000 1,000 0 SERIES: Sales of Existing Single Family Homes SOURCE: CALIFORNIA ASSOCIATION OF REALTORS
58 Bay Area: Sales off 2.4% YTD Region Oct-17 Oct-18 YTD % Chg. YTY% Chg. Alameda % -8.6% Contra Costa % -10.0% Marin % 18.8% Napa % 30.0% San Francisco % 5.2% San Mateo % 13.5% Santa Clara % -5.8% Solano % -21.5% Sonoma % 19.2% Bay Area 4,436 4, % -3.0% SERIES: Median Price of Existing Detached Homes SOURCE: CALIFORNIA ASSOCIATION OF REALTORS
59 Median Price of Existing Detached Homes SF Bay Area, October 2018: $958,800, Up 7.9% YTY $1,200,000 $1,000,000 $800,000 $600,000 $400,000 $200,000 $0 SERIES: Median Price of Existing Single Family Homes SOURCE: CALIFORNIA ASSOCIATION OF REALTORS
60 Bay Area: Peak v. October 2018 Region Peak Month Peak Price Oct-18 %Chg Fr Peak Alameda May-07 $709,420 $900, % Contra Costa May-07 $698,420 $657, % Marin Jun-07 $1,149,390 $1,450, % Napa Jun-07 $729,170 $709, % San Francisco May-07 $972,010 $1,600, % San Mateo Oct-07 $1,020,000 $1,588, % Santa Clara Oct-07 $865,000 $1,290, % Solano Jun-07 $492,800 $430, % Sonoma Jan-06 $650,330 $650, % Bay Area May-07 $789,250 $958, % SERIES: Median Price of Existing Detached Homes SOURCE: CALIFORNIA ASSOCIATION OF REALTORS

61 Unsold Inventory Index SF Bay Area, October 2018: 2.5 Months Note: The Unsold Inventory Index represents the number of months it would take to deplete the remaining inventory at the end of a particular month with the sales rate of the month in consideration. Inventory includes listings with Active, Pending, and Contingent (when available) statuses. SERIES: Unsold Inventory Index of Existing Single Family Homes SOURCE: CALIFORNIA ASSOCIATION OF REALTORS

62 Median Time on the Market SF Bay Area, October 2018: 26 Days SERIES: Median Time of Market of Existing Single Family Homes SOURCE: CALIFORNIA ASSOCIATION OF REALTORS
63 Santa Clara County
64 What s Up? From Great to Good Sales tapering Price gains moderating Active listings increasing Price reductions increasing Time on market increasing
65 Unsold Inventory by County Oct-17 Oct-18 6 Unsold Inventory Index Alameda Contra Costa Marin Napa San Francisco San Mateo Santa Clara Solano Sonoma SERIES: UII of Existing Single Family Homes SOURCE: CALIFORNIA ASSOCIATION OF REALTORS

66 Days on Market by County Oct-17 Oct-18 Days on Market Alameda Contra Costa Marin Napa San Francisco San Mateo Santa Clara Solano Sonoma SERIES: Days on Market of Existing Single Family Homes SOURCE: CALIFORNIA ASSOCIATION OF REALTORS
67 Santa Clara County

68 Sales of Existing Detached Homes Santa Clara County, Oct 2018 Sales: 827 Units, -6.6% YTD, -5.8% YTY 1,800 1,600 1,400 1,200 1, SERIES: Sales of Existing Single Family Homes SOURCE: CALIFORNIA ASSOCIATION OF REALTORS
69 Median Price of Existing Detached Homes Santa Clara County, Oct 2018: $1,290,000, Up 3.8% YTY $1,600,000 $1,400,000 $1,200,000 $1,000,000 $800,000 $600,000 $400,000 $200,000 $0 SERIES: Median Price of Existing Single Family Homes SOURCE: CALIFORNIA ASSOCIATION OF REALTORS
70 Unsold Inventory Index Santa Clara County, October 2018: 2.4 Months Note: The Unsold Inventory Index represents the number of months it would take to deplete the remaining inventory at the end of a particular month with the sales rate of the month in consideration. Inventory includes listings with Active, Pending, and Contingent (when available) statuses. SERIES: Unsold Inventory Index of Existing Single Family Homes SOURCE: CALIFORNIA ASSOCIATION OF REALTORS

71 Median Time on the Market Santa Clara County, October 2018: 14.0 Days SERIES: Median Time of Market of Existing Single Family Homes SOURCE: CALIFORNIA ASSOCIATION OF REALTORS
72 Sales Dropping Across the Board 2017 YTD 2018 YTD $5,000 $4,500 4,432 $4,000 Median Price $3,500 $3,000 $2,500 $2,000 $1,500 $1,000 $500 $ Campbell Cupertino Gilroy Los Altos Los Altos Hills Los Gatos Milpitas Monte Sereno Morgan Hill Mountain View Palo Alto San Jose San Martin Santa Clara Saratoga Sunnyvale SERIES: Sales of Existing Single Family Homes SOURCE: CALIFORNIA ASSOCIATION OF REALTORS

73 Declined Big in Some Markets 10% 8.1% 6.7% YTY % Chg. in Price 5% 0% -5% -10% -15% -20% -2.9% -15.3% -15.1% -18.4% -10.5% 0.4% -15.0% -7.7% -7.4% -0.7% -5.1% -9.0% -8.9% -25% -23.5% -30% Campbell Cupertino Gilroy Los Altos Los Altos Hills Los Gatos Milpitas Monte Sereno Morgan Hill Mountain View Palo Alto San Jose San Martin Santa Clara Saratoga Sunnyvale SERIES: Sales of Existing Single Family Homes SOURCE: CALIFORNIA ASSOCIATION OF REALTORS
74 Home Prices Increased in Most Cities Median Price $6,400,000 $5,400,000 $4,400,000 $3,400,000 $2,400,000 $1,400,000 $400,000 1,495,000 Campbell 2,574,888 Cupertino 760,000 Gilroy 3,400,000 Los Altos 5,525,000 Los Altos Hills Oct-17 2,125,000 Los Gatos 1,075,000 Milpitas 4,500,000 Monte Sereno Oct ,203 Morgan Hill 2,240,000 Mountain View 3,023,000 Palo Alto 1,147,000 1,267,0751,305,000 San Jose San Martin Santa Clara 2,700,000 Saratoga 1,800,000 Sunnyvale SERIES: Median Prices of Existing Single Family Homes SOURCE: CALIFORNIA ASSOCIATION OF REALTORS
75 Price Growth Is Slowing in Many Markets 80% 60% 51.4% 61.4% YTY % Chg. in Price 40% 20% 0% -20% 2.9% 26.2% 7.5% 13.3% 16.1% 3.4% 0.9% 4.9% -1.9% 6.9% -7.3% 7.9% 2.6% -40% -31.9% Campbell Cupertino Gilroy Los Altos Los Altos Hills Los Gatos Milpitas Monte Sereno Morgan Hill Mountain View Palo Alto San Jose San Martin Santa Clara Saratoga Sunnyvale SERIES: Median Prices of Existing Single Family Homes SOURCE: CALIFORNIA ASSOCIATION OF REALTORS
76 Active Listings Up for All Markets Oct-17 Oct Active Listings Campbell Cupertino Gilroy Los Altos Los Altos Hills Los Gatos Milpitas Monte Sereno Morgan Hill Mountain View Palo Alto San Jose San Martin Santa Clara Saratoga Sunnyvale SERIES: Active Listings of Existing Single Family Homes SOURCE: CALIFORNIA ASSOCIATION OF REALTORS
77 Listings on the Market Longer Oct-17 Oct Days on Market Campbell Cupertino Gilroy Los Altos Los Altos Hills Los Gatos Milpitas Monte Sereno Morgan Hill Mountain View Palo Alto San Jose San Martin Santa Clara Saratoga Sunnyvale SERIES: Active Listings of Existing Single Family Homes SOURCE: CALIFORNIA ASSOCIATION OF REALTORS
78 Housing affordability is the Achilles heel of the California Economy Joel Singer, CEO C.A.R. 1982
 9% 8% 7% CA US Linear (CA) CA turnover rate trend 6% 5% 4% 5.3% 4.")

79 CA v US: Lower Housing Turnover New Normal? 10% Housing Turnover Rate (Single-Family Homes only) 9% 8% 7% CA US Linear (CA) CA turnover rate trend 6% 5% 4% 5.3% 4.6% 3% 2% 1% 0% SERIES: Percent of existing single-family homes being sold SOURCE: Census Bureau, American Community Survey, Moody s Analytics, C.A.R.

80 Sellers Moving Less Frequently Years Owned Home Before Selling 11.5 Older Generations Don t Move As Often As Younger Generations Millennials 5 6 Gen X's 8 4 Baby Boomers Silent Generations 30 SERIES: 2018 Housing Market Survey SOURCE: CALIFORNIA ASSOCIATION OF REALTORS
 300000 Single Family Multi-Family")

81 And California Is Not Building Enough 2017: 112,886 (55,779 sf, 57,107 mf ) f: 127,780 (64,900 sf, 62,880 mf) Single Family Multi-Family CA HCD Projected Housing Needs: ,000/yr SERIES: California New Housing Permits SOURCE: Construction Industry Research Board
82 CA Example: More Single Family Units Now Rentals 8,000,000 Potentially between 400,000 and 700,000 SF Rentals that Used to be Owner-Occupied 7,000,000 6,000,000 6,919,164 6,527,730 5,000,000 4,000,000 3,000,000 2,674,808 2,000,000 1,940,607 1,000,000 0 SF Owners SF Renters SOURCE: U.S. Census Bureau, Annual Social and Economic Supplement (ASEC) to the Current Population Survey (CPS). Downloaded from the National Bureau of Economic Research (NBER)

83 Top 10 Markets in Need of More Housing Top 10 Markets in Need of More Single-Family Housing Starts Metro Area # of permits required 1. New York 218, Dallas 132, San Francisco 127, Miami 118, Chicago 94, Atlanta 93, Seattle 73, San Jose, CA 69, Denver 67, San Diego 55,825 SOURCE: National Association of Realtors, Census Bureau
84 CA building less housing per capita than: AZ, NV, WA, OR, NY( ) Population Added 1,000 People Housing Units Added Number Ratio of Housing Units Added to Population Added Units per 1,000 People Arizona 1,101 Arizona 416,330 Arizona 378 Nevada 559 Nevada 202,332 Nevada 362 New York 1,090 New York 379,019 New York 348 Washington 1,142 Washington 374,157 Washington 328 Oregon 533 Oregon 174,466 Oregon 327 Texas 5,592 Texas 1,728,257 Texas 309 California 3,971 California 1,072,121 California % SOURCE: U.S. Census Bureau, C.A.R.


85 Housing Affordability Peaked at Q % OF HOUSEHOLDS THAT CAN BUY A MEDIAN-PRICED HOME 80% 70% 60% 50% 40% 30% 20% 10% 0% California, Annual Quarterly 53% 26% SERIES: Housing Affordability Index of Traditional Buyers SOURCE: CALIFORNIA ASSOCIATION OF REALTORS
86 Housing Affordability In CA: By County Q2: % able to purchase median-priced home SERIES: Housing Affordability Index of Traditional Buyers SOURCE: CALIFORNIA ASSOCIATION OF REALTORS
87 Minimum Annual Income Required During Affordability Peak vs. Current Region 2012 Q Q2 % CHG CA SFH $56,320 $126, % CA Condo/Townhomes $44,440 $101, % Los Angeles Metropolitan Area $53,780 $112, % Inland Empire $35,170 $76, % S.F. Bay Area $90,370 $219, % US $32,000 $57, % SERIES: Housing Affordability Index of Existing Detached Homes SOURCE: CALIFORNIA ASSOCIATION OF REALTORS

88 Housing Affordability Still the Main Reason for Outmigration All Buyers % 5% 10% 15% 20% 25% 30% Housing affordability Quality of life Closer to family/relative Second home Job change Shorter commute to work/school Quality of school Retired Quality of community services Other 1% 1% 8% 5% 7% 9% 5% 9% 5% 8% 5% 6% 16% 14% 12% 11% 15% 18% 21% 28% Q. What was the primary reason for changing county? SERIES: 2018 Annual Housing Market Survey SOURCE: California Association of REALTORS
89 It s a Much Bigger Problem for First-Time Buyers First-Time Buyers Repeat Buyers 0% 10% 20% 30% 40% 50% 60% Housing affordability Quality of life Closer to family/relative Second home Job change Shorter commute to work/school Quality of school Retired Quality of community services Other 18% 19% 14% 11% 12% 1% 12% 5% 7% 2% 5% 5% 5% 0% 7% 1% 1% 8% 18% 49% SERIES: 2018 Annual Housing Market Survey SOURCE: California Association of REALTORS
90 Homeownership update CA inched up from 2016 but remained at low level California Vs. U.S. 9.5% gap in % CA US 70% Peak: 69.0% 65% 64.5% 63.9% 60% 55% 50% 53.7% Peak: 60.2% 54.4% 45% SERIES: Homeownership Rates SOURCE: U.S. Census Bureau
91 California still ranked the 2 nd lowest amongst all states 80% Homeownership Rate 70% 60% 54.4% 50% 40% 30% 20% 10% 0% New York California Nevada Hawaii Rhode Island Massachusetts Texas Oregon North Dakota Georgia Washington Colorado Florida New Jersey Arizona Arkansas Illinois Alaska Kansas Ohio Connecticut Louisiana Nebraska North Carolina New Mexico Maryland Tennessee Virginia Missouri Montana South Dakota Wisconsin Pennsylvania Oklahoma Idaho Alabama Delaware Indiana Iowa Kentucky Wyoming Maine Mississippi Utah Vermont New Hampshire Minnesota South Carolina Michigan West Virginia SERIES: Homeownership Rates SOURCE: U.S. Census Bureau (Current Population Survey)
92 Homeownership will deteriorate further if the trend continues Despite the slight bounce back, homeownership will remain low in the next couple years due to: 70% California Homeownership Rate Interest rate hike Price growth Low turn-over rates Lack of new constructions Short-term Costa-Hawkins Repeal Impact SERIES: Homeownership Rate SOURCE: U.S. Census Bureau, American Community Survey, C.A.R. projection 60% 50% 40% 30% 59.7% 57.1% 56.1% 47.3% 44.2% 41.0% Fast Slow Avearge

93 More Sellers Continue to Move out of California; Highest since 2007 Location of Seller s New Home Within the same county 38% 41% 37% 45% 47% 42% 49% 49% 46% 44% 44% 40% 38% 36% In another county in California 23% 18% 24% 17% 21% 21% 19% 18% 20% 21% 20% 21% 20% 21% In another state 31% 28% 29% 27% 19% 20% 20% 22% 19% 22% 22% 25% 28% 29% Out of US 1% 2% 1% 1% 2% 1% 1% 1% 0% 1% 1% 1% 1% 1% Don't Know/Not sure 7% 11% 9% 10% 12% 16% 10% 10% 15% 13% 13% 13% 14% 13% Total 100% 100% 100% 100% 100% 100% 100% 100% 100% 100% 100% 100% 100% 100% SERIES: 2018 Housing Market Survey SOURCE: CALIFORNIA ASSOCIATION OF REALTORS

94 Case Study: Seller Leaving California Seller s Profile Age: 56 Marital Status: Married Couple with Dependents Income: $200,000 Yrs. Owned: 25 Net cash gain: $1,050,000 Reason for selling: Desired larger home State moving to: Utah We doubled the size of our house and lowered our mortgage payment. * Characteristics of Home Size: 1,948 sq. ft Property Type: Single-Family Home Location: Los Angeles County Price: $1,175,000 L.A would have been my first choice, and I didn t want to have to leave California. I couldn t afford to stay there * *Lopez, S. (2017) They re leaving California for Las Vegas for find middle-class life that eluded them. Los Angles Times, 3 December SERIES: 2018 Housing Market Survey SOURCE: CALIFORNIA ASSOCIATION OF REALTORS
95 Global Housing Demand Has Softened


96 9% 8% 8% International Buyers for CA Housing: Flat for 3 Years; Peaked in 2013 The share of international buyers dropped to the lowest level in at least ten years 8% 7% 6% 5% 6% 5% 6% 6% 6% 4% 3% 4% 3% 3% 3% 2% 1% 0% Q. Was the buyer an international buyer a person who was a citizen of another country who wished to purchase residential real estate in the U.S.? SERIES: 2018 Housing Market Survey SOURCE: CALIFORNIA ASSOCIATION OF REALTORS

97 Top 20 Markets for International Traffic Rank Market 1 Miami-Fort Lauderdale- West Palm Beach, FL 2 LA-Long Beach - Anaheim, CA 3 Bellingham, WA 4 Santa Cruz Watsonville, CA 5 Orlando-Kissimmee- Sanford, FL 6 New York-Newark-Jersey City, NY/NJ/PA 7 Kahului-Wailuku-Lahaina, HI 8 Urban Honolulu, HI 9 Houston- The Woodlands- Sugar Land, TX 10 El Centro, CA September 2018 realtor.com Search Data Rank Market 11 Tampa-St. Petersburg- Clearwater, FL 12 Phoenix-Mesa-Scottsdale, AZ 13 Cape Coral-Fort Myers, FL 14 San Francisco Oakland - Hayward, CA 15 Washington-Arlington- Alexandria, DC-VA-MD-WV 16 Dallas-Fort Worth-Arlington, TX 17 Seattle-Tacoma-Bellevue, WA 18 Lakeland-Winter Haven, FL 19 Naples-Immokalee Macro Island, FL 20 Chicago-Naperville-Elgin, IL- IN-WI SOURCE: Realtor.com
98 Five States Accounted for 52% of Foreign Purchases 20% 18% 16% 14% 12% 10% 8% 19% 14% 9% Share of All Foreign Buyers 6% 4% 5% 5% 4% 4% 3% 3% 3% 3% 3% 2% 0% Florida California Texas Arizona New York Georgia New Jersey Ohio Virginia North Carolina Illinois Michigan SERIES: 2018 Profile of International Home Buying Activity SOURCE: NATIONAL ASSOCIATION OF REALTORS
99 Dollar Volume of Sales to Foreign Buyers Declined in 2018 (Billions) China includes buyers from the People s Republic of China, Hong Kong, and Taiwan. Estimates from 2010 through 2015 include some commercial transactions. From 2016, the estimates include only residential transactions SERIES: 2018 Profile of International Home Buying Activity SOURCE: NATIONAL ASSOCIATION OF REALTORS
100 Number of Sales to Foreign Buyers Down China includes buyers from the People s Republic of China, Hong Kong, and Taiwan. Estimates from 2010 through 2015 include some commercial transactions. From 2016, the estimates include only residential transactions SERIES: 2018 Profile of International Home Buying Activity SOURCE: NATIONAL ASSOCIATION OF REALTORS

101 Average Purchase Price for Foreign Buyers SERIES: 2017 Profile of International Home Buying Activity SOURCE: NATIONAL ASSOCIATION OF REALTORS China includes buyers from the People s Republic of China, Hong Kong, and Taiwan. Estimates from 2010 through 2015 include some commercial transactions. From 2016, the estimates include only residential transactions
102 Where Are We?
103 1. CA is NOT Affordable

104 Only Lassen County Beats US Affordability 2018-Q2: % able to purchase median-priced home SERIES: Housing Affordability Index of Traditional Buyers SOURCE: CALIFORNIA ASSOCIATION OF REALTORS
105 2. CA is Home to Record Number of Homeless

106 Largest Number of Homeless People Estimates of Homeless People By State, 2017 Top 5 State with Largest Increases ( ) California 16,136/13.7% New York 3,151/3.6% Oregon 715/5.4% Nevada 435/5.9% Texas 426/1.8% SERIES: Estimates of Homeless People in January 2017 SOURCE: The U.S. Department of Housing & Urban Development
107 3. CA is Losing Workers to More Affordable States: Two Step
108 ~750K People Have Left Since California Net Domestic Migration -20,000-40,000-60,000-80,000-57,563-24,972-60,839-41, , , , , , , , , ,
109 Step 1: Coastal to Cheaper Markets Core San Francisco Bay Area Out Migration ( ) -8,559-9,005-11,659 Elsewhere in CA Another State -12,408-13,053-15,244-17,697-25,843-30,268-42,777 Merced Solano Washington Stanislaus Santa Cruz Texas Nevada (ST) Oregon San Joaquin Sacramento MSA
110 Step 2: Pricing Prior Residents Out of State Sacramento MSA Out Migration ( ) -2,260-2,715-2,917-3,596-4,002-4,029-4,179-5,020-5,127 Elsewhere in CA Another State -8,166 Kentucky Santa Cruz Oklahoma Colorado Sutter & Yuba San Luis Obispo San Bernardino Oregon Idaho Nevada (ST)
111 Step 1: Coastal to Cheaper Markets Coastal Southern California Out Migration ( ) -19,854-21,935-34,217-40,361-42,503-48,609-65,534-79,132 Elsewhere in CA Another State -101, ,148 Santa Barbara Colorado Oregon Washington Kern Nevada (ST) Arizona Texas San Bernardino Riverside
112 Step 2: Pricing Prior Residents Out of State Inland Empire Out Migration ( ) -3,575-5,117-7,732-7,970-8,344 Elsewhere in CA Another State -10,604-10,680-10,699-16,374-17,859 Hawaii Colorado Nevada (ST) Idaho North Carolina Utah Georgia Kern County Arizona Texas
113 4. CA will soon be a majority renter state
114 California: 2 nd lowest in nation 80% Homeownership Rate 70% 60% 54.4% 50% 40% 30% 20% 10% 0% New York California Nevada Hawaii Rhode Island Massachusetts Texas Oregon North Dakota Georgia Washington Colorado Florida New Jersey Arizona Arkansas Illinois Alaska Kansas Ohio Connecticut Louisiana Nebraska North Carolina New Mexico Maryland Tennessee Virginia Missouri Montana South Dakota Wisconsin Pennsylvania Oklahoma Idaho Alabama Delaware Indiana Iowa Kentucky Wyoming Maine Mississippi Utah Vermont New Hampshire Minnesota South Carolina Michigan West Virginia SERIES: Homeownership Rates SOURCE: U.S. Census Bureau (Current Population Survey)
115 Homeownership Rates California Vs. U.S. 9.5% gap in % CA US 70% Peak: 69.0% 65% 64.5% 63.9% 60% 55% 50% 53.7% Peak: 60.2% 54.4% 45% SERIES: Homeownership Rates SOURCE: U.S. Census Bureau
116 CA: Ownership Rebound? 75 Homeownership Rate CA U.S.

117 Homeownership Varies Sharply by Ethnicity California Homeownership Rates by Race and Ethnicity ( Average) SERIES: Homeownership rate by ethnicity SOURCE: CA HCD, PolicyLink, USC Program for Environmental and Regional Equity
118 CA: Majority Renter State by 2025 California Homeownership Rate 70% 60% 57.1% 59.7% 56.1% 50% 47.3% 44.2% 40% 41.0% 30% Fast Slow Avearge SERIES: Homeownership Rate SOURCE: U.S. Census Bureau, American Community Survey, C.A.R. projection


119 42 of 142 Big Cities ALREADY Majority Renter 80% 70% 60% 50% 40% 30% 20% 10% 0% 2017 California Renter Rate by City Hawthorne Glendale Los Angeles El Cajon Costa Mesa Burbank Santa Barbara Santa Clara Lynwood Alameda Santa Cruz Sunnyvale San Diego Sacramento Stockton Redwood City Westminster Compton San Mateo Palo Alto Redding Baldwin Park Lancaster Pittsburg Citrus Heights Carmichael San Leandro Chula Vista Daly City Newport Beach Whittier Visalia Hemet Concord Clovis Temecula San Marcos Lake Elsinore San Clemente Walnut Creek Fontana Hesperia Simi Valley Lakewood Livermore Castro Valley Menifee Yorba Linda 50%

120 Majority Renter Cities 80% 76.0% 70% 60% 50% 40% 30% 20% 10% 0% 2017 California Renter Rate by City Hawthorne Santa Monica East Los Angeles Glendale Inglewood San Francisco Los Angeles Bellflower Alhambra El Cajon Florence-Graham Oakland Costa Mesa Merced Long Beach Burbank Arden-Arcade Mountain View Santa Barbara El Monte Pasadena Santa Clara South Gate Chico Lynwood Berkeley Anaheim Alameda Salinas Santa Ana Santa Cruz Davis Madera Sunnyvale Irvine Tustin San Diego Fresno Lodi Sacramento San Bernardino Escondido 50.7%
121 Q: What needs to be done? A: Build More Housing

122 Lakewood CA 1950


123 Global Capitals Do Density #10 Shanghai #43 London #69 Paris #35 Rio de Janerio #27 Mexico City Source: citymayors.com
124 U.S. Cities Ranked by Density #90 Los Angeles #104 San Francisco/Oakland #107 San Jose #119 Honolulu #120 Las Vegas #121 Miami Global Ranking
125 Case Study: Restrictive Zoning in L.A. Los Angeles Zoned Residential Capacity 1960: Los Angeles zoned to accommodate 10 million people Today: LA is zoned for only 4.3 million people after decades of population growth and increase in housing demand. SERIES: Los Angeles Zoned Residential Capacity SOURCE: Morrow (2016), the White House: Housing Development Toolkit
126 CA vs US Median Price $600,000 $500,000 U.S CA CA Price Trend $400,000 $300,000 $200,000 $100,000 $0 SERIES: Median Price of Existing Single-Family Homes SOURCE: CALIFORNIA ASSOCIATION OF REALTORS
127 USC Dornsife/LA Times Poll (10/18) Only 13% of CA voters think too little home building is a primary contributor to the state s affordability issues.
128 The Forecast
129 U.S. Economic Outlook p 2019f US GDP 1.7% 2.4% 2.6% 1.6% 2.3% 3.0% 2.4% Nonfarm Job Growth 1.7% 1.9% 2.1% 1.8% 1.4% 1.6% 1.3% Unemployment 7.4% 6.2% 5.3% 4.9% 4.4% 3.9% 3.7% CPI 1.5% 1.6% 0.1% 1.4% 2.0% 2.5% 2.4% Real Disposable Income, % Change -1.4% 2.7% 3.4% 2.7% 2.1% 2.8% 2.6% 30-Yr FRM 4.0% 4.2% 3.9% 3.6% 4.0% 4.7% 5.2% SERIES: U.S. Economic Outlook SOURCE: CALIFORNIA ASSOCIATION OF REALTORS
130 California Economic Outlook p 2019f Nonfarm Job Growth 3.0% 2.2% 2.7% 2.3% 1.6% 2.0% 1.4% Unemployment 8.9% 7.5% 6.2% 5.5% 4.8% 4.3% 4.3% CA Population (Million) Population Growth 0.9% 1.0% 0.8% 0.6% 0.8% 0.7% 0.7% Real Disposable Income, % Change -2.1% 5.6% 3.9% 1.6% 1.6% 2.4% 3.0% SERIES: CA Economic Outlook SOURCE: CALIFORNIA ASSOCIATION OF REALTORS
131 CA Housing Market Outlook Most Likely Case p 2019f SFH Resales (000s) % Change -5.9% -7.8% 7.0% 2.0% 1.5% -6.2% -6.9% Median Price ($000s) $407.2 $446.9 $476.3 $502.3 $538.0 $575.7 $574.5 % Change 27.5% 9.8% 6.6% 5.4% 7.2% 7.0% -0.2% Housing Affordability Index 36% 30% 31% 31% 29% 28% 26% 30-Yr FRM 4.0% 4.2% 3.9% 3.6% 4.0% 4.7% 5.2% SERIES: CA Housing Market Outlook SOURCE: CALIFORNIA ASSOCIATION OF REALTORS
132 Opportunities Listings are up & prices are favorable for sellers Call frustrated potential buyers and tell them the good news Rates are rising don t wait Provide sellers a teachable moment Know where people are moving and why and work your referral network Get involved in the political process this is your future

133 Read This: California s Housing Future


134
135 Jeff Bezos: Amazon "I very frequently get the question: 'What's going to change in the next 10 years?' I almost never get the question: 'What's not going to change in the next 10 years?' And I submit to you that that second question is actually the more important of the two because you can build a business strategy around the things that are stable in time.. Customers want: Large selection Low Prices Fast Delivery

136 How Client Found Their Agent Represented Them in Previous Home Client was Friend/Relative/Neighbor Referral from a client Recommendations of Friends Refferal from Business Associates Open House Web page/internet Door-to-Door Farming Direct Mail Marketing Relocation Referral Walk in /Floor Call Yard Signs Listing Agent for Home Purchased Social Media Mobile App Telephone Marketing Print Ads/Newspaper & Magazine Other SERIES: 2018 Housing Market Survey SOURCE: CALIFORNIA ASSOCIATION OF REALTORS All Buyers 0% 5% 10% 15% 20% 25% Q. How did your client find and select you to represent them?


137 Identify. Develop. C onnect

138

139 Focus is key When Creating a Consistent Customer Experience

140
2019 Economic & Market Forecast. REImagine October 11, 2018 Leslie Appleton-Young SVP & Chief Economist
 2019 Economic & Market Forecast REImagine October 11, 2018 Leslie Appleton-Young SVP & Chief Economist 2008 The CA Housing Market Recovery 100% 90% 80% 70% 60% 50% 40% 30% 20% 10% 0% Equity Sales Short
2018 Housing Market Outlook. Central Coast Realty Group Business Symposium February 22, 2018 Oscar Wei Senior Economist
 2018 Housing Market Outlook Central Coast Realty Group Business Symposium February 22, 2018 Oscar Wei Senior Economist Overview Economic Update California Housing Market Outlook Regional Housing Market
2019 Housing Market Forecast. Palos Verdes Peninsula AOR January 8, 2019 Jordan G. Levine Senior Economist
 2019 Housing Market Forecast Palos Verdes Peninsula AOR January 8, 2019 Jordan G. Levine Senior Economist Overview Good News: Economic fundamentals solid Homeownership still the dream Rates might not go
California Housing Market Update. Monthly Sales and Price Statistics October 2018
 California Housing Market Update Monthly Sales and Price Statistics October 2018 Sales Had the 2 nd Largest Drop in the Last 6 Months California, October 2018 Sales: 397,060 Units, -3.7% YTD, -7.9% YTY
Leslie Appleton-Young Chief Economist & Vice President
 Leslie Appleton-Young Chief Economist & Vice President 2017 Forecast Report Card 2016 Actual 2017 Forecast 2017 Projected SFH Resales (000s) 416.7 413.0 421.9 % Change 1.8% 1.4% 1.3% Median Price ($000s)
CALIFORNIA ECONOMIC & MARKET OUTLOOK. October 29,2014 Contra Costa Association of REALTORS Leslie Appleton Young, Chief Economist
 2014 2015 CALIFORNIA ECONOMIC & MARKET OUTLOOK October 29,2014 Contra Costa Association of REALTORS Leslie Appleton Young, Chief Economist OVERVIEW Economic Outlook California Housing Market Outlook Housing
2016 ECONOMIC AND HOUSING MARKET FORECAST
 2016 ECONOMIC AND HOUSING MARKET FORECAST April 06, 2016 San Francisco Association of REALTORS Oscar Wei, Senior Economist of C.A.R. OVERVIEW Economic Outlook California Housing Market Outlook Regional
California Housing Market Update. Monthly Sales and Price Statistics November 2018
 California Housing Market Update Monthly Sales and Price Statistics November 2018 Home Sales: Largest Decline Since 2014 California, November 2018 Sales: 381,400 Units, -4.6% YTD, -13.4% YTY 700,000 600,000
Economic and Housing Market Outlook ( ) October 31, Contra Costa AOR
 October 31, Contra Costa AOR") Economic and Housing Market Outlook (2012 2013) Contra Costa AOR October 31, 2012 Oscar Wei Senior Research Analyst California Association of REALTORS Overview US and California Economies California Housing
Economic and Housing Market Outlook (2012 2013) Contra Costa AOR October 31, 2012 Oscar Wei Senior Research Analyst California Association of REALTORS Overview US and California Economies California Housing
California Housing Market Update. Monthly Sales and Price Statistics September 2018
 California Housing Market Update Monthly Sales and Price Statistics September 2018 Sales Had the Largest Decline since March 2014 California, September 2018 Sales: 382,550 Units, -3.3% YTD, -12.4% YTY
California Housing Market Update. Monthly Sales and Price Statistics December 2018
 California Housing Market Update Monthly Sales and Price Statistics December 2018 Sales Reached the Lowest Level since Jan 2015 California, December 2018 Sales: 372,260 Units, -5.2% YTD, -11.6% YTY 700,000
California Housing Market Update. Monthly Sales and Price Statistics May 2018
 California Housing Market Update Monthly Sales and Price Statistics May 2018 Sales Lost Momentum as Mortgage Rates Continued to Climb California, May 2018 Sales: 409,270 Units, +0.3% YTD, -4.6% YTY 700,000
California Housing Market Update. Monthly Sales and Price Statistics August 2018
 California Housing Market Update Monthly Sales and Price Statistics August 2018 Sales Declined for the 4 th Consecutive Month California, August 2018 Sales: 399,600 Units, -2.1% YTD, -6.6% YTY 700,000
CALIFORNIA ECONOMIC & MARKET OUTLOOK. October 29,2014 SILVAR Leslie Appleton-Young, Chief Economist
 2014-2015 CALIFORNIA ECONOMIC & MARKET OUTLOOK October 29,2014 SILVAR Leslie Appleton-Young, Chief Economist OVERVIEW Economic Outlook California Housing Market Outlook Housing Affordability Regional Market
Orange County AOR October 21, 2016 Leslie Appleton-Young Chief Economist & Vice President
 Orange County AOR October 21, 2016 Leslie Appleton-Young Chief Economist & Vice President lesliea@car.org Cadence of Accountability How did I do with last year s forecast? 2016 Story US economic and job
REALTOR.COM MARKET OUTLOOK
 REALTOR.COM MARKET OUTLOOK Realtor.com Economics May 2018 MOST COMPETITIVE SEASON ON RECORD Key expectations from realtor.com Existing Home Sales Struggle to Break Out Supply: Inventory, Prices, Affordability
Contra Costa AOR October 26, 2016 Leslie Appleton-Young Chief Economist & Vice President
 Contra Costa AOR October 26, 2016 Leslie Appleton-Young Chief Economist & Vice President lesliea@car.org Cadence of Accountability How did I do with last year s forecast? 2016 Story US economic and job
2013 Housing Market Forecast. SILVAR: Los Gatos/Saratoga District October 10, 2012 Leslie Appleton-Young, Vice President & Chief Economist
 2013 Housing Market Forecast SILVAR: Los Gatos/Saratoga District October 10, 2012 Leslie Appleton-Young, Vice President & Chief Economist What we saw from the roof.. C.A.R. NAR THE ECONOMY Recent Housing
November 1, 2016 Sacramento AOR Membership Meeting Oscar Wei, Senior Economist of C.A.R.
 November 1, 2016 Sacramento AOR Membership Meeting Oscar Wei, Senior Economist of C.A.R. Overview Economic Outlook California Housing Market Outlook Regional Housing Market Outlook 2017 Forecast Economic
Santa Cruz County AOR Seascape Golf Club October 7, 2016 Leslie Appleton-Young Chief Economist & Vice President
 Santa Cruz County AOR Seascape Golf Club October 7, 2016 Leslie Appleton-Young Chief Economist & Vice President 12 Free Hours of Online CE Courses! 2016 C.A.R. Member Benefit Delivered 580,000+ Hours Take
Real gross domestic product California vs. United States
 Real gross domestic product California vs. United States Percent change, year ago 6 4 U.S. California 2 0-2 -4-6 2001 2002 2003 2004 2005 2006 2007 2008 2009 2010 2011 Source: Bureau of Economic Analysis.
Phoenix, Central and Northern Arizona
 Phoenix, Central and Northern Arizona End of Year Housing Report 1-8-354-5664 LongRealty.com 217 End of Year Housing Report SALES & INVENTORY Housing market trends For the overall real estate market in
2017 RESIDENTIAL REAL ESTATE MARKET REPORT
 2017 RESIDENTIAL REAL ESTATE MARKET REPORT Published January 26, 2018 Our market reports have been focused on the effects of low inventory on our housing market and for good reason. December 2017 marked
U.S. Home Price Insights Report
 U.S. Home Price Insights Report FEATURING CORELOGIC HPI Through September 2015 with Forecasts From October 2015 CoreLogic HPI National Overview With the September release, the CoreLogic HPI posted a gain
$ FACTS ABOUT CALIFORNIA: WAGE HOUSING MOST EXPENSIVE AREAS WAGE RANKING
 STATE #3 * RANKING In California, the Fair Market Rent () for a two-bedroom apartment is $1,699. In order this level of and utilities without paying more than 30% of income on housing a household must
California s Housing Market: How Much Froth Is Out There?
 California s Housing Market: How Much Froth Is Out There? Conference Underwriter Polling Question: What Will Most Likely Occur to California s Housing Prices in the Next 2 Years? 1. Bubble Bursts 15% or
California Housing Market Update. Monthly Sales and Price Statistics January 2018
 California Housing Market Update Monthly Sales and Price Statistics January 2018 Sales Started with a Slight Decrease California, Jan. 2018 Sales: 388,800 Units, -2.9% YTD, -2.9% YTY 700,000 600,000 500,000
National Foreclosure Report
 National Foreclosure Report FEBRUARY 2016 2.6% In February, the foreclosure inventory was down 2.6 percent from January 2016, representing 52 months of consecutive year-overyear declines. Job creation
LUXURY MARKET REPORT. - January
 LUXURY MARKET REPORT - January 2018 - www.luxuryhomemarketing.com THIS IS YOUR LUXURY MARKET REPORT MAP OF LUXURY RESIDENTIAL MARKETS Welcome to the Luxury Market Report, your guide to luxury real estate
2018 Housing Market Forecast. Contra Costa Association of REALTORS October 18, 2017 Joel Singer Chief Executive Officer
 2018 Housing Market Forecast Contra Costa Association of REALTORS October 18, 2017 Joel Singer Chief Executive Officer Economic Update Stronger Economic Growth in Q2 As Consumer Spending Improved 3.1%
Business Creation Index
 Business Creation Index December 2016 National Association of REALTORS Research Department Introduction The new Business Creation Index (BCI) was created to monitor local economic conditions from the perspective
REALTOR.COM MARKET OUTLOOK
 REALTOR.COM MARKET OUTLOOK Realtor.com Economics October 2018 AGENDA Economic and housing data and insights from realtor.com National Forecast How well did we predict 2018? U.S. Economic Trends GDP, Jobs
Realty Executives Santa Clarita November 17, 2016 Leslie Appleton-Young Chief Economist & Vice President
 Realty Executives Santa Clarita November 17, 2016 Leslie Appleton-Young Chief Economist & Vice President lesliea@car.org Nobody had it priced in and the uncertainty Is absolutely enormous Every Wall Street
MARKET OUTLOOK FOR SAN MATEO
 MARKET OUTLOOK FOR SAN MATEO Jonathan Smoke Chief Economist August 2, 2016 NATIONAL TRENDS 2 JOB CREATION REBOUNDED IN JUNE 229,000 jobs created by month in 2015; 172,000 average this year Employment and
LUXURY MARKET REPORT. - May
 LUXURY MARKET REPORT - May 2018 - www.luxuryhomeing.com THIS IS YOUR LUXURY MARKET REPORT MAP OF LUXURY RESIDENTIAL MARKETS Welcome to the Luxury Report, your guide to luxury real estate market data and
Ventura County. Economic Profile. November 2008
 Ventura County Economic Profile November 2008 The copyright laws of the United States (Title 17 U.S. Code) forbid the unauthorized reproduction of this report by any means, including facsimile or computerized
National Foreclosure Report
 National Foreclosure Report OCTOBER 20 1.5% In October, the foreclosure inventory was down 1.5 percent from September 20, representing 48 months of consecutive year-overyear declines. Improved economic
TUCSON and SOUTHERN ARIZONA
 TUCSON and SOUTHERN ARIZONA End of Year Housing Report (52) 818-454 Stephen@TeamWoodall.com 217 End of Year Housing Report SALES & INVENTORY Housing market trends For the overall real estate market in
VERMONT S RENTAL HOUSING AFFORDABILITY GAP CONTINUES TO GROW The Average Vermont Renter Can t Afford a Modest 2-Bedroom Apartment
 vermont affordable housing coalition FOR IMMEDIATE RELEASE: June 13, 2016 CONTACT: Erhard Mahnke, 802.233.2902, erhardm@vtaffordablehousing.org Renée Sarao, 802.660.9484, renee.vahc@gmail.com VERMONT S
U.S. Economic and Institutional Apartment Market Overview and Outlook. January 7, 2015
 U.S. Economic and Institutional Apartment Market Overview and Outlook January 7, 2015 Emerging Economic Trends Inflation Adjusted Crude Oil Prices In Alignment with Long-Term Average Price per Barrel (Nov.
LUXURY MARKET REPORT. - March
 LUXURY MARKET REPORT - March 2018 - www.luxuryhomeing.com THIS IS YOUR LUXURY MARKET REPORT MAP OF LUXURY RESIDENTIAL MARKETS Welcome to the Luxury Report, your guide to luxury real estate market data
The U.S. Housing Confidence Index
 March 2018 www.pulsenomics.com 2014-2018 Pulsenomics LLC Pulsenomics, Housing Confidence Survey, and Housing Confidence Index are trademarks of Pulsenomics LLC. HCI Each Housing Confidence Index (HCI)
LUXURY MARKET REPORT. - March
 LUXURY MARKET REPORT - March 2018 - www.luxuryhomemarketing.com THIS IS YOUR LUXURY MARKET REPORT MAP OF LUXURY RESIDENTIAL MARKETS Welcome to the Luxury Market Report, your guide to luxury real estate
The Subject Section. Chapter 2. Property Address
 Chapter 2 The Subject Section The SUBJECT section of the URAR introduces the appraisal assignment by presenting important information about the subject property. The SUBJECT section provides spaces for
LUXURY MARKET REPORT. - November
 LUXURY MARKET REPORT - November 2018 - www.luxuryhomeing.com THIS IS YOUR LUXURY MARKET REPORT MAP OF LUXURY RESIDENTIAL MARKETS Welcome to the Luxury Report, your guide to luxury real estate market data
2018 Housing Market Outlook. California Desert Association of REALTORS October 19, 2017 Jordan G. Levine Economist
 2018 Housing Market Outlook California Desert Association of REALTORS October 19, 2017 Jordan G. Levine Economist jordanl@car.org Overview Post-Election Outlook Starting 2017 with a bang! Lots of uncertainty
Housing Affordability: Local and National Perspectives
 University of Pennsylvania ScholarlyCommons 2018 ADRF Network Research Conference Presentations ADRF Network Research Conference Presentations 11-2018 Housing Affordability: Local and National Perspectives
STATE OF THE MULTIFAMILY MARKET MACRO VIEW
 STATE OF THE MULTIFAMILY MARKET MACRO VIEW JEANETTE I. RICE, CRE AMERICAS HEAD OF MULTIFAMILY RESEARCH APRIL 19, 2018 Westchester/ Fairfield 2 JEANETTE I. RICE STATE OF U.S. MULTIFAMILY MARKET KEY INVESTMENT
2013 San Diego Economic Outlook. 29 th Annual Economic Roundtable Marney Cox Chief Economist San Diego Association of Governments January 25, 2013
 213 San Diego Economic Outlook 29 th Annual Economic Roundtable Marney Cox Chief Economist San Diego Association of Governments January 25, 213 US The Problem Slow Economic Growth Gross Domestic Product
CALIFORNIA FORECLOSURE ACTIVITY MIXED
 CALIFORNIA FORECLOSURE ACTIVITY MIXED Foreclosure delays may be behind current peak in foreclosure activity Discovery Bay, CA, September 16, 2008 ForeclosureRadar (www.foreclosureradar.com), the only website
THE OUTLOOK FOR HOUSING IN ILLINOIS
 THE OUTLOOK FOR HOUSING IN ILLINOIS Jonathan Smoke Chief Economist January 25, 2017 NATIONAL TRENDS 2 2000.01 2000.05 2000.09 2001.01 2001.05 2001.09 2002.01 2002.05 2002.09 2003.01 2003.05 2003.09 2004.01
NCSL TABLE REAL ESTATE TRANSFER TAXES
 NCSL TABLE REAL ESTATE TRANSFER TAXES State Tax Description Rate Alabama Deeds: $0.50/$500 0.10% Mortgages: $0.15/$100 0.15% Alaska None N/A Arizona Flat real estate transfer fee: Flat fee $2.00 Arkansas
The State of the Nation s Housing 2007: A Sneak Peek
 The State of the Nation s Housing 2007: A Sneak Peek Eric Belsky Remodeling Futures Conference April 10, 2007 Do Not Distribute Embargoed Until June 11, 2007 www.jchs.harvard.edu The Homebuilding Correction
National Housing Trends
 National Housing Trends 34% America s Choice of Best Long Term Investment 26% 17% 15% 6% Real Estate Stocks / Mutual Funds Gold Savings Accounts / CDs Bonds Gallup 2018 Housing Affordability 197 Index
Santa Clara County Real Estate Market Overview Dynamics
 Santa Clara County Real Estate Market Overview Dynamics Data from sources deemed reliable, but may contain errors and subject to revision. All numbers should be considered approximate. Jan-90 Sep-90 May-91
2017 Mid-Year Residential Real Estate Update Boise Regional REALTORS July 20, 2017 Mid-Year Residential Real Estate Update
 2017 Mid-Year Residential Real Estate Update 2017 Boise Regional REALTORS y 20, 2017 In 2015, Ada County surpassed $2 billion in total dollar volume sold. The first year since 2006. 2017 Boise Regional
INVESTORS PURCHASE RECORD NUMBER OF FORECLOSURES AT AUCTION
 INVESTORS PURCHASE RECORD NUMBER OF FORECLOSURES AT AUCTION April Foreclosure Notices Drop from March Record Levels Discovery Bay, CA, May 12, 2009 ForeclosureRadar (www.foreclosureradar.com), the only
LUXURY MARKET REPORT. - February
 LUXURY MARKET REPORT - February 2018 - www.luxuryhomeing.com THIS IS YOUR LUXURY MARKET REPORT MAP OF LUXURY RESIDENTIAL MARKETS Welcome to the Luxury Report, your guide to luxury real estate market data
I. The Affordability Problem in Boston II. What is Affordable? III.Housing Costs IV.Housing Production V. What Can Public Policy Do? I.
 October 23, 2017 I. The Affordability Problem in Boston II. What is Affordable? III.Housing Costs IV.Housing Production V. What Can Public Policy Do? I. What is it Already Doing? II. Case Studies 2 West
2013 CALIFORNIA HOUSING MARKET OUTLOOK. Santa Barbara AOR February 6, Leslie Appleton-Young, C.A.R. Chief Economist
 2013 CALIFORNIA HOUSING MARKET OUTLOOK Santa Barbara AOR February 6, 2013. Leslie Appleton-Young, C.A.R. Chief Economist 2013 New Member Benefit: 12 FREE Hours Online CE Courses C.A.R. s newest member
No Survey Required w/ Survey. Affidavit. Affidavit. Affidavit
 STATE Purchase Residential Refinance Residential Additional Information Survey Required: Survey Required: Alabama AL No survey required w/ Survey w/survey Alaska AK Yes Survey Required Survey required
MAMA Risk Summary Data through 2011 Q3
 MAMA Risk Summary Data through 2011 Q3 Table of Contents Report Contents... 2 Summary... 3 MAMA Risk Summary Indicators for Largest 50 Metro Areas... 4 Home Prices Risk Indicator Summary Map... 6 Employment
Guide for Estimating Affordability and Cap Exclusions for 2018 Deliveries
 Guide for Estimating Affordability and Exclusions for 2018 Deliveries This is a reference guide for how the percentage excluded from the scorecard cap for an individual deal is calculated. The Multifamily
Market Trends and Outlook
 Residential Remodeling Market Trends and Outlook Kermit Baker Remodeling Futures Conference April 3, 2012 Remodeling Market Overview 1. Home improvement spending totaled an estimated $290 billion last
(904) (904)
 (904)") Press Release For more information: Media contact: Investor contact: Michelle Kersch Nancy Murphy (904) 854-5043 (904) 854-8640 michelle.kersch@lpsvcs.com nancy.murphy@lpsvcs.com LPS' April HPI Report:
Press Release For more information: Media contact: Investor contact: Michelle Kersch Nancy Murphy (904) 854-5043 (904) 854-8640 michelle.kersch@lpsvcs.com nancy.murphy@lpsvcs.com LPS' April HPI Report:
Housing Affordability in California
 Housing Affordability in California Households with a High Housing Cost Burden: 2013 Definition: Estimated percentage of households that spend 30% or more of household income on housing costs. The U.S.
MULTIFAMILY TAX SUBSIDY PROJECT INCOME LIMITS
 MULTIFAMILY TAX SUBSIDY PROJECT INCOME LIMITS This chart is provided as a guide only for the following programs: Low Income Housing Tax Credit (LIHTC) Hula Mae Multi-Family Bonds (HMMF) Rental Housing
Housing Price Forecasts. Illinois and Chicago PMSA, December 2015
 Housing Price Forecasts Illinois and Chicago PMSA, December 2015 Presented To Illinois Association of Realtors From R E A L Regional Economics Applications Laboratory, Institute of Government and Public
Black Knight Home Price Index Report: December Transactions U.S. Home Prices Down 0.1 Percent for the Month; Up 4.5 Percent Year-Over-Year
 Press Release For more information: Media contact: Michelle Kersch 904.854.5043 michelle.kersch@bkfs.com Black Knight Home Price Index Report: December Transactions U.S. Home Prices Down 0.1 Percent for
Residential Real Estate, Demographics, and the Economy
 Residential Real Estate, Demographics, and the Economy Presented to: Regional & Community Bankers Conference Yolanda K. Kodrzycki Senior Economist and Policy Advisor Federal Reserve Bank of Boston October
Metropolitan Area Statistics
 Metropolitan Area Statistics Apartment Completions 1Q 2011 1Q 2012 % Chg Atlanta - - n/a Boston 133 39-71% Chicago - 20 n/a Cleveland - - n/a Columbus - 272 n/a Dallas-Ft. Worth 604 1,059 75% Denver 328
Western Economic Developments
 IN THIS ISSUE F E D E R A L R E S E R V E B A N K O F S A N F R A N C I S C O Western Economic Developments Office market slumps, housing demand remains strong in District Figure, panel B: Commercial office
Black Knight Home Price Index Report: June Transactions U.S. Home Prices Up 0.8 Percent for the Month; Up 5.5 Percent Year-Over-Year
 For more information: Press Release Media contact: Michelle Kersch (904) 854-5043 michelle.kersch@bkfs.com Black Knight Home Price Index Report: June Transactions U.S. Home Prices Up 0.8 Percent for the
Black Knight Home Price Index Report: December Transactions U.S. Home Prices Up 0.1 Percent for the Month; Up 8.4 Percent Year-Over-Year
 Press Release For more information: Michelle Kersch Black Knight Financial Services 904.854.5043 michelle.kersch@bkfs.com Black Knight Home Price Index Report: December Transactions U.S. Home Prices Up
2013 Arizona Housing Market Mid-Year Report
 2013 Arizona Housing Market Mid-Year Report This mid-year market report outlines the latest trends in Arizona real estate. The housing market hit bottom in mid to late 2011, and has been in recovery mode
U.S. DEPARTMENT OF HUD 04/11/2017 STATE: CALIFORNIA ADJUSTED HOME INCOME LIMITS
 Bakersfield, CA MSA Chico, CA MSA El Centro, CA MSA Fresno, CA MSA Hanford-Corcoran, CA MSA 30% LIMITS 13200 15050 16950 18800 20350 21850 23350 24850 VERY LOW INCOME 21950 25050 28200 31300 33850 36350
Housing, Construction, and Remodeling Update. Toby Morrison Director of Insights Metrostudy October 12, 2013
 Housing, Construction, and Remodeling Update Toby Morrison Director of Insights Metrostudy October 12, 2013 New Home Sales (Units) "Pro-Worthy" R&R Projects New Homes Sales and Remodeling Are Firmly on
Goomzee Corporation Fall MLS Platforms. America s MLS Platform Vendors & Market Distribution. Goomzee Research
 Fall 2009 MLS Platforms America s MLS Platform Vendors & Market Distribution Goomzee s MLS Vendor Market Research Over 500 MLS organizations were polled in this research report. This was initially an internal
2018 Real Estate Forecast Breakfast. Real Estate Market Update
 2018 Real Estate Forecast Breakfast Central Oregon Association of REALTORS Real Estate Market Update Paul C. Bishop, PhD, CBE Vice President, Research NATIONAL ASSOCIATION OF REALTORS February 22, 2018
National Housing Trends
 National Housing Trends 34% America s Choice of Best Long Term Investment 26% 17% 15% 6% Real Estate Stocks / Mutual Funds Gold Savings Accounts / CDs Bonds Gallup 2018 Total Existing Home Sales in thousands
(904) (904)
 (904)") Press Release For more information: Media contact: Investor contact: Michelle Kersch Nancy Murphy (904) 854-5043 (904) 854-8640 michelle.kersch@lpsvcs.com nancy.murphy@lpsvcs.com LPS Home Price Index Report:
Press Release For more information: Media contact: Investor contact: Michelle Kersch Nancy Murphy (904) 854-5043 (904) 854-8640 michelle.kersch@lpsvcs.com nancy.murphy@lpsvcs.com LPS Home Price Index Report:
San Francisco Bay Area to Santa Clara & San Benito Counties Housing and Economic Outlook
 San Francisco Bay Area to 019 Santa Clara & San Benito Counties Housing and Economic Outlook Bay Area Economic Forecast Summary Presented by Pacific Union International, Inc. and John Burns Real Estate
Increasing Foreclosures Could Hurt Demand for Homes, Slowing Housing Recovery
 Release Date: April 22, 2010 February 2010 Quinn W. Eddins, Director of Research New Radar Logic data packages are available at /productsservices_analytics.html Increasing Foreclosures Could Hurt Demand
Black Knight Home Price Index Report: October Transactions U.S. Home Prices Up 0.1 for the Month; Up 4.5 Percent Year-Over-Year
 Press Release For more information: Media contact: Michelle Kersch 904.854.5043 michelle.kersch@bkfs.com Black Knight Home Price Index Report: October Transactions U.S. Home Prices Up 0.1 for the Month;
CBRE INDUSTRIAL & LOGISTICS SPECIAL PROPERTIES GROUP
 CBRE INDUSTRIAL & LOGISTICS SPECIAL PROPERTIES GROUP 48+ REAL ESTATE EXPERTS 36 OFFICES U.S. & CANADA 27 SUCCESSFUL YEARS THE SPECIAL PROPERTIES GROUP provides specialized acquisition, disposition and
Metropolitan Area Statistics (1Q 2013)
") Metropolitan Area Statistics (1Q 2013) Apartment Completions 1Q 2012 1Q 2013 % Chg Atlanta 487 1,460 200% Boston 360 373 4% Chicago 611 92-85% Cleveland 7 54 671 Columbus - 459 n/a Dallas-Ft. Worth 1,327
Metropolitan Area Statistics (1Q 2013) Apartment Completions 1Q 2012 1Q 2013 % Chg Atlanta 487 1,460 200% Boston 360 373 4% Chicago 611 92-85% Cleveland 7 54 671 Columbus - 459 n/a Dallas-Ft. Worth 1,327
HB , Appendix 5 PAGE 29 GUARANTEED HOUSING PROGRAM INCOME LIMITS
 HB - 1-3555, Appendix 5 PAGE 29 Bakersfield, CA MSA Chico, CA MSA El Centro, CA MSA Fresno, CA MSA VERY LOW INCOME 31300 31300 31300 31300 41300 41300 41300 41300 LOW INCOME 50100 50100 50100 50100 66150
California Economic Policy: Lawns and Water Demand in California
 California Economic Policy: Lawns and Water Demand in California Data Box and Appendix Ellen Hanak Matt Davis July 2006 Data Box: Using County Assessor Data to Measure Trends in Single Family Lot Sizes
NATIONAL ASSOCIATION of REALTORS RESEARCH DIVISION. Prepared for Florida REALTORS
 NATIONAL ASSOCIATION of REALTORS RESEARCH DIVISION Prepared for Florida REALTORS NATIONAL ASSOCIATION OF REALTORS RESEARCH DIVISION Page 1 Page 3 Page 4 Page 6 Page 7 Page 8 Page 9 Page 10 Page 11 Page
Real estate prices bottom, but remain stagnant
 Real estate prices bottom, but remain stagnant United States Index 2000Q4 = 100 200 180 Commercial RE prices 160 140 House prices 120 100 2001 2002 2003 2004 2005 Sources: Standard & Poor's and Fiserv,
ECONOMIC CURRENTS. Vol. 3, Issue 1. THE SOUTH FLORIDA ECONOMIC QUARTERLY Introduction
 ECONOMIC CURRENTS THE SOUTH FLORIDA ECONOMIC QUARTERLY Introduction Economic Currents provides an overview of the South Florida regional economy. The report contains current employment, economic and real
Economic Outlook in Uncertain Times
 Economic Outlook in Uncertain Times Lawrence Yun, Ph.D. Chief Economist NATIONAL ASSOCIATION OF REALTORS Presentation to Silicon Valley Association of REALTORS October 11, 2010 Federal Reserve FOMC Ben
Housing Price Forecasts. Illinois and Chicago PMSA, October 2014
 Housing Price Forecasts Illinois and Chicago PMSA, October 2014 Presented To Illinois Association of Realtors From R E A L Regional Economics Applications Laboratory, Institute of Government and Public
(904) (904)
 (904)") Press Release For more information: Media contact: Investor contact: Michelle Kersch Nancy Murphy (904) 854-5043 (904) 854-8640 michelle.kersch@lpsvcs.com nancy.murphy@lpsvcs.com LPS Home Price Index Report:
Press Release For more information: Media contact: Investor contact: Michelle Kersch Nancy Murphy (904) 854-5043 (904) 854-8640 michelle.kersch@lpsvcs.com nancy.murphy@lpsvcs.com LPS Home Price Index Report:
Housing Price Forecasts. Illinois and Chicago PMSA, March 2019
 Housing Price Forecasts Illinois and Chicago PMSA, March 2019 Presented To Illinois Realtors From R E A L Regional Economics Applications Laboratory, Institute of Government and Public Affairs University
Gardner Business Review May 2018 Applied economic analysis by the David Eccles School of Business
 Gardner Business Review May 2018 Applied economic analysis by the David Eccles School of Business Since 2010, Utah has led the country in employment and demographic growth. This growth has produced exceptionally
SPECIAL REPORT. Single-Family Rent Index: H Review
 SPECIAL REPORT Rent Index: H1 2018 Review FEBRUARY 2018 1 National Overview Single-family rentals make up one-half of all residential rentals but are an overlooked segment of the housing market. Much like
Housing Price Forecasts. Illinois and Chicago PMSA, January 2018
 Housing Price Forecasts Illinois and Chicago PMSA, January 2018 Presented To Illinois Realtors From R E A L Regional Economics Applications Laboratory, Institute of Government and Public Affairs University
SPECIAL PROPERTIES GROUP INDUSTRIAL SERVICES
 SPECIAL PROPERTIES GROUP INDUSTRIAL SERVICES CBRE LIMITED INDUSTRIAL SERVICES WWW.CBRE.COM/SPG SPECIAL PROPERTIES GROUP The Special Properties Group provides specialized acquisition, disposition and consulting