Harry Matthew Fuller. Thesis submitted to the Faculty of the. Virginia Polytechnic Institute and State University
|
|
|
- Henry Mosley
- 5 years ago
- Views:
Transcription
1 Farmland Conservation Easement Valuation Using an Attribute-based Choice Survey: Comparing Preferences within the United States, Georgia, Ohio and Maine Harry Matthew Fuller Thesis submitted to the Faculty of the Virginia Polytechnic Institute and State University in partial fulfillment of the requirements for the degree of Master of Science in Agricultural and Applied Economics Kevin J. Boyle, Co-Chair Wen You, Co-Chair Jason H. Grant May 2, 2011 Blacksburg, Virginia Keywords: Nonmarket Valuation, Willingness-to-pay, Farmland Conservation Easement, Choice Model
2 Farmland Conservation Easement Valuation Using an Attribute-based Choice Survey: Comparing Preferences within the United States, Georgia, Ohio and Maine Harry Matthew Fuller Abstract Farmland preservation has long been viewed by the public as a worthwhile endeavor. A public program can be set up to bring willing buyers and sellers together to facilitate the transfer of development rights. The farmer is paid for the opportunity cost of forfeiting the development rights to the land, while the general public is taxed the amount of their total benefit created by the existence of farmland. Through the data from an attribute-based choice survey (conducted in four geographic areas) the willingness-to-pay (WTP) of the public to preserve farmland that exhibited certain attributes, was estimated. The attributes included different use (grain, hay, vegetable, pasture, forest), location (near urban), quality (prime), size (varied acreage relative to geographic area sampled), and cost (varied costs from $3 to $50) components. Selection bias was tested for in order to confirm that the respondents are an unbiased representation of the geographic areas sampled. If selection bias was present, it would need to be corrected for in order to aggregate the survey results to the population of the geographic areas. Selection bias was tested for using a bivariate probit model with sample selection, a variation on the Heckman correction model. Selection bias was not significant, so the choice model was estimated using a probit model. The response was dependent on the use, location, quality, size, and cost components. Based on the parameter estimates, the geographic areas were compared using the scale parameter. A variation of the
3 Swait and Louviere method was used to find the optimal scale parameter ratios between pair-wise geographic areas. Heterogeneity of the parameter estimates as well as heterogeneity of variances was tested. Prime farmland was significant and positive in all geographic areas, suggesting it should be included in the national ranking criteria for a farmland preservation program. WTP by household for each attribute was reported. Additionally, the WTP was aggregated to provide a hypothetical range of the monetary benefit farmland provides for the residents of each geographic area. iii
4 Acknowledgements I would like to thank the members of my committee: Kevin J. Boyle, Wen You, and Jason H. Grant. Their patience, encouragement, insights, and availability allowed for the completion of this thesis. Without their support, I would not have been able to gather, compile, and internalize all of the knowledge necessary to graduate on time. I (Egg) would like give a thank you to Jason Grant, Randy Flinchum (Ham), and Jaren Pope whose competiveness on the golf course and squash court allowed for me to stay sane, through an athletic outlet, between long bouts of STATA code writing. I would also like to thank Bibek Singh, whose friendship extended from Hutcheson Hall to California and back. Our National Park trip will forever be one of my fondest memories. I would also like to thank the AAEC GSA. Through my default nomination as Social Chair, I was able to share many great memories with all of my fellow classmates. Finally, I would like to thank my fiancee and soon to be wife, Kristin. We endured the toughest years of our lives, having to get through over two years apart. And now after all of our education is complete, we can be together. I look forward to all of the travel and fun we will share. iv
5 Table of Contents CHAPTER ONE: Introduction Introduction Problem Statement Objectives Organization of Thesis... 8 CHAPTER TWO: Literature Review Conceptual Framework Previous Empirical Studies Contribution of this Research CHAPTER THREE: Models and the Survey Choice Theory and the Random Utility Model Probit Model Bivariate Probit Model with Sample Selection Role of Scale Parameter Method for Estimating Likelihood Ratios for Pair-wise Comparisons Using Scale Parameter Method for Predicting WTP using Implicit Prices Estimating Consumer Surplus Survey Design CHAPTER FOUR: Data and Empirical Results Descriptive Statistics Probit Estimation with Sample Selection Results Probit Estimation Results Optimum Scale Parameter and Likelihood Ratio Test Results WTP Predictions Current Program Comparisons CHAPTER FIVE: Conclusions and Recommendations Issues with Procedures Research Extensions v
6 5.3 Conclusions References Appendix A: Public Opinion Survey Appendix B: Background Information Booklet Appendix C: Graphs of Optimum Scale Parameter Ratios and Log-likelihood Values for Pair-wise Geographic Area Comparisons vi
7 List of Figures Figure Consumer Surplus Figure Aggregate Supply and Demand Shifters vii
8 List of Tables Table Measures of Hicksian Consumer Surplus Table Hypotheses and Log-Likelihood Ratio Tests Table Example Attribute-Based Choice Question Table Attributes and Attribute Levels Table Variable Definitions Table Percentage of Choosing Program A, Program B, and Status Quo Table Demographic Characteristics by Geographic Area Table ANOVA of Demographic Characteristics by Geographic Area Table Estimation of Choice Equation for Bivariate Probit with Sample Selection Table Estimation of Selection Equation for Bivariate Probit with Sample Selection Table Summary Statistics for Bivariate Probit with Sample Selection Table Selection Bias Test from Bivariate Probit with Sample Selection Estimation Table Probit Estimation for Geographic Areas Table Summary Statistics for Probit Estimation for Geographic Areas Table Geographic area Pair-wise Comparison Using Scale Parameter Ratios Table Marginal WTP by Attribute per Household Table Program with Highest WTP by Geographic Area Lower Limit and Upper Limit viii
9 CHAPTER ONE: Introduction 1.1 Introduction Urban sprawl, protection of food supply, and preservation of heritage are just a few of the reasons that the public has concerns about farmland being converted for residential and commercial uses (Fursueth 1987; Kreiger 1999; Kline and Wichelns 1998). Landowners may find farmland conversion is the best financial route to take, but with a limited amount of farmland, a tragedy of the commons 1 can quickly transpire where many of the public s concerns become reality. Reacting to the public, Congress passed the Farmland Protection Policy Act in Additional programs passed, and by 2002, the USDA put the Farm and Ranch Land Protection Program (FRPP) in place. FRPP aimed to keep the most productive and valuable farmland for agricultural use, into perpetuity. This was accomplished through the purchasing of conservation easements, for which FRPP, in part, provided funds. From the perspective of a landowner, owning land is nothing more than a collection of rights. These rights can be sold off as a whole, i.e. selling the land completely, or the rights can be sold off individually, i.e. an outside party purchasing an easement to the land. An easement compensates the landowner in exchange for a specific right to the land. The landowner is compensated for the opportunity cost of not being able to convert the land to potentially more lucrative uses of the land. When a farmland conservation easement is purchased, the use of the land is limited to agricultural uses. Therefore, the land cannot be converted 2 for residential or commercial purposes, but the specific agricultural use of the land 1 Tragedy of the commons is when rational individuals acting in their individual best interest combine to deplete a shared resource, even when it is clear that their combined actions are not sustainable. 2 The length of time the conservation easement is in place is up to program, but it is typically assumed that the conservation easement will retire the development rights into perpetuity. 1
10 is still up to the landowner. This may include allowing livestock to graze, growing vegetables, or even taking the land out of production and retiring it to forest. To facilitate the transfer of funds from those who gain welfare from the preservation of farmland to the landowners, a conservation easement program can be set up. The issue with farmland preservation is that a market is not immediately available to the individual consumer. Aggregation of funds from individual consumers of farmland though a government run program which uses tax money to purchase the development rights to the land is the easiest way to mandate participation in such a program. This way, the necessary funds are made available to preserve farmland so the tragedy of the commons of the overdevelopment of land does not occur. The main objective of such a program is to collect funds from the public in the form of taxes and translate the funds into purchased conservation easements to farmland such that the public s welfare in enhanced. Farmland preservation generates many non-market benefits for the public (Kline and Wichelns 1996). The public gains welfare, or utility, just by the existence of farmland. It could be through the enjoyment of a scenic vista, from the natural protection of nutrient run-off that certain agricultural uses generate, etc. To guarantee the most efficient use of tax-payer funds, policy makers should determine the attributes that farmland possesses that are most valued. Establishing what tax-payers are willing to pay for the preservation of farmland that exhibits these certain attributes would allow for the benefits from a public perspective to be taken from a utility metric to money metric. This would in turn allow for policy makers to establish a target for a conservation easement program. Several studies exist that set out to value farmland from a non-market perspective have been conducted using contingent valuation. The limitation to contingent valuation is that it aims to value non-market goods in manner that ignores the willingness-to-pay (WTP) by attribute, and instead concentrates on the 2
11 aggregated WTP for a given farmland scenario. From a policy perspective, it is difficult to effectively differentiate aggregated value into transferrable payments when considering heterogeneous goods. To compare heterogeneous goods more effectively, the attributes that give the goods their value must be determined. If the non-market value that is provided by farmland can be effectively dissected into a set of measurable attributes, then conducting a survey and analyzing the choices made by the respondents can put relevant information into the hands of policy makers. This information would allow them to make more informed decisions about the WTP of the general public for conservation easements to farmland. To differentiate between heterogeneous farms, while establishing a WTP, attributes such as land use, land location, land quality, and land size, as well as price can be included. The inclusion of price allows a WTP to be estimated for these attributes, which can eventually be used as part of a cost/benefit analysis. Estimation of Hicksian surplus for heterogeneous goods has also been estimated with the use of attribute-based choice studies where respondents are asked to choose their preference from alternative scenarios (Holmes and Adamowicz 2003). Using a stated-preference study where marginal values can be estimated for measurable attributes allows policy makers to tailor policies so that the appropriate protocol is in place to bring willing buyers and sellers together at their equilibrium. Though many studies have been done on farmland valuation, no studies have compared geographic areas. All previous studies have concentrated on one specific geographic area. This thesis aims to continue in the vein of using attribute-based choice questions in a stated-preference setting while expanding into the comparison of different geographic areas throughout the country. Comparing how different geographic areas value farmland will provide a deeper understanding for policy makers to take into account while forming decision rules for 3
12 conservation easement programs, especially those that are enacted over a broader geographic region. 1.2 Problem Statement As America the Beautiful points out, America has a vastly diverse and beautiful landscape from sea to shining sea. Higher population has forced urban sprawl which in turn has lead to a tragedy of the commons to arise. Suburbanization has infringed upon open and green space. The changing dynamic of land usage has not gone unnoticed. Preserving the remaining open and green space has become an issue on local and state ballots across the United States. All 50 states have programs in place to help acquire or receive scenic land through donation (American Farmland Trust 1997; Daniels 1999; Wiebe et al. 1996). Many of the programs in place target open and green space in general. Half of the almost two billion acres of private land in the United States is used for agriculture (range, crop, and pasture land) (Vesterby et al. 1994). This means that farmland is a large part of America s open and green space. According to the American Farmland Trust, to date, about 1,100,000 farmland acres nationwide have been put under easements at an approximate cost of $2.3 billion. Congressional Acts have been passed for decades that allocate funds or issue orders on how agricultural land should be treated. In 1981, the Farmland Protection Policy Act established that federal agencies were required to review the impact of their programs to minimiz[e] the extent to which federal programs contribute to unnecessary and irreversible conversion of farmland to nonagricultural uses (U.S. Congress 1981). In 1990, a Farm Bill was passed in which the program Farms for the Future was launched to purchase conservation easements to farmland with subsidized loans from state and local governments (USDA 1990). In 1996, the Federal Agricultural Improvement Act (FAIR) was 4
13 passed to supersede Farms for the Future. FAIR allocated up to $35 million in matching funds for state and local farmland protection programs (USDA 1996). In 2002, FAIR was amended into the Farm Security and Rural Investment Act. This new act established the Farm and Ranch Land Protection Program (FRPP) (USDA 2002). FRPP opened up the funds for the purchase of conservation easements to farmland to Native American Indian tribes and qualifying NGOs on top of state and local governments. Currently, the 2008 Farm Bill has established the Farmland Protection Program (FPP). There were many adjustments made to the FRPP to create the current FPP. The FPP provides funds to eligible entities (State, tribal, or local governments and nonprofit organizations) to help purchase easements that would preclude nonfarm development of productive farmland (USDA 2008). Many adjustments were made to the FRPP to create the 2008 FPP. In 2002, the FRPP allocated $499 million for fiscal years The FPP increased the budget to $743 million for fiscal years Both budgets were/are subject to a provision that enforces regional equity. Regional equity ensures that funds or allocated to different regions more equally. Regional equity also sets a minimum allocation threshold for regions which is higher than previous allocation levels before the regional equity provision was implemented. The FRPP focused on protecting topsoil, requiring eligible farms to have at least 50% prime, unique, or locally important soil. The FPP shifted focus to protecting agricultural use and conservation values, now allowing heavily forested land to be eligible for its ability to buffer development. The FRPP and FPP cap the Federal share of the easement s purchase cost at 50% of fair market value (FMV) for the land. The landowner could donate up to 25% of the FMV under the FRPP. The FPP no longer caps the donation of the landowner. 5
14 Both the FRPP and FPP cannot grant priority to farmland to which it is less expensive to purchase an easement. The FRPP and FPP require a conservation plan for land that is highly erodible. The 2008 Farm Bill also included the Grassland Reserve Program (GRP). Both the FPP and GRP fall under the heading of Agricultural Land Preservation Programs. The GRP, specifically, assists owners, through long-term rental agreements or easements, in restoring grassland and conserving virgin grassland while maintaining areas for livestock grazing and hay production (USDA 2008). While agricultural policies that preserve farmland have the direct impact of stopping open land from being converted to other uses that do not provide the same set of amenities, agricultural policies can also affect the quality of farmland as open and green space. The Conservation Reserve Program takes land out of agricultural production for ten years while maintaining the land as open or green space that is planted with grasses or trees. This differs from normal crop rotation because the time elapsed allows for highly erodible soils to erode while creating more grassland habitat for wildlife, as opposed to just allowing for nutrient replenishment in the soil. The motivation behind the public willingness-to-pay for the preservation of farmland can be attributed to many factors. According to Bromley and Hodge (1990), the amenities that farmland produces are a classic example of a joint product that is a public good. Farmland allows for non-rival and non-excludable views that provide public value. While farmers receive payment for the goods and services that are provided through the running of their farms, there is no vehicle in place for farmers to receive compensation for preserving the beautiful scenery that the public enjoys. To attempt to resolve this market inefficiency, the public has 6
15 become motivated, through local and state initiatives, to protect the farmland amenities that they appreciate. 1.3 Objectives The goal this thesis is identify if the public is willing to pay for farmland preservation. If so, what benefits would an easement to limit the development rights of the farmland provide to the public? When estimating the benefits, do specific farmland characteristics provide more or less in terms of value? Do the benefits differ across geographic areas? The objectives of this thesis are as follows: A) Estimate if selected farmland attributes affect the public s support for farmland conservation easement programs B) Test if the attributes effects are statistically similar in the United States, Georgia, Ohio, and Maine C) Compute the WTP of farmland attributes and compare them to current conservation easement programs for each geographic area Objective A was implemented by estimating a choice equation using a probit model. Additionally, selection bias was tested for by comparing the respondents characteristics to that of their geographic areas. This was done by using a selection equation in combination with the choice equation. Selection bias was estimated using a bivariate probit model with sample selection. Objective B test whether the true underlying preference parameters are statistically similar, or if there is heterogeneity in preferences among geographic areas. A Swait-Louviere approach was used to test for this. Identifying if 7
16 preferences are heterogeneous will provide evidence as to whether or not a one size fits all policy is appropriate. Objective C takes the parameter estimates from the choice equation estimation and marginalizes them to a household level. After estimating implicit prices for each farmland attribute, the highest WTP for use, location, quality, and size is determined and aggregated. A lower and upper limit for household benefits is provided. 1.4 Organization of Thesis Chapter Two will focus on the literature review. The literature review will delve deeper into the conceptual framework of the thesis. Previous empirical research that has focused on similar problems will then be examined. Next, conservation easement programs, both past and current will be outlined. Finally, the contribution of this research will be discussed. Chapter Three then discusses the models used for the estimation ans the survey used to collect the data. First, choice theory and the random utility model are outlined. Then the probit model, used for the choice and selection equations, is detailed. Then the bivariate probit model, used for the detection of selection bias, is summarized. Then the scale parameter is introduced, followed by how it was used in the analysis to compare preferences from one geographic area to the next. Then comes the process used to estimate the consumer surplus. The survey design is the discussed in detail. Chapter Four takes all of the previous background and puts it to work with empirical results. First, the data are discussed through an overview of the descriptive statistics. Then, the results will follow the objectives, respectively. First, the possibility of selection bias of the respondents will be investigated using the Heckman correction. Next, if selection bias is not detected, the choice models 8
17 of each geographic area will be estimated using the probit model. Once all of the models of interest have been estimated, the optimum scale parameter ratios of each pair-wise combination of geographic areas will be estimated. This will provide the basis for comparison of the different geographic area estimations. The marginal WTP estimates for each farmland attribute will be reported. Using each nation s current rubric for identifying the best candidate for farmland preservation, the WTP will be compared to the nation s methodology to see if public opinion is in line with current policy. Chapter Five takes a step back from all of the analysis and concentrates on conclusions and recommendations that could be used as part of a cost/benefit analysis. First, issues with the procedures and the data will be discussed. Possible extensions of the study will then be mentioned. Finally, the thesis will conclude with parting comments and considerations. 9
18 CHAPTER TWO: Literature Review 2.1 Conceptual Framework Neoclassical economics establishes a framework based on how scarce goods are traded off. Through marginal decision making, a relative valuation becomes evident. The monetary value of goods and services is determined when sacrifices are made between different options, relative to a budget constraint. Value is then reflected by consumers based on their willingness to trade dollars for goods and services. A market that is both competitive and well functioning determines both price and quantity of a good or service based on the interaction between supply and demand. Therefore, value is directly revealed in the market. Not all markets function well enough to reveal economic value so simply. Value can become imprecise when competition is interfered with or changes are not marginal. If a good is non-rival or non-exclusive, the market for that good fails to reveal its true economic value (Randall 1987). The issue with not having a defined market is that it is difficult to bring together a large number of buyers while correctly identifying the best seller of farmland development rights that meets the buyers aggregated preferences without having high transaction costs. Since farmland is a classic example of a non-rival and non-exclusive good, the traditional market framework cannot accurately value it. The discrepancy in value is because nonmarket goods may provide social value that is not reflected through supply and demand alone. Valuing nonmarket goods in the same way as market goods are valued is done through consumer surplus. Consumer surplus is the social value to be estimated. This is important in the framework of valuing conservation easements because it is the property s development rights themselves that are being valued. Consumer surplus is the total economic worth of a good or service to the public. The total economic benefit 10
19 each individual in the public gains is monetized for a given level of that good or service. Freeman (1979a) describes consumer surplus as the mone[tary] measure of the gains and losses in utility and welfare associated with changes in the individual s economic circumstances. In the graphical context, Figure shows the area under that demand curve as the aggregate consumer surplus, or WTP, of all individuals in society, for a publically provided good with a fixed supply. While individual WTP can be measured as Hicksian consumer surplus, specific attributes of farmland can cause the WTP of the public to change. These changes are caused by demand and supply shifters, which change the area that account for consumer surplus. Figure shows which attributes (of those included in the survey) are demand shifters, and which attributes are supply shifters. In terms of the attributes measured in the survey used for this thesis, the different use, location, and quality choices account for demand shifts. The proposed size of the program is the lone supply shifter, as program size is a set limit. 11
20 Figure Consumer Surplus 12
21 Figure Aggregate Supply and Demand Shifters 13
22 In a market that has a supply curve that is not infinitely sloped, i.e. a varying quantity, there exists a and a at the equilibrium. Consumer surplus is the area below the demand curve and above the horizontal line at. Producer surplus is the area above the supply curve and below the horizontal line at. Because there is a fixed quantity, there is no producer surplus in the market. This is why the entire area under the demand curve is considered consumer surplus. Consumer surplus can be measured in five ways. The first way is Marshallian consumer surplus, which is defined as the area under a Marshallian demand curve. A Marshallian demand curve is a function of both prices and income, therefore an income and substitution effect can cause a shift. Marshallian demand does not assume a constant level of utility, which is due to the income effect. Since there is no set utility level, the Marshallian measure is only an approximate measure of welfare change (Willig 1976; Randall and Stoll 1980). The four measures of Hicksian consumer surplus are: compensating variation, equivalent variation, compensating surplus, and equivalent surplus. There are two dichotomies to consider, when paired, that give the four measures. Variation and surplus differ in whether or not, after a price or quantity change, the individual is allowed to make optimal readjustments to their consumption bundle. Variation allows for readjustment, while surplus forces the original consumption bundle to be kept, even after the price or quantity change in the market. Compensating and equivalent vary by the level of welfare they refer to. The main difference is whether or not the individual has the right to the said welfare level. Compensating says that if there is a price or quantity change, the individual has the right to the original welfare level. Equivalent says that the individual has the right to the new welfare level only after the price or quantity change. Put into the context of a conservation easement program, the landowner has the right to the land; therefore they have to be compensated for the change in 14
23 welfare associated with losing the right to develop their land as they please. After the transfer of funds to the farmer, the public now has the development right, and in terms of welfare is equivalent to where they were before the program. To make a Pareto 3 improvement, compensating must be used. In terms of a benefit-cost analysis, the Pareto improvement is the appropriate welfare measure. Therefore, in terms of the public having to pay taxes to fund the conservation easement program and pay for the surplus they receive from farmland, the appropriate Hicksian measure of consumer surplus is equivalent variation. While from the landowners perspectives, compensating variation is the appropriate measure. Holding utility constant, and allowing for only the substitution effect to change welfare, is the theoretically correct Hicksian demand function. Hicksian consumer surplus can be measured in four different ways. Table breaks down the dichotomy of the four measures. 3 Pareto improvement is when at least one person is made better off while no one is made worse off. 15
24 Table Measures of Hicksian Consumer Surplus Can make reoptimizing adjustments Cannot make reoptimizing adjustments Have right to initial welfare level Compensating Variation Compensating Surplus Does not have right to initial welfare level Equivalent Variation Equivalent Surplus 2.2 Previous Empirical Studies 4 Early research that attempted to estimate the value of farmland amenities employed contingent valuation 5 methodology. In 1984, Halstead used western Massachusetts as a setting for valuing agricultural land preservation. The following year (1985) Bergstrom et al. used Greenville County, South Carolina to concentrate on the estimated value of amenity benefits of prime farmland. Then, in 1986, Beasley et al. considered the Matanuska-Susitna valleys of south central 4 For a more comprehensive overview of stated preference literature on conservation easement valuation, please see Bergstrom and Ready (2009). 5 Contingent valuation (CV) uses a similar methodology as choice theory. Both use a household utility maximization approach where data is collected via a survey. In terms of farmland, choice theory varies attributes of the farmland that is being valued, and asks the respondent to choose between two scenarios. CV does not concentrate on marginal prices of attributes like choice theory. CV aims to find the total value of a given scenario. For example, a single farmland preservation program would be laid out, with price varying among surveys, and the respondent would be asked to say if they would support the program or not. (Bell et al. 2006) 16
25 Alaska while estimating the WTP of residents to prevent the development of agricultural land from being transformed for residential and commercial use. Farmland preservation in three counties in New Brunswick, Canada was valued by Bowker and Didychuk in Specifically, the WTP for ranchland protection in the Yampa River Valley of Colorado was estimated by Rosenberger and Walsh in While in 1999, Kreiger used three counties in Chicago to estimate WTP for the protection of farmland. The overarching themes from these studies center on the characteristics of the respondents and the amount of land that would be preserved in the proposed programs of each study. Duke et al. (2007) performed a choice survey of six Sussex County communities in The results of the analysis suggest that the value that residents place on farmland preservation can vary greatly. The variance is due to the kind of land considered for preservation, the proposed methods that were to be used to prevent development, and likely risk that unpreserved parcels would be developed. Cho et al. (2005) estimated the WTP of rural communities in the Blue Ridge Mountains of Macon County, NC. At the time of the study, conservation easement programs were not in place. They did find a positive WTP per household that would decrease the rate of land conversion by 14-46% when compared to period. Lynch and Lovell (2003) analyzed the likelihood of a farmer to volunteer his/her land for conservation. They analyzed data from a survey as well as spatial data from GIS. Participation increased with farm size, the growing of crops, and the understanding that their children would continue farming that land. Participation decreased as proximity to the nearest city increased. While putting a dollar figure on many of these characteristics is important, it is also vital that the motivating factors of the public be determined. This topic has 17
26 been taken into account by additional studies. The list of motivating factors include protection of food supply and the preservation of heritage and open spaces, as outlined by Fursueth in 1987, in a study conducted in a county in North Carolina. In 1999, Kreiger uncovered similar motivating factors that additionally included slowing development and ensuring rural quality. While in 1998, Kline and Wichelns used a contingent ranking format to determine how protecting environmental resources, scenic quality, food supply, and farming lifestyles influenced Rhode Island residents motivation to preserve farmland. Nickerson and Lynch (2001) studied the effects that a conservation easement to farmland had on property values in three counties in Maryland. Due to the loss of development rights, it would be expected that property value would decrease. They found little statistical evidence that voluntary permanent preservation programs significantly decrease the price of farmland in Maryland. They propose that the results also imply that agencies may have a legitimate reason for reducing the easement payments, since land values do not appear to be reduced by the full value of the development rights. Anderson and Weinhold (2008) analyzed the effect of FMV on farmland when development rights are sold through the purchase of a conservation easement to the land. They analyzed data from South Central Wisconsin, and found a negative but statistically insignificant effect. Yet, when the sample was restricted in such a way that more homogeneous groups were analyzed, a statistically significant and negative impact was detected that ranged up to 50% of FMV for some farms. Johnston and Duke (2007) examined different specification strategies for estimating the WTP of the public for land preservation. Their results suggest that even with a comprehensive specification strategy, it may be inadequate in preventing a systematic shift in WTP estimates. A widely cited criticism of 18
27 estimates based on state preference questions is that these estimates diverge widely depending on the elicitation format used in data collection (Carson and Groves 2007, McFadden 1994) Revealed preference has also been used to value the WTP of the public for farmland to be preserved. Geoghegan et al. (2003) used a hedonic approach to analyze the change in property values for residence in three Maryland counties. They then compared cost of preserving the land to the increase in county property tax revenue based on a hypothetically implemented conservation easement program. This study differs in two important ways from studies done on farmland valuation in the U.S. previously. First, this study utilizes attribute-based choice modeling rather that contingent valuation, which many prior studies applied. Additionally, other prior studies have used a hedonic approach where proximity to agricultural land is just one of many contributors to residential property values. Identifying the specific attributes of the land that provide public utility will help landowners and potentially aid in establishing public support for such a proposed program. Second, the geographic area for this study was statewide as opposed to sub-state, like previous studies. Most of the conservation easement programs are operating at the state level or require state support for a localized effort. Statewide opinions are therefore very important to consider when forming a policy on the most efficient way to spend public funds. 2.3 Contribution of this Research The public opinion survey that was sent out to the geographic areas in this thesis was preceded by a series of focus groups in Colorado, Oregon, as well as Ohio, Georgia, and Maine. The focus groups ranged from small groups talking about understanding the terminology of land preservation to looking at pictures of 19
28 different farms. Through the focus groups, the final attributes that were included in the survey were finalized. The findings of the focus groups are available in Paterson et al. (2001, 2005). The public opinion survey was sent out with different versions of the attribute-based choice questions. Through four different set ups, which included a control (which is the data used in this thesis), a cost first option, an attribute-based choice question with only one alternative, and an attribute-based choice question with no status quo, the convergent validity of the version was analyzed. This was done by Boyle and Özdemir in The only version that did show a significant difference was the version with three alternatives as opposed to two. The rest of the versions did not show a significant difference. Previous research as outlined above has focused on the willingness-to-pay of the public for farmland protection programs as well as the motivating factors behind this WTP; there is a hole in the research that this study aims to fill. The United States has a wide variety of landscapes, and comparing WTP and motivating factors between different regions of the country would provide greater insight for broader reaching farmland protection programs to consider. This information will allow for the amenities that give farmland its public value to be maintained more efficiently on a regional level, so that countrywide policies are not implemented without necessary consideration of regional levels. 20
29 CHAPTER THREE: Models and the Survey 3.1 Choice Theory and the Random Utility Model An individual is assumed to have a utility function (U), which depends on A i (a vector of attributes associated with alternative (i)), I (income) and S (socioeconomic characteristics). In the analysis of the attribute-based choice data, each alternative i in the choice set (i = 1, 2 (choice of Program A or B) or i = 1, 2, 3 (choice of Program A, B, or status quo)) has a utility level of:,, Where V i is the systematic, observable component of utility and ε i is the random error (McFadden 1973; Louviere et al. 2000) If a respondent chooses alternative Y, then: Then, the probability (Pr) of choosing Y over any other alternative i is: The probability of choosing alternative Y can be estimated using a probit model as outlined in the next section. Decision rules were implemented to disregard respondent s observations that were misleading or inconsistent. Based on Arrow s impossibility theorem axiom of independent of irrelevant alternatives (IIA), a decision rule was implemented to ensure that a respondent was consistent between attribute-based questions based on 21
30 the same program. Specifically, a respondent cannot prefer Program A to Program B, only to prefer Program B to Program A when the status quo option is offered. If a respondent responded in this way, all of their responses were thrown out. Conversely, if a respondent did not respond to one of the attribute-based questions, but all of the other responses were consistent, then that respondent s responses were included in the data set. The observable component of the utility function can be specified as where USE is a vector of uses, LOC is a vector of locations, QUAL is a vector of quality, SIZE is a vector of size, INC is a vector of income, and HH is a vector of other household characteristics. If we assume that under no program that the following vectors are and that the program does not affect household characteristics such that We can then take the difference in observed utility from a program and the observed utility where there is no program. 22
31 This reduces to and setting 0 we can solve for WTP as Then, because of binary values for Use, Location, Quality, and Size: 3.2 Probit Model In a choice model, the dependent variable is binary such that 1 0.., 0 otherwise. The log-likelihood function can be estimated in the following way ln β ln Φ 1 ln 1 Φ 23
32 Under the assumption that the error is distributed normally, i.e. 0,Ω, where Ω E Φ( 1 Φ(, and Ω 1 Φ( 1 Φ( The choice equation can be specified as Where i = 1, 2, 3, 4 (for each different geographic area). 3.3 Bivariate Probit Model with Sample Selection The typical Heckman model utilizes an outcome (choice) equation that has a continuous dependent variable. The selection equation is typically a probit model with a binary dependent variable. In this thesis, the choice equation also has a binary variable, which is why the Heckman procedure must be altered to accommodate two probit models. This is known as a bivariate probit model with 24
33 sample selection. The general composition of the bivariate probit model will be discussed, and then the specific changes that go along with the sample selection correction will be outlined. The bivariate probit model is composed of two separate probit models that have correlated errors. This can be translated into a choice framework as two interrelated choices. The first choice is whether or not to fill out the survey. The next set of choices are the decisions made as to the stated-preference attributebased choice questions in the survey. The last choice is whether or not to bother sending the survey back. Since all of the prior choices to responding to the survey are indistinguishable if the survey is not sent back, then only two identifiable choices arise. These are modeled by the choice and selection equations. Within the bivariate probit model, we have two binary dependent variables,, j= 1, 2, and the two equations might appear like this where are unobservable and related to the binary dependent variable by the following rule for j = 1, 2. The models can be estimated separately if the errors between the two probit models are independent. In other words,, 0. If the covariance of the errors of the two separate models is not 0, then the error terms have some sort of dependence. Such that 25
34 The error terms are comprised of unique, and common parts. Therefore the errors are correlated. The choice equation can then be written 1 and the selection equation can be written 1 We are therefore interested in the joint probability of and. The joint probability of two independent random variables is the product of their marginal probabilities. If and are independent, then 1, 1 F F 1, 0 F 1 F 0, 1 1 F F 0, 0 1 F 1 F If and are not dependent because of the correlation in their errors, then their joint probability, given and 26
35 would be 1, y 1 1 y 1 1 Assuming a bivariate normal distribution for the joint distribution of the s, the joint pdf takes the form, where ρ is the correlation parameter which indicates the level of covariance between the s. The joint cdf then take the form Φ Φ,,, Under the assumption that the bivariate distribution is IID with correlation ρ,,, 0 Var, Var, 0 Cov,, The probability of joint event can then be made via, 1, 1, ; Φ, ; The log-likelihood of all four events, multiplied by their probabilities and summed gives the log-likelihood of the bivariate probit model. 27
36 ln lnφ, ; 1 )ln Φ, ; 1 ln Φ Φ, ; 1 1 ) ln 1 Φ Φ Φ, ; When we put all of this into a sample selection framework, the equations reduce down. This is because without a response, we cannot know the choice variables. This means that there are three outcomes that are possible. 0 0 Φ 1, 0 1, 0 = Φ Φ, ; 1, 1 1, 1 Φ, ; The log-likelihood function reduces down to ln lnφ, ; 1 )ln Φ Φ, ; 1 lnφ The probit model is based on an assumption about the error term. If the error term is distributed normally, then the observable component can be specified through the estimation of a utility function. If the 28
37 The selection equation is specified as a discrete choice model where survey response bias was taken into account by controlling for differences in demographic characteristics of respondents and non-respondents based on the zip code in which they reside. The selection equation is empirically specified as: 1 _ _ _ _ _ _ _90 _ _80 _ _00 _90 _80 _00 Combining the utility equation and the selection equation in a Heckman format using a FIML estimation is the most efficient use of information in the model. 6 Clustering was also used across j. Controlling for correlation by clustering the responses from each individual respondent accounts for the variance within each respondents set of responses, but does not affect the parameter estimates. Under the assumption that the utility function is linear in coefficients (Greene 2000), then the estimated choice equation to estimate can be empirically specified as: 1 6 FIML is the most efficient procedure, as opposed to a two step procedure with the choice and selection equations being estimated one step at a time. 29
38 2 2 4 Where i = 1, 2, 3, 4 (for each different geographic area). To ensure that the utility function does not have perfect multicollinearity, SMALL is not included in the specification. Otherwise, both the baseline (STATUSQUO) and all of the total acreage alternatives would be included. 3.4 Role of Scale Parameter In a probit model, it is impossible to recover the scale parameter, as the scale parameter and the true underlying preference parameters are always confounded multiplicatively. This means that estimates from different data sets should not be compared directly, but relative scale should be taken into account. This is because it cannot be determined whether true preferences, a scaling difference, or both play a role in the estimate differences. Using relative scale allows for a test to be run determining the relationship of the parameter estimates when accounting for the relative scale. Scale parameter and the true underlying preference parameters are always represented in multiplicative form such that, where are the parameter estimates. Given an estimate of μ, it is then possible to test whether parameter vectors are the same up to a scaling constant. Scale is inversely related to variance, therefore a larger scale means a lower variance, and vice versa. Swait and Louviere (1993) used a method for comparing 30
39 independent data sets while using a multinomial logit model for each geographic area. 3.5 Method for Estimating Likelihood Ratios for Pair-wise Comparisons Using Scale Parameter When comparing estimates of the same model, using different geographic areas, it is necessary to account for differences in the scale parameters (μ i ) of the estimates. Otherwise, a significant difference in the estimates could be detected when a standardization of the scale parameter could account for the difference. The following process is the same that was outlined by Swait and Louviere (1993). The first step is to select the two geographic areas that are going to be compared. This study tests all pair-wise geographic areas. With four geographic areas, the US, GA, OH, and ME, this means that six tests were performed. The second step is to estimate the models using the exact same set of variables. There are three models to be estimated. The first two are the estimations of the individual geographic areas. The third is with the concatenated data of both geographic areas. From each of these estimations, the log-likelihood value is stored for later use in the hypothesis tests. Additionally, the parameter estimates are saved from each of the individual geographic area estimations for use in the next step. The constant term is dropped from each parameter estimate matrix aft er the estimat ion. Therefore the parameter estimate matrices that were 1 1 become 1. These truncated matrices are used in the third step. The third step is to use the stored truncated parameter estimates to create a confidence interval for the scale parameter. The confidence interval will be used as a range in which the scale parameter is varied in a future step. The confidence interval is constructed by regressing one truncated parameter estimates matrix on 31
40 the other, while forcing no constant term in the estimation. The resulting parameter estimate is the parameter estimate for the standardized scale parameter. Assuming a normal distribution of the standardized scale parameter, a 99% confidence interval is constructed. This range is the range that will be used to vary the scale parameter in a loop in the next step. The fourth step is to program a loop that varies the scale parameter. It is important to note that the statistical package that was used to estimate the models automatically standardizes the scale parameter to unity. Using the concatenated data, a loop that varies the scale parameter, estimates the equation of interest, and stores the resulting log-likelihood value is programmed. The geographic area data, which corresponds with the parameter estimates that were used as the regressor in step three, are multiplied by the varying scale parameter during each iteration of the loop. At the end of the loop, the data that was multiplied by the scale parameter is restored to their pre-loop iteration values. Once all iterations of the loop have been run, spanning the range of the confidence interval, the maximum log-likelihood value that resulted from any of the scale parameter values is stored. In this study, the confidence interval range was divided by 100 to determine the size of each step in the loop. Finally, all of the statistics needed for the hypothesis tests are stored. The log-likelihood ratio statistics can be tested to determine the statistical significance of the relationship between the pair-wise geographic areas while accounting for the scale parameter. The following table outlines the two hypotheses tests and the corresponding log-likelihood ratio statistics. 32
41 Table Hypotheses and Log-Likelihood Ratio Tests H A : β 1 = β 2 λ A = -2[L μ (L 1 + L 2 )] L μ from optimally adjusted pooled data L 1 from X 1 model L 2 from X 2 model H B : μ 1 = μ 2 λ B = -2[L p - L μ ] L p from unadjusted pooled data L μ from optimally adjusted pooled data A significant result for H A indicates that there is heterogeneity in preferences between the geographic areas. A significant result for H B indicates that there is heterogeneity in the amount of variance or noise between the two geographic areas. 3.6 Method for Predicting WTP using Implicit Prices Under the assumption that utility is linear in parameters, then differentiation of the utility function with respect to an attribute gives the marginal utility of that attribute. Dividing one marginal utility by another gives the marginal rate of substitution between those two attributes. In terms of money, the negative of the parameter estimate is the marginal utility of money. To calculate the implicit price of any of the attributes, divide the marginal utility of the attribute by the negative of the marginal utility of money. This provides the household s willingness-to-pay for the conservation of farmland that did not exhibit the attribute of interest but will now. 3.7 Estimating Consumer Surplus Using the WTP of each attribute, any farmland conservation program can take the sum of the implicit prices of each attribute in the proposed program, and find what amount the public is willing to pay to conserve that farmland. From the farmer s perspective, the value of a Conservation Easement reflects the difference between the higher value they would receive if they sold the land for residential, commercial, or other non-farm uses, and the lower value if they sold to another 33
42 farmer. From a household s perspective, it reflects how much they are willing to pay so that the land is never developed commercially or residentially. For this thesis, it is assumed that all households are homogeneous in their WTP. It is also assumed that the WTP that is estimated is representative of that homogeneous WTP. A WTP range will be provided. The lower end of the estimate will retract from the homogeneous assumption slightly, and will break the respondents into a group that has a homogeneous WTP identical to that which is estimated, while the non-respondents will have an assumed WTP of zero. The response percentages will be extrapolated onto the household population as a whole in each geographic area. The sum of this WTP will be lower end. The upper end will eliminate the assumption that non-respondents have a WTP of zero. All households in the geographic area will have an assumed WTP that is identical to the estimated WTP. 3.8 Survey Design To find out the farmland attributes that are most valued by the public, a public opinion survey 7 was conducted in The survey was distributed nationwide (US) as well as in Georgia (GA), Ohio (OH), and Maine (ME). The core of the survey was an attribute-based choice study where respondents had a choice between Program A and Program B and then could choose between Program A, Program B, and the status quo of no program. Program A and Program B were different farmland concentration easements that varied in attributes. There were four such scenarios with varying farmland use, location, land quality, total acreage, and cost for each program. Additionally, demographic 7 A copy of the Public Opinion Survey that was sent out to one of the geographic areas (Maine) is available in Appendix A. The size component varied between geographic areas to provide a measure relative to the size of the geographic area being sampled. 34
43 information on the respondent and the respondent s household were collected to allow for tests of response bias. Dillman s method was followed while sending out the surveys to the households. The survey was sent out to 1000 households in each geographic area other than ME, which had 500 households receive a survey. First, an introductory letter was sent to the households to let them know about the survey and to ask them to complete the survey and return it. A week later, the information booklets 8 along with the survey were sent to the households. The following week, postcards were sent to remind the households about the survey and inform them about the importance of their response to the research. Two weeks after that, all nonresponse households received a second survey. Table shows an example attribute-based choice question. Four such questions were presented in every public opinion survey. As stated above, farmland use, location, land quality, total acreage, and cost for each program were varied. Table shows the farmland attribute s possible attribute levels. The different choice question attribute combinations were randomly generated in a way that the funding agency for the project could potentially use the data to analyze interaction effects. More commonly the approach to developing the attribute combinations is to use an orthogonal approach. According to Lusk and Norwood (2005), welfare estimates are not biased by the approach used for this study. The attributes in the attribute-based choice questions were designed using a random factorial. Only main effects, and not interaction effects, were calculated in this research. Combining all of the possible attribute combinations yields A copy of one of the information booklet that accompanied the survey with one of the geographic areas (Maine) is available in Appendix B. The information booklet provided information specifically on the geographic area being sampled that would help the respondents make more informed decisions. 35
44 different program scenarios for the survey. This is done by multiplying the six use, two location, two prime, four size, and six cost options. 36
45 Table Example Attribute-Based Choice Question Suppose you had to vote between two conservation easement programs, Program A and Program B. These programs differ in terms of the attributes of the farms that would receive priority in the bidding process, the number of acres in the program and the cost to you. Please tell us which of the two programs you would support if you had to choose between Program A and Program B. You will also be able to tell us if you would vote for one of these programs or do nothing. Conservation Easement Program A Conservation Easement Program B Farmland use priority Growing vegetables, berries, fruit and nut crops Growing hay Farmland location priority Near urban areas No priority Land quality priority No priority Prime farmland Total acres of easement purchased 120,000 60,000 One-time cost to your $5 $7 household in 2002* 9. Which program do you prefer? (PLEASE CIRCLE ONE NUMBER) 1 Program A 2 Program B 10. Now, suppose you could vote between Program A, Program B and doing nothing. How would you vote? (CIRCLE ONE NUMBER) 1 I would vote for Program A 2 I would vote for Program B 3 I would not vote for either program * Respondents were told that the payment vehicle was a one-time increase in their state income taxes: "Money to purchase Conservation Easements would come from a one-time payment that everyone in the state would pay through an increase in their 2002 state income taxes." 37
46 Table Attributes and Attribute Levels Attributes Farmland use priority Farmland location priority Land quality priority Total acres of easement purchased One-time cost to household in 2002 (increase in state income taxes) Attribute levels Growing grain crops Growing hay Growing vegetables, berries, fruits and nuts crops Pasture for livestock Forested land No priority Near urban areas No priority Prime farmland No priority US GA OH ME SMALL 9,000, , ,000 12,000 MEDIUM 45,000, , ,000 60,000 LARGE 90,000,000 1,000,000 1,400, ,000 EXLARGE 180,000,000 2,000,000 2,800, ,000 $0 (status quo only) $3 $5 $7 $10 $25 $50 Table defines all of the variables that are used in both the choice and selection equations. The choice equation variables are in all caps while the selection equation variables are in all lower case. The choice equation data comes from the responses made to the survey. The selection equation data comes from the USDA and the 2000 census. The choice equation only has data for households that responded. The selection equation only has zip code level data from which the household that was sent a survey resides. 38
47 Table Variable Definitions Variables Choice Equation Variable definitions RESPDUM 1 if respondent chose that program, 0 otherwise STATUSQUO 1 if no conservation easement, 0 otherwise COST $3, $5, $7, $10, $25, $50 URBAN 1 if near urban area, 0 otherwise PRIMEFARM 1 if prime farmland, 0 otherwise GRAIN 1 if growing grain crops, 0 otherwise HAY 1 if growing hay, 0 otherwise VEGETABLE 1 if growing vegetable, fruit and nuts crops, 0 otherwise PASTURE 1 if pasture for livestoch, 0 otherwise FOREST 1 if forested land, 0 otherwise MEDIUM 1 if MEDIUM acres, 0 otherwise LARGE 1 if LARGE acres, 0 otherwise EXLARGE 1 if EXLARGE acres, 0 otherwise Q2ASC 1 if ABC question 2, 0 otherwise (alternative specific constant) Q3ASC 1 if ABC question 3, 0 otherwise (alternative specific constant) Q4ASC 1 if ABC question 4, 0 otherwise (alternative specific constant) Selection Equation resp 1 if responded to survey, 0 otherwise pctmove percent moved in last five years pctmove_county percent moved from different county in last five years pctmove_state percent moved from different state in last five years pcths percent with high school or better education pctcol percent with college or better education pct_farm_earn percent of earnings from farms pct_renter percent of residents who rent ruc rural urban continuum, 0 urban 9 rural uic urban influence code, 1 urban 9 rural amenity amenity scale, higher is nicer popchange_nm_90 percent population change in nonmetro area since 1990 popchange_nm_80 percent population change in nonmetro area since 1980 popdensity_nm_00 population density in nonmetro area per square mile 2000 popchange_90 percent population change since 1990 popchange_80 percent population change since 1990 popdensity_00 population density per square mile 2000 income median income of zip code of respondent 39
48 CHAPTER FOUR: Data and Empirical Results 4.1 Descriptive Statistics Table shows how respondent choices were distributed by program. The first question asked whether the respondent preferred program A or program B. The second question asked whether the respondent preferred program A, program B, or no program (status quo option). Table is comprised of demographic descriptive statistics of the respondents only compared with the demographic descriptive statistics of the geographic areas from the 2000 census. The respondent data is from the public opinion survey, which was conducted in While the census data was from the American FactFinder website. Table Percentage of Choosing Program A, Program B, and Status Quo US GA OH ME Q1 Q2 Q1 Q2 Q1 Q2 Q1 Q2 Choice of A (%) Choice of B (%) Status Quo (%) NA 26 NA 29 NA 24 NA 24 40
49 Table Demographic Characteristics by Geographic Area United States Georgia Ohio Maine Respondents Nationwide Respondents Statewide Respondents Statewide Respondents Statewide Gender (%) Male Female Age (years) Median Education (%) Eight years or less Some high school High school graduate Some college or technical school Technical school graduate College graduate Post graduate work Population (persons) Average household Average family Income ($) Median household
50 Based on the comparison between the respondents and the census data, outlined in Table 4.1.3, it is apparent that an older, male dominated, more highly educated, and wealthier group responded. Unfortunately, demographic statistics are not available for every household that responded. This is the inherent problem with survey data when trying to detect selection bias. It must be assumed that every household that does not respond is a homogeneous representation of the average household in, for example, that household s zip code. This is the best way known to attempt to detect selection bias, given the limitations that the data present. And this is the process that is used to try to detect selection bias within the data used for this thesis. But, it is apparent that the respondents do exhibit atypical demographic characteristics when compared to the rest of the geographic area. Table ANOVA of Demographic Characteristics by Geographic Area United States Georgia Ohio Maine Gender Reject Reject Reject Reject Age Reject Reject Reject Reject Population Fail to Reject Fail to Reject Fail to Reject Fail to Reject Income Reject Reject Reject Reject 42
51 4.2 Probit Estimation with Sample Selection Results Using the methodology outlined in Chapter Four, probit models for each geographic area were estimated. First, the probit models with sample selection were estimated, using a Heckman correction format. This is adaptation of the Heckman format which uses a probit model for the choice equation and OLS for the selection equation. The Heckman probit format utilizes a probit model for both the choice and selection equations. To determine if there is selection bias that needs to be accounted for and corrected, a Wald test is performed to determine if the choice and selection equations are independent. Then the significance level is calculated. If the Heckman probit estimation yields a result that says that the selection equation is significant, then the bias must be corrected for. If the selection equation is insignificant, then the selection equation can be dropped from the analysis, and the choice equation can be estimated on its own. 43
52 Table Estimation of Choice Equation for Bivariate Probit with Sample Selection Choice Equation RESPDUM United States Georgia Ohio Maine Q2ASC (0.016) (0.02) (0.021) (0.027) Q3ASC ** * (0.017) (0.022) (0.023) (0.027) Q4ASC * (0.017) (0.024) (0.023) (0.028) STATUSQUO *** *** *** * (0.026) (0.029) (0.027) (0.034) URBAN *** *** *** (0.067) (0.067) (0.066) (0.076) PRIME *** *** *** *** (0.062) (0.064) (0.062) (0.067) GRAIN *** * ** (0.11) (0.102) (0.106) (0.113) HAY *** *** * (0.105) (0.108) (0.092) (0.116) VEGETABLE *** *** ** ** (0.107) (0.107) (0.112) (0.12) PASTURE (0.1) (0.111) (0.105) (0.12) FOREST * *** (0.097) (0.1) (0.098) (0.123) MEDIUM * ** (0.085) (0.086) (0.092) (0.096) LARGE ** *** *** (0.093) (0.088) (0.078) (0.105) EXLARGE * *** *** *** (0.091) (0.092) (0.093) (0.108) COST *** *** *** *** (0.002) (0.002) (0.02) (0.002) CONSTANT *** *** *** *** (0.096) (0.099) (0.102) (0.089) 44
53 Table Estimation of Selection Equation for Bivariate Probit with Sample Selection Selection Equation resp United States Georgia Ohio Maine pctmove (1.529) (1.758) (1.436) (2.976) pctmove_county (1.58) (1.557) (1.418) (2.327) pctmove_state (1.738) (1.545) (1.789) (2.832) pcths *** (0.935) (1.28) (0.982) (1.742) pctcol ** * (1.189) (1.138) (1.067) (1.869) pct_farm_earn (0.556) (0.612) (0.493) (1.224) pct_renter (1.157) (1.037) (0.896) (1.675) ruc (0.054) (0.052) (0.052) (0.078) uic * (0.05) (0.048) (0.051) (0.071) amenity *** (0.079) (0.07) (0.07) (0.116) popchange_nm_ *** (3.88) (4.519) (5.682) (16.43) popchange_nm_ *** (2.165) (2.578) (3.048) (8.875) popdensity_nm_ *** *** (0.005) (0.004) (0.002) (0.018) popchange_ *** ** (4.734) (4.687) (6.604) (19.941) popchange_ ** *** (2.125) (2.338) (2.779) (7.739) popdensity_ * *** (0.002) (0.001) (0.001) (0.002) income * * (0) (0) (0) (0) constant *** (1.042) (1.324) (0.854) (1.655) 45
54 Table Summary Statistics for Bivariate Probit with Sample Selection Number of obs Censored obs Uncensored obs Clusters Wald chi 2 (15) p-value Log pseudolikelihood Table Selection Bias Test from Bivariate Probit with Sample Selection Estimation rho ** * (0.053) (0.039) (0.057) (0.024) Wald test of indep. eqns. (rho = 0): chi 2 (1) p-value Notes: Significant at the * = 10 percent, ** = 5 percent, *** = 1 percent. Standard errors in parentheses The significance level of the selection equation for the United States is Therefore, the selection equation is insignificant and can be dropped from the analysis. The significance level of the selection equation for Georgia is Therefore, the selection equation is insignificant and can be dropped from the analysis. The significance level of the selection equation for Ohio is Therefore, the selection equation is insignificant and can be dropped from the 46
55 analysis. The significance level of the selection equation for Maine is Therefore, the selection equation is insignificant and can be dropped from the analysis. All of the geographic areas show that under the assumption of zip code homogeneity, there is not response bias within the sample. This means that the selection equation can be dropped from all of the models, and the choice equation can be estimated solely. 4.3 Probit Estimation Results From all of the Heckman probit estimates, we can discern that compared to the zip code averages, there was no response bias between those who did respond and those that did not. Therefore, the probit estimates of the choice equations for all four geographic areas can be used for the rest of the analysis. Probit parameter estimates cannot be directly interpreted, other than sign, which reveals whether the relationship between each variable is direct or indirect. The probability of an affirmative response to the choice questions is increased/decreased by the marginal parameter estimate for each variable. 47
56 Table Probit Estimation for Geographic Areas Choice Equation RESPDUM United States Georgia Ohio Maine Q2ASC (0.016) (0.02) (0.021) (0.027) Q3ASC ** * (0.017) (0.022) (0.022) (0.027) Q4ASC * (0.017) (0.023) (0.023) (0.028) STATUSQUO *** *** *** * URBAN (0.024) (0.028) *** (0.027) *** (0.033) *** (0.063) (0.066) (0.065) (0.075) PRIME *** (0.059) *** (0.063) *** (0.062) *** (0.067) GRAIN *** * (0.105) (0.102) (0.105) (0.113) HAY *** *** * VEGETABLE (0.099) *** (0.108) *** (0.092) *** (0.116) ** (0.103) (0.106) (0.111) (0.118) PASTURE (0.097) (0.112) (0.104) (0.119) FOREST ** *** (0.094) (0.101) (0.098) (0.123) MEDIUM ** * ** (0.083) (0.086) (0.09) (0.095) LARGE *** ** *** *** (0.088) (0.088) (0.078) (0.105) EXLARGE *** *** *** *** (0.09) (0.091) (0.092) (0.108) COST *** *** *** *** (0.002) (0.002) (0.002) (0.002) CONSTANT *** *** *** *** (0.07) (0.081) (0.072) (0.085) 48
57 Table Summary Statistics for Probit Estimation for Geographic Areas Number of obs Clusters Wald chi 2 (15) p-value Pseudo R Log pseudolikelihood Notes: Significant at the * = 10 percent, ** = 5 percent, *** = 1 percent. Standard errors in parentheses The location variable in the model is URBAN. Among the four geographic areas, URBAN is significant and positive in the three states but not nationally. This suggests that among the three states sampled, conserving land near urban areas is more important than nationally, and specific consideration within those states should be taken when developing a state level effort for land preservation. The quality variable in the model is PRIME. All four geographic areas consider PRIME farmland a highly significant and positive attribute that conservation easement programs should put great value into when determining farmland to conserve. Therefore, the states should follow the national programs lead when considering farmland for their programs. The use variables in the model are GRAIN, HAY, VEGETABLE, PASTURE, and FOREST. Throughout the different geographic areas, only two of the potential uses are consistently viewed. VEGETABLE is considered highly significant and positive, while PASTURE is not significant at all. This suggests that VEGETABLE should be a national priority, while PASTURE should actually not be considered in any program. 49
58 The size variables in the model are STATUSQUO, MEDIUM, LARGE, and EXLARGE. SMALL is the reference level, as both SMALL and STATUSQUO could not be included in the model in order to avoid perfect multi-collinearity. The negative coefficient for STATUSQUO cannot directly be interpreted in terms of marginal price of SMALL as it acts as a catch all in some sense. What can be interpreted is that STATUSQUO has a negative marginal price so the general public would prefer a SMALL program to no program at all. Other than MEDIUM in Georgia, all of the size parameter estimates are positive. It is interesting to note that in the US and OH, that size is not a monotonically increasing estimate. EXLARGE actually has a smaller parameter than LARGE. This suggests that while more land preserved in better for the most part, a program with an EXLARGE size is beyond the threshold of optimal size. The COST variable is significant and negative as expected. 4.4 Optimum Scale Parameter and Likelihood Ratio Test Results Chapter Three outlined the methodology used to estimate the optimum scale parameter ratio between any two geographic areas. Table outlines the results of the hypotheses test. 50
59 Table Geographic area Pair-wise Comparison Using Scale Parameter Ratios Optimum Scale Parameter Ratio United States Georgia Ohio United States Georgia Ohio Maine H A p-value United States Georgia Ohio United States G eorgia Ohio Maine H B p-value United States Georgia Ohio United States Georgia Ohio Maine The optimum scale parameter ratios for each pair-wise combination of geographic areas are listed first. The larger the scale parameter the lower the variance, as they are inversely related. The first hypothesis test is whether or not 51
60 the parameter estimates between the two geographic areas are statistically similar. If a 10% significance level is used as the cut-off, then the US-OH, US-ME, GA- ME, and OH-ME combinations show that H A is rejected, and that the parameter estimates are heterogeneous. The second hypothesis test is whether or not the scale parameter between the geographic areas is statistically similar. Again, if a 10% significance level is used as the cut-off, then the US-OH, US-ME, and GA-ME combinations show that H B is rejected, and that the variances or noise associated with the two geographic areas are heterogeneous. This suggests that the geographic areas with more noise are less likely to truly exhibit a homogeneous WTP as is assumed when aggregating. 4.5 WTP Predictions Table shows the implicit prices that each attribute has per household. Table shows the lower and upper geographic area wide WTP estimates by summing the attribute from each component. The lower limit aggregated the WTP by multiplying the household WTP by the total number of households in the respective geographic area, and then multiplying by the response rate to the survey for each geographic area. The lower limit therefore assumes that all nonrespondents have a WTP that is less than or equal to zero. The upper limit was calculated the same way as the lower limit, but assumes that the respondents are an accurate representation of the entire population of each geographic area, and therefore have the same WTP as each household. So the multiplication by the response rate is not included. The total number of households is only available for the year 2000, so the estimates may be biased lower than actuality because of population growth. The total number of households in the US (105,480,101), GA (3,000,369), OH (4,445,773), and ME (518,200), in 2000 was used for 52
61 aggregation. The response rates of 24.4%, 21.3%, 24.8%, and 34.6% were used to calculate the lower limits. To determine the budget that a conservation easement program would have in any of the geographic areas, a use, location, quality, and size attribute needs to be chosen that the program is targeting. Because of the assumption of linearity, the sum of each of the WTP estimates would equal the total budget. Table Marginal WTP by Attribute per Household United States Georgia Ohio Maine Per Household Location urban $8 $16 $15 $31 Quality prime $22 $23 $24 $42 Use grain $46 $13 $18 $3 hay -$10 -$24 -$23 -$21 vegetable $44 $34 $25 $ 26 pasture $11 $11 $1 $6 forest $23 $10 $27 -$1 Size small $14 $10 $8 $6 medium $19 $8 $15 $20 large $32 $17 $40 $ 29 exlarge $27 $23 $40 $62 53
62 Table Program with Highest WTP by Geographic Area Lower Limit and Upper Limit United States Georgia Ohio Maine Highest WTP Location urban $8 $16 $15 $31 Quality prime $22 $23 $24 $42 Use grain $46 $0 $0 $0 hay $0 $0 $0 $0 vegetable $0 $34 $0 $26 pasture $0 $0 $0 $0 forest $0 $0 $27 $0 Size small $0 $0 $0 $0 medium $0 $0 $0 $0 large $32 $0 $40 $0 exlarge $0 $23 $40 $62 Total $107 $96 $106 $162 Lower Limit $2,765,345,907 $61,133,937 $116,897,865 $28,995,603 Upper Limit $11,333,384,863 $287,013,791 $471,362,357 $83,802, Current Program Comparisons The national ranking criteria are: 1. Percent of prime, unique, and important farmland in the parcel to be protected. 2. Percent of cropland, pastureland, grassland, and rangeland in the parcel to be protected. 54
63 3. Ratio of the total acres of land in the parcel to be protected to average farm size in the county according to the most recent USDA Census of Agriculture ( 4. Decrease in the percentage of acreage of farm and ranch land in the county in which the parcel is located between the last two USDA Censuses of Agriculture ( 5. Percent population growth in the county as documented by the United States Census ( 6. Population density (population per square mile) as documented by the most recent United States Census ( 7. Proximity of the parcel to other protected land, including military installations. 8. Proximity of the parcel to other agricultural operations and infrastructure. Consistent with the WTP estimates, prime farmland is a leading attribute considered when deciding whether or not a conservation easement should be purchased to farmland. Based on the results, pasture may be overvalued within the ranking criteria. Size is being considered, as it should be, but only in relative as opposed to absolute terms. The rest of the ranking criteria have to do with county level changes and proximity to other places of interest. There was no GIS data included in the models to affirm or denounce the validity of these criteria. 55
64 CHAPTER FIVE: Conclusions and Recommendations 5.1 Issues with Procedures The limitation that is presented with the lack of data on non-respondents is difficult to deal with. The assumption that non-respondents must be a homogeneous representation of their zip code is unrealistic. Unfortunately, it is the only way to attempt to control for selection/response bias. It is obvious that the demographic characteristics of those who responded were not average. Demographic characteristics are not the only cause for having a WTP for conservation easements, but it is hard to see the disparity and just ignore it. The assumption that welfare from farmland is homogeneous across an entire population is a difficult assumption to defend. Therefore, the upper limit of the aggregate WTP estimation is unrealistic. Some people may have a negative utility for farmland, while others may have a WTP that is less than the average WTP of the geographic area. These households will be forced to make a one-time payment that is having a decrease in their overall utility. Aggregate WTP is a consumer surplus estimation, but the only realistic way to accurately estimate it would be to have a household by household WTP fill in the blank, where the household gives their own consumer surplus payment. Summing all of the payments would give the actual budget. 5.2 Research Extensions Based on the national ranking criteria for farmland that is being considered for a conservation easement, it would be interesting to add a spatial element to the variables. The USDA is placing a premium on spatial relationships of farmland. It would be interesting to see if these characteristics are in the consciousness of households, or if they play an out of sight, out of mind kind of role in valuation. 56
65 5.3 Conclusions While with some attributes, there is consistent valuation, among other attributes, different geographic areas have different views. Therefore, there should be a set of national ranking criteria that programs consider as well as a set of state or local ranking criteria that enter into the equation. 57
66 References Adamowicz, W., J.L. Louviere and J. Swait. 1998a. Introduction to attributebased stated choice methods. Final Report, Resource Valuation Branch, NOAA, U.S. Dept. of Commerce, Washington DC. American Farmland Trust Saving American Farmland: What Works. Northampton, MA: American Farmland Trust. Anderson, K., and D. Weinhold Valuing Future Development Rights: The Costs of Conservation Easements. Ecological Economics 68: Beasley, S.D., Workman, W.G., and N.A. Williams Estimating Amenity Values of Urban Fringe Farmland: A Contingent Valuation Approach: Note. Growth and Challenge. 17(4): Bell, K.P., Boyle, K.J., and J. Ruban Valuation and Land-Use Change. Economics of Rural Land-Use Change. Chippenham, Wiltchire: Antony Rowe Ltd. Ch.13. Bennett, J. and R. Blamey (eds.) The Choice Modelling Approach to Environmental Valuation. Edward Elgar, Northampton, MA. Bergstrom, J.C., Dillman, B.L., and J.R. Stoll Public Environmental Amenity Benefits of Private Land: The Case of Prime Agricultural Land. Southern Journal of Agricultural Economics 17(1): Bergstrom, J.C., and R.C. Ready What Have We Learned from Over 20 Years of Farmland Amenity Valuation Research in North America? Review of Agricultural Economics 31(1): Bowker, J.M., and D.D. Didychuk Estimation of Nonmarket Benefits of Agricultural Land Retention in Eastern Canada. Agricultural and Resource Economics Review Boyle, K.J., and S. Özdemir Convergent Validity of Attibute-Based, Choice Questions in Stated-Preference Studies. Environmental Resource Economics 47:
67 Bromley, D., and I. Hodge Private Property Rights and Presumptive Policy Entitlements: Considering the Premises of Rural Policy. European Review of Agricultural Economics 17: Cho, S-H. Newman, D.H., and J.M. Bowker Measuring Rural Homeowners Willingness to Pay for Land Conservation Easements. Forest Policy and Economics 7: Daniels, T When City and Country Collide: Managing Growth in the Metropolitan Fringe. Washington, DC: Island Press. Duke, J.M., Johnston, R.J., and T.W. Campson Preserving Farms and Forests in Sussex County, Delaware: Public Value. Food and Resource Economics Research Report 7(2). Freem an, M. 1979a. The Benefits of Environmental Improvement. Baltimore: John Hopkins University Press. Fursueth, O Public Attitudes Toward Local Farmland Protection Program. Growth and Change 18: Geoghegan, J., Lynch, L., and S. Bucholtz Capitalization of Open Spaces into Housing Values and the Residential Property Tax Revenue Impacts of Agricultural Easement Programs. Agricultural and Resource Economics Review 32(1): Halstead, J.M Measuring the Nonmarket Value of Massachusetts Agricultural Land: A Case Study. Journal of Northeastern Agricultural Economics Council 13(1): Heckman, James Sample Selection Bias as a Specification Error. Econometrica 47: Holmes, T.P., and W.L. Adamowicz Attribute Based Methods. In: Champ, P., Boyle, K.J., and T. Brown (eds). A Primer on Nonmarket Valuation. Netherlands: Kluwer Academic Publishers. Johnston, R.J., and J.M. Duke Willingness to Pay for Agricultural Land Preservation and Policy Process Atributes: Does the Method Matter? American Journal of Agricultural Economics 89(4):
68 Kline, J., and D. Wichlens. 1996a. Public Preferences Regarding the Goals of Farmland Preservation Programs. Land Economics 72(4): Kline, J., and D. Wichelns Measuring Heterogeneous Preferences for Preserving Farmland and Open Space. Ecological Economics 26(2): b. Measuring Public Preferences for Environmental Amenities Provided by Farmland. European Review of Agricultural Economics 23(4): Kolstad, C.D Environmental Economics. New York: Oxford University Press. Kreiger, D.J Saving Open Spaces: Public Support for Farmland Protection, WP99-1, DeKalb, IL: Center for Agriculture in the Environment. Louviere, J.L., Hensher, D.A., and J.D. Swait Stated Choice Methods: Analysis and Application. Cambridge, UK: Cambridge University Press. Lusk, J.L., and F.B. Norwood Effect of Experimental Design on Choice- Based Conjoint Valuation Estimates. American Journal of Agricultural Economics 87(3): Lynch, L., and S.J. Lovell Combining Spatial and Survey Data to Explain Participation in Agricultural Land Preservation Programs. Land Economics 79(2): McFadden, D Conditional Logit Analysis of Qualitative Choice Behavior. In Zarembka, P. (ed). Frontiers in Econometrics. New York: Academic Press Meng, C., and P. Schmidt On the Cost of Partial Observability in the Bivariate Probit Model. International Economic Review 26: Nickerson, C.J., and L. Lynch The Effect of Farmland Preservation Programs on Farmland Prices. American Journal of Agricultural Economics 83(2):
69 Paterson, R.W., Boyle, K.J., Ahearn, M., Alberini, A., Bergstrom, J., Libby, L. et al Improved information in support of a national strategy for open land policies: summary of focus group findings summer. Staff Paper, The University of Maine Public preferences for farmland attributes in conservation easement programs. In: Goetz, S.J., Shortle, J.S., and J.C. Bergstrom (eds) In Land Use Problems and Conflicts: Causes, Consequences and Solutions. London: Routledge, Taylor Francis Group. Ch.12. Poirier, D.J Partial Observability in Bivariate Probit Models. Journal of Econometrics 12: Randall, A Resource Economics: An Economic Approach to Natural Resource and Environmental Policy. New York, NY: John Wiley and Son. Randall, A. and J. Stoll Consumer Surplus in Commodity Space. American Economic Review 70: Rosen berger, R.S., and R.G. Walsh Nonmarket Value of Western Valley Ranchland Using Contingent Valuation. Journal of Agricultural and Resource Economics 22(2): Stephenson, K The Role of Information on Mail Contingent Valuation Surveys. MS Thesis, Virginia Tech. Swait, J., and J. Louviere The Role of the Scale Parameter in the Estimation and Comparison of Multinomial Logit Models. J. Marketing Res. 30: U.S. C ensus Bureau State & County Quick Facts. Online. Washington, DC: U.S. Census Bureau. U.S. Congress Farmland Protection Policy Act. Washington, DC: U. S. Congress. U.S. Department of Agriculture Farm Bill. Farms for the Future. Washington, DC: U.S. Department of Agriculture. 61
70 Farm Bill. Federal Agricultural Improvement Act. Washington, DC: U.S. Department of Agriculture Farm Bill. Farm and Ranchland Protection Program. Washington, DC: U.S. Department of Agriculture Farm Bill. Farmland Protection Program. Washington, DC: U.S. Department of Agriculture. Wiebe, K., Tegene, A., and B. Kuhn Partial Interests in Land: Policy Tools for Resource Use and Conservation. Agricultural Economics Report no Washington, DC: US Department of Agriculture, Economic Research Service. Willig, R.D Consumer Surplus Without Apology. American Economic Review 66: Woolridge, J.M Introductory Econometrics: A Modern Approach, 4 th ed. Mason, OH: South-Western. 62
71 Appendix A: Public Opinion Survey 63


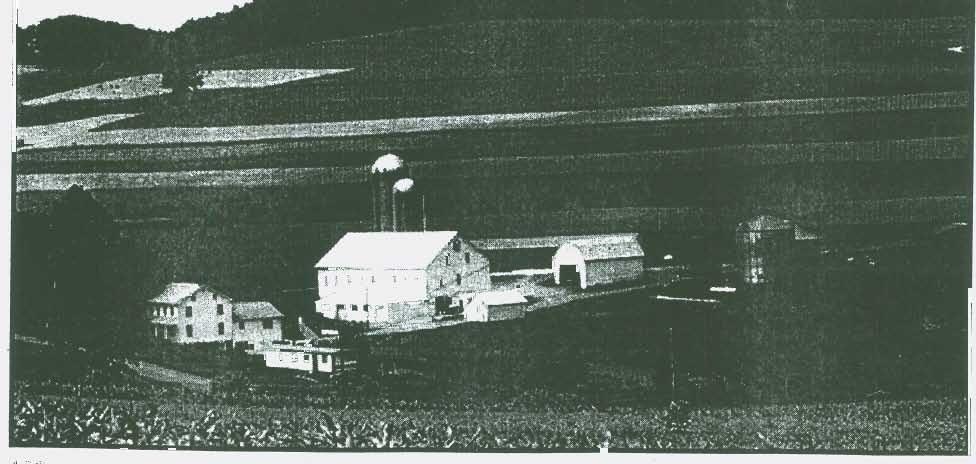


72 64


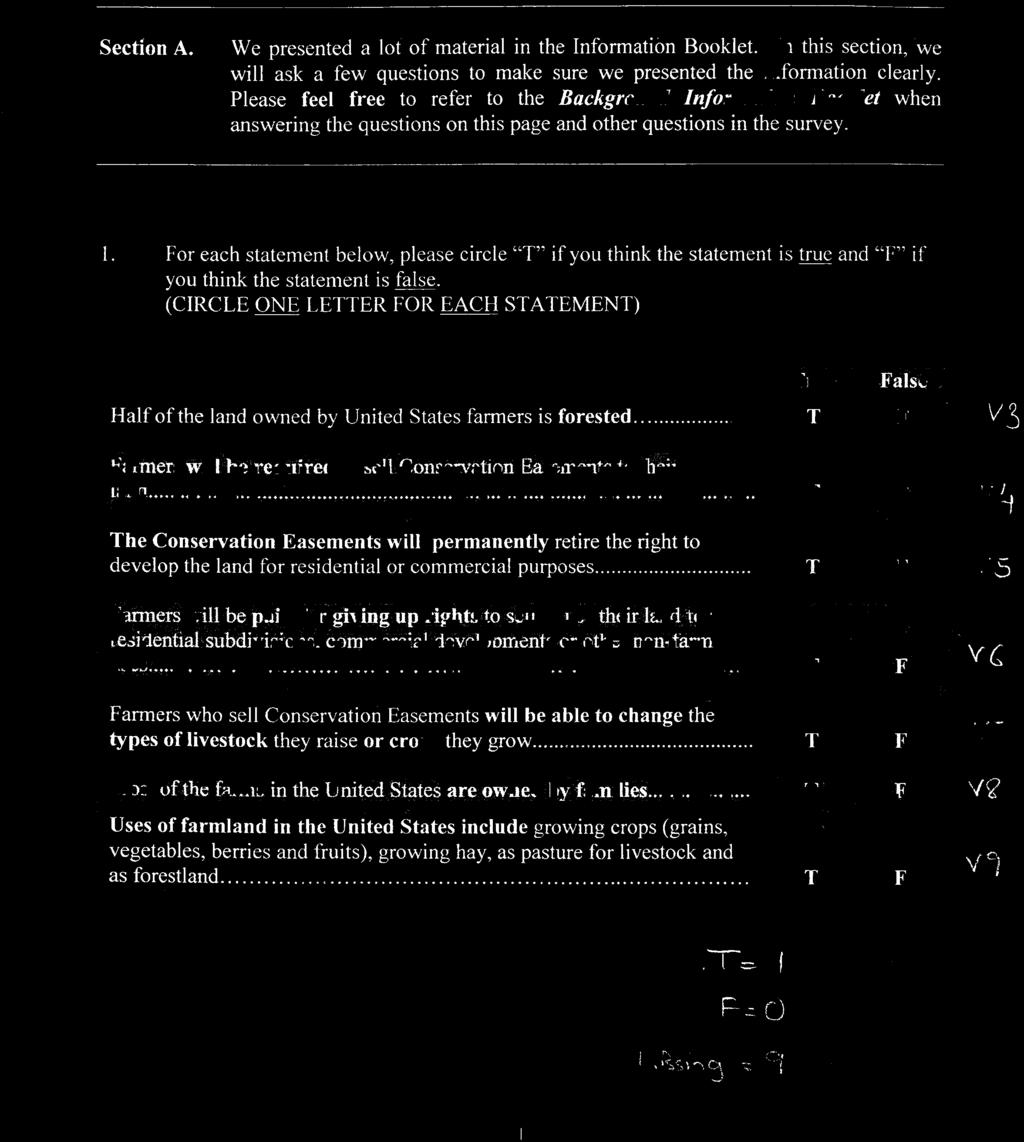
73 65


74 66


75 67


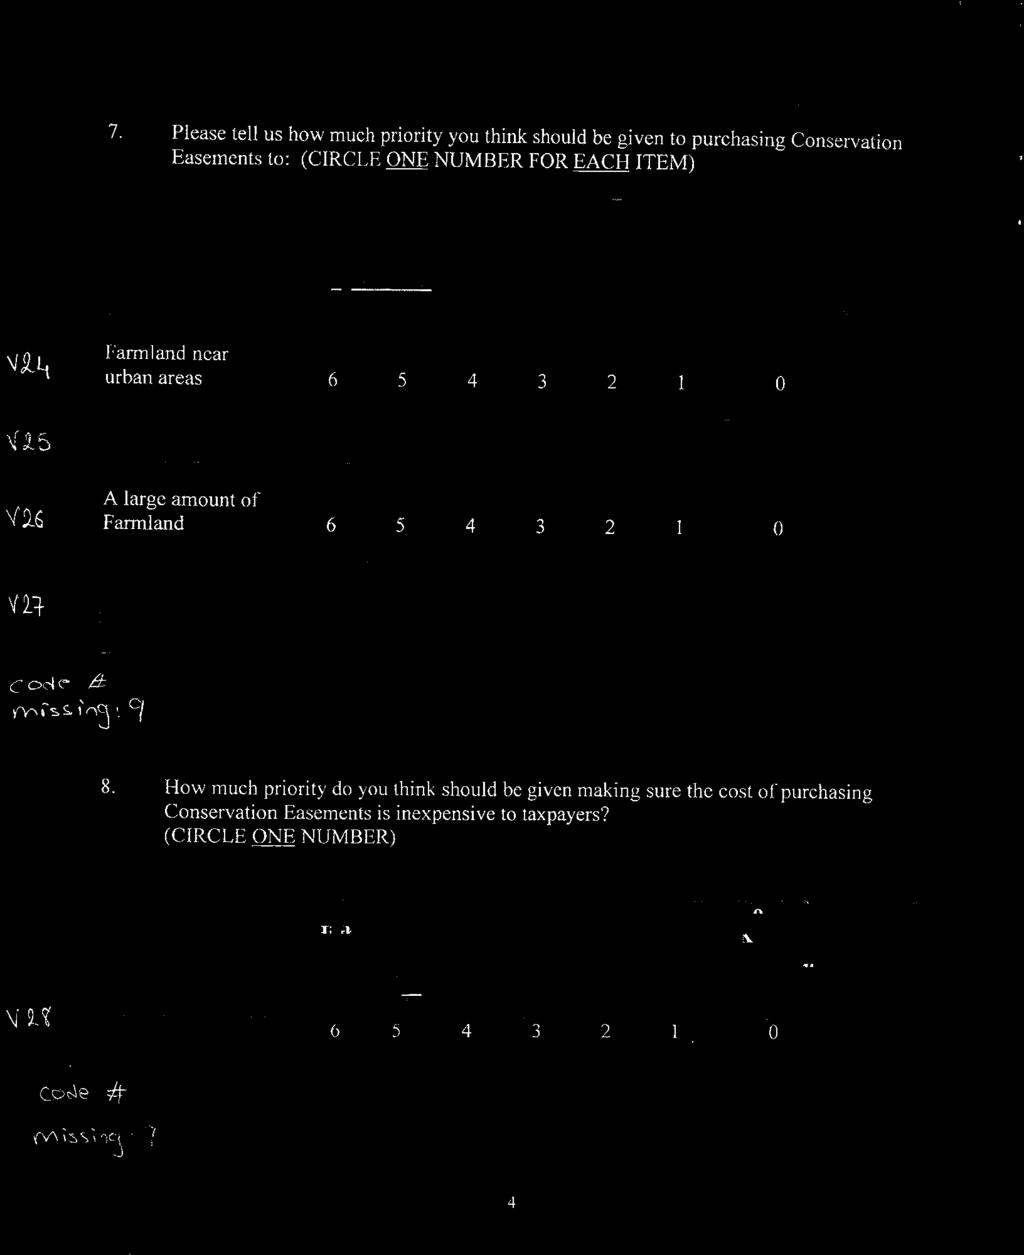
76 68


77 69


78 70

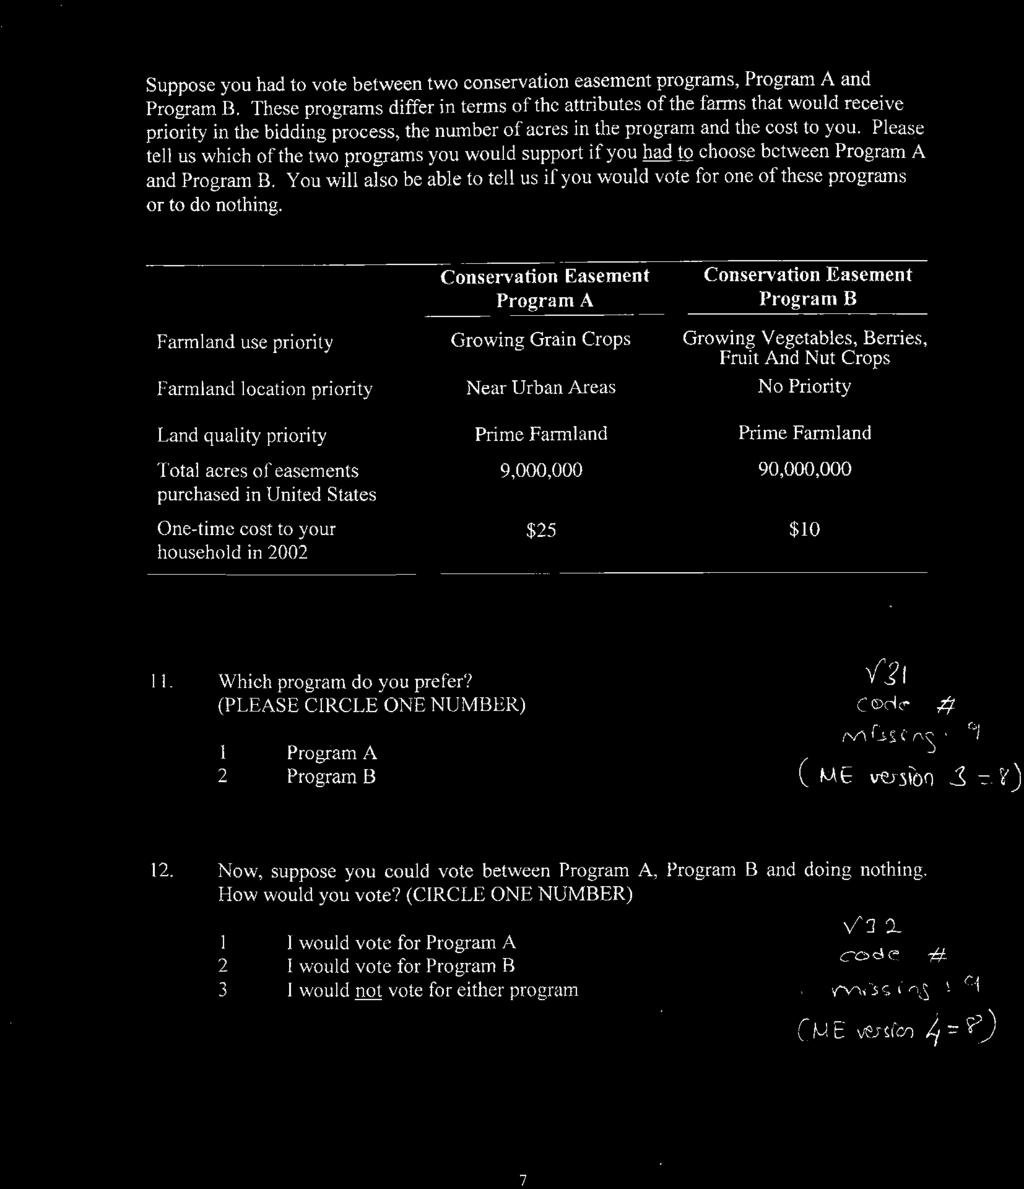
79 71


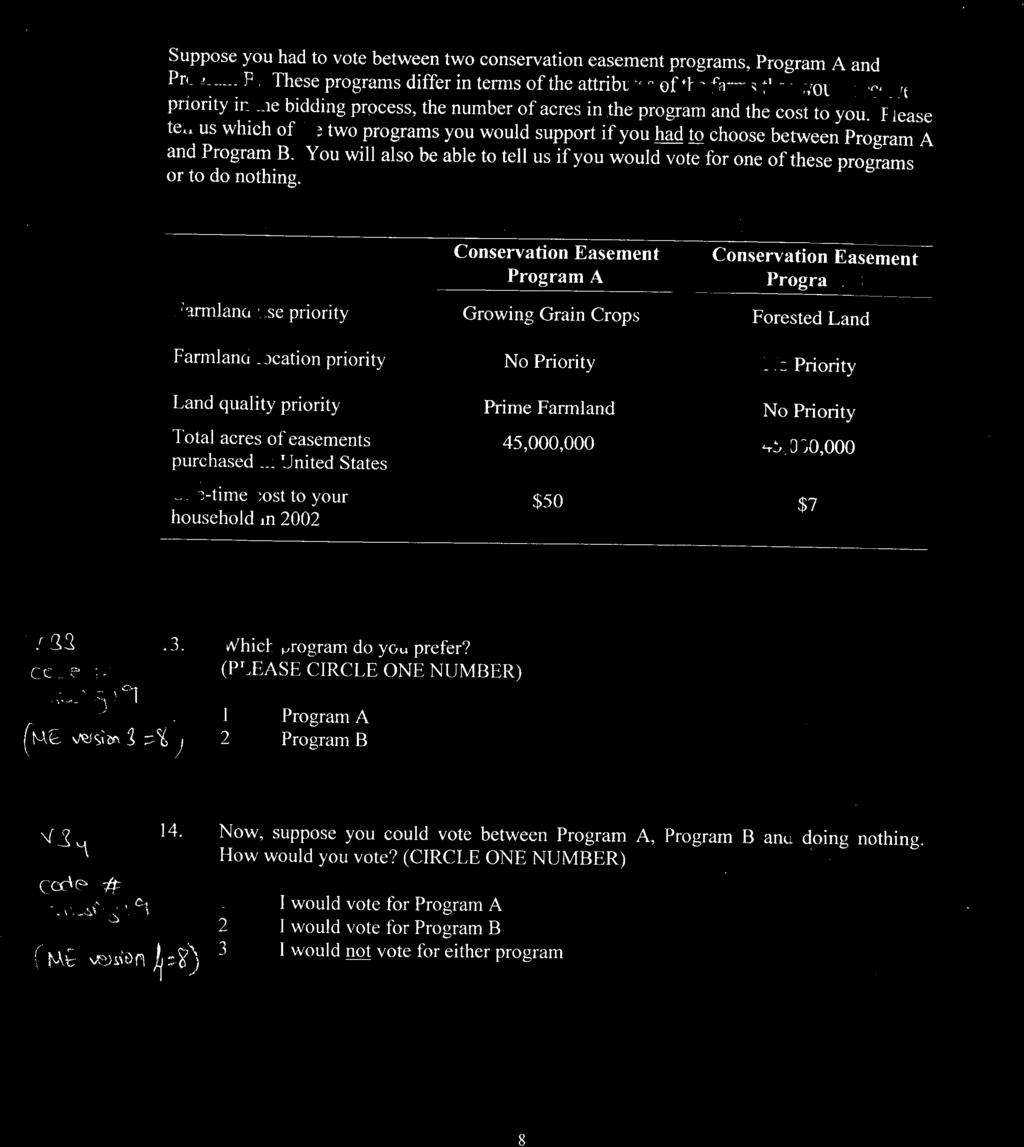
80 72


81 73


82 74


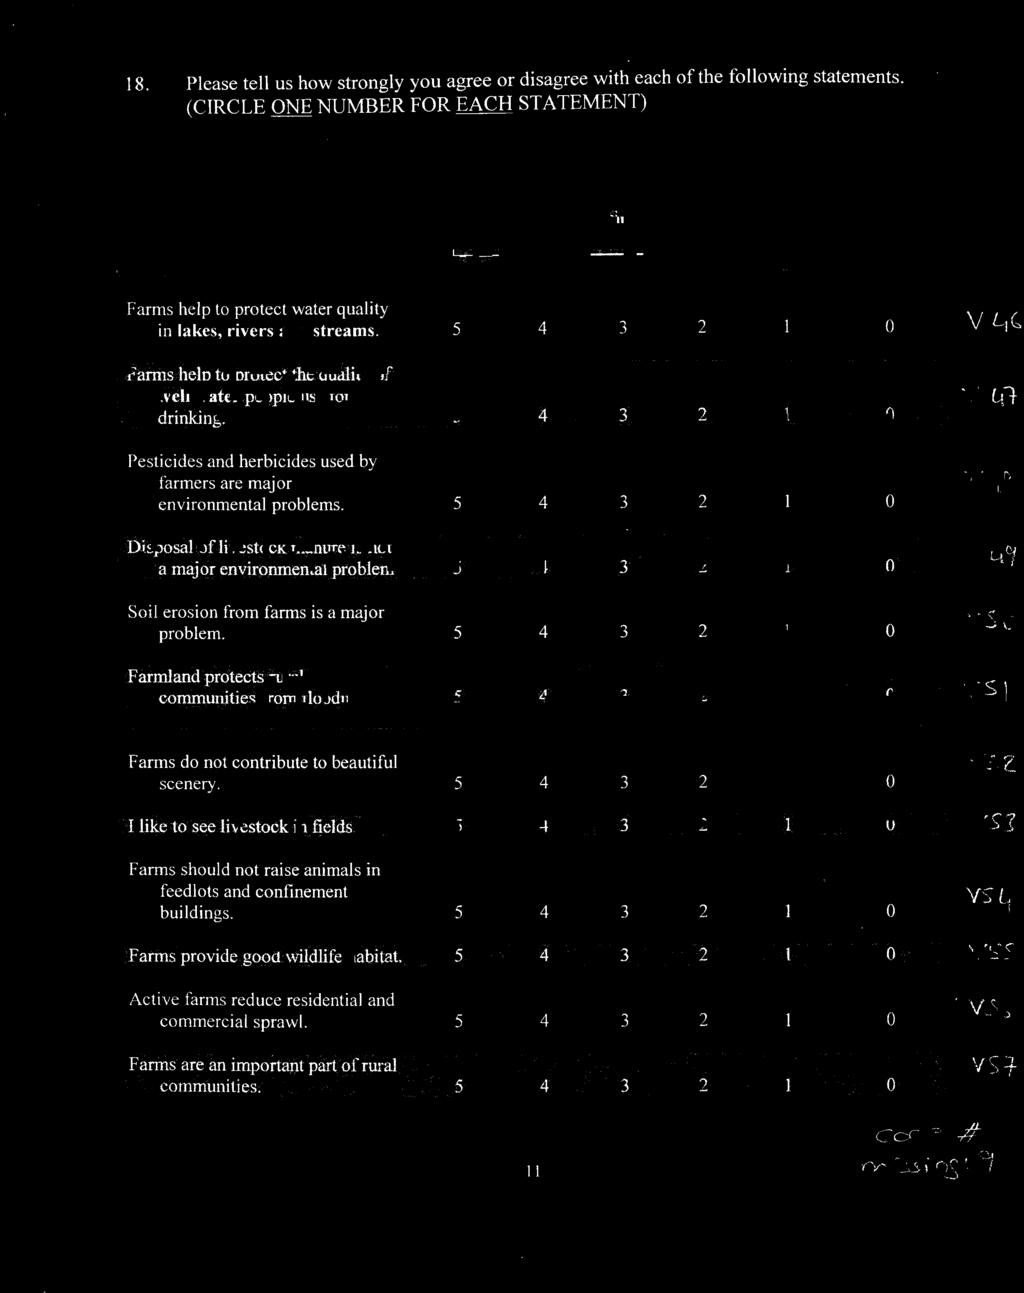
83 75


84 76


85 77
86 78

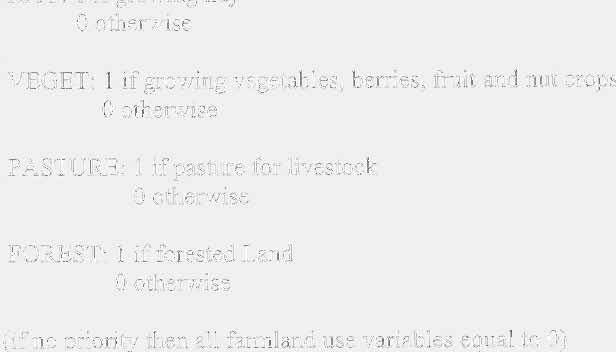


87 79


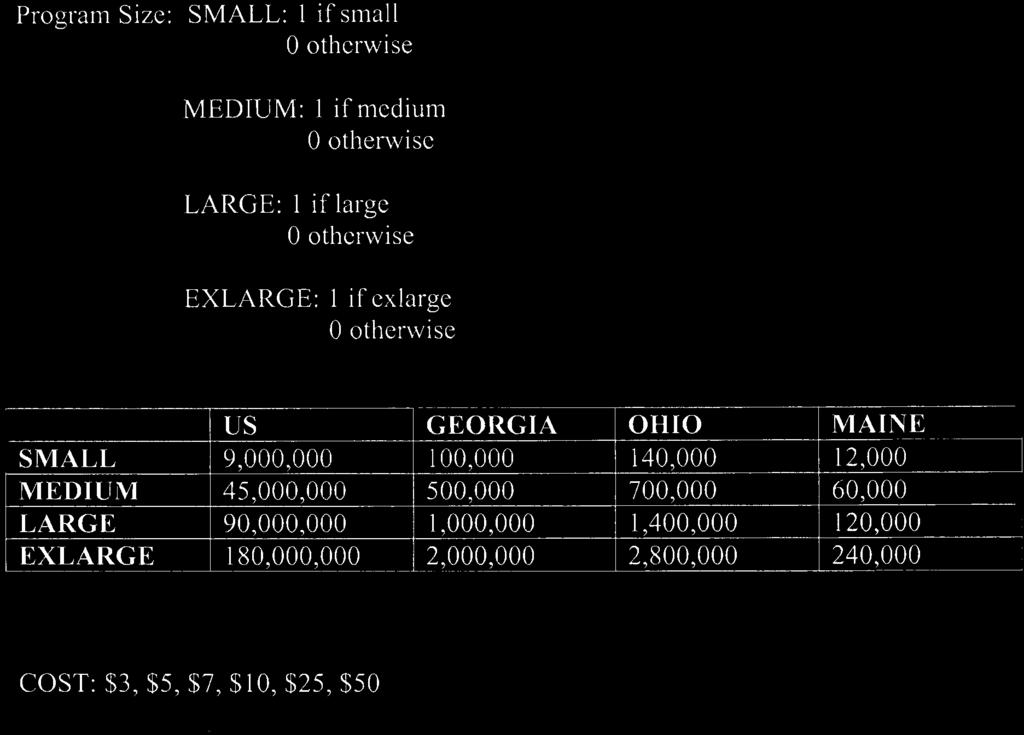
88 80
89 Appendix B: Background Information Booklet 81

90 82
Hedonic Pricing Model Open Space and Residential Property Values
 Hedonic Pricing Model Open Space and Residential Property Values Open Space vs. Urban Sprawl Zhe Zhao As the American urban population decentralizes, economic growth has resulted in loss of open space.
Sorting based on amenities and income
 Sorting based on amenities and income Mark van Duijn Jan Rouwendal m.van.duijn@vu.nl Department of Spatial Economics (Work in progress) Seminar Utrecht School of Economics 25 September 2013 Projects o
AGRICULTURAL CONSERVATION EASEMENT PROGRAM AGRICULTURAL LAND EASEMENTS
 AGRICULTURAL CONSERVATION EASEMENT PROGRAM AGRICULTURAL LAND EASEMENTS OVERVIEW The Agricultural Conservation Easement Program (ACEP) is a voluntary federal conservation program implemented by the USDA
Housing market and finance
 Housing market and finance Q: What is a market? A: Let s play a game Motivation THE APPLE MARKET The class is divided at random into two groups: buyers and sellers Rules: Buyers: Each buyer receives a
Estimating the Value of Foregone Rights on Land. A Working Paper Prepared for the Vermillion River Watershed Joint Powers Organization 1.
 . Estimating the Value of Foregone Rights on Land A Working Paper Prepared for the Vermillion River Watershed Joint Powers Organization 1 July 2008 Yoshifumi Konishi Department of Applied Economics University
METROPOLITAN COUNCIL S FORECASTS METHODOLOGY
 METROPOLITAN COUNCIL S FORECASTS METHODOLOGY FEBRUARY 28, 2014 Metropolitan Council s Forecasts Methodology Long-range forecasts at Metropolitan Council are updated at least once per decade. Population,
RESEARCH BRIEF. Oct. 31, 2012 Volume 2, Issue 3
 RESEARCH BRIEF Oct. 31, 2012 Volume 2, Issue 3 PDR programs affect landowners conversion decision in Maryland PDR programs pay farmers to give up their right to convert their farmland to residential and
Department of Economics Working Paper Series
 Accepted in Regional Science and Urban Economics, 2002 Department of Economics Working Paper Series Racial Differences in Homeownership: The Effect of Residential Location Yongheng Deng University of Southern
Incentives for Spatially Coordinated Land Conservation: A Conditional Agglomeration Bonus
 Incentives for Spatially Coordinated Land Conservation: A Conditional Agglomeration Bonus Cyrus A. Grout Department of Agricultural & Resource Economics Oregon State University 314 Ballard Extension Hall
Factors Affecting Land Trust Agents Preferences for Conservation Easements
 JRAP 42(2): 88-103. 2012 MCRSA. All rights reserved. Factors Affecting Land Trust Agents Preferences for Conservation Easements Eric D. Cropper *, Donald M. McLeod *, Christopher T. Bastian *, Catherine
An Accounting Tradeoff Between WRP and Government Payments. Authors Gregory Ibendahl Mississippi State University
 An Accounting Tradeoff Between WRP and Government Payments Authors Gregory Ibendahl Mississippi State University ibendahl@agecon.msstate.edu Selected Paper prepared for presentation at the Southern Agricultural
METROPOLITAN COUNCIL S FORECASTS METHODOLOGY JUNE 14, 2017
 METROPOLITAN COUNCIL S FORECASTS METHODOLOGY JUNE 14, 2017 Metropolitan Council s Forecasts Methodology Long-range forecasts at Metropolitan Council are updated at least once per decade. Population, households
Selected Paper prepared for presentation at the Southern Agricultural Economics Association s Annual Meetings Mobile, Alabama, February 4-7, 2007
 DYNAMICS OF LAND-USE CHANGE IN NORTH ALABAMA: IMPLICATIONS OF NEW RESIDENTIAL DEVELOPMENT James O. Bukenya Department of Agribusiness, Alabama A&M University P.O. Box 1042 Normal, AL 35762 Telephone: 256-372-5729
Implementation of Permanent Easements and Associated Nutrient Load Reductions
 1 Minnesota Nutrient Reduction Strategy Agricultural Sector/BWSR RIM Program Measure Implementation of Permanent and Associated Nutrient Load Reductions Measure Background Visual Depiction The map in Figure
What Factors Determine the Volume of Home Sales in Texas?
 What Factors Determine the Volume of Home Sales in Texas? Ali Anari Research Economist and Mark G. Dotzour Chief Economist Texas A&M University June 2000 2000, Real Estate Center. All rights reserved.
The Effect of Relative Size on Housing Values in Durham
 TheEffectofRelativeSizeonHousingValuesinDurham 1 The Effect of Relative Size on Housing Values in Durham Durham Research Paper Michael Ni TheEffectofRelativeSizeonHousingValuesinDurham 2 Introduction Real
An Assessment of Current House Price Developments in Germany 1
 An Assessment of Current House Price Developments in Germany 1 Florian Kajuth 2 Thomas A. Knetsch² Nicolas Pinkwart² Deutsche Bundesbank 1 Introduction House prices in Germany did not experience a noticeable
Subtitle H Agricultural Conservation Easement Program
 1 1 1 1 1 1 0 1 0 1 0 Subtitle H Agricultural Conservation Easement Program SEC.. [1 U.S.C. ] ESTABLISHMENT AND PURPOSES. (a) Establishment. The Secretary shall establish an agricultural conservation easement
Additionality in Conservation Easements Programs: Grassland Easements in the Prairie Pothole Region
 Additionality in Conservation Easements Programs: Grassland Easements in the Prairie Pothole Region Jeffrey Savage, USDA-ERS, jsavage@ers.usda.gov Roger Claassen, USDA-ERS Vince Breneman, USDA-ERS Chuck
The Local Government Fiscal Impacts of Land Uses in Union County:
 The Local Government Fiscal Impacts of Land Uses in Union County: Revenue and Expenditure Streams by Land Use Category Jeffrey H. Dorfman and Bethany Lavigno Department of Agricultural & Applied Economics
Northgate Mall s Effect on Surrounding Property Values
 James Seago Economics 345 Urban Economics Durham Paper Monday, March 24 th 2013 Northgate Mall s Effect on Surrounding Property Values I. Introduction & Motivation Over the course of the last few decades
Economic Organization and the Lease- Ownership Decision in Water
 Economic Organization and the Lease- Ownership Decision in Water Kyle Emerick & Dean Lueck Conference on Contracts, Procurement and Public- Private Agreements Paris -- May 30-31, 2011 ABSTRACT This paper
Volume 35, Issue 1. Hedonic prices, capitalization rate and real estate appraisal
 Volume 35, Issue 1 Hedonic prices, capitalization rate and real estate appraisal Gaetano Lisi epartment of Economics and Law, University of assino and Southern Lazio Abstract Studies on real estate economics
The purpose of the appraisal was to determine the value of this six that is located in the Town of St. Mary s.
 The purpose of the appraisal was to determine the value of this six that is located in the Town of St. Mary s. The subject property was originally acquired by Michael and Bonnie Etta Mattiussi in August
CONSERVATION EASEMENTS FREQUENTLY ASKED QUESTIONS
 CONSERVATION EASEMENTS FREQUENTLY ASKED QUESTIONS CCALT Founder and Steamboat rancher, Jay Fetcher notes, You shouldn t even be considering a conservation easement unless two things have happened: (1)
TRANSFER OF DEVELOPMENT RIGHTS
 STEPS IN ESTABLISHING A TDR PROGRAM Adopting TDR legislation is but one small piece of the effort required to put an effective TDR program in place. The success of a TDR program depends ultimately on the
Effects of Zoning on Residential Option Value. Jonathan C. Young RESEARCH PAPER
 Effects of Zoning on Residential Option Value By Jonathan C. Young RESEARCH PAPER 2004-12 Jonathan C. Young Department of Economics West Virginia University Business and Economics BOX 41 Morgantown, WV
Preserving Farms and Forests in Sussex County, Delaware: Public Value
 Preserving Farms and s in Sussex County, Delaware: Public Value Joshua M. Duke, Ph.D. University of Delaware Robert J. Johnston, Ph.D. Tammy Warner Campson University of Connecticut July 2007 This research
GENERAL ASSESSMENT DEFINITIONS
 21st Century Appraisals, Inc. GENERAL ASSESSMENT DEFINITIONS Ad Valorem tax. A tax levied in proportion to the value of the thing(s) being taxed. Exclusive of exemptions, use-value assessment laws, and
Protecting Farmland in Maryland: A Review of the Agricultural Land Preservation Program
 Protecting Farmland in Maryland: A Review of the Agricultural Land Preservation Program Craig Shollenberger Planning Intern (former) Anne Arundel County Maryland INTRODUCTION During the past ten to twelve
Cube Land integration between land use and transportation
 Cube Land integration between land use and transportation T. Vorraa Director of International Operations, Citilabs Ltd., London, United Kingdom Abstract Cube Land is a member of the Cube transportation
Initial sales ratio to determine the current overall level of value. Number of sales vacant and improved, by neighborhood.
 Introduction The International Association of Assessing Officers (IAAO) defines the market approach: In its broadest use, it might denote any valuation procedure intended to produce an estimate of market
Florenz Plassmann DOCTOR OF PHILOSOPHY. Economics. Approved: T.N. Tideman, Chairman. R. Ashley J. Christman. C.Michalopoulos S.
 THE IMPACT OF TWO-RATE TAXES ON CONSTRUCTION IN PENNSYLVANIA by Florenz Plassmann Dissertation submitted to the Faculty of the Virginia Polytechnic Institute and State University in partial fulfillment
The Effects of Land Title Registration on Tenure Security, Investment and Production
 The Effects of Land Title Registration on Tenure Security, Investment and Production Evidence from Ghana Niklas Buehren Africa Gender Innovation Lab, World Bank May 9, 2018 Background The four pathways
Appendix J Agricultural Land Preservation in Other States
 Appendix J Agricultural Land Preservation in Other States Appendix J Agricultural land preservation in other states Many states across the U.S. are working to protect agricultural land from development.
Department of Agricultural and Resource Economics, Fort Collins, CO
 May 2006 EDR 06-03 Department of Agricultural and Resource Economics, Fort Collins, CO 80523-1172 http://dare.colostate.edu/pubs ASSESSING THE TOTAL ECONOMIC VALUE OF RANCHING IN MOUNTAIN COMMUNITIES:
Return on Investment Model
 THOMAS JEFFERSON PLANNING DISTRICT COMMISSION Return on Investment Model Last Updated 7/11/2013 The Thomas Jefferson Planning District Commission developed a Return on Investment model that calculates
How to Read a Real Estate Appraisal Report
 How to Read a Real Estate Appraisal Report Much of the private, corporate and public wealth of the world consists of real estate. The magnitude of this fundamental resource creates a need for informed
Assessment-To-Sales Ratio Study for Division III Equalization Funding: 1999 Project Summary. State of Delaware Office of the Budget
 Assessment-To-Sales Ratio Study for Division III Equalization Funding: 1999 Project Summary prepared for the State of Delaware Office of the Budget by Edward C. Ratledge Center for Applied Demography and
AVM Validation. Evaluating AVM performance
 AVM Validation Evaluating AVM performance The responsible use of Automated Valuation Models in any application begins with a thorough understanding of the models performance in absolute and relative terms.
APPLICATION OF GEOGRAPHIC INFORMATION SYSTEM IN PROPERTY VALUATION. University of Nairobi
 APPLICATION OF GEOGRAPHIC INFORMATION SYSTEM IN PROPERTY VALUATION Thesis Presented by STEPHEN WAKABA GATHERU F56/69748/2013 Supervised by DR. DAVID NYIKA School of Engineering Department of Geospatial
Use of Comparables. Claims Prevention Bulletin [CP-17-E] March 1996
![Use of Comparables. Claims Prevention Bulletin [CP-17-E] March 1996](/thumbs/82/87011536.jpg "Use of Comparables. Claims Prevention Bulletin [CP-17-E] March 1996") March 1996 The use of comparables arises almost daily for all appraisers. especially those engaged in residential practice, where appraisals are being prepared for mortgage underwriting purposes. That
March 1996 The use of comparables arises almost daily for all appraisers. especially those engaged in residential practice, where appraisals are being prepared for mortgage underwriting purposes. That
Taxes and Land Preservation Computing the Capital Gains Tax
 Fact Sheet 780 Taxes and Land Preservation Computing the Capital Gains Tax Many farmers have their wealth tied up in their land and would like to convert some of this land value into cash. Others want
DEMAND FR HOUSING IN PROVINCE OF SINDH (PAKISTAN)
") 19 Pakistan Economic and Social Review Volume XL, No. 1 (Summer 2002), pp. 19-34 DEMAND FR HOUSING IN PROVINCE OF SINDH (PAKISTAN) NUZHAT AHMAD, SHAFI AHMAD and SHAUKAT ALI* Abstract. The paper is an analysis
19 Pakistan Economic and Social Review Volume XL, No. 1 (Summer 2002), pp. 19-34 DEMAND FR HOUSING IN PROVINCE OF SINDH (PAKISTAN) NUZHAT AHMAD, SHAFI AHMAD and SHAUKAT ALI* Abstract. The paper is an analysis
Local Land Markets and Agricultural Preservation Programs
 C:\Documents and Settings\SmartGrowth\Desktop\Lynch and lovell Local Land Markets.doc Chapter # Local Land Markets and Agricultural Preservation Programs Lori Lynch and Sabrina J. Lovell University of
An Examination of Potential Changes in Ratio Measurements Historical Cost versus Fair Value Measurement in Valuing Tangible Operational Assets
 An Examination of Potential Changes in Ratio Measurements Historical Cost versus Fair Value Measurement in Valuing Tangible Operational Assets Pamela Smith Baker Texas Woman s University A fictitious property
concepts and techniques
 concepts and techniques S a m p l e Timed Outline Topic Area DAY 1 Reference(s) Learning Objective The student will learn Teaching Method Time Segment (Minutes) Chapter 1: Introduction to Sales Comparison
SAS at Los Angeles County Assessor s Office
 SAS at Los Angeles County Assessor s Office WUSS 2015 Educational Forum and Conference Anthony Liu, P.E. September 9-11, 2015 Los Angeles County Assessor s Office in 2015 Oversees 4,083 square miles of
2015 ACEP-ALE SUMMARY
 I: Land Eligibility Privately owned Subject to written pending offer (can be in the form of a P&S, letter of commitment, etc.). A pending offer may document a landowner s intent to sell the easement without
Examples of Quantitative Support Methods from Real World Appraisals
 Examples of Quantitative Support Methods from Real World Appraisals Jeffrey A. Johnson, MAI Integra Realty Resources Minneapolis / St. Paul Tony Lesicka, MAI Central Bank 1 Overview of Presentation EXAMPLES
Public incentives and conservation easements on private land
 Public and conservation easements on private land Jordan Suter Colorado State University Sahan Dissanayake Colby College Lynne Lewis Bates College November 2, 2013 Heartland Environmental and Resource
A prequel to using the benefit function to value non-market goods: identifying the implicit price of open space conservation
 A prequel to using the benefit function to value non-market goods: identifying the implicit price of open space conservation 1 Katherine Y Zipp Department of Agricultural and Applied Economics, University
Procedures Used to Calculate Property Taxes for Agricultural Land in Mississippi
 No. 1350 Information Sheet June 2018 Procedures Used to Calculate Property Taxes for Agricultural Land in Mississippi Stan R. Spurlock, Ian A. Munn, and James E. Henderson INTRODUCTION Agricultural land
Waiting for Affordable Housing in NYC
 Waiting for Affordable Housing in NYC Holger Sieg University of Pennsylvania and NBER Chamna Yoon KAIST October 16, 2018 Affordable Housing Policies Affordable housing policies are increasingly popular
2011 ASSESSMENT RATIO REPORT
 2011 Ratio Report SECTION I OVERVIEW 2011 ASSESSMENT RATIO REPORT The Department of Assessments and Taxation appraises real property for the purposes of property taxation. Properties are valued using
Review of the Prices of Rents and Owner-occupied Houses in Japan
 Review of the Prices of Rents and Owner-occupied Houses in Japan Makoto Shimizu mshimizu@stat.go.jp Director, Price Statistics Office Statistical Survey Department Statistics Bureau, Japan Abstract The
Technical Description of the Freddie Mac House Price Index
 Technical Description of the Freddie Mac House Price Index 1. Introduction Freddie Mac publishes the monthly index values of the Freddie Mac House Price Index (FMHPI SM ) each quarter. Index values are
APPENDIX B. Fee Simple v. Conservation Easement Acquisitions NTCOG Water Quality Greenprint - Training Workshops
 APPENDIX B Fee Simple v. Conservation Easement Acquisitions NTCOG Water Quality Greenprint - Training Workshops Lake Arlington Watershed and Lewisville Lake East Watershed June 21, 2011 Presenter Talking
1. There must be a useful number of qualified transactions to infer from. 2. The circumstances surrounded each transaction should be known.
 Direct Comparison Approach The Direct Comparison Approach is based on the premise of the "Principle of Substitution" which implies that a rational investor or purchaser will pay no more for a particular
Cook County Assessor s Office: 2019 North Triad Assessment. Norwood Park Residential Assessment Narrative March 11, 2019
 Cook County Assessor s Office: 2019 North Triad Assessment Norwood Park Residential Assessment Narrative March 11, 2019 1 Norwood Park Residential Properties Executive Summary This is the current CCAO
RESEARCH BRIEF. Jul. 20, 2012 Volume 1, Issue 12
 RESEARCH BRIEF Jul. 2, 212 Volume 1, Issue 12 Do Agricultural Land Preservation Programs Reduce Overall Farmland Loss? When purchase of development rights () programs are in place to prevent farmland from
CONSERVATION EASEMENTS FREQUENTLY ASKED QUESTIONS
 CONSERVATION EASEMENTS FREQUENTLY ASKED QUESTIONS CCALT Founder and Steamboat rancher, Jay Fetcher notes, You shouldn t even be considering a conservation easement unless two things have happened: (1)
Washington Department of Revenue Property Tax Division. Valid Sales Study Kitsap County 2015 Sales for 2016 Ratio Year.
 P. O. Box 47471 Olympia, WA 98504-7471. Washington Department of Revenue Property Tax Division Valid Sales Study Kitsap County 2015 Sales for 2016 Ratio Year Sales from May 1, 2014 through April 30, 2015
Sales Ratio: Alternative Calculation Methods
 For Discussion: Summary of proposals to amend State Board of Equalization sales ratio calculations June 3, 2010 One of the primary purposes of the sales ratio study is to measure how well assessors track
Estimating the Value of the Historical Designation Externality
 Estimating the Value of the Historical Designation Externality Andrew J. Narwold Professor of Economics School of Business Administration University of San Diego San Diego, CA 92110 USA drew@sandiego.edu
Summary of Key Issues from Skagit County TDR Focus Group Meetings January 7, 2014
 Summary of Key Issues from Skagit County TDR Focus Group Meetings January 7, 2014 Overall Observations Some participants, particularly in the development group, emphasized that TDR was taking something
A Note on the Efficiency of Indirect Taxes in an Asymmetric Cournot Oligopoly
 Submitted on 16/Sept./2010 Article ID: 1923-7529-2011-01-53-07 Judy Hsu and Henry Wang A Note on the Efficiency of Indirect Taxes in an Asymmetric Cournot Oligopoly Judy Hsu Department of International
Instructions: Script:
 Before the course, select four of the 11 tool topics to insert into the presentation, including at least one tool from each of the three goal categories. Replace each tool placeholder slide with the slides
Paper for presentation at the 2005 AAEA annual meeting Providence, RI July 24-27, 2005
 NEXT YEAR ON THE U.S. FARMLAND MARKET: AN INFORMATIONAL APPROACH Charles B. Moss, Ashok K. Mishra, And Kenneth Erickson Paper for presentation at the 2005 AAEA annual meeting Providence, RI July 24-27,
Comparative analysis of hedonic rents and maximum bids in a land-use simulation context
 Comparative analysis of hedonic rents and maximum bids in a land-use simulation context Ricardo Hurtubia Francisco Martínez Gunnar Flötteröd Michel Bierlaire STRC 2010 September 2010 STRC 2010 Comparative
EFFECT OF TAX-RATE ON ZONE DEPENDENT HOUSING VALUE
 EFFECT OF TAX-RATE ON ZONE DEPENDENT HOUSING VALUE Askar H. Choudhury, Illinois State University ABSTRACT Page 111 This study explores the role of zoning effect on the housing value due to different zones.
A Real-Option Based Dynamic Model to Simulate Real Estate Developer Behavior
 223-Paper A Real-Option Based Dynamic Model to Simulate Real Estate Developer Behavior Mi Diao, Xiaosu Ma and Joseph Ferreira, Jr. Abstract Real estate developers are facing a dynamic and volatile market
School Quality and Property Values. In Greenville, South Carolina
 Department of Agricultural and Applied Economics Working Paper WP 423 April 23 School Quality and Property Values In Greenville, South Carolina Kwame Owusu-Edusei and Molly Espey Clemson University Public
The Improved Net Rate Analysis
 The Improved Net Rate Analysis A discussion paper presented at Massey School Seminar of Economics and Finance, 30 October 2013. Song Shi School of Economics and Finance, Massey University, Palmerston North,
Innovative Local Government Land Conservation Techniques
 Innovative Local Government Land Conservation Techniques Three new successful land conservation programs used in Maryland by Baltimore and Carroll Counties are worthy of further examination. Baltimore
An Econometric Analysis of Land Development with Endogenous Zoning
 1 2 3 4 5 6 7 8 9 10 11 12 13 14 15 16 17 18 19 20 21 22 23 24 25 26 27 28 29 30 31 32 33 34 35 36 37 38 39 40 41 42 Land Economics, 87(3): 412-432. 2011. An Econometric Analysis of Land Development with
AGENDA ITEM 6. R Meeting No November 13, 2013 AGENDA ITEM. Grazing Tenant Selection for Driscoll and McDonald Ranches
 R-13-103 Meeting No. 13-32 November 13, 2013 AGENDA ITEM AGENDA ITEM 6 Grazing Tenant Selection for Driscoll and McDonald Ranches GENERAL MANAGER S RECOMMENDATION Authorize General Manager to select tenants
STATE OF OHIO FINANCIAL REPORTING APPROACH GASB 34 IMPLEMENTATION ISSUES TRANSPORTATION INFRASTRUCTURE
 TRANSPORTATION INFRASTRUCTURE GASB 34 Reporting Requirements (Paragraphs 19 through 26) Paragraph 19 includes infrastructure assets in the definition of capital assets. Infrastructure assets are defined
FARMLAND AMENITY PROTECTION. A Brief Guide To Conservation Easements
 FARMLAND AMENITY PROTECTION A Brief Guide To Conservation Easements The purpose of this guide is to help landowners access their land amenity value and to provide direction to be compensated for this value.
Ad-valorem and Royalty Licensing under Decreasing Returns to Scale
 Ad-valorem and Royalty Licensing under Decreasing Returns to Scale Athanasia Karakitsiou 2, Athanasia Mavrommati 1,3 2 Department of Business Administration, Educational Techological Institute of Serres,
Is there a conspicuous consumption effect in Bucharest housing market?
 Is there a conspicuous consumption effect in Bucharest housing market? Costin CIORA * Abstract: Real estate market could have significant difference between the behavior of buyers and sellers. The recent
Chapter 52 FARMLAND AND OPEN SPACE PRESERVATION
 Chapter 52 FARMLAND AND OPEN SPACE PRESERVATION [HISTORY: Adopted by the Town Board of the Town of Troy 10-11-1999 by Ord. No. 99-2. Amendments noted where applicable.] GENERAL REFERENCES Building construction
Land Use. Land Use Categories. Chart 5.1. Nepeuskun Existing Land Use Inventory. Overview
 Land Use State Comprehensive Planning Requirements for this Chapter A compilation of objectives, policies, goals, maps and programs to guide the future development and redevelopment of public and private
Impact Of Financing Terms On Nominal Land Values: Implications For Land Value Surveys
 Economic Staff Paper Series Economics 11-1983 Impact Of Financing Terms On Nominal Land Values: Implications For Land Value Surveys R.W. Jolly Iowa State University Follow this and additional works at:
IREDELL COUNTY 2015 APPRAISAL MANUAL
 STATISTICS AND THE APPRAISAL PROCESS INTRODUCTION Statistics offer a way for the appraiser to qualify many of the heretofore qualitative decisions which he has been forced to use in assigning values. In
Determinants of residential property valuation
 Determinants of residential property valuation Author: Ioana Cocos Coordinator: Prof. Univ. Dr. Ana-Maria Ciobanu Abstract: The aim of this thesis is to understand and know in depth the factors that cause
Metro Boston Perfect Fit Parking Initiative
 Metro Boston Perfect Fit Parking Initiative Phase 1 Technical Memo Report by the Metropolitan Area Planning Council February 2017 1 About MAPC The Metropolitan Area Planning Council (MAPC) is the regional
Residential New Construction Attitude and Awareness Baseline Study
 Residential New Construction Attitude and Awareness Baseline Study Real Estate Appraiser Survey Report on Findings Prepared for the New Jersey Residential New Construction Working Group January 2001 Roper
The Effect of Downzoning on Spatial Development Patterns
 The Effect of Downzoning on Spatial Development Patterns David A. Newburn Department of Agricultural and Resource Economics Universy of Maryland 2200 Symons Hall College Park, MD 20742 Email: dnewburn@umd.edu
Relationship of age and market value of office buildings in Tirana City
 Relationship of age and market value of office buildings in Tirana City Phd. Elfrida SHEHU Polytechnic University of Tirana Civil Engineering Department of Civil Engineering Faculty Tirana, Albania elfridaal@yahoo.com
Assessment Year 2016 Assessment Valuations / Mass Appraisal Summary Report
 Assessment Year 2016 Assessment Valuations / Mass Appraisal Summary Report Overview Following up on last year s work, additional work was done cleaning up the sales data. The land valuation model was further
EXPLANATION OF MARKET MODELING IN THE CURRENT KANSAS CAMA SYSTEM
 EXPLANATION OF MARKET MODELING IN THE CURRENT KANSAS CAMA SYSTEM I have been asked on numerous occasions to provide a lay man s explanation of the market modeling system of CAMA. I do not claim to be an
The Honorable Larry Hogan And The General Assembly of Maryland
 2015 Ratio Report The Honorable Larry Hogan And The General Assembly of Maryland As required by Section 2-202 of the Tax-Property Article of the Annotated Code of Maryland, I am pleased to submit the Department
How should we measure residential property prices to inform policy makers?
 How should we measure residential property prices to inform policy makers? Dr Jens Mehrhoff*, Head of Section Business Cycle, Price and Property Market Statistics * Jens This Mehrhoff, presentation Deutsche
Anatomy Of An Appraisal
 Anatomy Of An Appraisal Leslie A. Fields The most important thing to know about an appraisal report is how to review and critique it. Leslie A. Fields a partner with the Law Firm of Faegre & Benson LLP,
The Corner House and Relative Property Values
 23 March 2014 The Corner House and Relative Property Values An Empirical Study in Durham s Hope Valley Nathaniel Keating Econ 345: Urban Economics Professor Becker 2 ABSTRACT This paper analyzes the effect
Farmland and Open Space Preservation Purchase of Development Rights Program Frequently Asked Questions
 Farmland and Open Space Preservation Purchase of Development Rights Program Frequently Asked Questions Why should a community consider farmland preservation programs? Farmland preservation is important
MEASURING THE BENEFITS RETICULATED SEWERAGE: EXPECTATIONS AND EXPERT PROPERTY VALUATION
 MEASURING THE BENEFITS OF RETICULATED SEWERAGE: EXPECTATIONS AND EXPERT PROPERTY VALUATION Prepared by Robert Gillespie 1 1 Robert Gillespie is the Principal of Gillespie Economics (a resource and environmental
THE REAL ESTATE INDUSTRY 3 PERSPECTIVES
 THE REAL ESTATE INDUSTRY 3 PERSPECTIVES When someone says the word real estate what typically comes to mind is physical property - one thinks of houses, an apartment building, commercial offices and other
Chapter 4 An Economic Theory of Property
 Chapter 4 An Economic Theory of Property I. Introduction From an economic perspective, we are interested in how property law influences the allocation of scarce resources and goods and services. An important