SE Michigan Residential Real Estate Recovery Are we there yet or is it over?
|
|
|
- Garey Houston
- 5 years ago
- Views:
Transcription


1 SE Michigan Residential Real Estate Recovery Are we there yet or is it over?

2 Changing View of Residential Transactions


3 Changing View of Residential Transactions 2015 Short Sales 3% Leases Bank 11% Owned 6% Traditional Home Sales 80%
4 January 1992 October 1992 July 1993 April 1994 January 1995 October 1995 July 1996 April 1997 January 1998 October 1998 July 1999 April 2000 January 2001 October 2001 July 2002 April 2003 January 2004 October 2004 July 2005 April 2006 January 2007 October 2007 July 2008 April 2009 January 2010 October 2010 July 2011 April 2012 January 2013 October 2013 July 2014 April % Case-Shiller Metro Detroit Annual Appreciation Rate Trend 20.00% 10.00% 0.00% % % %

5 January 2013 February 2013 March 2013 April 2013 May 2013 June 2013 July 2013 August 2013 September 2013 October 2013 November 2013 December 2013 January 2014 February 2014 March 2014 April 2014 May 2014 June 2014 July 2014 August 2014 September 2014 October 2014 November 2014 December 2014 January 2015 February 2015 March 2015 April 2015 May 2015 June 2015 July 2015 August 2015 September 2015 October 2015 November % Year over year Price Changes by Month Chase-Shiller Metro Detroit 20.00% 15.00% 10.00% 5.00% 0.00%
6 January 1991 November 1991 September 1992 July 1993 May 1994 March 1995 January 1996 November 1996 September 1997 July 1998 May 1999 March 2000 January 2001 November 2001 September 2002 July 2003 May 2004 March 2005 January 2006 November 2006 September 2007 July 2008 May 2009 March 2010 January 2011 November 2011 September 2012 July 2013 May 2014 March Case-Shiller Metro Detroit Value Index Trend 85%+- Back to Peak 2006 Values
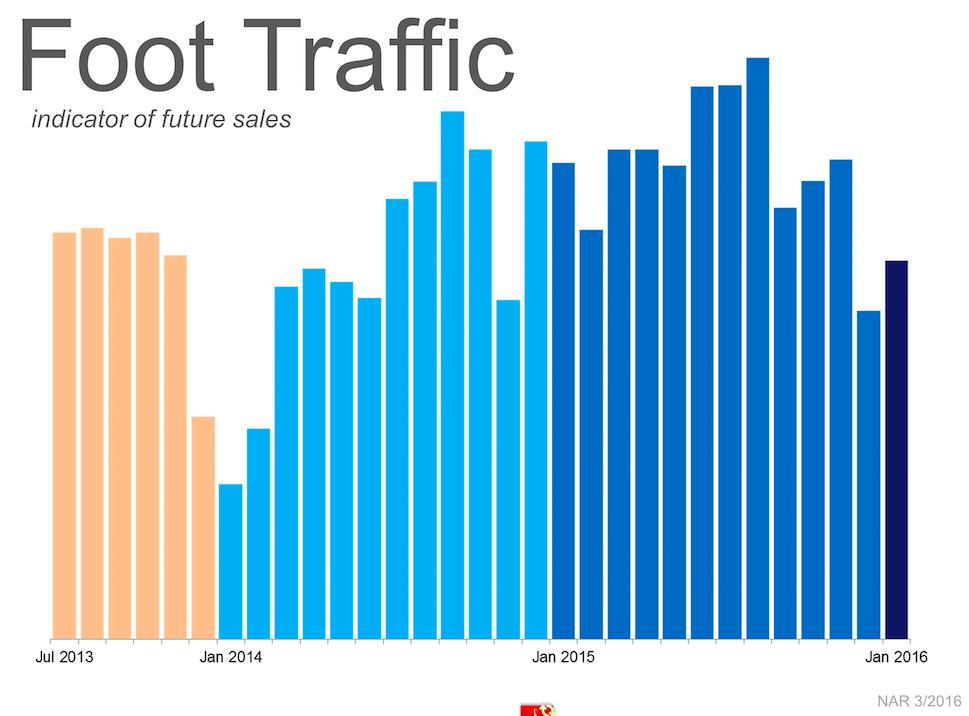
7
8

9 Metro New Construction Starts Census Detroit-Warren-Livonia New Construction Starts - Census Bureau - Detroit-Warren-Livonia
10 Single Family New Construction Summary SE Michigan Peak Permits: ,808 Bottom of Market: ,333 permits 94% drop in permits peak to bottom ,217 permits - 33% back to peak Historical Average around 14,000 permits
11
12

13 Median Years of Homeowner Tenure before Moving Pent-Up Seller Demand Forbes
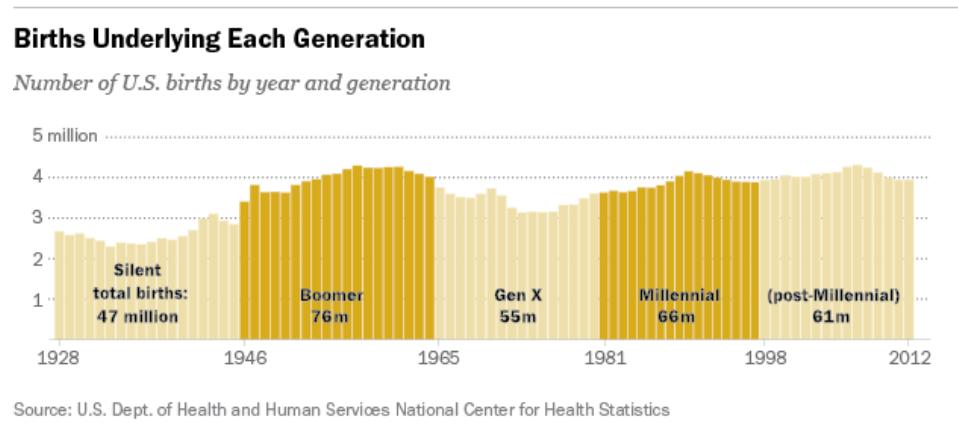
14 DEMOGRAPHICS SET THE TABLE Population and Its Characteristics Define the Future 5,000,000 4,500,000 4,000,000 3,500,000 3,000,000 2,500,000 2,000,000 1,500,000 1,000, ,000 0 US Live Births by Year and Generation Boom X Y Z Source: US National Center for Health Statistics
15 Q Q Q Q Q Q Q Q Q Q Q Q Q Q Q Q Q Q Q Q Q Q Q Q Q Q Q Q Q HOUSEHOLDS ARE GROWING BUT SO ARE RENTERS Causing Homeownership rates to fall below historical averages Households and Home Ownership 120, , , , ,000 95,000 Households Home Ownership Rate , Source: Commerce Department
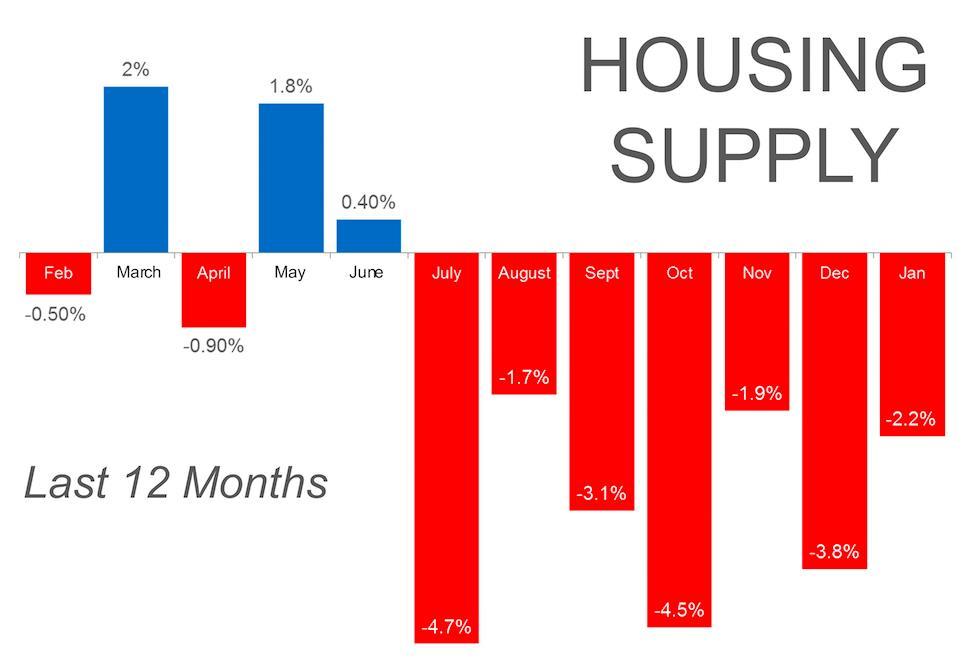
16 More Buyers than Listings At or above list price 22% of the time Listing Inventory Still Declining, but the decline is slowing 31% Selling in 10 days or less, 54% in 30 days or less Still a few more Buyers than sellers but balancing At or above list price 17% of the time Listing Inventory Rising 24% Selling in 10 days or less, 63% in 30 or less Listings increasing faster than buyers Listing inventory rising At or above list price 17% of the time 13% Selling in 10 days or less and 23% in 30 or less

17 Months Supply of Inventory by Age of Listing Oakland County $0-250K $ K $500K+ 0 Overall 0-10 days days Over 90 Days

18 Market Velocity Indicators
19 15.00% Oakland County Price per Square Foot Trend 10.00% 5.00% 0.00% Feb-15 Mar-15 Apr-15 May-15 Jun-15 Jul-15 Aug-15 Sep-15 Oct-15 Nov-15 Dec-15 Jan-16 Feb % % % % Per SF $500k+ Per SF $ k Per SF under $250k
20 15.00% Oakland County Value Per Square Foot $1,000,000 Year over Year Trend 10.00% 5.00% 0.00% -5.00% % % % Oakland $1mm + Per SF Trend
21 15% Selected Cities $ Per Square Foot Trends Year over Year Change 10% 5% 0% -5% -10% -15% WB/FH $ Per SF Trend RO $ Per SF Trend Birm Area $ Per SF Trend Troy $ Per SF Trend
22 2016 SE MI Housing Forecast Under $250K $ K Over $500K Home Sales +2% +4% +2% Listings Inventory -1% to 2% +7 to 10% +12 to 17% Appreciation +5% +2% -2 to 0% Interest Rates 4.0% to 4.75%
23 Thank You
24
25 Housing Headwinds Regulation Dodd/Frank: CFPB and TRID (Consumer Financial Protection Bureau and Truth-in-Lending Integrated Disclosure) Slow wage growth International economic uncertainty Low For Sale inventories at key price points Housing Affordability is getting tighter Moving from a Recovery to a Normalized Market
26 Housing Tail Winds Low Interest Rates (International Uncertainty) Steady employment and wage growth Household Formation growth (Gen X&Y as homeowners Moving back to historical homeownership rates Low Inventories pushing up equities, releasing pent up Sellers
27 Hot and still hot - but less so markets Hot - Starter markets Gen X & Y Inner Ring and Urban Markets - Royal Oak bungalow, Midtown Loft Strong but less hot Where Boomers hang out - Outer Ring Suburban Markets - Milford or Rochester Hills - 4 bedroom colonial
28 City of Detroit Summary
29 80% Detroit Sale Price Distribution 76% 70% 60% 59% 50% 40% 30% Feb/Mar 16 Mar/April 14 20% 10% 0% 19% 10% 9% 2% 3% 11% 6% 5% Under $1000 $1k-25K $26-50K $51-100K Over $100K
30

31 2.00% 1.50% Appraiser Home Value Opinions Compared to Homeowner Estimates 1.43% 1.00% 0.50% 0.00% -0.50% -1.00% -1.50% 0.18% -0.13% -0.40% -0.69% -1.15% -1.40% -2.00% -2.50% -3.00% -2.33% -2.65% -2.00% -1.98% -1.87% -1.80% -1.75% Jan Feb Mar April May June July Aug Sept Oct Nov Dec Jan Feb 1.43% 0.18% -0.13% -0.40% -0.69% -1.15% -1.40% -2.33% -2.65% -2.00% -1.98% -1.87% -1.80% -1.75%
32 60.00% Oakland County Over $500,000 Homes For Sale and Sold Year over Year % Change Trends 50.00% 40.00% 30.00% 20.00% 10.00% 0.00% % Homes for Sale Trend Homes Sold Trend
33 25.0% Oakland County - Under $250,000 Homes For Sale and Sold Year over Year % Change Trends 20.0% 15.0% 10.0% 5.0% 0.0% -5.0% -10.0% -15.0% -20.0% Homes For Sale Trend Homes Sold Trend
34 50.0% 45.0% 40.0% 35.0% 30.0% 25.0% 20.0% 15.0% 10.0% 5.0% 0.0% Oakland County $250,000 - $500,000 Homes For Sale and Sold Year over Year % Change Trends Homes for Sale Trend Homes Sold Trend
35 50% Selected Oakland Cities - For Sale Inventory Trends Year over Year Comparison 40% 30% 20% 10% 0% -10% -20% -30% -40% WB/FH RO Area Birm Area Troy
36
37

38 Case Shiller Year-Over-Year PRICE CHANGES 20 City Composite S&P Case Shiller 1/2016
39
40 Homeowners Renters 67% Living with Parents
41 Feb-14 Mar-14 Apr-14 May-14 Jun-14 Jul-14 Aug-14 Sep-14 Oct-14 Nov-14 Dec-14 Jan-15 Feb-15 Mar-15 Apr-15 May-15 Jun-15 Jul-15 Aug-15 Sep-15 Oct-15 Nov-15 Dec-15 Jan-16 Feb Oakland County $250,000 - $500,000 For Sale and Under Contract Trends Properties Under Contract Trend Listing Inventory Trend
42 Feb-14 Mar-14 Apr-14 May-14 Jun-14 Jul-14 Aug-14 Sep-14 Oct-14 Nov-14 Dec-14 Jan-15 Feb-15 Mar-15 Apr-15 May-15 Jun-15 Jul-15 Aug-15 Sep-15 Oct-15 Nov-15 Dec-15 Jan-16 Feb Oakland County Over $500,000 - For Sale and Under Contract Trends Properties Under Contract Trend Listing Inventory Trend
43 Feb-14 Mar-14 Apr-14 May-14 Jun-14 Jul-14 Aug-14 Sep-14 Oct-14 Nov-14 Dec-14 Jan-15 Feb-15 Mar-15 Apr-15 May-15 Jun-15 Jul-15 Aug-15 Sep-15 Oct-15 Nov-15 Dec-15 Jan-16 Feb Oakland County For Sale and Under Contract Trends Under $250, Properties Under Contract Trend Listing Inventory Trend
44 Homeowners Renters 60% 67% Living with Parents
45 First Time Home Buyers 52.9 % of all buyers were first time buyers last month according to the First-Time Buyer Mortgage Share Index by AEI s International Center on Housing Risk AEI s International Center on Housing Risk
46
47

48 Percentage of Homes with Positive Equity by State CoreLogic
49 Number of Households in millions Census

50 Homeownership Rates 1995-Today Census
Minneapolis St. Paul Residential Real Estate Index
 University of St. Thomas Minneapolis St. Paul Residential Real Estate Index September 2017 Welcome to the latest edition of the UST Minneapolis St. Paul Residential Real Estate Index. The University of
With last month's gain, sales are now up 4.5% from May 2015 and are at their highest annual pace since February 2007.
 JULY 2016 With last month's gain, sales are now up 4.5% from May 2015 and are at their highest annual pace since February 2007. - Lawrence Yun NAR s Chief Economist Now in its seventh year, the US economic
MARKET STRATEGY VIEWPOINT U.S. Housing Decelerating
 Jan-01 Oct-01 Jul-02 Apr-03 Jan-0 Oct-0 Jul-05 Apr-0 Jan-07 Oct-07 Jul-08 Apr-09 Jan-10 Oct-10 Jul-11 Apr-12 Jan-13 Oct-13 Jul-1 Apr-15 Jan-1 Oct-1 Jul-17 Apr-18 U.S. Housing Decelerating August 27, 2018
THE OUTLOOK FOR HOUSING IN ILLINOIS
 THE OUTLOOK FOR HOUSING IN ILLINOIS Jonathan Smoke Chief Economist January 25, 2017 NATIONAL TRENDS 2 2000.01 2000.05 2000.09 2001.01 2001.05 2001.09 2002.01 2002.05 2002.09 2003.01 2003.05 2003.09 2004.01
MLS of Greater Cincinnati - Charts for the Month: November 2017
 MLS of Greater Cincinnati - Charts for the Month: November 2017 The following charts provide an overview of what has occurred in the MLS over the past month. Each chart provides a historical trend. The
National Housing Trends
 National Housing Trends 34% America s Choice of Best Long Term Investment 26% 17% 15% 6% Real Estate Stocks / Mutual Funds Gold Savings Accounts / CDs Bonds Gallup 2018 Housing Affordability 197 Index
SFR Condo Residential Lot Sales Inventory Sales Inventory Sales Inventory. Month YTD Month Month YTD Month Month YTD Month
 Grand Strand Market Report 2017 capped off a great year for the Grand Strand as full year SFR sales volume and median sales price were up 9.8% and 4.3%, respectively. Condo sales activity increased 3.0%
MARKET OUTLOOK FOR SAN MATEO
 MARKET OUTLOOK FOR SAN MATEO Jonathan Smoke Chief Economist August 2, 2016 NATIONAL TRENDS 2 JOB CREATION REBOUNDED IN JUNE 229,000 jobs created by month in 2015; 172,000 average this year Employment and
2018 Real Estate Forecast Breakfast. Real Estate Market Update
 2018 Real Estate Forecast Breakfast Central Oregon Association of REALTORS Real Estate Market Update Paul C. Bishop, PhD, CBE Vice President, Research NATIONAL ASSOCIATION OF REALTORS February 22, 2018
Housing Price Forecasts. Illinois and Chicago PMSA, December 2015
 Housing Price Forecasts Illinois and Chicago PMSA, December 2015 Presented To Illinois Association of Realtors From R E A L Regional Economics Applications Laboratory, Institute of Government and Public
California Housing Market Update. Monthly Sales and Price Statistics November 2018
 California Housing Market Update Monthly Sales and Price Statistics November 2018 Home Sales: Largest Decline Since 2014 California, November 2018 Sales: 381,400 Units, -4.6% YTD, -13.4% YTY 700,000 600,000
Monthly Indicators + 4.8% - 3.5% %
 Monthly Indicators 2015 New Listings were up 45.0 percent for single family/duplex homes but decreased 44.1 percent for townhouse-condo properties. Pending Sales increased 14.3 percent for single family/duplex
California Housing Market Update. Monthly Sales and Price Statistics December 2018
 California Housing Market Update Monthly Sales and Price Statistics December 2018 Sales Reached the Lowest Level since Jan 2015 California, December 2018 Sales: 372,260 Units, -5.2% YTD, -11.6% YTY 700,000
September 2018 MLS Statistical Report
 September 218 MLS Statistical Report Total Sales Blame it on Hurricane Florence but overall, sales dropped drastically in August - down 17%. Total Sales Sept'18 172-17% Sept'17 26-2% Sept'16 211 7% 3 2
Monthly Indicators + 7.3% + 6.6% + 8.3% Single-Family Market Overview Condo Market Overview New Listings Pending Sales.
 Monthly Indicators 2018 The three most prominent national market trends for residential real estate are the ongoing lack of abundant inventory, the steadily upward movement of home prices and year-over-year
California Housing Market Update. Monthly Sales and Price Statistics October 2018
 California Housing Market Update Monthly Sales and Price Statistics October 2018 Sales Had the 2 nd Largest Drop in the Last 6 Months California, October 2018 Sales: 397,060 Units, -3.7% YTD, -7.9% YTY
California Housing Market Update. Monthly Sales and Price Statistics September 2018
 California Housing Market Update Monthly Sales and Price Statistics September 2018 Sales Had the Largest Decline since March 2014 California, September 2018 Sales: 382,550 Units, -3.3% YTD, -12.4% YTY
Economic and Housing Market Outlook ( ) October 31, Contra Costa AOR
 October 31, Contra Costa AOR") Economic and Housing Market Outlook (2012 2013) Contra Costa AOR October 31, 2012 Oscar Wei Senior Research Analyst California Association of REALTORS Overview US and California Economies California Housing
Economic and Housing Market Outlook (2012 2013) Contra Costa AOR October 31, 2012 Oscar Wei Senior Research Analyst California Association of REALTORS Overview US and California Economies California Housing
Phoenix, Central and Northern Arizona
 Phoenix, Central and Northern Arizona End of Year Housing Report 1-8-354-5664 LongRealty.com 217 End of Year Housing Report SALES & INVENTORY Housing market trends For the overall real estate market in
California Housing Market Update. Monthly Sales and Price Statistics August 2018
 California Housing Market Update Monthly Sales and Price Statistics August 2018 Sales Declined for the 4 th Consecutive Month California, August 2018 Sales: 399,600 Units, -2.1% YTD, -6.6% YTY 700,000
Monthly Indicators % % - 3.5%
 Monthly Indicators 2017 New Listings were up 6.3 percent for the category but decreased 33.1 percent for the category. Pending Sales increased 5.0 percent for but decreased 1.3 percent for. The Median
May 2013 April 2013 May 2012 Manhattan Condo Index 2,106 2, % 1, %
 Market Report NOTICE: StreetEasy is pleased to present our 2013 Q2 Quarterly Report on the residential market. This preview version of the report is based on over 1,000 broker sources and will provide
CALGARY REGIONAL HOUSING MARKET STATISTICS 12.14
 CALGARY REGIONAL HOUSING MARKET STATISTICS 12.14 Yearly records set as monthly sales see slight decline Condominium and townhouse sales set a new record for 214 Calgary, January 2, 215 It was a record
TUCSON and SOUTHERN ARIZONA
 TUCSON and SOUTHERN ARIZONA End of Year Housing Report (52) 818-454 Stephen@TeamWoodall.com 217 End of Year Housing Report SALES & INVENTORY Housing market trends For the overall real estate market in
2017 RESIDENTIAL REAL ESTATE MARKET REPORT
 2017 RESIDENTIAL REAL ESTATE MARKET REPORT Published January 26, 2018 Our market reports have been focused on the effects of low inventory on our housing market and for good reason. December 2017 marked
Housing Bulletin Monthly Report
 December 21 1 Housing Bulletin Monthly Report Alberta Housing Starts Fall in November 21 Canada Housing Starts 25 2 15 1 5 8 NOV 8 DEC 8 Preliminary Housing Starts in Alberta* and Canada* November 28 to
Monthly Indicators % % - 9.2%
 Monthly Indicators 2016 New Listings were down 1.4 percent for single family/duplex homes and 25.0 percent for townhouse-condo properties. Pending Sales increased 58.3 percent for single family/duplex
Aug. Aug 2018 ust 2018
 August 18 MONTHLY STATISTICS PACKAGE City of Calgary Unemployment rate slows housing market recovery 18 City of Calgary, September, 18 Easing sales, gains in new listings and elevated inventory levels
Jim & Jim McKenna LBA & LSA TheJims.com
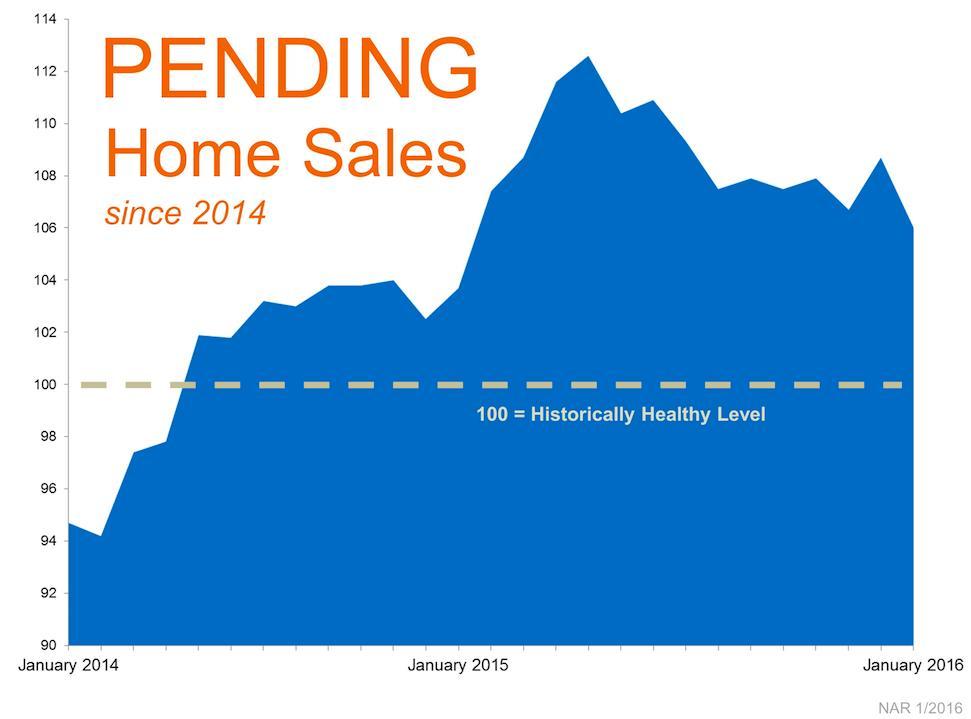
 Jim & Jim McKenna LBA & LSA 631-974-9151 TheJims.com Return on Investment January 2000 March 2013 MSN Money.com, Case Shiller Pending Home Sales 110 105 100 95 90 Jan Feb Mar Apr May Jun Jul Aug Sep Oct
2018 Housing Market Outlook. Central Coast Realty Group Business Symposium February 22, 2018 Oscar Wei Senior Economist
 2018 Housing Market Outlook Central Coast Realty Group Business Symposium February 22, 2018 Oscar Wei Senior Economist Overview Economic Update California Housing Market Outlook Regional Housing Market
Santa Clara County Real Estate Market Overview Dynamics
 Santa Clara County Real Estate Market Overview Dynamics Data from sources deemed reliable, but may contain errors and subject to revision. All numbers should be considered approximate. Jan-90 Sep-90 May-91
Monthly Indicators % % %
 Monthly Indicators 2016 Percent changes calculated using year-over-year comparisons. New Listings were down 27.6 percent for single family homes and 41.8 percent for townhouse-condo properties. Pending
Monthly Indicators % + 9.7% %
 Monthly Indicators 2016 Percent changes calculated using year-over-year comparisons. New Listings were up 11.1 percent for single family homes and down 30.8 percent for townhouse-condo properties. Pending
A A p p r ril 2017
 April 17 17 Housing market retains momentum in April Citywide prices hold steady as labour market improves City of Calgary, May 1, 17 Calgary s housing market continued to show signs of stability in April.
Scott Market Report Stronger Sales Continue
 June 20 Scott Market Report Stronger Sales Continue The Outer Banks real estate market is seeing good signs in most market segments. After a somewhat slow start to 20, sales agreements picked up significantly
Housing Price Forecasts. Illinois and Chicago PMSA, October 2014
 Housing Price Forecasts Illinois and Chicago PMSA, October 2014 Presented To Illinois Association of Realtors From R E A L Regional Economics Applications Laboratory, Institute of Government and Public
AAug ugust 2017
 August 17 17 Housing recovery a balancing act Growth in new listings outpaced sales preventing inventory declines City of Calgary, September 1, 17 Sales posted a modest gain in August, but a rise in new
Dec December 2018
 December MONTHLY STATISTICS PACKAGE Job market weakness and lending restrictions a common thread in s housing market, January, 19 As oversupply continues in Calgary s housing market, December prices eased
REAL ESTATE MARKET REVIEW
 MULTIFAMILY 2014 HAMPTON ROADS REAL ESTATE MARKET REVIEW Author Charles Dalton Data Analysis Real Data Financial Support The E.V. Williams Center for Real Estate and Economic Development (CREED) functions
Outlook for Median Home Selling Prices. United States data are useless for us.
 Outlook for Median Home Selling Prices Outline United States Data Unobserved Prices The Future of California s Median Home Price Bill Watkins August 28, 28 2.% Existing Single-family Housing Sales percent
An Introduction to RPX INTRODUCTION
 An Introduction to RPX INTRODUCTION Radar Logic is a real estate information company based in New York. We convert public residential closing data into information about the state and prospects for the
Housing Bulletin Monthly Report
 October 21 1 Housing Bulletin Monthly Report Housing Starts show Slight improvement in September CANADA Housing Starts 2, 15, 1, 5, Sep 8 Oct 8 Nov 8 Dec 8 Preliminary Housing Starts in Alberta and Canada
Housing Market Cycles
 MEGA AGENT Market Update Gary Keller and Jay Papasan 2 The U.S. Housing Market Keller Williams Realty, Inc. Housing Market Cycles 4 The U.S. Housing Market Housing Market Cycles 5 The U.S. Housing Market
May 2008 MLS Month in Review
 May 28 MLS Month in Review The Albuquerque Market continues to improve, and it s evident that finally, the negative media is turning into positive media. This month s TOP Selling Price Range is $2K to
Real gross domestic product California vs. United States
 Real gross domestic product California vs. United States Percent change, year ago 6 4 U.S. California 2 0-2 -4-6 2001 2002 2003 2004 2005 2006 2007 2008 2009 2010 2011 Source: Bureau of Economic Analysis.
Patience required in Calgary's housing market recovery Jul. 2018
 July 18 MONTHLY STATISTICS PACKAGE City of Calgary Patience required in Calgary's housing market recovery 18 City of Calgary, August 1, 18 Recent struggles in the job market, accompanied by yet another
CALIFORNIA ECONOMIC & MARKET OUTLOOK. October 29,2014 Contra Costa Association of REALTORS Leslie Appleton Young, Chief Economist
 2014 2015 CALIFORNIA ECONOMIC & MARKET OUTLOOK October 29,2014 Contra Costa Association of REALTORS Leslie Appleton Young, Chief Economist OVERVIEW Economic Outlook California Housing Market Outlook Housing
Economic Spotlight September 1, 2009
 Economic Spotlight September 1, 29 Update on Alberta s Housing Market Summary Alberta s housing market is beginning to show signs of recovery. Housing starts have rebounded from March lows and activity
Puerto Rico Housing Finance Authority Housing Stimulus Programs
 Puerto Rico Housing Finance Authority Housing Stimulus Programs March 31, 2012 (Final with US Data) Total sales assisted by PRHFA stimulus from $240MM Fund Assignment As of March 31, 2012 Silent Second
Housing Price Forecasts. Illinois and Chicago PMSA, April 2013
 Housing Price Forecasts Illinois and Chicago PMSA, April 2013 Presented To Illinois Association of Realtors From R E A L Regional Economics Applications Laboratory, Institute of Government and Public Affairs
July 2012 was $162,256. ($153,956). was $314,607. was $172,488. ($164,426). Kansas City Region Average Sales Price - Existing Homes
. was $314,607. was $172,488. ($164,426). Kansas City Region Average Sales Price - Existing Homes") July 212 Kansas City Regional Real Estate Market Report Average Sales Price The average exis ng home sale price in July 212 was $162,256. 25 Kansas City Region Average Sales Price - Existing Homes July
July 212 Kansas City Regional Real Estate Market Report Average Sales Price The average exis ng home sale price in July 212 was $162,256. 25 Kansas City Region Average Sales Price - Existing Homes July
Tri-Cities Insider September 2015
 Tri-Cities Insider Your Current Real Estate Market 1 Go to: http://grouponetricities.com click on this logo to view market info each month. 2 3 Yearly Comparisons- Real Trends July/June 2015 Housing Market
MONTHS OF SUPPLY AND PRICE CHANGES. Home improvement November marks a rise in sales. MONTHLY STATISTICS PACKAGE City of Calgary. Nov.
 November 17 17 Home improvement November marks a rise in sales. City of Calgary, December 1, 17 The November housing market was spurred by a rise in sales, particularly in the lower price ranges. Sales
State of the Nation s Housing 2008: A Preview
 State of the Nation s Housing 28: A Preview Eric S. Belsky Remodeling Futures Conference April 15, 28 www.jchs.harvard.edu The Housing Market Has Suffered Steep Declines Percent Change Median Existing
June 2008 MLS Month in Review
 June 28 MLS Month in Review The Greater Albuquerque Real Estate Market continues to be strong. REALTORS put 1,769 homes under contract in the month of June. For our Market Area, sales are up 9.5% for Detached
California Housing Market Update. Monthly Sales and Price Statistics May 2018
 California Housing Market Update Monthly Sales and Price Statistics May 2018 Sales Lost Momentum as Mortgage Rates Continued to Climb California, May 2018 Sales: 409,270 Units, +0.3% YTD, -4.6% YTY 700,000
Monthly Market Watch for the Prescott Quad City Area. Provided by Keller Williams Check Realty Statistics from August 2012 Prescott MLS
 August 2012 Monthly Market Watch for the Prescott Quad City Area Provided by Keller Williams Check Realty Statistics from August 2012 Prescott MLS Report Overview: This report includes MLS data for the
Minneapolis St. Paul Residential Real Estate Index
 University of St. Thomas Minneapolis St. Paul Residential Real Estate Index October 2017 About the Report: The University of St Thomas Residential Real Estate Index has been developed by the Shenehon Center
Changing Economic Times. Market Pulse. Dr. Gary Jackson Director, Regional Economic Research Institute Florida Gulf Coast University April 8, 2008
 Changing Economic Times Presented to: Market Pulse Bonita Springs Area Chamber of Commerce Bonita Springs-Estero Association of REALTORS, Inc. Dr. Gary Jackson Director, Regional Economic Research Institute
Demand down with net migration
 July 1 Demand down with net migration City of Calgary, August, 1 In step with City census data on declining net migration levels, housing sales activity totaled 1,71 units in July, a 1. per cent decrease
A Panel Discussion of Developments, Trends and Issues Affecting Commercial Property Iowa Commercial Real Estate Expo
 A Panel Discussion of Developments, Trends and Issues Affecting Commercial Property By Bryon Tack, MAI, CAE Polk County Deputy Assessor January 1 : Assessment of property (appraisal date) Historical data
Economic Highlights. Payroll Employment Growth by State 1. Durable Goods 2. The Conference Board Consumer Confidence Index 3
 August 26, 2009 Economic Highlights Southeastern Employment Payroll Employment Growth by State 1 Manufacturing Durable Goods 2 Consumer Spending The Conference Board Consumer Confidence Index 3 Real Estate
The State of the Nation s Housing 2007: A Sneak Peek
 The State of the Nation s Housing 2007: A Sneak Peek Eric Belsky Remodeling Futures Conference April 10, 2007 Do Not Distribute Embargoed Until June 11, 2007 www.jchs.harvard.edu The Homebuilding Correction
The Florida Housing Market
 Florida International University FIU Digital Commons Economics Research Occasional Paper Series Department of Economics 1-2007 The Florida Housing Market Jorge Salazar-Carrillo Department of Economics,
MONTHLY STATISTICS PACKAGE. City of Calgary. May creb.com
 MONTHLY STATISTICS PACKAGE City of Calgary May 1 creb.com Housing supply swells in cool spring market MONTHLY STATISTICS PACKAGE City of Calgary May 1 City of Calgary, June 1, 1 Calgary s housing inventory
S Sep eptember 2016
 September Detached prices stabilize in soft market, October, The segment of Calgary s housing market with the greatest influence on the overall market is showing signs of pricing stability. The detached
Sep September 2018
 18 September 18 MONTHLY STATISTICS PACKAGE City of Calgary Persistent buyers market continues 18 City of Calgary, October 1, 18 With no change in the economic climate, Calgary s sales activity totaled
O O ct ct ober 2017
 October Status Quo for Calgary's Housing Market Prices remain similar to last year, but ease in October., November 1, 17 October s housing market conditions closely echoed previous month s trends with
Atlanta Housing Economic Trends
 Atlanta Housing Economic Trends October 2011 Note: This information is deemed accurate but not guaranteed. It is intended for the personal use of HBA members only. Market Update With Smart Numbers Steve
Monthly Indicators % % %
 Monthly Indicators 2018 Percent changes calculated using year-over-year comparisons. New Listings were down 12.9 percent for single family homes and 21.3 percent for townhouse-condo properties. Pending
New year kicks off with slow sales Jan. 2019
 January 19 19 MONTHLY STATISTICS PACKAGE New year kicks off with slow sales 19, February 1, 19 As economic challenges linger into 19, housing markets remain on a sluggish pace. January sales totalled 8
Jackson County Residental Market Trends. February Pending Sales New Listings
 Jackson County Residental Market Trends February 2017 Pending Sales..2 New Listings..3 Overall activity trends are not a measure of pricing or value for individual properties. Small Sampling sizes can
Housing Price Forecasts. Illinois and Chicago PMSA, July 2016
 Housing Price Forecasts Illinois and Chicago PMSA, July 2016 Presented To Illinois Association of Realtors From R E A L Regional Economics Applications Laboratory, Institute of Government and Public Affairs
Oversupply persists despite improved sales activity for affordable product Mar. 2019
 March 19 MONTHLY STATISTICS PACKAGE Oversupply persists despite improved sales activity for affordable product 19, April 1, 19 March saw a modest decline in city wide sales activity compared to last year.
Residential December 2009
 Residential December 2009 Karl L. Guntermann Fred E. Taylor Professor of Real Estate Adam Nowak Research Associate Year End Review The dramatic decline in Phoenix house prices caused by an unprecedented
TEXAS HOUSING INSIGHT
 TEXAS HOUSING INSIGHT JAMES P. GAINES CHIEF ECONOMIST WESLEY MILLER RESEARCH ASSISTANT BAILEY CUADRA RESEARCH ASSISTANT LUIS B. TORRES RESEARCH ECONOMIST TECHNICAL REPORT 2 1 2 0 OCTOBER 2017 TR Contents
Atlanta Housing Economic Trends
 Atlanta Housing Economic Trends February 2015 Note: This information is deemed accurate but not guaranteed. It is intended for the personal use of HBA members only. Atlanta Employment Pace of Employment
Inner Perth Residential Market Report
 Inner Perth Residential Market Report MARCH QUARTER 2014 Inner Perth Residential Market Market Highlights While Western Australia will experience slowed short term growth as the state transitions from
Anna Maria Luxury Real Estate January 2019 Newsletter
 Anna Maria Luxury Real Estate January 219 Newsletter Real Estate Sales on Anna Maria Island for 218 were a little under 217. December 31, 218 Y-T- D AMI sales were 397(SF-234, Con-131, Dup-223, & Lot-9)
Josephine County Residental Market Trends. January Pending Sales New Listings
 Josephine County Residental Market Trends January 217 Pending Sales..2 New Listings..3 Overall activity trends are not a measure of pricing or value for individual properties. Small Sampling sizes can
OBSERVATION. TD Economics IS THE AMERICAN HOUSING REBOUND SUSTAINABLE?
 OBSERVATION TD Economics IS THE AMERICAN HOUSING REBOUND SUSTAINABLE? Highlights 2012 was a very good year for the U.S. housing market. Home prices were up almost 8% and housing starts by close to 30%.
MonthlyStatistics AUGUST 2018
 MonthlyStatistics AUGUST 2018 FOR IMMEDIATE RELEASE September 4, 2018 Sales Bounce Back Slightly From July But Still Lower Than in 2017 NANAIMO, BC Sales of single-family homes in August were seven per
Residential March 2010
 Residential March 2010 Karl L. Guntermann Fred E. Taylor Professor of Real Estate Adam Nowak Research Associate The latest data for December 2009 reveals that overall house prices declined by 13 percent
Foreclosures and Bank-Owned Homes: More Challenges Ahead
 Foreclosures and Bank-Owned Homes: More Challenges Ahead Virginia Association of Counties Annual Meeting November 10, 2008 Virginia Housing Development Authority 1 What is the size and extent of Virginia
MonthlyStatistics JANUARY 2018
 MonthlyStatistics JANUARY 2018 FOR IMMEDIATE RELEASE February 1, 2018 Sales Return to Seasonal Norms in January NANAIMO, BC Coming off the busiest December on record, sales in the VIREB area returned to
Jackson County Residental Market Trends. November Pending Sales New Listings
 Jackson County Residental Market Trends November 2017 Pending Sales..2 New Listings..3 Overall activity trends are not a measure of pricing or value for individual properties. Small Sampling sizes can
REAL ESTATE AND THE ECONOMIC OUTLOOK THROUGH 2013:
 1 1 REAL ESTATE AND THE ECONOMIC OUTLOOK THROUGH 2013: Coping With A Different Kind Of Housing Recovery A Presentation To The Commercial Real Estate Education Summit Monrovia, California July 13, 2012
2019 Housing Market Forecast. Palos Verdes Peninsula AOR January 8, 2019 Jordan G. Levine Senior Economist
 2019 Housing Market Forecast Palos Verdes Peninsula AOR January 8, 2019 Jordan G. Levine Senior Economist Overview Good News: Economic fundamentals solid Homeownership still the dream Rates might not go
RESIDENTIAL MARKET ANALYSIS
 RESIDENTIAL MARKET ANALYSIS EVAN ABRAMOWITZ Joseph Bernard Investment Real Estate Oregon Association of Realtors Student Fellow Masters of Real Estate Development Graduate Student National housing market
Housing Price Forecasts. Illinois and Chicago PMSA, March 2018
 Housing Price Forecasts Illinois and Chicago PMSA, March 2018 Presented To Illinois Realtors From R E A L Regional Economics Applications Laboratory, Institute of Government and Public Affairs University
Weak sales persist in Calgary and beyond Jun. 2018
 June 218 MONTHLY STATISTICS PACKAGE City of Calgary Weak sales persist in Calgary and beyond 218 City of Calgary, July 3, 218 Many Canadian energyrelated municipalities within Alberta and Saskatchewan
Released: June Commentary 2. The Numbers That Drive Real Estate 3. Recent Government Action 9. Topics for Home Buyers, Sellers, and Owners 11
 Released: June 2011 Commentary 2 The Numbers That Drive Real Estate 3 Recent Government Action 9 Topics for Home Buyers, Sellers, and Owners 11 Brought to you by: KW Research Commentary The U.S. housing
BRISBANE HOUSING MARKET STUDY
 BRISBANE HOUSING MARKET 2018 STUDY Executive Summary Brisbane s residential market, especially the detached houses segment has risen steadily over the last year due to the rise in population, falling unemployment
Released: April 8, 2011
 Released: April 8, 2011 Commentary 2 The Numbers That Drive Real Estate 3 Special Report 9 Brought to you by: KW Research Commentary The housing market continues on a relatively stable and balanced track.
This Month in Real Estate
 Keller Williams Research This Month in Real Estate Released: June 11, 2009 Commentary. The Numbers That Drive Real Estate Recent Government Action. Research for Buyers and Sellers. 2 4 10 13 1 Green Shoots
Housing s Impact on Local Government Finance
 Housing s Impact on Local Government Finance Meeting of the Virginia Government Finance Officers Association Virginia Beach, Virginia June 9, 2011 Virginia Housing Development Authority Impact of Home
Metropolitan Area Statistics
 Metropolitan Area Statistics Apartment Completions 1Q 2011 1Q 2012 % Chg Atlanta - - n/a Boston 133 39-71% Chicago - 20 n/a Cleveland - - n/a Columbus - 272 n/a Dallas-Ft. Worth 604 1,059 75% Denver 328
Atlanta Housing Economic Trends
 Atlanta Housing Economic Trends August 2013 Note: This information is deemed accurate but not guaranteed. It is intended for the personal use of HBA members only. Atlanta Employment Pace of Employment
Analysis of Current and Forecasted Demand for Housing in North America
 Analysis of Current and Forecasted Demand for Housing in North America TIMBER MEASUREMENT SOCIETY Central Meeting April 9, 2015 Coeur d Alene, Idaho Delton Alderman Forest Products Marketing Unit Forest
Housing market feels the chill as oversupply continues Feb. 2019
 February 19 19 MONTHLY STATISTICS PACKAGE Housing market feels the chill as oversupply continues 19, March 1, 19 The effects of Calgary s economic climate continue to create weak sales activity and elevated