$32,740,000 CITY OF DUBLIN COMMUNITY FACILITIES DISTRICT NO (DUBLIN CROSSING) IMPROVEMENT AREA NO. 1 SPECIAL TAX BONDS, SERIES 2017
|
|
|
- Lilian Johnson
- 5 years ago
- Views:
Transcription
1 NEW ISSUE-FULL BOOK ENTRY NOT RATED In the opinion of Jones Hall, A Professional Law Corporation, San Francisco, California, Bond Counsel, subject, however to certain qualifications described herein, under existing law, the interest on the Bonds is excluded from gross income for federal income tax purposes and such interest is not an item of tax preference for purposes of the federal alternative minimum tax imposed on individuals and corporations, although for the purpose of computing the alternative minimum tax imposed on certain corporations, such interest is taken into account in determining certain income and earnings. In the further opinion of Bond Counsel, such interest is exempt from California personal income taxes. See TAX MATTERS herein. Dated: Date of Delivery $32,740,000 CITY OF DUBLIN COMMUNITY FACILITIES DISTRICT NO (DUBLIN CROSSING) IMPROVEMENT AREA NO. 1 SPECIAL TAX BONDS, SERIES 2017 Due: September 1, as shown below The bonds captioned above (the Bonds ), are being issued by the City of Dublin (the City ) by and through its Community Facilities District No (Dublin Crossing) Improvement Area No. 1 (the District and Improvement Area No. 1 ). The Bonds are special tax obligations of the City, authorized pursuant to the Mello-Roos Community Facilities Act of 1982, as amended, being California Government Code Section 53311, et seq. (the Act ), and are issued pursuant to a Fiscal Agent Agreement dated as of August 1, 2017 (the Fiscal Agent Agreement ) by and between the City and U.S. Bank National Association, as fiscal agent (the Fiscal Agent ). The Bonds are issued to (i) construct and acquire certain public facilities and/or reimburse the payment of fees for capital improvements, (ii) provide for the establishment of a reserve fund, (iii) provide capitalized interest, and (iv) pay the costs of issuance of the Bonds. Interest on the Bonds is payable on March 1, 2018, and thereafter semiannually on March 1 and September 1 of each year. The Bonds are being issued as fully registered bonds, registered in the name of Cede & Co. as nominee of The Depository Trust Company ( DTC ), and will be available to ultimate purchasers in the denomination of $5,000 or any integral multiple thereof, under the book-entry system maintained by DTC. See APPENDIX H BOOK-ENTRY SYSTEM. The Bonds are secured by and payable from a pledge of Special Tax Revenues (as defined herein) consisting primarily of special taxes to be levied by the City on real property within the boundaries of Improvement Area No. 1, and from amounts held in certain funds under the Fiscal Agent Agreement, all as more fully described herein. Unpaid Special Taxes do not constitute a personal indebtedness of the owners of the parcels within Improvement Area No. 1. In the event of delinquency, proceedings may be conducted only against the parcel of real property securing the delinquent Special Tax. There is no assurance the owners will be able to pay the Special Tax or that they will pay a Special Tax even though financially able to do so. To provide funds for payment of the Bonds and the interest thereon as a result of any delinquent Special Taxes, the City will establish a Reserve Fund from proceeds of the Bonds, as described herein. See SECURITY AND SOURCES OF PAYMENT FOR THE BONDS. Property in Improvement Area No. 1 within the District comprises approximately 28 taxable acres northeast of the center of the City currently planned for 453 single family units subject to the Special Tax. All of the property in Improvement Area No. 1 is currently owned by five entities that are developing the property. The Bonds are only secured by parcels in Improvement Area No. 1. See IMPROVEMENT AREA NO. 1. The Bonds are subject to optional and mandatory redemption prior to maturity as described herein. See THE BONDS Redemption. NEITHER THE FAITH AND CREDIT NOR THE TAXING POWER OF THE CITY, THE COUNTY OF ALAMEDA, THE STATE OF CALIFORNIA NOR ANY POLITICAL SUBDIVISION THEREOF IS PLEDGED TO THE PAYMENT OF THE BONDS. THE BONDS DO NOT CONSTITUTE A DEBT OF THE CITY WITHIN THE MEANING OF ANY STATUTORY OR CONSTITUTIONAL DEBT LIMITATION. THE INFORMATION SET FORTH IN THIS OFFICIAL STATEMENT, INCLUDING INFORMATION UNDER THE HEADING SPECIAL RISK FACTORS, SHOULD BE READ IN ITS ENTIRETY. This cover page contains certain information for general reference only. It is not a summary of all of the provisions of the Bonds. Prospective investors must read the entire Official Statement to obtain information essential to the making of an informed investment decision. See SPECIAL RISK FACTORS herein for a discussion of the special risk factors that should be considered, in addition to the other matters and risk factors set forth herein, in evaluating the investment quality of the Bonds. The Bonds are offered when, as and if issued, subject to approval as to their legality by Jones Hall, a Professional Law Corporation, San Francisco, California, Bond Counsel. Certain legal matters will be passed on by Jones Hall, a Professional Law Corporation, San Francisco, California, as Disclosure Counsel. Certain legal matters will be passed upon for the City by Meyers Nave Riback Silver & Wilson, PLC, as the City Attorney. Rossi A. Russell, Esq., Los Angeles, California is serving as Underwriter s counsel, and Holland & Knight LLP, San Francisco, California, is serving as counsel to Dublin Crossing, LLC. It is anticipated that the Bonds, in book-entry form, will be available for delivery through the facilities of DTC on or about August 31, The date of this Official Statement is August 15, 2017.
2 MATURITY SCHEDULE $32,740,000 CITY OF DUBLIN COMMUNITY FACILITIES DISTRICT NO (DUBLIN CROSSING) IMPROVEMENT AREA NO. 1 SPECIAL TAX BONDS, SERIES 2017 $2,465, % Term Bond Due September 1, 2027, Price: %, Yield: 3.180% CUSIP : 26362P AA9 $9,165, % Term Bond Due September 1, 2037, Price: % C, Yield: 3.760% CUSIP : 26362P AB7 $21,110, % Term Bond Due September 1, 2047, Price: % C, Yield: 3.950% CUSIP : 26362P AC5
3 CITY OF DUBLIN, CALIFORNIA City Council David Haubert, Mayor Don Biddle, Vice Mayor Abe Gupta, Councilmember Arun Goel, Councilmember Melissa Hernandez, Councilmember City Staff Christopher Foss, City Manager Colleen Tribby, Administrative Services Director/Financial Director Caroline Soto, City Clerk SPECIAL SERVICES Bond Counsel Jones Hall, A Professional Law Corporation San Francisco, California Municipal Advisor Fieldman, Rolapp & Associates Irvine, California Appraiser Seevers Jordan Ziegenmeyer Rocklin, California Special Tax Consultant Goodwin Consulting Group, Inc. Sacramento, California Fiscal Agent U.S. Bank National Association San Francisco, California Disclosure Counsel Jones Hall, A Professional Law Corporation San Francisco, California
4 GENERAL INFORMATION ABOUT THIS OFFICIAL STATEMENT Use of Official Statement. This Official Statement is submitted in connection with the sale of the Bonds referred to herein and may not be reproduced or used, in whole or in part, for any other purpose. This Official Statement is not to be construed as a contract with the purchasers of the Bonds. Statements contained in this Official Statement which involve estimates, forecasts or matters of opinion, whether or not expressly so described herein, are intended solely as such and are not to be construed as a representation of facts. Estimates and Forecasts. When used in this Official Statement and in any continuing disclosure by the District or the City, in any press release and in any oral statement made with the approval of an authorized officer of the District or the City, the words or phrases will likely result, are expected to, will continue, is anticipated, estimate, project, forecast, expect, intend and similar expressions may identify forward looking statements. Such statements are subject to risks and uncertainties that could cause actual results to differ materially from those contemplated in such forwardlooking statements. Any forecast is subject to such uncertainties. Inevitably, some assumptions used to develop the forecasts will not be realized and unanticipated events and circumstances may occur. Therefore, there are likely to be differences between forecasts and actual results, and those differences may be material. The information and expressions of opinion herein are subject to change without notice, and neither the delivery of this Official Statement nor any sale made hereunder shall, under any circumstances, give rise to any implication that there has been no change in the affairs of the District or the City since the date hereof. Limit of Offering. No dealer, broker, salesperson or other person has been authorized by the City or the Underwriter to give any information or to make any representations other than those contained herein and, if given or made, such other information or representation must not be relied upon as having been authorized by any of the foregoing. This Official Statement does not constitute an offer to sell or the solicitation of an offer to buy nor shall there be any sale of the Bonds by a person in any jurisdiction in which it is unlawful for such person to make such an offer, solicitation or sale. Involvement of Underwriter. The Underwriter has reviewed the information in this Official Statement in accordance with, and as a part of, its responsibilities to investors under the federal securities laws as applied to the facts and circumstances of this transaction, but the Underwriter does not guarantee the accuracy or completeness of such information. The information and expressions of opinions herein are subject to change without notice and neither delivery of this Official Statement nor any sale made hereunder shall, under any circumstances, create any implication that there has been no change in the affairs of the City or the District since the date hereof. All summaries of the Fiscal Agent Agreement or other documents referred to in this Official Statement, are made subject to the provisions of such documents, respectively, and do not purport to be complete statements of any or all of such provisions. IN CONNECTION WITH THIS OFFERING, THE UNDERWRITER MAY OVERALLOT OR EFFECT TRANSACTIONS WHICH STABILIZE OR MAINTAIN THE MARKET PRICE OF THE BONDS OFFERED HEREBY AT A LEVEL ABOVE THAT WHICH MIGHT OTHERWISE PREVAIL IN THE OPEN MARKET. SUCH STABILIZING, IF COMMENCED, MAY BE DISCONTINUED AT ANY TIME. THE UNDERWRITER MAY OFFER AND SELL THE BONDS TO CERTAIN DEALERS, INSTITUTIONAL INVESTORS AND OTHERS AT PRICES LOWER THAN THE PUBLIC OFFERING PRICE STATED ON THE COVER PAGE HEREOF AND SAID PUBLIC OFFERING PRICE MAY BE CHANGED FROM TIME TO TIME BY THE UNDERWRITER. THE BONDS HAVE NOT BEEN REGISTERED UNDER THE SECURITIES ACT OF 1933, AS AMENDED, IN RELIANCE UPON AN EXCEPTION FROM THE REGISTRATION REQUIREMENTS CONTAINED IN SUCH ACT. THE BONDS HAVE NOT BEEN REGISTERED OR QUALIFIED UNDER THE SECURITIES LAWS OF ANY STATE. The City maintains an Internet website, but the information on that website is not incorporated in this Official Statement.
5 TABLE OF CONTENTS INTRODUCTION... 1 THE BONDS... 6 Authority for Issuance... 6 Description of the Bonds... 7 Redemption... 8 Transfer or Exchange of Bonds SOURCES AND USES OF FUNDS SECURITY AND SOURCES OF PAYMENT FOR THE BONDS Pledge of Special Tax Revenues and Other Amounts Special Taxes Special Tax Methodology Levy of Annual Special Tax; Annual Maximum Special Tax Special Tax Fund Administrative Expense Fund Reserve Fund Improvement Fund Delinquent Payments of Special Tax; Covenant for Superior Court Foreclosure Additional Bonds DEBT SERVICE SCHEDULE THE DUBLIN CROSSING PROJECT Dublin Crossing Specific Plan Public Improvements Required for the Dublin Crossing Project Acquisition Agreement Market Pricing and Absorption Analysis IMPROVEMENT AREA NO Formation of the District Location and Description of Improvement Area No. 1 and the Immediate Area Improvement Area No. 1 Ownership Tract Map Status The Merchant Builders The Development Plan Financing Plan Developer Financing Plan Merchant Builders OWNERSHIP OF PROPERTY WITHIN IMPROVEMENT AREA NO The Developer, Brookfield and CalAtlantic.. 45 APPRAISED VALUE OF PROPERTY WITHIN IMPROVEMENT AREA NO The Appraisal Value by Ownership and Neighborhood Value to Special Tax Burden Ratios Overlapping Liens and Priority of Lien Estimated Tax Burden SPECIAL RISK FACTORS Limited Obligation of the City to Pay Debt Service Special Tax Not a Personal Obligation Concentration of Ownership Levy and Collection of the Special Tax Insufficiency of Special Taxes Appraised Values Value-to-Lien Ratios Exempt Properties Property Values and Property Development Other Possible Claims Upon the Value of Taxable Property Bankruptcy and Foreclosure Delays No Acceleration Provisions Loss of Tax Exemption Enforceability of Remedies No Secondary Market Disclosure to Future Purchasers IRS Audit of Tax-Exempt Bond Issues Voter Initiatives Recent Case Law Related to the Mello- Roos Act CONTINUING DISCLOSURE The City Brookfield BAH CalAtlantic UNDERWRITING MUNICIPAL ADVISOR LEGAL OPINION TAX MATTERS NO RATINGS NO LITIGATION PROFESSIONAL FEES EXECUTION APPENDIX A APPENDIX B APPENDIX C APPENDIX D APPENDIX E APPENDIX F APPENDIX G APPENDIX H - RATE AND METHOD OF APPORTIONMENT OF SPECIAL TAX - THE APPRAISAL - SUMMARY OF CERTAIN PROVISIONS OF THE FISCAL AGENT AGREEMENT - THE CITY OF DUBLIN AND ALAMEDA COUNTY - PRICING REPORT - FORM OF OPINION OF BOND COUNSEL - FORM OF CONTINUING DISCLOSURE UNDERTAKINGS - BOOK ENTRY SYSTEM i
6 (THIS PAGE INTENTIONALLY LEFT BLANK)
7 OFFICIAL STATEMENT $32,740,000 CITY OF DUBLIN COMMUNITY FACILITIES DISTRICT NO (DUBLIN CROSSING) IMPROVEMENT AREA NO. 1 SPECIAL TAX BONDS, SERIES 2017 This Official Statement, including the cover page and all appendices hereto, is provided to furnish certain information in connection with the issuance of the bonds captioned above (the Bonds ) by the City of Dublin (the City ), by and through Improvement Area No. 1 ( Improvement Area No. 1 ) of the City of Dublin Community Facilities District No (Dublin Crossing) (the District ). Any statements made in this Official Statement involving matters of opinion or of estimates, whether or not so expressly stated, are set forth as such and not as representations of fact, and no representation is made that any of the estimates will be realized. Definitions of certain terms used herein and not defined herein have the meaning set forth in the Fiscal Agent Agreement. See APPENDIX C SUMMARY OF CERTAIN PROVISIONS OF THE FISCAL AGENT AGREEMENT. INTRODUCTION This introduction is not a summary of this Official Statement. It is only a brief description of and guide to, and is qualified by, more complete and detailed information contained in the entire Official Statement, including the cover page and attached appendices, and the documents summarized or described in this Official Statement. A full review should be made of the entire Official Statement. The offering of the Bonds to potential investors is made only by means of the entire Official Statement. Authority for Issuance. The Bonds are issued pursuant to the provisions of the Mello- Roos Community Facilities Act of 1982, as amended (Section 53311, et seq., of the Government Code of the State of California) (the Act ) and pursuant to a Fiscal Agent Agreement dated as of August 1, 2017 (the Fiscal Agent Agreement ) between the City and U.S. Bank National Association, as fiscal agent (the Fiscal Agent ) and a resolution adopted on July 18, 2017 by the City Council of the City (the City Council ), as legislative body of the District (the Resolution ). The Bonds, together with Parity Bonds (as defined herein), are authorized to be issued up to the maximum authorization for Improvement Area No. 1 of $46 million. Bond Terms. The Bonds will be dated as of and bear interest from the date of delivery thereof at the rate or rates set forth on the cover page of this Official Statement. Interest on the Bonds is payable on March 1 and September 1 of each year (each an Interest Payment
8 Date ), commencing March 1, The Bonds will be issued without coupons in denominations of $5,000 or any integral multiple thereof. Registration of Ownership of Bonds. The Bonds will be issued only as fully registered bonds in book-entry form, registered in the name of Cede & Co., as nominee of The Depository Trust Company ( DTC ). Ultimate purchasers of Bonds will not receive physical certificates representing their interest in the Bonds. So long as the Bonds are registered in the name of Cede & Co., as nominee of DTC, references herein to the Owners will mean Cede & Co., and will not mean the ultimate purchasers of the Bonds. Payments of the principal, premium, if any, and interest on the Bonds will be made directly to DTC, or its nominee, Cede & Co. so long as DTC or Cede & Co. is the registered owner of the Bonds. Disbursements of such payments to DTC s Participants is the responsibility of DTC and disbursements of such payments to the Beneficial Owners is the responsibility of DTC s Participants and Indirect Participants, as more fully described herein. See APPENDIX H BOOK-ENTRY SYSTEM. Use of Proceeds. Proceeds of the Bonds will primarily be used to finance the cost of acquiring and constructing certain public infrastructure improvements and/or reimbursing fees paid for capital improvements (collectively, the Authorized Improvements, as described herein), generally including roadways and roadway related improvements, water, wastewater and other miscellaneous infrastructure improvements in connection with the development of the Dublin Crossing Project (as defined herein). Construction of Authorized Improvements by the Developer (described herein) sufficient to commence home building in Phase 1A of Improvement Area No. 1 is complete and homebuilding has commenced for Phase 1A. Construction of Authorized Improvements by the Developer sufficient to commence home building in Phase 1B of Improvement Area No. 1 is ongoing and is expected to be complete by Fall of The cost of a portion of the Authorized Improvements will be reimbursed by the proceeds of the Bonds, and the Developer and/or the Merchant Builders (described herein) are required to fund any remaining shortfall. See THE DUBLIN CROSSING PROJECT - Public Improvements Required for the Dublin Crossing Project. Proceeds of the Bonds will also be used to establish a reserve fund (described below) available for payment on the Bonds, to provide capitalized interest through and including September 1, 2018 and to pay cost of issuance of the Bonds. Source of Payment of the Bonds. The Bonds are secured by and payable from Special Tax Revenues, which are generally defined to mean the proceeds of the special tax (the Special Tax ) which will be levied by the City on taxable real property within the boundaries of Improvement Area No. 1 and received by the City, including with respect to prepayments, redemptions and foreclosures and delinquencies. The Bonds are also payable from amounts held in certain funds and accounts pursuant to the Fiscal Agent Agreement, including a reserve fund, all as more fully described herein. See SECURITY AND SOURCES OF PAYMENT FOR THE BONDS Pledge of Special Taxes for additional details. The District was initially formed as a single improvement area (i.e., Improvement Area No. 1 over Phase 1A), with the anticipated future phases of the Dublin Crossing Project designated as part of the future annexation area to the District. On June 20, 2017, land planned for development as Phase 1B was annexed to Improvement Area No. 1. The Developer anticipates annexing additional property of the Dublin Crossing Project into future improvement areas as such property is ready for development. However, the Bonds are only secured by parcels within Improvement Area No. 1. The Special Tax applicable to each taxable parcel in Improvement Area No. 1 will be levied and collected according to the tax liability determined by the City Council through the application of a rate and method of apportionment of Special Tax -2-
9 for Improvement Area No. 1 (the Rate and Method ) which has been approved by the City. The Rate and Method is set forth as APPENDIX A hereto. The Special Taxes represent liens on the parcels of land subject to a Special Tax and failure to pay the Special Taxes could result in proceedings to foreclose the delinquent property. The Special Taxes do not constitute the personal indebtedness of the owners of taxed parcels. See SECURITY AND SOURCES OF PAYMENT FOR THE BONDS Special Tax Methodology and APPENDIX A RATE AND METHOD OF APPORTIONMENT OF SPECIAL TAX. The maximum authorized indebtedness for Improvement Area No. 1 is $46 million, and additional Parity Bonds are expected to be issued in the future as development progresses. In the Fiscal Agent Agreement, the City directs the Fiscal Agent to establish a Reserve Fund (the Reserve Fund ) from Bond proceeds in the amount of the Reserve Requirement (described herein), which amount is available to be transferred to the Bond Fund in the event of delinquencies in the payment of the Special Taxes, to the extent of such delinquencies. The Reserve Fund is required to be maintained at the Reserve Requirement from moneys available under the Fiscal Agent Agreement. See SECURITY AND SOURCES OF PAYMENT FOR THE BONDS Reserve Fund. If there are additional delinquencies after depletion of funds in the Reserve Fund, the City is not obligated to pay the Bonds or supplement the Reserve Fund except from Special Tax Revenues as described in the Fiscal Agent Agreement. The District and the Improvement Areas. The land in Improvement Area No. 1 was formerly a portion of the U.S. Army Reserve Reserve s Camp Parks base, which is adjacent to and borders the Dublin Crossing Project to the north and which will continue in existence as to the portion outside of the Dublin Crossing Project. Dublin Crossing, LLC, a Delaware limited liability company ( Dublin Crossing or the Developer ), as the master developer of the Dublin Crossing Project, is under contract with the Army Reserve to acquire additional land owned by the Army Reserve, and has acquired some, but not all of the land in the Dublin Crossing Project. As it acquires the land, Army Reserve facilities are demolished and the land is converted to uses approved by the City for the Dublin Crossing Project. As the Developer acquires such property, it installs backbone infrastructure to ready the land for development, whereupon it is sold to it merchant builders for homebuilding. The project (herein, the Dublin Crossing Project ) was originally referred to as Dublin Crossing but is being marketed as Boulevard. Development of the Dublin Crossing Project is planned to occur in 5 phases, with each phase other than Phase 1A/1B (which is Improvement Area No. 1) being annexed to the District as separate improvement areas. All 5 phases of the Dublin Crossing Project total approximately 190 acres, but the Bonds are secured only by special taxes levied on the parcels within Improvement Area No. 1 of the District; special taxes on property in the future annexation areas will not secure the Bonds. The Developer is a joint venture between (i) BrookCal Dublin LLC, a Delaware limited liability company ( BrookCal ), and (ii) SPIC Dublin LLC, a Delaware limited liability company ( SPIC ). BrookCal is owned 100% by BrookCal Bay Area Holdings LLC, a Delaware limited liability company ( BrookCal Bay Area ). BrookCal Bay Area is owned 100% by BrookCal, LLC, a Delaware limited liability company ( BrookCal, LLC ). BrookCal, LLC is a joint venture between BHC BrookCal, LLC, a Delaware limited liability company ( BHC BrookCal ), and the California State Teachers Retirement System ( Cal STRS ). BHC BrookCal is an indirect whollyowned subsidiary of Brookfield Residential Properties Inc. ( Brookfield Residential ), a whollyowned subsidiary of Brookfield Asset Management Inc., which has been developing land and building homes for over 50 years. -3-
10 SPIC is an affiliate of CalAtlantic Group, Inc., a Delaware corporation ( CalAtlantic ). The Developer has entered into agreements with CalAtlantic and with builders that are affiliated with Brookfield Residential. In particular, the Developer sold property to (i) Brookfield Bay Area Holdings LLC ( Brookfield BAH ), Brookfield Wilshire LLC, and Brookfield Fillmore LLC (collectively, the Brookfield Merchant Builders ), all of which are indirect subsidiaries of Brookfield Residential, and (ii) CalAtlantic (herein, the CalAtlantic Merchant Builder and together with the Brookfield Merchant Builders, the Merchant Builders ). As of June 1, 2017, the Developer owns 24 lots in Improvement Area No. 1, and anticipates conveying these 24 lots to Brookfield BAH for development as part of the Huntington neighborhood. See IMPROVEMENT AREA NO. 1 The Merchant Builders. Infrastructure development of Improvement Area No. 1 is carried out by the Developer, who in turn sells what it refers to as neighborhoods to the Merchant Builders or their affiliates. The Merchant Builders are independent entities from each other but are closely collaborating on the development, marketing and selling of homes. Property Subject to the Special Tax of Improvement Area No. 1. Improvement Area No. 1 consists of approximately 28 taxable acres entitled for 453 residential units. Land in Improvement Area No. 1 comprises 6 neighborhoods and is referred to by the Merchant Builders as Phase 1A (neighborhoods 1-4) and Phase 1B (neighborhoods 5 & 6). Initial home construction is underway by builders in Phase 1A and initial home sales are expected to close in Phase 1A by the end of 2017; initial home construction in Phase 1B is anticipated to commence in the Fall of 2017, with initial sales in Phase 1B by the fourth quarter of 2017 or the first quarter of See IMPROVEMENT AREA NO. 1. Appraised Value of Property. Property in Improvement Area No. 1 is security for the Special Tax. The City authorized the preparation of an appraisal report (the Appraisal ) for the real property within Improvement Area No. 1, which sets forth an estimated market value of $153,210,000, as of the May 17, 2017 date of value. The valuation assumes matters stated in the Appraisal, including completion of the Authorized Improvements funded by the Bonds, and accounts for the impact of the lien of the Special Tax securing the Bonds. In considering the estimates of value evidenced by the Appraisal, it should be noted that the Appraisal is based upon a number of standard and special assumptions which affected the estimates as to value, in addition to the assumption of completion of the Authorized Improvements funded with proceeds of the Bonds (but not any future bonds). The Authorized Improvements to be paid for with proceeds of the Bonds are underway but not complete. See APPRAISED VALUE OF PROPERTY WITHIN IMPROVEMENT AREA NO. 1 and APPENDIX B. The appraised valuation estimate of property in Improvement Area No. 1 is 4.7 times the $32,740,000 aggregate principal amount of the Bonds. This value-to-lien ratio does not take into account any overlapping liens on land in Improvement Area No. 1. See APPRAISED VALUE OF PROPERTY WITHIN IMPROVEMENT AREA NO. 1 Overlapping Liens and Priority of Liens. The City and the County. The City is located in southern Alameda County (the County ), which is located in the Tri Valley area encompassing the cities of Pleasanton, Livermore, Dublin, San Ramon, and Danville, as well as unincorporated Alamo, Blackhawk, Camino Tassajara, Diablo, Norris Canyon, and Sunol. The three valleys from which it takes its name are Amador Valley, Livermore Valley and San Ramon Valley. The City is located along the north side of Interstate 580 at the intersection with Interstate 680 and between the cities of Livermore and Pleasanton, roughly 35 miles (56 km) east of San Francisco, 23 miles east of Oakland, and 31 miles north of San Jose. The estimated population of the City as of January -4-
11 2017 was approximately 59,686. For economic and demographic information regarding the area in and around the City, see APPENDIX D THE CITY OF DUBLIN AND ALAMEDA COUNTY. Risks of Investment. See the section of this Official Statement entitled SPECIAL RISK FACTORS for a discussion of special factors that should be considered, in addition to the other matters set forth herein, in considering the investment quality of the Bonds. Limited Obligation of the City. The general fund of the City is not liable and the full faith and credit of the City is not pledged for the payment of the interest on, or principal of or redemption premiums, if any, on the Bonds. The Bonds are not secured by a legal or equitable pledge of or charge, lien or encumbrance upon any property of the City or any of its income or receipts, except the money in certain funds established under the Fiscal Agent Agreement, and neither the payment of the interest on nor principal of or redemption premiums, if any, on the Bonds is a general debt, liability or obligation of the City. The Bonds do not constitute an indebtedness of the City within the meaning of any constitutional or statutory debt limitation or restrictions and neither the City Council, the City nor any officer or employee thereof are liable for the payment of the interest on or principal of or redemption premiums, if any, on the Bonds other than from the proceeds of the Special Taxes and the money in certain funds, as provided in the Fiscal Agent Agreement. Summary of Information. Brief descriptions of certain provisions of the Fiscal Agent Agreement, the Bonds and certain other documents are included herein. The descriptions and summaries of documents herein do not purport to be comprehensive or definitive, and reference is made to each such document for the complete details of all its respective terms and conditions, copies of which are available for inspection at the office of the finance official of the City. All statements herein with respect to certain rights and remedies are qualified by reference to laws and principles of equity relating to or affecting creditors rights generally. Capitalized terms used in this Official Statement and not otherwise defined herein have the meanings ascribed to such terms in the Fiscal Agent Agreement. The information and expressions of opinion herein speak only as of the date of this Official Statement and are subject to change without notice. Neither delivery of this Official Statement, any sale made hereunder, nor any future use of this Official Statement shall, under any circumstances, create any implication that there has been no change in the affairs of the City or the District since the date hereof. Any statements made in this Official Statement involving matters of opinion or of estimates, whether or not so expressly stated, are set forth as such and not as representations of fact, and no representation is made that any of the estimates will be realized. For definitions of certain terms used herein and not defined herein, see APPENDIX C SUMMARY OF CERTAIN PROVISIONS OF THE FISCAL AGENT AGREEMENT. -5-
12 THE BONDS Authority for Issuance The Bonds are issued pursuant to the Fiscal Agent Agreement, approved by a resolution adopted by the City Council on July 18, 2017, and the Act. On April 21, 2015, the City Council adopted a Resolution of Intention to form a community facilities district under the Act, to levy a special tax and to incur bonded indebtedness for the purpose of financing the Authorized Improvements. After conducting a noticed public hearing, on June 2, 2015, the City Council adopted the Resolution of Formation (the Resolution of Formation ), which established Community Facilities District No and Improvement Area No. 1 thereof, and designated a future annexation area (the Future Annexation Area ), which includes the remaining phases of the Dublin Crossing Project (which are anticipated to be annexed by phase into the District as Improvement Area No. 2, Improvement Area No. 3, Improvement Area No. 4, and Improvement Area No. 5). The Resolution of Formation also set forth the Rate and Method within Improvement Area No. 1 and for each future Improvement Area, and set forth the necessity to incur bonded indebtedness in a total amount not to exceed $150 million for the District as a whole and $46 million for Improvement Area No. 1. On the same day, an election was held within the District in which the Dublin Crossing Venture, LLC, the predecessor owner of the land in Improvement Area No. 1 (who was then the only eligible landowner voter in the District and is referred to herein as the Prior Owner ) unanimously approved the proposed bonded indebtedness and the levy of the Special Tax. Under the provisions of the Act, since there were fewer than 12 registered voters residing within the District and Improvement Area No. 1 at a point during the 90-day period preceding the adoption of the Resolution of Formation, the qualified electors entitled to vote in the special election consisted of the Prior Owner, as sole landowner. The landowner voted to incur the indebtedness and to approve the annual levy of Special Taxes to be collected within Improvement Area No. 1, for the purpose of paying for the Authorized Improvements, including repaying any indebtedness of Improvement Area No. 1, replenishing reserve funds and paying the administrative expenses of Improvement Area No. 1. See IMPROVEMENT AREA NO. 1 Formation of the District herein. The Prior Owner, as the sole landowner, also approved the designation of the Future Annexation Area, and approved the bonded indebtedness for the future Improvement Areas. The Bonds are the first series to be issued for Improvement Area No. 1 under the authorization; additional bonds are expected to be issued, up to the total bond authorization of $46 million for Improvement Area No. 1. Land within the Future Annexation Area may from time to time in the future be annexed into any Improvement Area of the District by the execution of an owner of land in the Future Annexation Area of a unanimous written consent to be annexed to the District and into a particular Improvement Area. In fact, in June 2017, Phase 1B of the Dublin Crossing Project, which was initially identified as part of the Future Annexation Area, was annexed into Improvement Area No. 1. A special tax will be levied on annexed territory only with the unanimous approval of the owner or owners of each parcel or parcels at the time of annexation into the respective Improvement Area, whereupon a special tax will become a continuing lien against all non-exempt real property in the annexed portion of the Future Annexation Area. -6-
13 Each annexation will add property to a specific Improvement Area; Special taxes of each Improvement Area will secure only bonds issued by that respective Improvement Area. No additional property is anticipated to be annexed to Improvement Area No. 1. Description of the Bonds Bond Terms. The Bonds will be dated as of and bear interest from the date of delivery thereof at the rates and mature in the amounts and years, as set forth on the inside cover page hereof. The Bonds are being issued in the denomination of $5,000 or any integral multiple thereof. Interest on the Bonds will be payable semiannually on March 1 and September 1 of each year (each an Interest Payment Date ), commencing March 1, The principal of the Bonds and premiums due upon the redemption thereof, if any, will be payable in lawful money of the United States of America at the principal corporate trust office of the Fiscal Agent in San Francisco, California, or such other place as designated by the Fiscal Agent, upon presentation and surrender of the Bonds; provided that so long as any Bonds are in book-entry form, payments with respect to such Bonds will be made by wire transfer, or such other method acceptable to the Fiscal Agent, to DTC. Book-Entry Only System. The Bonds are being issued as fully registered bonds, registered in the name of Cede & Co., as nominee of The Depository Trust Company ( DTC ), and will be available to ultimate purchasers under the book-entry system maintained by DTC. Ultimate purchasers of Bonds will not receive physical certificates representing their interest in the Bonds. So long as the Bonds are registered in the name of Cede & Co., as nominee of DTC, references herein to the Owners will mean Cede & Co., and will not mean the ultimate purchasers of the Bonds. The Fiscal Agent will make payments of the principal, premium, if any, and interest on the Bonds directly to DTC, or its nominee, Cede & Co., so long as DTC or Cede & Co. is the registered owner of the Bonds. Disbursements of such payments to DTC s Participants is the responsibility of DTC and disbursements of such payments to the Beneficial Owners is the responsibility of DTC s Participants and Indirect Participants, as more fully described herein. See APPENDIX H BOOK ENTRY SYSTEM below. Calculation and Payment of Interest. Interest on the Bonds will be computed on the basis of a 360-day year consisting of twelve 30-day months. Interest on the Bonds (including the final interest payment upon maturity or earlier redemption) is payable by check of the Fiscal Agent mailed on each Interest Payment Date by first class mail to the registered Owner thereof at such registered Owner s address as it appears on the registration books maintained by the Fiscal Agent at the close of business on the Record Date preceding the Interest Payment Date, or by wire transfer made on such Interest Payment Date upon written instructions received by the Fiscal Agent on or before the Record Date preceding the Interest Payment Date, of any Owner of $1,000,000 or more in aggregate principal amount of Bonds; provided that so long as any Bonds are in book-entry form, payments with respect to such Bonds will be made by wire transfer, or such other method acceptable to the Fiscal Agent, to DTC. See APPENDIX H BOOK ENTRY SYSTEM below. Each Bond will bear interest from the Interest Payment Date next preceding the date of authentication thereof unless (i) it is authenticated on an Interest Payment Date, in which event it will bear interest from such date of authentication, or (ii) it is authenticated prior to an Interest Payment Date and after the close of business on the Record Date preceding such Interest Payment Date, in which event it will bear interest from such Interest Payment Date, or (iii) it is -7-
14 authenticated prior to the Record Date preceding the first Interest Payment Date, in which event it will bear interest from the Dated Date; provided, however, that if at the time of authentication of a Bond, interest is in default thereon, such Bond will bear interest from the Interest Payment Date to which interest has previously been paid or made available for payment thereon. So long as the Bonds are registered in the name of Cede & Co., as nominee of DTC, payments of the principal, premium, if any, and interest on the Bonds will be made directly to DTC, or its nominee, Cede & Co. Disbursements of such payments to DTC s Participants is the responsibility of DTC and disbursements of such payments to the Beneficial Owners is the responsibility of DTC s Participants and Indirect Participants, as more fully described herein. See APPENDIX H BOOK ENTRY SYSTEM below. Redemption Optional Redemption. The Bonds maturing on or after September 1, 2028 are subject to redemption prior to their stated maturities, on any date on and after September 1, 2027, in whole or in part, at a redemption price equal to the principal amount of the Bonds to be redeemed, together with accrued interest thereon to the date fixed for redemption, without premium. Mandatory Redemption From Prepayments. Special Tax Prepayments and any corresponding transfers from the Reserve Fund pursuant to the Fiscal Agent Agreement shall be used to redeem Bonds on the next Interest Payment Date for which notice of redemption can timely be given under the Fiscal Agent Agreement, in whole or in part among maturities as specified by the City and by lot within a maturity, at a redemption price (expressed as a percentage of the principal amount of the Bonds to be redeemed), as set forth below, together with accrued interest to the date fixed for redemption: Redemption Date Redemption Price Any Interest Payment Date on or before March 1, % On September 1, 2025 and March 1, On September 1, 2026 and March 1, On September 1, 2027 and any Interest Payment Date thereafter 100 Mandatory Sinking Fund Redemption. The Term Bonds maturing on September 1, 2027 are subject to mandatory partial redemption in part by lot, from payments made by the City from the Bond Fund, at a redemption price equal to the principal amount thereof to be redeemed, together with accrued interest to the redemption date, without premium, in the aggregate respective principal amounts all as set forth in the following table: Mandatory Partial Redemption Date (September 1) Principal Amount Subject to Redemption 2019 $ 90, , , , , , , , (Maturity) 485,000-8-
15 The Term Bonds maturing on September 1, 2037 are subject to mandatory partial redemption in part by lot, from payments made by the City from the Bond Fund, at a redemption price equal to the principal amount thereof to be redeemed, together with accrued interest to the redemption date, without premium, in the aggregate respective principal amounts all as set forth in the following table: Mandatory Partial Redemption Date (September 1) Principal Amount Subject to Redemption 2028 $ 550, , , , , , ,030, ,130, ,235, (Maturity) 1,345,000 The Term Bonds maturing on September 1, 2047 are subject to mandatory partial redemption in part by lot, from payments made by the City from the Bond Fund, at a redemption price equal to the principal amount thereof to be redeemed, together with accrued interest to the redemption date, without premium, in the aggregate respective principal amounts all as set forth in the following table: Mandatory Partial Redemption Date (September 1) Principal Amount Subject to Redemption 2038 $ 1,460, ,585, ,715, ,855, ,000, ,155, ,315, ,490, ,670, (Maturity) 2,865,000 Provided, however, if some but not all of the Term Bonds have been redeemed under subsections Optional Redemption or Mandatory Redemption From Prepayments above, the total amount of all future Mandatory Partial Redemptions shall be reduced by the aggregate principal amount of Term Bonds so redeemed, to be allocated among such Mandatory Partial Redemption Dates on a pro rata basis in integral multiples of $5,000 as determined by the Fiscal Agent, notice of which determination (which shall consist of a revised mandatory partial redemption schedule) shall be given by the City to the Fiscal Agent. -9-
16 Purchase In Lieu of Redemption. In lieu of optional redemption, moneys in the Bond Fund or other funds provided by the City may be used and withdrawn by the Fiscal Agent for purchase of Outstanding Bonds, upon the filing with the Fiscal Agent of an Officer s Certificate requesting such purchase, at public or private sale as and when, and at such prices (including brokerage and other charges) as such Officer s Certificate may provide, but in no event may Bonds be purchased at a price in excess of the principal amount thereof, plus interest accrued to the date of purchase and any premium which would otherwise be due if such Bonds were to be redeemed in accordance with this Agreement. Any Bonds purchased pursuant to these provisions shall be treated as outstanding Bonds under this Fiscal Agent Agreement, except to the extent otherwise directed by the Administrative Services Director. Redemption Procedure by Fiscal Agent. The Fiscal Agent will cause notice of any redemption to be mailed by first class mail, postage prepaid, at least thirty (30) days but not more than sixty (60) days prior to the date fixed for redemption, to the Securities Depositories, to one or more Information Services, and to the respective registered Owners of any Bonds designated for redemption, at their addresses appearing on the Bond registration books in the Principal Office of the Fiscal Agent; but such mailing shall not be a condition precedent to such redemption and failure to mail or to receive any such notice, or any defect therein, shall not affect the validity of the proceedings for the redemption of such Bonds. Such notice shall state the redemption date and the redemption price and, if less than all of the then Outstanding Bonds are to be called for redemption shall state as to any Bond called in part the principal amount thereof to be redeemed, and shall require that such Bonds be then surrendered at the Principal Office of the Fiscal Agent for redemption at the said redemption price, and shall state that further interest on such Bonds will not accrue from and after the redemption date. The City has the right to rescind any notice of the optional redemption of Bonds by written notice to the Fiscal Agent on or prior to the date fixed for redemption. Any notice of redemption shall be cancelled and annulled if for any reason funds will not be or are not available on the date fixed for redemption for the payment in full of the Bonds then called for redemption, and such cancellation shall not constitute a default under this Agreement. The City and the Fiscal Agent have no liability to the Owners or any other party related to or arising from such rescission of redemption. The Fiscal Agent shall give notice of such rescission of redemption in the same manner as the original notice of redemption was sent. Whenever provision is made in the Fiscal Agent Agreement for the redemption of less than all of the Bonds, the Fiscal Agent shall select the Bonds to be redeemed, from all Bonds or such given portion thereof not previously called for redemption, among maturities so as to maintain substantially the same debt service profile for the Bonds as in effect prior to such redemption, and by lot within a maturity. Effect of Redemption. From and after the date fixed for redemption, if funds available for the payment of the principal of, and interest and any premium on, the Bonds so called for redemption shall have been deposited in the Bond Fund, such Bonds so called shall cease to be entitled to any benefit under this Agreement other than the right to receive payment of the redemption price, and no interest shall accrue thereon on or after the redemption date specified in the notice of redemption. -10-
17 Transfer or Exchange of Bonds So long as the Bonds are registered in the name of Cede & Co., as nominee of DTC, transfers and exchanges of Bonds will be made in accordance with DTC procedures. See APPENDIX H below. Any Bond may, in accordance with its terms, be transferred or exchanged by the person in whose name it is registered, in person or by his duly authorized attorney, upon surrender of such Bond for cancellation, accompanied by delivery of a duly written instrument of transfer in a form approved by the Fiscal Agent. Whenever any Bond or Bonds are surrendered for transfer or exchange, the City will execute and the Fiscal Agent will authenticate and deliver a new Bond or Bonds, for a like aggregate principal amount of Bonds of authorized denominations and of the same maturity. The cost for any services rendered or any expenses incurred by the Fiscal Agent in connection with any such transfer or exchange will be paid by the City. The Fiscal Agent will collect from the Owner requesting such transfer any tax or other governmental charge required to be paid with respect to such transfer or exchange. No transfers or exchanges of Bonds shall be required to be made (i) fifteen days prior to the date established by the Fiscal Agent for selection of Bonds for redemption or (ii) with respect to a Bond after such Bond has been selected for redemption; or (iii) between a Record Date and the succeeding Interest Payment Date. -11-
18 SOURCES AND USES OF FUNDS A summary of the estimated sources and uses of funds associated with the sale of the Bonds follows: Sources of Funds: Principal Amount of Bonds $32,740, Plus Original Issue Premium 3,138, Total $35,878, Uses of Funds: Deposit to Improvement Fund $30,385, Deposit to Reserve Fund 2,860, Deposit to Bond Fund (1) 1,641, Costs of Issuance (2) 991, Total $35,878, (1) Equal to the amount needed for the payment of interest on the Bonds through and including September 1, (2) Includes Underwriter s discount, initial fees, expenses and charges of the Fiscal Agent, legal fees, costs of printing the Official Statement, fees of the special tax consultant, Appraiser and Municipal Advisor, and other costs of issuance. -12-
19 SECURITY AND SOURCES OF PAYMENT FOR THE BONDS Pledge of Special Tax Revenues and Other Amounts General. The Bonds are secured by a first pledge (which pledge shall be effected in the manner and to the extent provided in the Fiscal Agent Agreement) of all of the Special Tax Revenues and all moneys deposited in the Bond Fund (including the Capitalized Interest Account and the Special Tax Prepayments Account), and, until disbursed as provided in the Fiscal Agent Agreement, in the Special Tax Fund. The Special Tax Revenues and all moneys deposited into such funds (except as otherwise provided in the Fiscal Agent Agreement) are dedicated to the payment of the principal of, and interest and any premium on, the Bonds as provided in the Fiscal Agent Agreement and in the Act until all of the Bonds have been paid and retired or until moneys or Federal Securities have been set aside irrevocably for that purpose. See Special Tax Fund and Improvement Fund, below. The Bonds are also secured by a first pledge (which pledge shall be effected in the manner and to the extent provided in the Fiscal Agent Agreement) of all moneys deposited in the Reserve Fund. The moneys in the Reserve Fund (except as otherwise provided in the Fiscal Agent Agreement) are dedicated to the payment of the principal of, and interest and any premium on, the Bonds as provided in the Fiscal Agent Agreement and in the Act until all of the Bonds have been paid and retired or until moneys or Federal Securities have been set aside irrevocably for that purpose. See Reserve Fund below. Amounts in the Improvement Fund (and the accounts therein), the Administrative Expense Fund, and the Costs of Issuance Fund are not pledged to the repayment of the Bonds. The Authorized Improvements financed by the Bonds are not pledged to the repayment of the Bonds, nor are the proceeds of any condemnation or insurance award received by the City with respect to the facilities authorized to be financed by the District. Definitions. Special Tax Revenues is defined in the Fiscal Agent Agreement to mean the proceeds of the Special Tax received by the City, less the Priority Administrative Expenses Amount (described below), including (a) any scheduled payments thereof, (b) any Special Tax Prepayments, (c) the proceeds of the redemption of any delinquent payments of the Special Tax and (d) the proceeds of redemption or sale of property sold as a result of foreclosure on account of delinquent payments of the Special Tax, but excluding therefrom any penalties collected in connection with any such foreclosure and excluding any Special Taxes deposited in the Special Tax Proceeds Subaccount of the Improvement Fund. Special Tax or Special Taxes means the Special Tax (as defined in the Rate and Method) levied by the City pursuant to the Rate and Method within Improvement Area No. 1 under the Act, the Ordinance and the Fiscal Agent Agreement. See Special Tax Methodology below and APPENDIX A RATE AND METHOD OF APPORTIONMENT OF SPECIAL TAX. Priority Administrative Expenses Amount means (i) for Fiscal Year , the amount of $25,000 and (ii) for each succeeding Fiscal Year, the sum of (A) the Priority Administrative Expenses Amount for the preceding Fiscal Year plus (B) 2% of the Priority Administrative Expenses Amount for the preceding Fiscal Year. -13-
20 Special Taxes A Special Tax applicable to each taxable parcel in Improvement Area No. 1 will be levied and collected according to the tax liability determined by the City Council through the application of the Rate and Method prepared by Goodwin Consulting Group, Inc., Sacramento, California (the Special Tax Consultant ), which is set forth in APPENDIX A hereto, for all taxable properties in Improvement Area No. 1. Interest and principal on the Bonds is payable from the annual Special Taxes to be levied and collected on taxable property within Improvement Area No. 1, from amounts held in the funds and accounts established under the Fiscal Agent Agreement (other than the Improvement Fund (and the accounts therein), the Administrative Expense Fund, and the Costs of Issuance Fund) and from the proceeds, if any, from the sale of such property for delinquency of such Special Taxes. The Special Taxes are collected for the City by the County of Alameda in the same manner and at the same time as ad valorem property taxes. The Special Taxes are exempt from the property tax limitation of Article XIIIA of the California Constitution, pursuant to Section 4 thereof as a special tax authorized by a twothirds vote of the qualified electors. The levy of the Special Taxes was authorized by the City pursuant to the Act in an amount determined according to the Rate and Method approved by the City. See Special Tax Methodology below and APPENDIX A RATE AND METHOD OF APPORTIONMENT OF SPECIAL TAX. The Rate and Method apportions the Special Tax Requirement (as defined in the Rate and Method and described below) among the taxable parcels of real property within Improvement Area No. 1 according to the rate and methodology set forth in the Rate and Method. See Special Tax Methodology below. See also APPENDIX A RATE AND METHOD OF APPORTIONMENT OF SPECIAL TAX. The amount of Special Taxes that Improvement Area No. 1 may levy in any year, and from which principal and interest on the Bonds is to be paid, is strictly limited by the maximum rates approved by the qualified electors within the District which are set forth as the annual Maximum Special Tax in the Rate and Method. Under the Rate and Method, Special Taxes will be levied annually in an amount not in excess of the annual Maximum Special Tax. The Special Taxes and any interest earned on the Special Taxes once deposited in the Special Tax Fund constitute a trust fund for the principal of and interest on the Bonds pursuant to the Fiscal Agent Agreement and, so long as the principal of and interest on the Bonds remains unpaid, the Special Taxes and investment earnings thereon (other than amounts remaining after paying annual debt service, as described herein) will not be used for any other purpose, except as permitted by the Fiscal Agent Agreement, and will be held in trust for the benefit of the owners thereof and will be applied pursuant to the Fiscal Agent Agreement. The City may annually levy the Special Tax at up to the Maximum Special Tax rate, which has been authorized by the qualified electors within Improvement Area No. 1, as set forth in the Rate and Method, if conditions so require, however regularly scheduled debt service on the Bonds is payable from an amount less than that which could be generated by levy of the Maximum Special Tax. The City has covenanted to annually levy the Special Taxes in an amount at least sufficient to pay the Special Tax Requirement (as defined below). Because each annual Special Tax levy is limited to the Maximum Special Tax rates authorized as set forth in the Rate and Method, no assurance can be given that, in the event of Special Tax delinquencies, the amount of the Special Tax Requirement will in fact be collected in any given year. See SPECIAL RISK FACTORS Levy and Collection of the Special Tax herein. -14-
21 Special Tax Methodology The Special Tax authorized under the Act applicable to land within Improvement Area No. 1 will be levied and collected according to the tax liability determined by the City through the application of the appropriate amount or rate as described in the Rate and Method set forth in APPENDIX A RATE AND METHOD OF APPORTIONMENT OF SPECIAL TAX. Capitalized terms set forth in this section and not otherwise defined have the meanings set forth in the Rate and Method. Parcels Subject to the Special Tax. For each Fiscal Year, the City shall (i) categorize each Parcel of Taxable Property as Developed Property or Undeveloped Property, (ii) categorize each Parcel of Developed Property as Single Family Detached Property, Multi- Family Property, or Taxable Non-Residential Property, and (iii) determine if there is any Taxable Homeowners Association Property or Taxable Public Property. For Multi-Family Property, the number of Residential Units shall be determined by referencing the condominium or apartment plan, site plan or other development plan. Annual Special Tax Levy. The Special Tax levy for each Parcel will be established annually based on the Special Tax Requirement which is defined as, for each Fiscal Year, the amount necessary in any Fiscal Year (i) to pay principal and interest on Bonds which are due in the calendar year which begins in such Fiscal Year, (ii) to create and/or replenish reserve funds for the Bonds to the extent such replenishment has not been included in the computation of Special Tax Requirement in a previous Fiscal Year, (iii) to cure any delinquencies in the payment of principal or interest on Bonds which have occurred in the prior Fiscal Year, (iv) to pay Administrative Expenses, and (v) to pay the costs of Authorized Facilities so long as the direct payment for Authorized Facilities does not increase the Special Taxes on Undeveloped Property. The Special Tax Requirement may be reduced in any Fiscal Year by (i) interest earnings on or surplus balances in funds and accounts for the Bonds to the extent that such earnings or balances are available to apply against debt service pursuant to the Indenture or other legal document that sets forth these terms, (ii) proceeds from the collection of penalties associated with delinquent Special Taxes, and (iii) any other revenues available to pay debt service on the Bonds as determined by the Administrator. Termination of the Special Tax. The Special Tax will be levied and collected for as long as needed to pay the principal and interest on the Bonds and other costs incurred in order to construct the Authorized Facilities and all Administrative Expenses have been paid or reimbursed. The Rate and Method provides that the Special Tax may not be levied on any parcel in Improvement Area No. 1 after fiscal year Prepayment of the Special Tax. Landowners may permanently satisfy all or part of the Special Tax obligation by a cash settlement with the City as permitted under Government Code Section and in accordance with the methodology for calculation included in the Rate and Method. Under no circumstance shall a prepayment be allowed that would reduce debt service coverage below the Required Coverage (as defined in the Rate and Method). Levy of Annual Special Tax; Annual Maximum Special Tax The annual Special Tax levy amount will be calculated by the City and levied to provide money for debt service on the Bonds, replenishment of the Reserve Fund, anticipated Special Tax delinquencies, administration of Improvement Area No. 1, and for payment of pay-as-you- -15-
22 go expenditures of the Authorized Improvements or Authorized Facilities not funded from Bond proceeds. In no event may the City levy a Special Tax in any year above the annual Maximum Special Tax rate identified in the Rate and Method. See APPENDIX A - RATE AND METHOD OF APPORTIONMENT OF SPECIAL TAX. The Special Tax will be levied in an amount at least equal to the Special Tax Requirement as described in the Rate and Method and, during the Remainder Taxes Period, shall be levied on Developed Property in an amount equal to the maximum rates, with any Special Taxes remaining after paying debt service on the Bonds (and after paying Administrative Expenses) being used to finance Authorized Improvements. The Remainder Taxes Period means the period through and including the date that is the earlier of (i) the end of the 15th Fiscal Year after which Special Taxes have been levied on property in Improvement Area No. 1 or (ii) the date the Project has been fully funded. The annual Maximum Special Tax levy for Improvement Area No. 1 ranges (based on unit square footage) from $4,342 to $5,075 per detached single family residential unit and from $3,405 to $4,252 per multi-family residential unit for Fiscal Year , and in each subsequent Fiscal Year shall be increased by an amount equal to 2% of the amount in effect for prior Fiscal Year. The property in Improvement Area No. 1 is also subject to an annual special tax of the City s Community Facilities District No (Dublin Crossing Public Services) (the Services CFD ) which includes all of the property in Improvement Area No. 1 of the District. For Fiscal Year , the per-residential unit annual maximum special tax of the Services CFD ranges from $49-$57 for single-family detached units and $38-$48 for multifamily units. The maximum special tax in the Services CFD shall be increased on each July 1, commencing July 1, 2018, by four percent (4%) of the immediately preceding maximum amount. See also SECURITY AND SOURCES OF PAYMENT FOR THE BONDS Special Tax Methodology above. See APPENDIX A RATE AND METHOD OF APPORTIONMENT OF SPECIAL TAX for a copy of the Rate and Method. Limitation on Maximum Annual Special Tax Rate. The annual levy of the Special Tax is subject to the maximum annual Special Tax rate authorized in the Rate and Method. The levy cannot be made at a higher rate even if the failure to do so means that the estimated proceeds of the levy and collection of the Special Tax, together with other available funds, will not be sufficient to pay debt service on the Bonds. In addition to the maximum annual Special Tax rate limitation in the Rate and Method, Section 53321(d) of the Act provides that the special tax levied against any parcel for which an occupancy permit for private residential use has been issued may not be increased as a consequence of delinquency or default by the owner of any other parcel within a community facilities district by more than 10% above the amount that would have been levied in such fiscal year had there never been any such delinquencies or defaults. In cases of significant delinquency, this limitation may result in defaults in the payment of principal of and interest on the Bonds. Special Tax Fund The Special Tax Fund is established under the Fiscal Agent Agreement as a separate fund to be held by the Fiscal Agent, to the credit of which the Fiscal Agent shall deposit -16-
23 amounts received from or on behalf of the City consisting of Special Tax Revenues and other amounts as required by the Fiscal Agent Agreement. Deposit of Special Tax Revenues. The City is obligated by the Fiscal Agent Agreement to promptly remit any Special Tax Revenues received by the City, less an amount not to exceed the lesser of (a) the amount included in the Special Tax levy for such Fiscal Year for Administrative Expenses and (b) the Priority Administrative Expenses Amount for such Fiscal Year (which shall be retained by the City free of the pledge for payment of the Bonds and used for Administrative Expenses), to the Fiscal Agent for deposit by the Fiscal Agent in the Special Tax Fund established under the Fiscal Agent Agreement. Notwithstanding the foregoing: (i) any Special Tax Revenues constituting the collection of delinquencies in payment of Special Taxes shall be separately identified by the Administrative Services Director and will be disposed of by the Fiscal Agent first, for transfer to the Bond Fund to pay any past due debt service on the Bonds; second, for transfer to the Reserve Fund to the extent needed to increase the amount. then on deposit in the Reserve Fund up to the then Reserve Requirement; and third, to be held in the Special Tax Fund and used as described under Disbursements below; (ii) any proceeds of Special Tax Prepayments will be separately identified by the Administrative Services Director and will be deposited by the Fiscal Agent as follows (as directed in writing by the Administrative Services Director): (a) that portion of any Special Tax Prepayment constituting a prepayment of costs of the Authorized Improvements shall be deposited by the Fiscal Agent to the Special Tax Proceeds Subaccount of the Improvement Fund and (b) the remaining Special Tax Prepayment shall be deposited by the Fiscal Agent in the Special Tax Prepayments Account. Moneys in the Special Tax Fund will be held by the Fiscal Agent for the benefit of the City and the Owners of the Bonds, will be disbursed as provided below and, pending disbursement, will be subject to a lien in favor of the Owners of the Bonds. Disbursements. On the third Business Day before each Interest Payment Date, the Fiscal Agent will withdraw from the Special Tax Fund and transfer the following amounts in the following order of priority: (i) to the Bond Fund an amount, taking into account any amounts then on deposit in the Bond Fund and any expected transfers under the Fiscal Agent Agreement from the Reserve Fund, the Capitalized Interest Account, and the Special Tax Prepayments Account to the Bond Fund, such that the amount in the Bond Fund equals the principal (including any mandatory sinking payment), premium, if any, and interest due on the Bonds on the next Interest Payment Date and any past due principal or interest on the Bonds not theretofore paid from a transfer described in the Fiscal Agent Agreement, and (ii) to the Reserve Fund an amount, taking into account amounts then on deposit in the Reserve Fund, such that the amount in the Reserve Fund is equal to the Reserve Requirement, and (iii) on or after each September 10, beginning on September 10, 2018, if directed by an Authorized Officer to do so, transfer money to the City for deposit by the City into the -17-
24 Administrative Expense Fund, an amount requested by the City for Administrative Expenses incurred or foreseeable by the City to be incurred in the next Fiscal Year, and (iv) (A) on or after each September 10, beginning on September 10, 2018 and continuing through the Remainder Taxes Period, all of the moneys remaining in the Special Tax Fund (the Remainder Taxes ) shall be transferred to the Special Tax Proceeds Subaccount of the Improvement Fund free of the pledge for payment for the Bonds and (B) on and after the September 10 following the end of the Remainder Taxes Period, all or a portion of the moneys remaining in the Special Tax Fund shall be transferred to the City as surplus moneys belonging to the Improvement Area No. 1, free of the pledge for payment of the Bonds, and used for any purpose authorized under the Act. Administrative Expense Fund Moneys in the Administrative Expense Fund shall be held by the Administrative Services Director for the benefit of the City, and shall be disbursed from time to time to pay for Administrative Expenses. Annually, on the last day of each Fiscal Year, the Administrative Services Director shall withdraw from the Administrative Expense Fund and transfer to the Fiscal Agent for deposit into the Special Tax Fund any amount in excess of that which is needed to pay any Administrative Expenses, and which is not otherwise encumbered. Reserve Fund A Reserve Fund (the Reserve Fund ) for the Bonds will be established under the Fiscal Agent Agreement, to be held by the Fiscal Agent. Upon delivery of the Bonds, the amount on deposit in the Reserve Fund will be established by depositing certain proceeds of the Bonds in the amount of the Reserve Requirement for the Bonds, which is, as of the date of any calculation, an amount equal to the least of (i) Maximum Annual Debt Service on the Outstanding Bonds, (ii) 125% of average Annual Debt Service on the Outstanding Bonds and (iii) 10% of the original principal amount of the Bonds. The City is required to maintain an amount of money or other security equal to the Reserve Requirement in the Reserve Fund at all times that the Bonds are outstanding. All amounts deposited in the Reserve Fund will be used and withdrawn by the Fiscal Agent solely for the purpose of making transfers to the Bond Fund in the event of any deficiency at any time in the Bond Fund of the amount then required for payment of the principal of, and interest on, the Bonds. Whenever transfer is made from the Reserve Fund to the Bond Fund due to a deficiency in the Bond Fund, the Fiscal Agent will provide written notice thereof to the City. Whenever, on the Business Day prior to any Interest Payment Date, the amount in the Reserve Fund exceeds the then applicable Reserve Requirement, the Fiscal Agent will transfer an amount equal to the excess from the Reserve Fund to the Bond Fund or the Improvement Fund as provided below, except that investment earnings on amounts in the Reserve Fund may be withdrawn from the Reserve Fund for purposes of making payment to the Federal government to comply with rebate requirements. Moneys in the Reserve Fund will be invested and deposited in accordance with the Fiscal Agent Agreement. Interest earnings and profits resulting from the investment of moneys in the Reserve Fund and other moneys in the Reserve Fund will remain therein until the balance -18-
25 exceeds the Reserve Requirement; any amounts in excess of the Reserve Requirement will be transferred to the Special Tax Proceeds Subaccount of the Improvement Fund, until the Improvement Fund is closed, or if the Improvement Fund has been closed, to the Bond Fund to be used for the payment of the principal of and interest on the Bonds in accordance with the Fiscal Agent Agreement. Whenever the balance in the Reserve Fund exceeds the amount required to redeem or pay the Outstanding Bonds, including interest accrued to the date of payment or redemption and premium, if any, due upon redemption, and make any other transfer required under the Fiscal Agent Agreement, the Fiscal Agent will transfer the amount in the Reserve Fund to the Bond Fund to be applied, on the next succeeding Interest Payment Date, to the payment and redemption of all of the Outstanding Bonds. If the amount so transferred from the Reserve Fund to the Bond Fund exceeds the amount required to pay and redeem the Outstanding Bonds, the balance in the Reserve Fund will be transferred to the City, after payment of any amounts due the Fiscal Agent, to be used for any lawful purpose of the City. For additional provisions related to Parity Bonds, see APPENDIX C. Improvement Fund Under the Fiscal Agent Agreement, there is established an Improvement Fund (and two separate subaccounts shall be established within the Improvement Fund, the Bond Proceeds Subaccount and the Special Tax Proceeds Subaccount), which is to be held by the Fiscal Agent and to the credit of which fund deposits shall be made as required by the Fiscal Agent Agreement. Moneys in the Improvement Fund and the subaccounts will be disbursed as provided in the Fiscal Agent Agreement for the payment or reimbursement of the costs of the construction and acquisition of the Authorized Improvements in accordance with the Acquisition Agreement (as described herein). Moneys held in the Special Tax Proceeds Subaccount will be used to finance the costs of the Authorized Improvements pursuant to the Acquisition Agreement. None of the amounts in the Improvement Fund (and any subaccounts thereof) are pledged for payment of the Bonds. Upon completion of the Authorized Improvements and payment to the Developer pursuant to the Acquisition Agreement, and following notice being provided to the Developer as specified in the Fiscal Agent Agreement, the City will transfer the amount, if any, remaining in the Improvement Fund to the Fiscal Agent for deposit in the Bond Fund for application to the payment of principal of and interest on the Bonds in accordance with the Fiscal Agent Agreement, and the Improvement Fund will be closed. Delinquent Payments of Special Tax; Covenant for Superior Court Foreclosure The Special Tax will be collected in the same manner and the same time as ad valorem property taxes, except at the City s option, the Special Taxes may be billed directly to property owners. In the event of a delinquency in the payment of any installment of Special Taxes, the City is authorized by the Act to order institution of an action in superior court to foreclose the lien therefor. The City has covenanted in the Fiscal Agent Agreement with and for the benefit of the Owners of the Bonds that it will order, and cause to be commenced as hereinafter provided, and thereafter diligently prosecute to judgment (unless such delinquency is theretofore brought current), an action in the Alameda County Superior Court to foreclose the lien of any Special -19-
26 Tax or installment thereof not paid when due as provided in the following two paragraphs. The Administrative Services Director shall notify the City Attorney of any such delinquency of which the Administrative Services Director is aware, and the City Attorney shall commence, or cause to be commenced, such proceedings. On or about June 1 of each Fiscal Year, the Administrative Services Director shall compare the amount of Special Taxes theretofore levied in Improvement Area No. 1 to the amount of Special Tax Revenues theretofore received by the City, and: (i) Individual Delinquencies. If the Administrative Services Director determines that any single parcel subject to the Special Tax in Improvement Area No. 1 is delinquent in the payment of Special Taxes in the aggregate amount of $10,000 or more, then the Administrative Services Director shall send or cause to be sent a notice of delinquency (and a demand for immediate payment thereof) to the property owner within 45 days of such determination, and, if the delinquency remains uncured, foreclosure proceedings shall be commenced by the City within 90 days of such determination. (ii) Aggregate Delinquencies. If the Administrative Services Director determines that the total amount of delinquent Special Tax for the entire Improvement Area No. 1 (including the total of delinquencies under subsection (A) above), exceeds 5% of the total Special Tax due and payable for the entire Improvement Area No. 1 for the Fiscal Year ending on such June 1, the Administrative Services Director shall notify or cause to be notified property owners who are then delinquent in the payment of Special Taxes (and a demand for immediate payment of the delinquency) within 45 days of such determination, and shall commence foreclosure proceedings within 90 days of such determination against each parcel of land in Improvement Area No. 1 for which a Special Tax delinquency remains uncured. Under the Act, foreclosure proceedings are instituted by the bringing of an action in the superior court of the county in which the parcel lies, naming the owner and other interested persons as defendants. The action is prosecuted in the same manner as other civil actions. In such action, the real property subject to the special taxes may be sold at a judicial foreclosure sale for a minimum price which will be sufficient to pay or reimburse the delinquent special taxes. The owners of the Bonds benefit from the Reserve Fund established pursuant to the Fiscal Agent Agreement; however, if delinquencies in the payment of the Special Taxes with respect to the Bonds are significant enough to completely deplete the Reserve Fund, there could be a default or a delay in payments of principal and interest to the owners of the Bonds pending prosecution of foreclosure proceedings and receipt by the City of the proceeds of foreclosure sales. Provided that it is not levying the Special Tax at the annual Maximum Special Tax rates set forth in the Rate and Method, the City may adjust (but not to exceed the annual Maximum Special Tax) the Special Taxes levied on all property within Improvement Area No. 1 subject to the Special Tax to provide an amount required to pay debt service on the Bonds and to replenish the Reserve Fund. Under current law, a judgment debtor (property owner) has at least 140 days from the date of service of the notice of levy in which to redeem the property to be sold. If a judgment -20-
27 debtor fails to redeem and the property is sold, his or her only remedy is an action to set aside the sale, which must be brought within 90 days of the date of sale. If, as a result of such an action a foreclosure sale is set aside, the judgment is revived and the judgment creditor is entitled to interest on the revived judgment as if the sale had not been made (California Code of Civil Procedure Section ). Foreclosure by court action is subject to normal litigation delays, the nature and extent of which are largely dependent upon the nature of the defense, if any, put forth by the debtor and the condition of the calendar of the superior court of the county. Such foreclosure actions can be stayed by the superior court on generally accepted equitable grounds or as the result of the debtor s filing for relief under the Federal bankruptcy laws. The Act provides that, upon foreclosure, the Special Tax lien will have the same lien priority as is provided for ad valorem taxes and special assessments. No assurances can be given that the real property subject to a judicial foreclosure sale will be sold or, if sold, that the proceeds of sale will be sufficient to pay any delinquent Special Tax installment. The Act does not require the District to purchase or otherwise acquire any lot or parcel of property foreclosed upon if there is no other purchaser at such sale. Section of the Act requires that property sold pursuant to foreclosure under the Act be sold for not less than the amount of judgment in the foreclosure action, plus postjudgment interest and authorized costs, unless the consent of the owners of 75% of the outstanding Bonds is obtained. However, under Section of the Act, the District, as judgment creditor, is entitled to purchase any property sold at foreclosure using a credit bid, where the District could submit a bid crediting all or part of the amount required to satisfy the judgment for the delinquent amount of the Special Tax. If the District becomes the purchaser under a credit bid, the District must pay the amount of its credit bid into the redemption fund established for the Bonds, but this payment may be made up to 24 months after the date of the foreclosure sale. Additional Bonds Following issuance of the Bonds, the City will not issue Parity Bonds (exclusive of any Refunding Bonds) in a principal amount which, when added to the initial principal amount of the Bonds, exceeds $46 million. Subject to that limitation, in addition to the Bonds, the City may issue Parity Bonds in such principal amount as shall be determined by the City under a Supplemental Agreement entered into between the City and the Fiscal Agent. Any such Parity Bonds shall be secured by a parity lien on the Special Tax Revenues and funds pledged for the payment of the Bonds under the Fiscal Agent Agreement on a parity with all other bonds Outstanding under the Fiscal Agent Agreement. The City may issue such Parity Bonds subject to the following specific conditions precedent: (i) The City shall be in compliance with all covenants set forth in the Fiscal Agent Agreement and all Supplemental Agreements, and issuance of the Parity Bonds shall not cause the City to exceed the limitation on debt (as defined in the Act) for Improvement Area No. 1. (ii) The Supplemental Agreement providing for the issuance of such Parity Bonds shall provide that interest thereon shall be payable on Interest Payment Dates, and principal thereof shall be payable on September 1 in any year in which principal is -21-
28 payable on the Parity Bonds (provided that there shall be no requirement that any Parity Bonds pay interest on a current basis). (iii) The Supplemental Agreement providing for the issuance of such Parity Bonds may provide for the establishment of separate funds and accounts and may, in the alternative, provide for subaccounts within the funds and accounts established hereunder. The Supplemental Agreement shall specify whether or not the Parity Bonds are secured by the Reserve Fund on a parity with the 2017 Bonds, and if so,proceeds of the Parity Bonds shall be deposited into the Reserve Fund in the amount that shall cause the balance in the Reserve Fund to be equal to the Reserve Requirement for the Bonds to be outstanding following issuance of the Parity Bonds that are secured by the Reserve Fund. (iv) The Improvement Area No. 1 Value shall be at least three (3) times the sum of: (i) the aggregate principal amount of all Bonds then Outstanding, plus (ii) the aggregate principal amount of the series of Parity Bonds proposed to be issued, plus (iii) the aggregate principal amount of any fixed assessment liens on the parcels in the District subject to the levy of Special Taxes, plus (iv) a portion of the aggregate principal amount of any and all other community facilities district bonds then outstanding and payable at least partially from special taxes to be levied on parcels of land within the District (the Other District Bonds ) equal to the aggregate outstanding principal amount of the Other District Bonds multiplied by a fraction, the numerator of which is the amount of special taxes levied for the Other District Bonds on parcels of land within the District, and the denominator of which is the total amount of special taxes levied for the Other District Bonds on all parcels of land against which the special taxes are levied to pay the Other District Bonds (such fraction to be determined based upon the maximum special taxes which could be levied in the year in which maximum annual debt service on the Other District Bonds occurs), based upon information from the most recent Fiscal Year for which information is available. (v) For each Fiscal Year after issuance of the Parity Bonds, the maximum amount of the Special Taxes that may be levied for such Fiscal Year under the Ordinance, the Agreement and any Supplemental Agreement less the Priority Administrative Expense Amount for each respective Fiscal Year, shall be at least 110% of the total Annual Debt Service of the then Outstanding Bonds and the proposed Parity Bonds for each Bond Year that commences in each such Fiscal Year. Notwithstanding the foregoing, the City may issue refunding bonds as Parity Bonds without the need to satisfy the requirements of clauses (iv) or (v) above. Nothing in the Fiscal Agent Agreement prohibits the City from issuing any other bonds or otherwise incurring debt secured by a pledge of the Special Tax Revenues subordinate to the pledge thereof for the Bonds and Parity Bonds. -22-
29 DEBT SERVICE SCHEDULE The annual debt service on the Bonds, based on the interest rates and maturity schedule set forth on the cover of this Official Statement, is set forth below. Improvement Area No. 1 Community Facilities District No (Dublin Crossing) Special Tax Bonds Series 2017 Debt Service Year Ending (Sept. 1) Principal Interest Total 2018 $ $1,641,547.22* $1,641,547.22* ,000 1,637, ,727, ,000 1,632, ,762, ,000 1,626, ,796, ,000 1,617, ,832, ,000 1,606, ,871, ,000 1,593, ,908, ,000 1,577, ,947, ,000 1,559, ,984, ,000 1,538, ,023, ,000 1,513, ,063, ,000 1,486, ,106, ,000 1,455, ,150, ,000 1,420, ,190, ,000 1,382, ,232, ,000 1,339, ,279, ,030,000 1,292, ,322, ,130,000 1,241, ,371, ,235,000 1,184, ,419, ,345,000 1,122, ,467, ,460,000 1,055, ,515, ,585, , ,567, ,715, , ,618, ,855, , ,672, ,000, , ,724, ,155, , ,779, ,315, , ,832, ,490, , ,891, ,670, , ,946, ,865, , ,008, Total 32,740,000 35,914, ,654, * Paid from capitalized interest. -23-
30 THE DUBLIN CROSSING PROJECT The Developer has provided the following information with respect to development of the Dublin Crossing Project. No assurance can be given that all information is complete. No assurance can be given that development of the property will be completed, or that it will be completed in a timely manner. Since the ownership of the parcels is subject to change, the development plans outlined below may not be continued by the subsequent owner if the parcels are sold, although development by any subsequent owner will be subject to the Development Agreement and the policies and requirements of the City. No assurance can be given that the plans or projections detailed below will actually occur. The property in Improvement Area No. 1 is part of the larger Dublin Crossing project ( Dublin Crossing Project ). The Dublin Crossing Project consists of approximately 190 acres, of which approximately 33 gross acres (28 net taxable acres) is within Improvement Area No. 1 and the remainder, approximately 157 acres, is within property identified as Future Annexation Area. Dublin Crossing Specific Plan The Dublin Crossing Specific Plan ( Specific Plan ), as amended from time to time, is a plan for the orderly development of approximately 190 acres located in the center of the City, north of Interstate 580 and Dublin Boulevard. The site is located at the southern edge of the 2,485-acre Camp Parks Reserve Forces Training Area ( Camp Parks ). The U.S. Army Reserve (the Army Reserve ) and the Developer have an agreement whereby the Army Reserve has and will transfer the Specific Plan portions of the Camp Parks site to the Developer, as described below. Development in the Specific Plan area is generally planned to be comprised of residential units, parks and open space, and a school. Specifically, Specific Plan development includes a maximum of up to 1,995 residential units, a 30 net-acre Community Park, 2 acres of open space, and a school site. The Specific Plan also allows, but nothing requires, the development of up to 200,000 square feet of commercial use. The Developer does not currently intend to develop any commercial uses. The Specific Plan area is generally flat and buildable, with homes currently under construction and a significant portion undeveloped. Two seasonal drainage channels traverse the site, one north to south generally through the middle of the project site, and another along the eastern border, parallel to Arnold Road. The City of Dublin General Plan (1985) provides a broader city-wide framework to support future land use and development decisions in the Specific Plan area. California state law requires this Specific Plan to be consistent with the policies and standards contained in the General Plan. Together with the Specific Plan, the City will approve any necessary General Plan amendments to provide for the land uses, goals and policies in this Specific Plan. In situations where policies or standards relating to a particular subject have not been provided in the Specific Plan, the existing policies and standards in the General Plan will continue to apply. Regional Setting. The Specific Plan area is located in eastern Alameda County, near the center of the Tri-Valley region. As a part of the Eastern San Francisco Bay Area, the City of Dublin plays an important regional role due to its close proximity to major metropolitan centers, including San Francisco (35 miles northwest), Oakland (30 miles northwest) and Silicon Valley -24-
31 (25 miles southwest). The City is home to the Dublin/Pleasanton and West Dublin/Pleasanton Bay Area Rapid Transit (BART) stations, Interstates 580 and 680, and the Iron Horse Regional Trail, a multi-modal trail that links numerous cities within Alameda and Contra Costa counties. Local Setting. The approximate 190-acre Specific Plan area is centrally located in the City of Dublin and is bound by a network of streets; 5th and 6th street to the north on the active Camp Parks installation, Arnold Road to the east, Dublin Boulevard to the south and Scarlett Drive (with future extension) to the west. The Specific Plan area location adjacent to the Iron Horse Regional Trail, and close to the Dublin/Pleasanton BART station, with the station entrance approximately one-third mile to the south of the project area boundary, offer a possible amenity for urban oriented buyers. Background-Reuse of Former Army Reserve Property. This Specific Plan is the result of a multi-year effort by the Army Reserve, the City, community members, and the Prior Owner to create a plan for development of the Specific Plan area. In 2002, the Army Reserve formally requested an amendment to the General Plan to change the land use designation on the project site from Public Lands to a combination of commercial retail, office space, residential, and open space uses. On April 15, 2003, the Dublin City Council authorized the commencement of a General Plan Amendment study to initiate a comprehensive General Plan Amendment and Specific Plan program over an approximately 172-acre portion of the 2,485-acre Camp Parks area (the Army Reserve Property ), a 8.5- acre NASA parcel (the NASA Property ), and an 8.7-acre Alameda County Surplus Property Authority parcel (the ACSPA Property ). The General Plan Amendment study did not authorize a change in the land use designation on the property but permitted City Staff, in partnership with the Army Reserve, to engage the involvement of the community in several strategic visioning meetings. These meetings were used to create a cohesive vision for future development of the site. Based on the information provided from several community meetings, five conceptual land use plans, each illustrating different land use scenarios, were formulated. The City Council held a series of meetings in 2005 to review the five conceptual land use alternatives. Input from these meetings served as the basis for selecting a preferred land use plan for future development of the area. In December 2007, the Army Reserve and NASA prepared a Notice of Availability to solicit a master developer for the Camp Parks Real Property Exchange Area. The Prior Owner and the United States Army Corps of Engineers entered into an exchange agreement dated March 4, 2011 (the Exchange Agreement ), The Exchange Agreement provides the Army Reserve with an opportunity to construct new and modernize existing facilities through the provision of approximately 172-acres of the Army Reserve Property (in addition to the NASA Property and the ACSPA Property), to a developer in exchange for Camp Parks facilities improvements. The Exchange Agreement is not a part of the Specific Plan but was necessary to facilitate acquisition of the property by the Prior Owner. In October 2008, the Army Reserve announced the selection of the master developer for the exchange project. In April 2011, the Prior Owner and the Army Reserve officially finalized the Exchange Agreement, authorizing the Prior Owner to commence the General Plan Amendment and Specific Plan process and giving the Prior Owner the right acquire the Army Reserve Property in phases, as certain facilities (located outside of the Dublin Crossing Project) are constructed by the developer and conveyed to the Army Reserve. -25-
32 Pursuant to the Exchange Agreement, the Prior Owner and the Army Reserve agreed that the Prior Owner has the right acquire the Army Reserve Property from the Army Reserve in phases, as certain facilities (located outside of the Dublin Crossing Project) are constructed by the Prior Owner and conveyed to the Army Reserve. When purchasing property from the Prior Owner, the Developer assumed all rights and obligations under the Exchange Agreement. The Prior Owner and, following its acquisition of the project, the Developer acquired portions of the Army Reserve Property, as described in the table at THE DUBLIN CROSSING PROJECT Status of Construction of the Dublin Crossing Project. As of June 1, 2017, the property in Phases 3-5 remains owned by the Army Reserve but subject to acquisition by the Developer pursuant to the Exchange Agreement. In addition to the Exchange Agreement, the Prior Owner entered into an agreement dated January 11, 2013 (the NASA Agreement ) with the National Aeronautics and Space Administration ( NASA ) for the purchase of the NASA Property located adjacent to the Army Reserve Property, which will be part of Phase 2 of the Dublin Crossing Project. When purchasing property from the Prior Owner, the Developer assumed all rights and obligations under the NASA Agreement. On August 28, 2015, the Developer acquired the NASA Property. In addition to the Exchange Agreement and the NASA Agreement, the Prior Owner entered into an agreement with the City (the City Agreement ) for the purchase of the ACSPA Property, which will be part of Phase 2 of the Dublin Crossing Project. When purchasing property from the Prior Owner, the Developer assumed all rights and obligations under the City Agreement. On March 23, 2017, the Developer acquired the ACSPA Property. The Army Reserve Property, the NASA Property, and the ACSPA Property, collectively, comprise the property to be developed as the Dublin Crossing Project. All such property is subject to the Development Agreement, dated November 19, 2013, by and between the City and the Prior Owner (as amended from time to time, the Development Agreement ). The Development Agreement allows for the construction of up to 1,995 residential units, a 30 net acre community park, open space, a school site, and associated infrastructure to serve the project area described in the Dublin Crossing Specific Plan, approved by the City in 2013 pursuant to Resolution No The Development Agreement also allows, but nothing requires, the development of up to 200,000 square feet of commercial use. The Developer does not currently intend to develop any commercial uses. The Development Agreement may be amended from time to time, most recently on May 16, 2017 to, among other things, revise the park construction obligation. In 2015, the Developer acquired from the Prior Owner certain property in the Dublin Crossing Project (including all of Phase 1A) as well as the rights to develop the remainder of the property in the Dublin Crossing Project. On August 28, 2015, the Prior Owner assigned the Development Agreement to the Developer, and the Developer assumed all of the rights and obligations under the Development Agreement. The Exchange Agreement, NASA Agreement and City Agreement provide for the acquisition of the property in six phases, as follows: A. Phase 1A: Phase 1A was acquired from the Army Reserve by the Prior Owner and was sold by the Prior Owner to the Developer on August 28, As consideration for the acquisition from the Army Reserve, the Prior Owner constructed a facility known as the Access Control Point. -26-
33 B. Phase 1B: Phase 1B was acquired from the Army Reserve by the Developer on October 19, As consideration for the acquisition from the Army Reserve, the Developer constructed various infrastructure roads and utilities for the Army Reserve. C. Phase 2: Phase 2 was acquired in three transactions. First, a portion of Phase 2 was acquired from the Army Reserve by the Developer on March 17, As consideration for the acquisition from the Army Reserve, the Developer constructed area maintenance support facilities. Second, the NASA Property was acquired by the Developer on August 28, Third, on March 23, 2017, the Developer acquired the ACSPA Property. D. Phase 3: Phase 3 is anticipated to be acquired from the Army Reserve by the Developer in June, 2018 following the completion of a regional medical training site estimated to cost $17,122,000. E. Phase 4: Phase 4 is anticipated to be acquired from the Army Reserve by the Developer in December, 2017 following the completion of, or posting security for, the completion of an army regional training center estimated to cost $10,284,000. F. Phase 5: Phase 5 is anticipated to be acquired from the Army Reserve by the Developer in June, 2018 following the completion of a logistical warehouse estimated to cost $11,115,000. The Developer anticipates developing each phase of the Dublin Crossing Project following acquisition of the phase from the Army Reserve. No guarantee can be given that the Developer will acquire any future phases of the property from the Army Reserve: If acquired, the Developer anticipates developing the property in five phases, as described in the Development Agreement and as follows: 1. Phase 1A/1B: Phase 1A is expected to consist of 313 single-family units (69 detached and 244 attached). At the time of formation of the District, Phase 1A was the only property in Improvement Area No. 1. Phase 1B is expected to consist of 140 single-family units (60 detached and 80 attached). At the time of formation of the District, Phase 1B was part of the Future Annexation Area. On June 20, 2017, the owners of Phase 1B (CalAtlantic and Brookfield Fillmore LLC) submitted consents to the City for the annexation of their respective Phase 1B property into Improvement Area No. 1, and Phase 1B is now part of Improvement Area No Phase 2: Phase 2 is expected to consist of 508 single-family units (134 detached and 374 attached) and a portion of the 30-acre public park. The Developer is also constructing a 15,000 square foot recreation center that will eventually be owned by the homeowner s association; the cost is estimated at $11 million and is anticipated to be opened in Phase 3: Phase 3 is expected to consist of 283 single-family units (77 detached and 206 attached), a portion of the 30-acre public park, and a school site. 4. Phase 4: Phase 4 is expected to consist of 166 single-family units (75 detached and 91 attached) and approximately 2 acres of open space. 5. Phase 5: Phase 5 is expected to consist of 340 single-family units (162 detached and 178 attached). -27-
34 Following the annexation of Phase 1B, Improvement Area No. 1 comprises the expected 453 lots in both Phase 1A and Phase 1B. The remaining phases are part of the Future Annexation Area and are not, and will not be, subject to the Special Tax securing the Bonds. The table below shows the expected phases within the Dublin Crossing Project and expected construction commencement dates. STATUS OF CONSTRUCTION OF THE DUBLIN CROSSING PROJECT Phase/Projected Improvement Area Projected Land Development Tract Map Status Projected Schedule Phase 1A/1B Improvement Area No units (129 single-family detached units; and 324 single-family attached units) (1) Finished lots by early 2017, housing construction commenced mid-2017 Phase 2 Improvement Area No single-family detached units; 374 single-family attached units; and a portion of the 30-acre park; the Developer is also constructing a 15,000 square foot recreation center that will eventually be owned by the homeowner s association (est. cost $11 million) Large Lot Only Lots and housing commencement subject to housing market; sheet graded pads projected to be delivered in 2017 Phase 3 Improvement Area No single-family detached units; 206 single-family attached units; a portion of the 30-acre park; and a school site N/A Acquisition from Army Reserve in June 2018; Lots and housing commencement subject to housing market. Phase 4 Improvement Area No single-family detached units; 91 single-family attached units; and approximately 2 acres of open space N/A Acquisition from Army Reserve in December 2017; Lots and housing commencement subject to housing market. Phase 5 Improvement Area No single-family detached units; and 178 single-family attached units (1) See IMPROVEMENT AREA NO. 1 Improvement Area No. 1 Ownership. N/A Acquisition from Army Reserve in June 2018; Lots and housing commencement subject to housing market. Only the property in Improvement Area No. 1 (Phase 1A and Phase 1B) is subject to the Special Tax that secures payment on the Bonds. The property that is anticipated to be developed as Phases 2-5, inclusive, are not subject to the lien of the Special Tax and will not be subject to a special tax securing the Bonds in the future. -28-
35 Public Improvements Required for the Dublin Crossing Project Improvements. The following table shows the improvements and fees required for (i) the development of the Dublin Crossing Project (including Phases 1A and 1B) and (ii) separately, Phases 1A and 1B (i.e., Improvement Area No. 1) of the Dublin Crossing Project. The table also identifies those improvements and fees that are authorized to be financed by the District (i.e., Improvement Area No. 1 and all future Improvement Areas). Finally, the table illustrates the improvements and fees payable by the Developer and those to be paid by the current Merchant Builders of Improvement Area No. 1 and merchant builders in future Improvement Areas. Cost estimates are as of June 1, ESTIMATED PROJECT COSTS Estimated Cost for Dublin Crossing Project Estimated Cost for Improvement Area No. 1 Eligible Costs to be Incurred by Developer City of Dublin Improvements Backbone Storm Drainage $17,099,530 $3,956,330 Backbone Street Improvements 25,505,760 4,391,450 Master Landscaping, Fencing and Signage on Public Property, 4,733, ,430 Including Public Easements and Rights-of-Way City of Dublin Capital Impact Fees 15,592,940 5,912,850 Dublin-San Ramon Sanitation District Improvements Backbone Domestic Water 2,686, ,720 Backbone Reclaimed Water 1,702, ,490 Backbone Sanitary Sewer 2,560, ,770 Dublin-San Ramon Sanitation District Fees 4,375,000 1,132,500 Zone 7 Improvements Backbone Storm Drainage 2,512,750 0 Zone 7 Fees 0 0 Public Utility Facilities Improvements 6,111,230 1,598,730 Park Design and Improvements 12,757,000 0 Developer Incurred Eligible Costs Totals 95,636,600 19,752,270 Eligible Costs to be Incurred by Current and Future Merchant Builders City of Dublin Capital Impact Fees 23,784,012 5,934,284 Dublin-San Ramon Sanitation District Fees 49,442,026 12,608,175 Zone 7 Fees 50,123,500 12,974,826 Current and Future Merchant Builders Incurred Eligible Costs Totals Total Eligible Costs (Developer and Current and Future Merchant Builders) Non-Eligible Costs to be Incurred by Developer (excluding land acquisition, military structure and design costs, and related expenses) 123,349,538 31,517, ,986,138 51,269,555 91,830,754 24,662,961 Grand Total Costs (Dublin Crossing Project) $310,816,892 $75,932,516 Of the total estimated amounts required to be expended by the Developer for the Dublin Crossing Project (not including land acquisition, military structure design and construction, and related expenses) in the total of $187,467,354, the Developer has expended approximately $52,970,621, as of June 1,
36 Acquisition Agreement In connection with the issuance of the Bonds, the Developer and the City entered into an Acquisition Agreement, dated as of July 18, 2017 (the Acquisition Agreement ). Pursuant to the Acquisition Agreement, the City will purchase certain public capital improvements and finance certain development impact fees for the construction of public capital improvements (together, the Authorized Improvements ) from the Developer, but solely from the net proceeds of bonds issued for the District, certain investment earnings thereon and special taxes collected within each Improvement Area of the District that are allocated to Authorized Improvements. The improvements shown in the above Estimated Infrastructure Costs Table as Eligible Costs to be incurred by the Developer, the current Merchant Builders and future merchant builders are the Authorized Improvements and are eligible for financing pursuant to the Acquisition Agreement. When the Developer or a merchant builder has completed an Authorized Improvement, it may submit payment requisition to the City requesting payment of its Actual Cost incurred (as defined in the Acquisition Agreement). The City will determine if the Authorized Improvement thereof has been completed to City standards and whether all required documentation, such as proper conveyance of title (where that is required), lien releases, title insurance, etc. has been submitted. If the City so determines, the City will review the payment requisition, and may request additional information to substantiate the requisition, and may disallow portions not properly substantiated. To the extent the payment requisition is approved by the City, the City will submit a disbursement request form to the Fiscal Agent, requesting the Fiscal Agent to make payment for the approved costs to the extent funds are available in the Improvement Fund. For capital improvement fees that are part of the Authorized Improvements, such fees will be paid out of the proceeds of the Bonds through a similar requisition process as described above. The net proceeds of the Bonds, certain investment earnings thereon and the Special Tax are expected to be sufficient to fund a portion, but not all, of the Authorized Improvements. The Developer anticipates that bond proceeds from the property in future phases of the Dublin Crossing Project, revenues from land sales, and Developer s equity will be used to fund some or all of the remaining portion of the Authorized Improvements. The Rate and Method provides that the funding of Improvement costs can also be made from collections of the Special Tax available as the pay-as-you-go component of Special Taxes, also described herein as the Remainder Taxes. The Remainder Taxes will provide for funding of the cost of the Authorized Improvements. By agreement between the City and the Developer, Remainder Taxes are limited to 15 years from each Improvement Area and the Developer expects to utilize it for that time period. See SECURITY AND SOURCES OF PAYMENT FOR THE BONDS Special Tax Methodology and Special Tax Fund. Market Pricing and Absorption Analysis In connection with the issuance of the Bonds, the City hired Robert Charles Lesser & Co., LLC, Los Angeles, California (the Pricing Consultant ) to prepare a market pricing and absorption analysis for the homes planned for Phase 1 of the residential development program in the District, dated April 28, 2017 (the Pricing Report ). Phase 1 consists of the 453 homes (129 single-family detached units and 324 single-family attached units) anticipated to be built in Improvement Area No. 1. The City is not obligated to make, and has not undertaken to make, an independent verification of the information contained in the Original Price Point Study and -30-
37 assumes no responsibility for the accuracy or completeness of the Original Price Point Study. A copy of the Pricing Report is set forth in its entirety as APPENDIX E - PRICING REPORT. Formation of the District IMPROVEMENT AREA NO. 1 On April 21, 2015, the City Council adopted a Resolution of Intention to form a community facilities district under the Act, to levy a special tax and to incur bonded indebtedness for the purpose of financing the Authorized Improvements. After conducting a noticed public hearing, on June 2, 2015, the City Council adopted the Resolution of Formation, which established the District and Improvement Area No. 1 thereof, and designated the Future Annexation Area, which may include all or a portion of four additional improvement areas described as Improvement Area No. 2, Improvement Area No. 3, Improvement Area No. 4, and Improvement Area No. 5. The Resolution of Formation also set forth the Rate and Method within the District and each Improvement Area, and set forth the necessity to incur bonded indebtedness in a total amount not to exceed $150 million for the District and as follows for each Improvement Area: $46 million for Improvement Area No. 1, $34 million for Improvement Area 2, $23 million for Improvement Area 3, $12 million for Improvement Area 4 and $35 million for Improvement Area 5. On the same day, an election was held within the District in which the Prior Owner (who was then the only eligible landowner voter in the District) unanimously approved the proposed bonded indebtedness and the levy of the Special Tax. See IMPROVEMENT AREA NO. 1 - Improvement Area No. 1 Ownership below. To finance Authorized Improvements that will be owned by the Dublin-San Ramon Services District ( DSRSD ), the City, the Developer, and DSRSD entered into a Joint Community Facilities Agreement dated January 10, To finance Authorized Improvements to be owned by Zone 7 of the Alameda County Flood Control and Water Conservation District ( Zone 7 ), the Developer anticipates entering into a Joint Community Facilities Agreement with the City and Zone 7 before the end of calendar year Until a Joint Community Facilities Agreement is entered into with Zone 7, Authorized Facilities to be owned by Zone 7 may not be financed with the proceeds of any bonds issued by the District. None of the Authorized Improvements to be financed with the Bonds are to be owned by Zone 7. Future Annexation Area. Land within the Future Annexation Area will be annexed into an Improvement Area of the District and a special tax will be levied on such territory only with the unanimous approval of the owner or owners of each parcel or parcels at the time of annexation into the respective Improvement Area, whereupon a special tax will become a continuing lien against all non-exempt real property in the annexed portion of the Future Annexation Area. Bonds for each Improvement Area will be secured by special taxes only from such respective Improvement Area. Additional bonds for Improvement Area No. 1 are expected to be issued in the future, subject to the conditions set forth in the Fiscal Agent Agreement. Special taxes of each Improvement Area will secure only bonds issued by that respective Improvement Area. -31-
38 Location and Description of Improvement Area No. 1 and the Immediate Area Improvement Area No. 1 is generally located at the northwest quadrant of Dublin Boulevard and Arnold Road; Phases 1A and 1B are noncontiguous with Phase 1A along the north line of Dublin Boulevard between Fernandez Street and Keppler Street and Phase 1B along the west line of Arnold Road and the south line of 6th Street. Improvement Area No. 1 is in the immediate vicinity of the Dublin BART (Bay Area Rapid Transit) station and neighborhood and regional commercial establishments, including Whole Foods, Nordstrom Rack, Best Buy and a variety of smaller retail stores and restaurants. The development is near multiple off-ramps of Interstate 580, a major Bay Area freeway. Other adjacent uses include residential, office and light industrial, and a County jail facility to the north. Zoning. The land in Improvement Area No. 1 is zoned Dublin Crossing Medium-High Density Residential (DC M-HDR), Dublin Crossing Medium Density Residential (DC MDR), and General Commercial/Dublin Crossing High Density Residential (GC/DC HDR). See THE DUBLIN CROSSING PROJECT above. Seismic Area. According to the Seismic Safety Commission, Improvement Area No. 1 is located within Zone 4, which is considered to be the highest risk zone in California. There are only two zones in California: Zone 4, which is assigned to areas near major faults; and Zone 3, which is assigned to all other areas of more moderate seismic activity. In addition, the District is located in a Fault-Rupture Hazard Zone (formerly referred to as an Alquist-Priolo Special Study Zone), as defined by Special Publication 42 (revised January 1994) of the California Department of Conservation, Division of Mines and Geology. Flood Zone Status. Improvement Area No. 1 is located in Flood Zone X areas determined to be outside of the 500-year floodplain and determined to be outside of the 1% and 0.2% annual chance floodplains, and flood insurance is not required. Maps. The following pages contain a boundary map of Improvement Area No.1, an overview map of Improvement Area No.1 and the remainder of the District, an aerial overview map of Phase 1A within Improvement Area No. 1 and an aerial overview map of Phase 1B within Improvement Area No
39 Improvement Area No. 1 City of Dublin Community Facilities District No (Dublin Crossing) Boundary Map Seevers Jordan Ziegenmeyer -33-
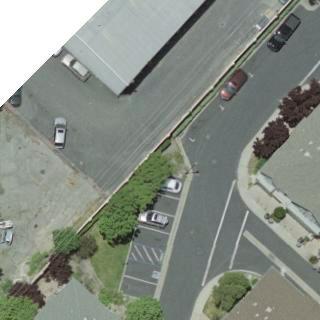

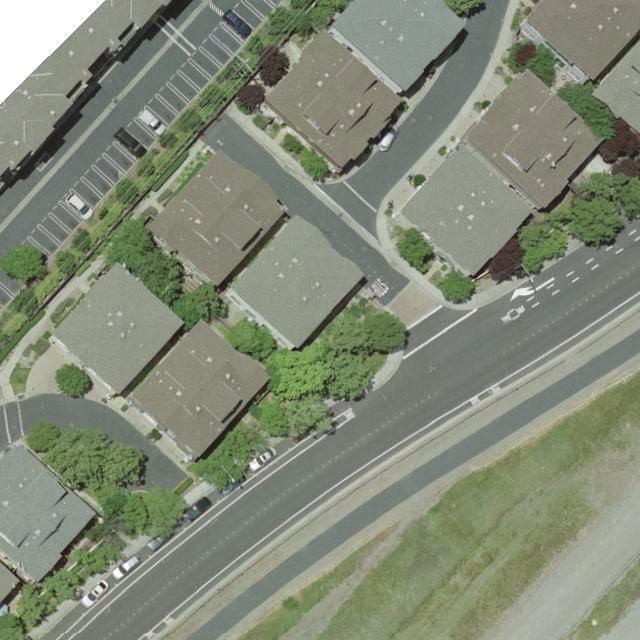

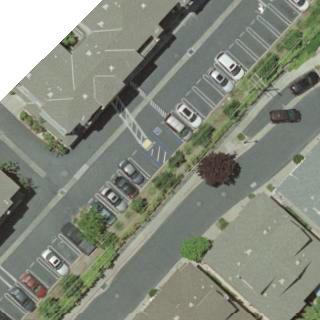

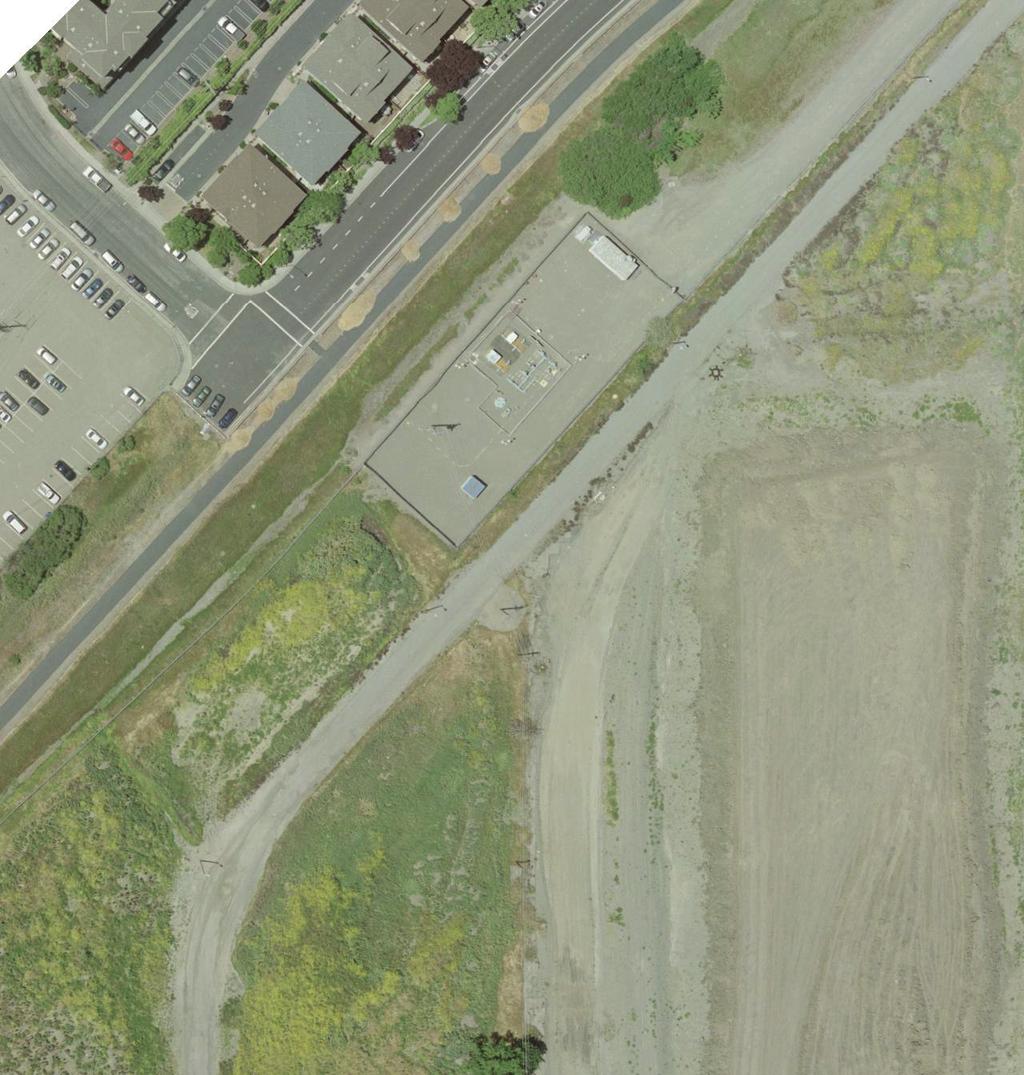


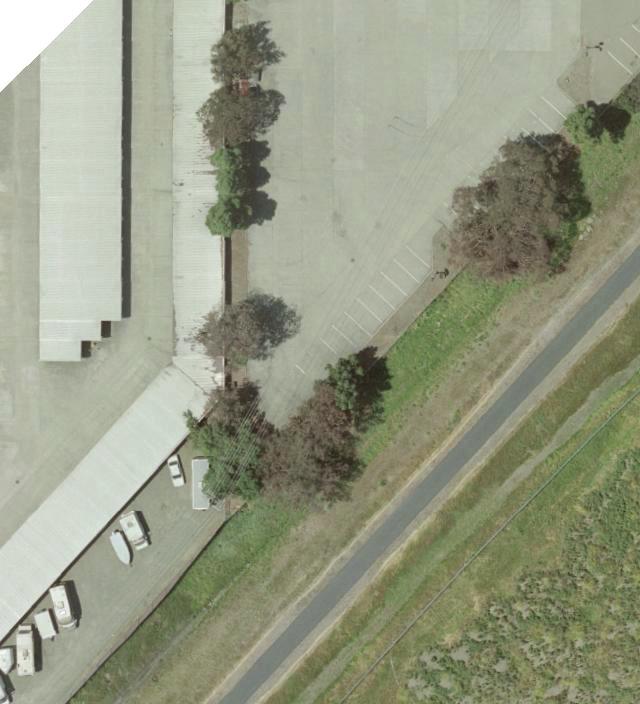

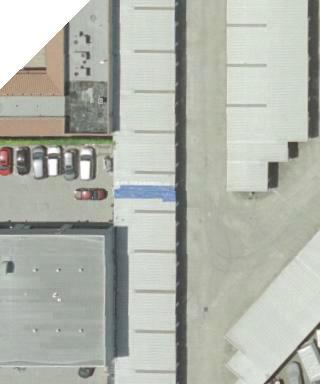

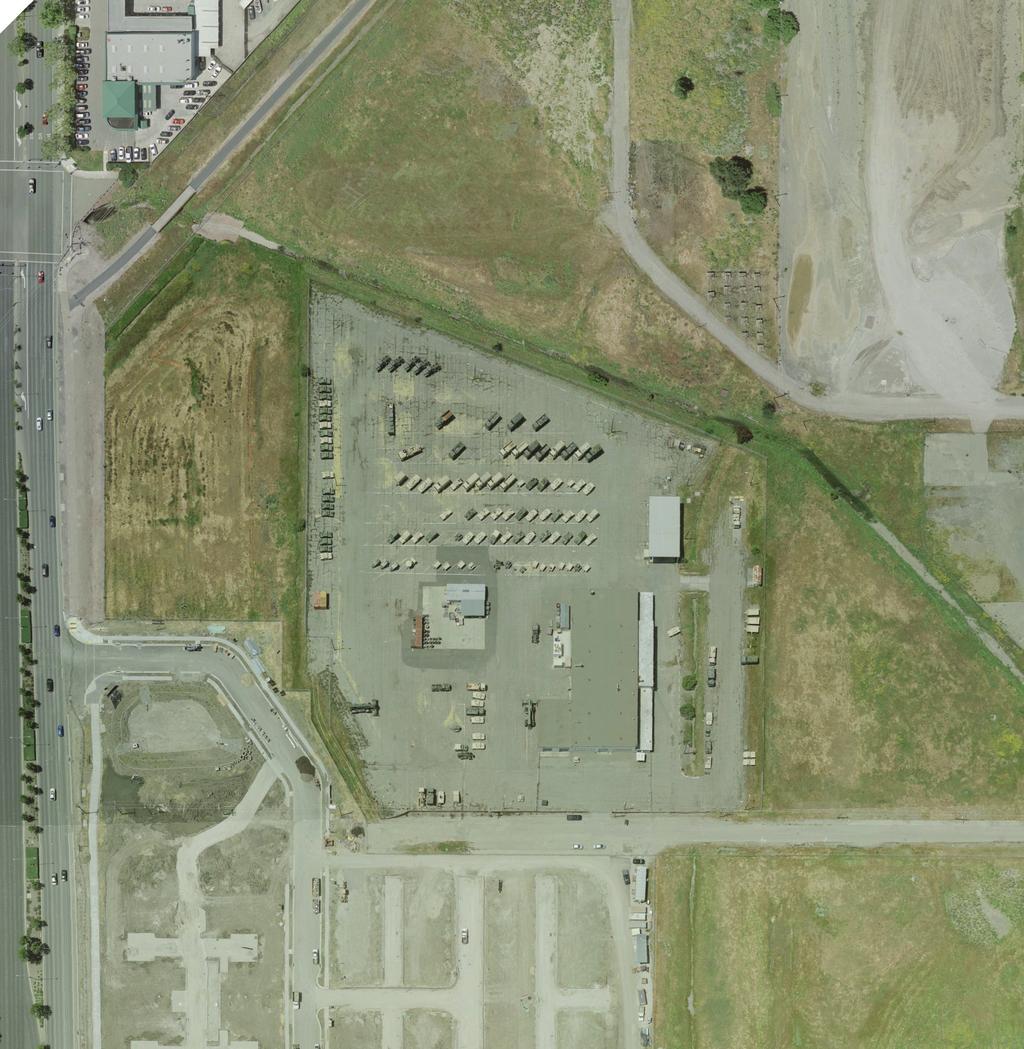
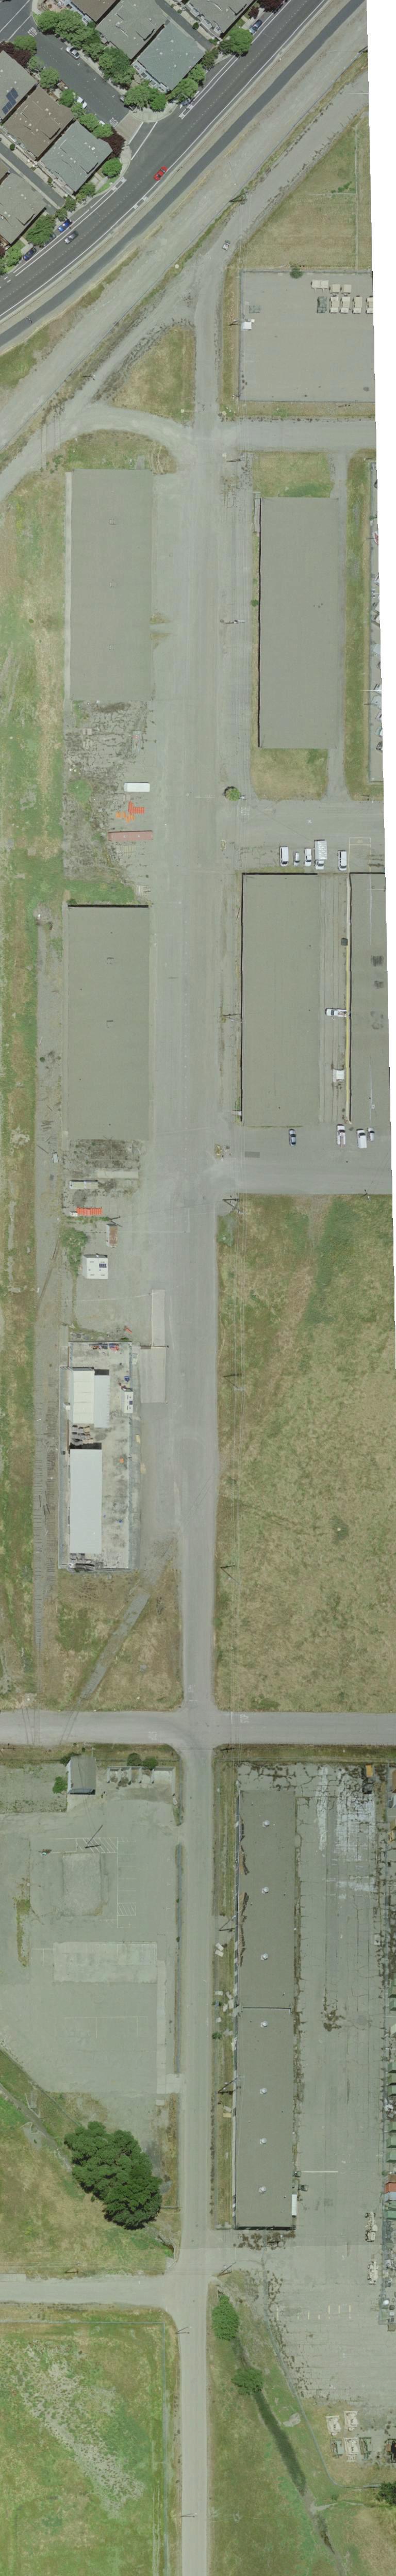
40 -34-
41 -35-
42 -36-
43 Improvement Area No. 1 Ownership The property in Improvement Area No. 1 is expected to be developed into 129 singlefamily detached units and 324 single-family attached units (for a total of 453 units), and is owned as follows: OWNERSHIP OF PROPERTY IN IMPROVEMENT AREA NO. 1 Owner Neighborhood Phase Tract Number of Projected Units Dublin Crossing, LLC Huntington 1A Brookfield Merchant Builders: Brookfield Bay Area Holdings LLC Huntington 1A Brookfield Wilshire LLC Wilshire 1A Brookfield Fillmore LLC Fillmore 1B CalAtlantic: CalAtlantic Group, Inc. Madison 1A CalAtlantic Group, Inc. Union 1A CalAtlantic Group, Inc. Sunset 1B Total 453 Tract Map Status The proposed 453 single family lots were created by, or are expected to be created by the following maps: TRACT MAP STATUS IN IMPROVEMENT AREA NO. 1 Map Date Recorded Number of Lots Tract /27/16 24 Tract 8309 Not Yet Recorded (1) 140 Tract /7/17 45 Tract /15/17 75 Tract /17/ Totals 453 (1) Anticipated to be recorded in the fourth quarter of calendar year The Merchant Builders The Developer has entered into agreements with builders that are affiliated with Brookfield Residential and CalAtlantic. In particular, the Developer sold property to (i) Brookfield BAH, Brookfield Wilshire LLC, and Brookfield Fillmore LLC, all wholly-owned indirect subsidiaries of Brookfield Residential (herein, the Brookfield Merchant Builders ), and (ii) CalAtlantic (herein, and together with the Brookfield Merchant Builders, the Merchant Builders ), each as described in more detail in the tables under IMPROVEMENT AREA NO. 1 The Development Plan. The 24 lots in Improvement Area No. 1 owned by the Developer are anticipated to be sold to Brookfield BAH in the fourth quarter of 2017 for development as part of the Huntington neighborhood. As of June 1, 2017, 143 single family detached and attached homes were in various stages of construction by the Merchant Builders and the property that will be developed into the remaining 310 units owned by the Developer or the Merchant Builders was in finished lot or blue top lot condition with building permits yet to be obtained. As of June 1, 2017, no homes within the District were sold and under contract to individual homebuyers. -37-
44 The Development Plan A more detailed description of each of the neighborhoods is set forth below. Huntington Neighborhood. Brookfield BAH is building and selling homes within the Huntington neighborhood within Improvement Area No. 1. Ultimately, the Huntington neighborhood is expected to consist of 69 detached single-family residential units (24 lots are still owned by the Developer as of June 1, 2017). The table below provides information under the assumption that Brookfield BAH will take title to the remaining 24 lots and develop all 69 units. The Huntington neighborhood will open for sales in August 2017, and Brookfield BAH anticipates final build-out by December The following tables provide additional information regarding the proposed development of the 69 units of the Huntington project (assuming that the Developer conveys the remaining 24 lots to Brookfield BAH) as of June 1, Approx. Square Footage Total Number of Planned Units Huntington Neighborhood (Tract No. 8308) (as of June 1, 2017) Units Completed, Sold, and Closed Units Completed and Unsold or in Escrow Units Under Est. Base Floor Plan Construction (1) Price (2) Plan 1 2, $1,016,000 Plan 2 2, $1,033,000 Plan 3 2, $1,058,000 Totals (1) Brookfield BAH anticipates the construction of 3 model homes, all of which are under construction as of June 1, 2017 and are included in these figures. On June 12, 2017, Brookfield BAH received building permits for the construction of 7 additional production units, bringing the total building permits issued to 34 (as of June 30, 2017). (2) Base sale prices are estimated as of June 1, Base sales prices are subject to change and exclude any lot premiums, options, upgrades, incentives and any selling concessions or price reductions which may be offered. Source: Brookfield BAH As of June 1, 2017, Brookfield BAH has incurred approximately $16,163,000 on site acquisition, on-site development costs, fees, and costs (other than homebuilding, sales and marketing costs) and anticipates that an additional $22,975,000 will be required to be expended on such costs to complete the neighborhood. As of June 1, 2017, Brookfield BAH has spent $795,000 on home construction, sales and marketing, and anticipates spending an additional $29,259,000 to buildout the 69 homes it currently anticipates building (assuming that the Developer conveys the remaining 24 lots to Brookfield BAH). Wilshire Neighborhood. Brookfield Wilshire LLC anticipates building and selling homes within the Wilshire neighborhood within Improvement Area No. 1. The homes are expected to consist of 75 attached single-family residential units within 10 buildings that will be either a 7-plex or an 8-plex. The Wilshire neighborhood is anticipated to open for sales in March, 2018, and Brookfield Wilshire LLC anticipates final build-out by June, The following tables provide additional information regarding the proposed development of the Wilshire project as of June 1,
45 Wilshire Neighborhood (Tract No. 8307) (as of June 1, 2017) Approx. Square Footage Total Number of Planned Units Units Completed, Sold, and Closed Units Completed and Unsold or in Escrow Units Under Est. Base Floor Plan Construction (1) Price (2) Plan 1 1, $762,000 Plan 2 1, $772,000 Plan 3 1, $772,000 Plan 4 2, $812,000 Plan 5 2, $817,000 Plan 6 1, $727,000 Plan 7 3, $925,000 Totals (1) Brookfield BAH has pulled five building permits to construct buildings that will contain 38 units, including 4 model homes. However, as of June 1, 2017, vertical construction has not yet begun on the buildings. (2) Base sale prices are estimated as of June 1, Base sales prices are subject to change and exclude any lot premiums, options, upgrades, incentives and any selling concessions or price reductions which may be offered. Source: Brookfield BAH As of June 1, 2017, Brookfield Wilshire has incurred approximately $18,969,000 on site acquisition, on-site development costs, fees, and costs (other than homebuilding, sales and marketing costs) and anticipates that an additional $13,513,000 will be required to be expended on such costs to complete the neighborhood. As of June 1, 2017, Brookfield Wilshire has spent $280,000 on home construction, sales and marketing, and anticipates spending an additional $28,075,000 to buildout the 75 homes it currently anticipates building. Fillmore Neighborhood. Brookfield Fillmore LLC anticipates building and selling homes within the Fillmore neighborhood within Improvement Area No. 1. The homes are expected to consist of 80 attached single-family residential units within 15 buildings that will be a 4-plex, a 6-plex or an 8-plex. The Fillmore neighborhood is anticipated to open for sales in March 2018, and Brookfield Fillmore LLC anticipates final build-out by December, The following tables provide additional information regarding the proposed development of the Fillmore project as of June 1,
46 Approx. Square Footage Total Number of Planned Units Fillmore Neighborhood (Tract No. 8309) (as of June 1, 2017) Units Completed, Sold, and Closed Units Completed and Unsold or in Escrow Units Under Est. Base Floor Plan Construction (1) Price (2) Plan 1 1, $710,000 Plan 2 2, $830,000 Plan 3 2, $854,000 Plan 4 2, $879,000 Totals 80 (1) Brookfield BAH anticipates the construction of 3 model homes. On June 9, 2017, Brookfield Fillmore received a building permit for the construction of the first 6-plex, that will contain the 3 model homes and 3 construction homes, although vertical construction has not yet begun on the building. (2) Base sale prices are estimated as of June 1, Base sales prices are subject to change and exclude any lot premiums, options, upgrades, incentives and any selling concessions or price reductions which may be offered. Source: Brookfield BAH As of June 1, 2017, Brookfield Fillmore has incurred approximately $16,893,000 on site acquisition, on-site development costs, fees, and costs (other than homebuilding, sales and marketing costs) and anticipates that an additional $20,065,000 will be required to be expended on such costs to complete the neighborhood. As of June 1, 2017, Brookfield Fillmore has spent $178,000 on home construction, sales and marketing, and anticipates spending an additional $24,584,000 to buildout the 80 homes it currently anticipates building. Madison Neighborhood. CalAtlantic is building and selling homes within the Madison neighborhood within Improvement Area No. 1. The homes are expected to consist of 107 attached single-family residential units. The Madison neighborhood is expected to open for sales in June 2017, and CalAtlantic anticipates final build-out by December, The following tables provide additional information regarding the proposed development of the Madison project as of June 1, Approx. Square Footage Total Number of Planned Units Madison Neighborhood (Tract No. 8306) (as of June 1, 2017) Units Completed, Sold, and Closed Units Completed and Unsold or in Escrow Units Under Est. Base Floor Plan Construction (1) Price (2) Plan 1 1, $650,000 Plan 2 1, $785,000 Plan 3 1, $830,000 Plan 4 2, $840,000 Totals (1) CalAtlantic anticipates the construction of 4 model homes, all of which are under construction as of June 1, 2017 and included in these figures. (2) Base sale prices are estimated as of June 1, Base sales prices are subject to change and exclude any lot premiums, options, upgrades, incentives and any selling concessions or price reductions which may be offered. Source: CalAtlantic As of June 1, 2017, CalAtlantic has incurred approximately $24,894,617 on site acquisition, on-site development costs, fees, and costs (other than homebuilding, sales and marketing costs) and anticipates that an additional $23,006,053 will be required to be expended -40-
47 on such costs to complete the neighborhood. As of June 1, 2017, CalAtlantic has spent $1,087,296 on home construction, sales and marketing, and anticipates spending an additional $25,754,526 to buildout the 107 homes it currently anticipates building. Union Neighborhood. CalAtlantic is building and selling homes within the Union neighborhood within Improvement Area No. 1. The homes are expected to consist of 62 attached single-family residential units. The Union neighborhood is expected to open for sales in June 2017, and CalAtlantic anticipates final build-out by September, The following tables provide additional information regarding the proposed development of the Union project as of June 1, Approx. Square Footage Total Number of Planned Units Union Neighborhood (Tract No. 8306) (as of June 1, 2017) Units Completed, Sold, and Closed Units Completed and Unsold or in Escrow Units Under Est. Base Floor Plan Construction (1) Price (2) Plan 1 1, $645,000 Plan 2 1, $685,000 Plan 3 1, $755,000 Plan 4 1, $745,000 Plan 5 2, $785,000 Plan 6 1, $755,000 Totals (1) CalAtlantic anticipates the construction of 5 model homes, all of which are under construction as of June 1, 2017 and included in these figures. (2) Base sale prices are estimated as of June 1, Base sales prices are subject to change and exclude any lot premiums, options, upgrades, incentives and any selling concessions or price reductions which may be offered. Source: CalAtlantic As of June 1, 2017, CalAtlantic has incurred approximately $17,826,901 on site acquisition, on-site development costs, fees, and costs (other than homebuilding, sales and marketing costs) and anticipates that an additional $8,508,099 will be required to be expended on such costs to complete the neighborhood. As of June 1, 2017, CalAtlantic has spent $1,141,781 on home construction, sales and marketing, and anticipates spending an additional $14,903,056 to buildout the 62 homes it currently anticipates building. Sunset Neighborhood. CalAtlantic anticipates building and selling homes within the Sunset neighborhood within Improvement Area No. 1. The homes are expected to consist of 60 detached single-family residential units. The Sunset neighborhood is expected to open for sales in January, 2018, and CalAtlantic anticipates final build-out by December, The following table provides additional information regarding the proposed development of the Sunset project as of June 1,
48 Approx. Square Footage Total Number of Planned Units Sunset Neighborhood (Tract No. 8309) (as of June 1, 2017) Units Completed, Sold, and Closed Units Completed and Unsold or in Escrow Units Under Est. Base Floor Plan Construction(1) Price(2) Plan 1 2, $985,000 Plan 2 2, $1,003,000 Plan 3 2, $1,028,000 Totals 60 (1) CalAtlantic anticipates the construction of 3 model homes. (2) Base sale prices estimated are as of June 1, Initial base sales prices may be lower than estimated. Base sales prices are subject to change and exclude any lot premiums, options, upgrades, incentives and any selling concessions or price reductions which may be offered. Source: CalAtlantic As of June 1, 2017, CalAtlantic has incurred approximately $18,162,629 on site acquisition, on-site development costs, fees, and costs (other than homebuilding, sales and marketing costs) and anticipates that an additional $16,661,804 will be required to be expended on such costs to complete the neighborhood. As of June 1, 2017, CalAtlantic has spent $212,528 on home construction, sales and marketing, and anticipates spending an additional $17,522,093 to buildout the 60 homes it currently anticipates building. Notwithstanding the Merchant Builders projections regarding home construction and sellout of their planned development in Improvement Area No. 1, no assurance can be given that the Merchant Builders will complete such development as currently anticipated. Financing Plan Developer To date, the Developer has financed its land acquisition and various site development costs related to its property in the District through internally generated funds and lot sales revenues. The Developer estimates that, as of June 1, 2017, the remaining costs to be incurred by the Developer to complete its planned development within Improvement Area No. 1 will be $21,151,395 (not including land acquisition, military structure design and construction, and related expenses), The Developer expects to use lot sales revenues, internal funding, and reimbursement from Bond proceeds to complete its development in Improvement Area No. 1 of the District and believes that it will have sufficient funds available to complete such development in accordance with the development schedule described in this Official Statement. Although the Developer expects to have sufficient funds available to complete its development in Improvement Area No. 1 of the District as described in this Official Statement, there can be no assurance that amounts necessary to finance the remaining development costs will be available to the Developer from its internally generated funds or from any other source when needed. None of the Brookfield Merchant Builders, BrookCal, SPIC, BrookCal Bay Area, BrookCal, LLC, BHC BrookCal, BrookCal Bay Area, Brookfield Residential, CalAtlantic, or Cal STRS, nor any of their related entities, is under any legal obligation of any kind to expend funds for the development of and construction of homes on its property in Improvement Area No. 1 of the District. Any contributions by the Developer or any such entity to fund the costs of such development are entirely voluntary. -42-
49 If and to the extent that internal funding, including but not limited to lot sales revenues, are inadequate to pay the costs to complete the planned development by the Developer within Improvement Area No. 1 of the District and other financing by the Developer is not put into place, there could be a shortfall in the funds required to complete the planned development by the Developer in Improvement Area No. 1 of the District. Financing Plan Merchant Builders Brookfield Merchant Builders Financing Plan. To date, each Brookfield Merchant Builder has financed its land acquisition, site development, and home construction costs related to its respective Huntington, Wilshire, or Fillmore neighborhoods in Improvement Area No. 1 through internally generated funds. As of June 1, 2017, Brookfield BAH estimates the costs to complete the remaining land development of the Huntington, Wilshire, and Fillmore neighborhoods within Improvement Area No. 1, including fees but excluding costs of constructing, selling and marketing of homes, is approximately $56,553,000. Brookfield BAH estimates the remaining vertical home construction, selling and marketing costs as of June 1, 2017 to complete its three projects in Improvement Area No. 1 to be approximately $81,918,000. The foregoing costs are exclusive of internal financing repayment and marketing and sales costs. Brookfield BAH expects the remaining horizontal and vertical home construction costs will be financed by the respective Brookfield Merchant Builder from home sales and internally generated funds to complete its development activities in Improvement Area No. 1. Brookfield BAH believes that the Brookfield Merchant Builders will have sufficient funds available to complete their proposed development activities in Improvement Area No. 1, commensurate with the development timing described in this Official Statement. Although Brookfield BAH expects the Brookfield Merchant Builders to have sufficient funds available to complete its development activities in Improvement Area No. 1, commensurate with the development timing described in this Official Statement, there can be no assurance, however, that amounts necessary to finance the remaining development and home construction costs will be available from the Brookfield Merchant Builders or any other source when needed. Any contributions by the Brookfield Merchant Builders or any of their respective parent companies to fund the costs of such development and home construction are entirely voluntary. If and to the extent that internal funding, including but not limited to home sales revenues, are inadequate to pay the costs to complete the planned development by the Brookfield Merchant Builders within Improvement Area No. 1 and other financing by the Brookfield Merchant Builders is not put into place, there could be a shortfall in the funds required to complete the proposed development by the Brookfield Merchant Builders in Improvement Area No. 1 and the remaining portions of the development may not be developed. CalAtlantic s Financing Plan. To date, CalAtlantic has financed its land acquisition, site development, and home construction costs related to its Madison, Union and Sunset neighborhoods in Improvement Area No. 1 through internally generated funds. As of June 1, 2017, CalAtlantic estimates the costs to complete the remaining land development of the Madison, Union and Sunset neighborhoods within Improvement Area No. 1, including fees but excluding costs of constructing, selling and marketing homes, is approximately $48,175,959. CalAtlantic estimates the remaining vertical home constructing, selling and marketing costs as of June 1, 2017 to complete its three projects in Improvement Area No. 1 to be approximately -43-
50 $58,179,675. The foregoing costs are exclusive of internal financing repayment and marketing and sales costs. CalAtlantic expects the remaining horizontal and vertical home construction costs will be financed by CalAtlantic from home sales revenue, internally generated funds and funding under CalAtlantic s revolving credit facility (described below) to complete its development activities in Improvement Area No. 1. However, home sales revenue from CalAtlantic s projects in Improvement Area No. 1 will not be segregated and set aside for the payment of costs required to complete its activities in Improvement Area No. 1. Home sales revenue from all projects is accumulated and used to pay costs of operations for CalAtlantic and its subsidiaries, to pay debt service on outstanding debt and for other corporate purposes, and may be diverted to pay costs other than the costs of completing CalAtlantic s activities in Improvement Area No. 1 at the discretion of CalAtlantic s management. Notwithstanding the foregoing, CalAtlantic believes that it will have sufficient funds available to complete its proposed development activities in Improvement Area No. 1, commensurate with the development timing described in this Official Statement. As of June 30, 2017, CalAtlantic was party to a $750 million unsecured revolving credit facility (the Revolving Facility ), which matures in October The Revolving Facility is not secured by any property in Improvement Area No. 1. The Revolving Facility has an accordion feature under which the aggregate commitment may be increased up to $1.2 billion, subject to the availability of additional bank commitments and certain other conditions. The Revolving Facility contains certain covenants and conditions that may limit the amount that CalAtlantic may borrow or have outstanding at any time. As of June 30, 2017, CalAtlantic had no amounts outstanding under the Revolving Facility and had outstanding letters of credit issued under the Revolving Facility totaling $94.7 million, leaving $655.3 million available under the Revolving Facility to be drawn as of such date. CalAtlantic s ability to renew the Revolving Facility in the future is dependent upon a number of factors including the state of the commercial lending environment, the willingness of banks to lend to homebuilders and CalAtlantic s financial condition and strength. Although CalAtlantic expects to have sufficient funds available to complete its development activities in Improvement Area No. 1, commensurate with the development timing described in this Official Statement, there can be no assurance, however, that amounts necessary to finance the remaining development and home construction costs will be available from CalAtlantic or any other source when needed. For example, borrowings under the Revolving Facility may not be available, and home sales revenue, which is accumulated daily for use in operations by CalAtlantic, including to fund costs of other direct and indirect subsidiaries, to pay debt service on outstanding debt and for other corporate purposes, may be diverted to pay costs other than the costs of completing CalAtlantic s activities in Improvement Area No. 1 at the discretion of CalAtlantic s management. CalAtlantic, its lenders, or any of their related entities are not under any legal obligation of any kind to expend funds for the development of and construction of homes on CalAtlantic s property in Improvement Area No. 1. Any contributions by CalAtlantic to fund the costs of such development and home construction are entirely voluntary. If and to the extent that internal funding, including but not limited to home sales revenues, and borrowings under the Revolving Facility are inadequate to pay the costs to complete the planned development by CalAtlantic within Improvement Area No. 1 and other financing by CalAtlantic is not put into place, there could be a shortfall in the funds required to -44-
51 complete the proposed development by CalAtlantic in Improvement Area No. 1 and the remaining portions of the development may not be developed. OWNERSHIP OF PROPERTY WITHIN IMPROVEMENT AREA NO. 1 Unpaid Special Taxes do not constitute a personal indebtedness of the owners of the parcels within the District. There is no assurance that the present property owners or any subsequent owners will have the ability to pay the Special Taxes or that, even if they have the ability, they will choose to pay the Special Taxes. An owner may elect to not pay the Special Taxes when due and cannot be legally compelled to do so. Neither the City nor any Bondowner will have the ability at any time to seek payment directly from the owners of property within the District of the Special Tax or the principal or interest on the Bonds, or the ability to control who becomes a subsequent owner of any property within the District. The Developer, BrookCal and CalAtlantic have provided the information set forth in this section entitled OWNERSHIP OF PROPERTY WITHIN IMPROVEMENT AREA NO. 1. No assurance can be given that all information is complete. The City has not independently verified this information and assumes no responsibility for its accuracy or completeness. It is only provided as a convenience to enable investors to more easily commence their own independent investigations if they so choose. In addition, any Internet addresses included below are for reference only, and the information on those Internet sites is not a part of this Official Statement or incorporated by reference into this Official Statement. No assurance can be given that development of the property will be completed, or that it will be completed in a timely manner. The Special Taxes are not personal obligations of the developers or of any subsequent landowners; the Bonds are secured only by the Special Taxes and moneys available under the Fiscal Agent Agreement. See SECURITY AND SOURCES OF PAYMENT FOR THE BONDS and SPECIAL RISK FACTORS herein. The Developer, Brookfield and CalAtlantic Developer. The master developer of the property within the District is Dublin Crossing, LLC, a Delaware limited liability company (previously defined as Dublin Crossing or the Developer ). Dublin Crossing is a joint venture between BrookCal Dublin LLC, a Delaware limited liability company (previously defined as BrookCal ), and SPIC Dublin LLC, a Delaware limited liability company (previously defined as SPIC ), an affiliate of CalAtlantic Group, Inc., a Delaware corporation (previously defined as CalAtlantic ). BrookCal. BrookCal is owned 100% by BrookCal Bay Area Holdings LLC, a Delaware limited liability company ( BrookCal Bay Area ). BrookCal Bay Area is owned 100% by BrookCal, LLC, a Delaware limited liability company ( BrookCal, LLC ). BrookCal, LLC is a joint venture between BHC BrookCal, LLC, a Delaware limited liability company ( BHC BrookCal ), and the California State Teachers Retirement System ( Cal STRS ). BHC BrookCal is an indirect wholly-owned subsidiary of Brookfield Residential Properties Inc. ( Brookfield Residential ), a wholly-owned subsidiary of Brookfield Asset Management Inc., which has been developing land and building homes for over 50 years. Brookfield Residential is a North American land developer and homebuilder with operations in Canada and the United States, which entitles and develops land to create master-planned communities and builds and sells lots to third-party builders, as well as to its own homebuilding divisions. Brookfield Residential also participates in select strategic real estate opportunities, including infill projects, mixed-use developments, infrastructure projects and joint ventures. Brookfield Residential currently -45-
52 focuses on the following operating segments: Canada, California and Central and Eastern United States. Its Canadian operations are primarily in the Alberta and Ontario markets. Brookfield Residential has homebuilding operations in Austin, Calgary, Denver, Edmonton, Hawaii, Los Angeles, Phoenix, San Diego, San Francisco, Toronto, and Washington D.C. Brookfield Residential has been active in the Northern California market since Information regarding Brookfield Residential s operations in Northern California is available at Copies of Brookfield Residential s financial statements and other information are currently available from Brookfield Residential s website at These Internet addresses are included for reference only, and the information on these Internet sites is not a part of this Official Statement and is not incorporated by reference into this Official Statement. No representation is made in this Official Statement as to the accuracy or adequacy of the information contained on these Internet sites. CalAtlantic. CalAtlantic Group, Inc., referred to herein as CalAtlantic, is a homebuilder incorporated in Delaware in 1991, with principal executive offices located in Irvine, California. CalAtlantic is a publicly traded company with its stock listed on the New York Stock Exchange under the symbol CAA. The development of the Madison, Union and Sunset neighborhoods in Improvement Area No. 1 is currently being undertaken by the Northern California Division of CalAtlantic. CalAtlantic is subject to the informational requirements of the Exchange Act, and in accordance therewith is obligated to file reports, proxy statements, and other information, including financial statements, with the SEC. Such filings, including particularly CalAtlantic s Annual Report on Form 10-K for the fiscal year ended December 31, 2016, as filed with the SEC on February 28, 2017, and Quarterly Report on Form 10-Q for the quarter ended June 30, 2017, as filed with the SEC on July 28, 2017, set forth certain data relative to the consolidated results of operations and financial position of CalAtlantic and its subsidiaries as of such dates. The SEC maintains an internet web site that contains reports, proxy and information statements and other information regarding registrants that file electronically with the SEC, including CalAtlantic. The address of such internet web site is All documents subsequently filed by CalAtlantic pursuant to the requirements of the Exchange Act after the date of this Official Statement will be available for inspection in such manner as the SEC prescribes. Copies of CalAtlantic s annual report, quarterly reports and current reports, including any amendments, are also available from CalAtlantic s website at The foregoing internet addresses and references to filings with the SEC are included for reference only, and the information on such internet sites and on file with the SEC are not a part of this Official Statement and are not incorporated by reference into this Official Statement. No representation is made in this Official Statement as to the accuracy or adequacy of the information contained on such internet sites. The Appraisal APPRAISED VALUE OF PROPERTY WITHIN IMPROVEMENT AREA NO. 1 General. Seevers Jordan Ziegenmeyer, Rocklin, California (the Appraiser ) prepared an appraisal report, dated June 14, 2017, with a date of value of May 17, 2017 (the Appraisal ). The Appraisal was prepared at the request of the City. -46-
53 The Appraiser was requested by the City to provide a market value of the appraised properties by ownership, as well as a cumulative, or aggregate, value of the appraised properties within the District (see Property Appraised below), under the assumptions and conditions cited in the attached report. The value estimates assume a transfer would reflect a cash transaction or terms that are considered to be equivalent to cash. The estimates are also premised on an assumed sale after reasonable exposure in a competitive market under all conditions requisite to a fair sale, with buyer and seller each acting prudently, knowledgeably, for their own self-interest and assuming neither is under duress. The Appraisal is set forth in its entirety in APPENDIX B hereto. The description herein of the Appraisal is intended for limited purposes only; the Appraisal should be read in its entirety. The conclusions reached in the Appraisal are subject to certain assumptions and qualifications which are set forth in the Appraisal. Property Appraised. The Appraisal valued the fee simple estate of certain taxable land areas in Improvement Area No. 1. More specifically, the appraised properties consist of all the taxable land in Improvement Area No. 1, which is anticipated to be built out into 453 residential units (129 detached and 324 attached). Any properties within the boundaries of the District and Improvement Area No. 1 not subject to the lien of the Special Tax securing the Bonds (public and quasi-public land use sites) are not a part of the appraisal. Improvement Area No. 1 (Phases 1A and 1B) of the Dublin Crossing Project has undergone large lot line adjustments; whereby, the appraised property is contained within APNs through -5 and (portion of), which consists of approximately acres. Value Estimate. The market value of the appraised properties, by ownership, as well as the cumulative, or aggregate, value, are subject to the hypothetical condition various public improvements to be financed by proposed series of Bonds have been paid. The estimates of value also account for the impact of the lien of the Special Tax securing the Bonds. The value estimate for the appraised property as of the May 17, 2017 date of value, using the methodologies described in the Appraisal and subject to the hypothetical condition that various public improvements to be financed by the Bonds are in place, and subject to other assumptions and limiting conditions set forth in the Appraisal, and based on the ownership of the property as of that date is $153,210,000, as shown in the table on the following page. -47-
54 Property Owner Type No. Units Conclusion of Value (Rounded) CalAtlantic Group, Inc. Phase 1A: Union Attached 62 $16,340,000 Phase 1A: Madison Attached 107 $30,950,000 Phase 1B: Sunset Detached 60 $28,200,000 Subtotal 229 $75,490,000 Brookfield Entities Phase 1A: Wilshire Attached 75 $22,660,000 Phase 1A: Huntington Detached 45 $19,830,000 Phase 1B: Fillmore Attached 80 $25,340,000 Subtotal 200 $67,830,000 Dublin Crossing, LLC Phase 1A: Huntington Detached 24 $9,890,000 Subtotal 24 $9,890,000 Aggregate (Cumulative) Value of Improvement Area No. 1 $153,210,000 Note that the aggregate value noted is not the market value of the appraised properties in bulk. As defined by The Dictionary of Real Estate Appraisal, an aggregate value is the total of multiple market value conclusions. For purposes of the Appraisal, market value is estimated by ownership. Appraisal Methodology. In the Appraisal, the Appraiser determined the market value of the residential land, by lot size category, estimate by employing the use of the sales comparison approach and a land residual analysis, or discounted cash flow analysis (DCF), described as follows: In the sales comparison approach we analyzed comparable bulk lot sales from the region and adjusted the datum for attributes that varied from the subject s four land development categories. A land residual analysis was also utilized to estimate the market value of the subject lots, by lot size category. The land residual analyses are a discounted cash flow (DCF) analysis that considered home prices and costs for each lot size category, leading to an estimate of residual land value. A DCF analysis is a procedure in which a discount rate is applied to a projected revenue stream generated from the sale of individual components of a project. In this method of valuation, the appraiser specifies the quantity, variability, timing and duration of the revenue streams and discounts each to its present value at a specified yield rate. In the analysis described, the revenue component of the DCF was based on the market value for the proposed homes for each lot size category. A number of assumptions were made in the discounted cash flow analysis, not the least of which is the forecast of absorption, or disposition, of the homes comprising each lot size category. The lot values indicated by each approach were then reconciled into an opinion of market value for the subject s four land development categories as if in finished condition. Hypothetical Condition. The Appraisal estimates the market value of the appraised properties, by ownership, as well as the cumulative, or aggregate, value of Improvement Area No. 1 of the CFD as of the date of inspection (May 17, 2017), subject to the hypothetical condition various public improvements to be financed by the Bonds are in place and available for use. Extraordinary Assumptions and Limiting Conditions. In addition to the hypothetical condition described above, the Appraisal is based upon a number of standard and special -48-
55 assumptions and conditions, all of which affect the estimate as to value, some of which include the following. See APPENDIX B THE APPRAISAL for a complete list of such assumptions and conditions. For example, the Appraisal states the following extraordinary assumptions and hypothetical condition: It is assumed there are no adverse soil conditions, toxic substances or other environmental hazards that may interfere or inhibit the development of the subject properties. The exact locations of the easements referenced in a preliminary title report were not provided to the Appraiser. The Appraiser is not a surveyor nor qualified to determine the exact location of the referenced easements. It is assumed the easements which would be noted in a preliminary title report do not have an impact on the opinions of value as provided in this report. If, at some future date, these easements are determined to have a detrimental impact on value, the Appraiser reserves the right to amend the opinion(s) of value. The opinions of value presented in this report are predicated on none of the items referenced in the preliminary title report having a detrimental impact upon the utility of the property as proposed, nor the opinions of value. If, at some future date, these exceptions are determined to have a detrimental impact on value, the Appraiser reserves the right to amend the opinion(s) of value. Exposure Time. The Appraisal comments on exposure time for the property appraised as follows: Exposure time is the period a property interest would have been offered on the market prior to the hypothetical consummation of a sale at market value on the effective date of the Appraisal. Marketing time reflects the time it might take to sell an interest in real property at its estimated market value during the period immediately after the effective date of the appraisal. Exposure time and marketing time may or may not be similar depending on whether market activity in the immediate future continues in the same manner as in the immediate past. Indications of the exposure time associated with a market value estimate are provided by the marketing times of sale comparables, interviews with participants in the market, and analysis of general economic conditions. Estimation of a future marketing time is more difficult, requiring forecasting and analysis of trends. The Appraiser concluded that, given the size of the appraised properties, and the condition of the market, it is expected that if appropriately priced, the exposure time for the appraised properties, assuming the properties (by ownership) are not marketed concurrently, would likely be approximately 12 months. No assurance can be given that the estimated exposure time or absorption of sales of property in Improvement Area No. 1 will be achieved or attained over an extended period of time; real estate is cyclical in nature, and it is impossible to accurately forecast and project specific demand over a projected period. See SPECIAL RISK FACTORS Property Values and Property Development. Limitations of Appraisal Valuation. Property values may not be evenly distributed throughout the District; thus, certain parcels may have a greater value than others. This disparity is significant because in the event of nonpayment of the Special Tax, the only remedy is to foreclose against the delinquent parcel. No assurance can be given that the estimate of market value set forth in the Appraisal can or will be maintained during the period of time that the Bonds are outstanding in that the -49-
56 City has no control over the market value of the property within the District or the amount of additional indebtedness that may be issued in the future by other public agencies, the payment of which, through the levy of a tax or an assessment, may be on a parity with the Special Taxes. See Overlapping Liens and Priority of Lien below. For a description of certain risks that might affect the assumptions made in the Appraisal, see SPECIAL RISK FACTORS Appraised Values herein. Value by Ownership and Neighborhood The following table sets forth the development status and appraisal value by ownership and neighborhood for property within Improvement Area No. 1, based on the appraised values set forth in the Appraisal. Table 1 Improvement Area No. 1 City of Dublin Community Facilities District No (Dublin Crossing) Development Status by Neighborhood Units with Total Building Planned Property Appraised Neighborhood Permits (1) Units Owner Land Use Value Fillmore 6 80 Brookfield Fillmore LLC Multi-Family $25,340,000 Huntington (A) Brookfield Bay Area Holdings LLC Single Family Detached $19,830,000 Huntington (B) 0 24 Dublin Crossing, LLC Single Family Detached $9,890,000 Madison CalAtlantic Group, Inc. Multi-Family $30,950,000 Sunset 0 60 CalAtlantic Group, Inc. Single Family Detached $28,200,000 Union CalAtlantic Group, Inc. Multi-Family $16,340,000 Wilshire Brookfield Wilshire LLC Multi-Family $22,660,000 Total $153,210,000 (1) Based on building permits issued as of June 30, Source: Seevers, Jordan, Ziegenmeyer; Goodwin Consulting Group, Inc. -50-
57 Value to Special Tax Burden Ratios The following table sets forth the value-to-lien ratios for property within Improvement Area No. 1, based on the appraised values set forth in the Appraisal and based on the hypothetical assumption that the Special Tax levy for Fiscal Year was levied on all taxable parcels in the District (not just Developed Property), and not including any overlapping debt for general obligation bonds. Table 2 City of Dublin CFD No (Dublin Crossing) Improvement Area No. 1 Hypothetical Fiscal Year Special Tax Levy and Value-to-Lien (Development Status as of June 30, 2017) Development Status Planned Residential Units (1) Appraised Value Hypothetical FY Special Tax Levy (2) Percent of Estimated FY Tax Levy (3) Series 2017 Bonds (4) Value- to- Lien (2) Developed Property Brookfield 78 $28,364,233 $348, % $6,863, CalAtlantic 78 $21,867,676 $292, % $5,762, Subtotal 156 $50,231,909 $640, % $12,625, Undeveloped Property (2) Brookfield 122 $39,465,767 $490, % $9,663, CalAtlantic 151 $53,622,324 $433, % $8,535, Dublin Crossing 24 $9,890,000 $97, % $1,914, Subtotal 297 $102,978,091 $1,020, % $20,114, Total 453 $153,210,000 $1,661, % $32,740, (1) Based on Attachment 1 of the Rate and Method of Apportionment. (2) Special taxes will only be levied against parcels of Developed Property in fiscal year , resulting in a total levy of $640,758. Debt service on the Bonds coming due through and including September 1, 2018 will be paid from capitalized interest funded with proceeds of the Bonds. (3) Interest on the Bonds is capitalized through and including September 1, (4) Allocated based on the share of the hypothetical fiscal year special tax levy. Special taxes will only be levied against parcels of Developed Property in fiscal year See footnote (2). There is no overlapping special tax and assessment debt. Overlapping debt from general obligation bonds and PACE liens (if any) have not been included. Source: Seevers, Jordan, Ziegenmeyer; Prager & Co, LLC; Goodwin Consulting Group, Inc. In comparing the appraised value of the real property within the District and the principal amount of the Bonds, it should be noted that only the real property upon which there is a delinquent Special Tax can be foreclosed upon, and the real property within the District cannot be foreclosed upon as a whole to pay delinquent Special Taxes of the owners of such parcels within the District unless all of the property is subject to a delinquent Special Tax. In any event, individual parcels may be foreclosed upon separately to pay delinquent Special Taxes levied against such parcels. Other public agencies whose boundaries overlap those of the District could, without the consent of the City and in certain cases without the consent of the owners of the land within the District, impose additional taxes or assessment liens on the land within the District. The lien created on the land within the District through the levy of such additional taxes or assessments may be on a parity with the lien of the Special Tax. In addition, construction loans may be obtained by the Merchant Builders or home loans may be obtained by ultimate homeowners. -51-
58 The deeds of trust securing such debt on property within the District, however, will be subordinate to the lien of the Special Tax. Overlapping Liens and Priority of Lien The principal of and interest on the Bonds are payable from the Special Tax authorized to be collected within the District, and payment of the Special Tax is secured by a lien on certain real property within the District. Such lien is co-equal to and independent of the lien for general taxes and any other liens imposed under the Act, regardless of when they are imposed on the property in the District. The imposition of additional special taxes, assessments and general property taxes will increase the amount of independent and co-equal liens which must be satisfied in foreclosure. The City, the County and certain other public agencies are authorized by the Act to form other community facilities districts and improvement areas and, under other provisions of State law, to form special assessment districts, either or both of which could include all or a portion of the land within the District. Set forth on the following page is an overlapping debt table showing the existing authorized indebtedness payable with respect to property within the District. This table has been prepared by California Municipal Statistics Inc. as of the date indicated, and is included for general information purposes only. The City has not reviewed the data for completeness or accuracy and makes no representations in connection therewith. -52-
59 Assessed Valuation: $23,225,000 CITY OF DUBLIN COMMUNITY FACILITIES DISTRICT NO (DUBLIN CROSSING) IMPROVEMENT AREA NO. 1 As of June 1, 2017 DIRECT AND OVERLAPPING TAX AND ASSESSMENT DEBT: % Applicable Debt Bay Area Rapid Transit District 0.004% $ 35,406 Chabot-Las Positas Community College District ,862 Dublin Unified School District ,153 East Bay Regional Park District ,853 City of Dublin - Dublin Crossing Community Facilities District (1) TOTAL DIRECT AND OVERLAPPING TAX AND ASSESSMENT DEBT $728,274 OVERLAPPING GENERAL FUND DEBT: Alameda County General Fund Obligations 0.009% $78,348 Alameda County Pension Obligation Bonds ,534 TOTAL OVERLAPPING GENERAL FUND DEBT $80,882 COMBINED TOTAL DEBT $809,156 (2) Ratios to Assessed Valuation: Direct Debt ($0) % Total Direct and Overlapping Tax and Assessment Debt % Combined Total Debt % (1) Excludes Bonds to be sold. (2) Excludes tax and revenue anticipation notes, enterprise revenue, mortgage revenue and non-bonded capital lease obligations. Source: California Municipal Statistics, Inc. There can be no assurance that the Developer, the Brookfield Merchant Builders, CalAtlantic, their respective affiliates or any subsequent owner will not petition for the formation of other community facilities districts and improvement areas or for a special assessment district or districts and that parity special taxes or special assessments will not be levied by the County or some other public agency to finance additional public facilities, however no other special districts are currently contemplated by the City or the Developer. Private liens, such as deeds of trust securing loans obtained by the Developer, may be placed upon property in the District at any time. Under California law, the Special Taxes have priority over all existing and future private liens imposed on property subject to the lien of the Special Taxes. -53-
60 Estimated Tax Burden The following table sets forth estimated Fiscal Year sample tax bills for various types of property expected to be built and sold to individual homeowners within Improvement Area No. 1. As of the date of this Official Statement, no homes have been sold in Improvement Area No. 1, and all of the land is owned by five entities developing the land. Table 3 Improvement Area No. 1 City of Dublin Community Facilities District No (Dublin Crossing) Estimated Fiscal Year Sample Tax Bills Single Family Single Family Single Family Multi-Family Multi-Family Multi-Family Assumptions < 2,100 sf 2,100-2,300 sf > 2,300 sf < 1,600 sf 1,600-1,800 sf > 1,800 sf Estimated Sales Price N/A (1) N/A (1) $1,057,000 $679,000 $741,000 $821,000 Ad Valorem Taxes Rate Amount Amount Amount Amount Amount Amount General Tax Levy % $0 $0 $10,570 $6,790 $7,410 $8,210 School Unified % $0 $0 $1,027 $660 $720 $798 School Comm. College % $0 $0 $260 $167 $182 $202 Flood Zone 7 State Water % $0 $0 $352 $226 $247 $273 Bay Area Rapid Transit % $0 $0 $85 $54 $59 $66 East Bay Regional Park % $0 $0 $34 $22 $24 $26 Total Ad Valorem Taxes % $0 $0 $12,328 $7,919 $8,642 $9,575 Direct Charges (2) Amount Amount Amount Amount Amount Amount City Street Lighting 83-1 $19 $19 $19 $19 $19 $19 Mosquito Abatement $2 $2 $2 $2 $2 $2 CSA Paramedic $31 $31 $31 $31 $31 $31 CSA Vector Control $6 $6 $6 $6 $6 $6 Paramedic Supplement $6 $6 $6 $6 $6 $6 DUSD Measure B Tax $96 $96 $96 $96 $96 $96 Haz Waste Program $9 $9 $9 $9 $9 $9 CSA Vector Control B $2 $2 $2 $2 $2 $2 Mosquito Assessment 2 $2 $2 $2 $2 $2 $2 East Bay Trail LLD $5 $5 $5 $5 $5 $5 CFD No Facilities $4,343 $4,711 $5,075 $3,405 $3,834 $4,252 CFD No Services $49 $53 $57 $38 $43 $48 Total Direct Charges $4,569 $4,942 $5,310 $3,621 $4,055 $4,478 Total Taxes and Direct Charges $17,638 $11,540 $12,697 $14,053 Percentage of Total Estimated Sales Price N/A N/A 1.67% 1.70% 1.71% 1.71% (1) The smallest single family detached unit starts at 2,318 square feet and therefore, there is no estimated sales price from Brookfield at this time. (2) Based on sample tax bills from the Alameda County Tax Collector s website. Sources: County of Alameda; Brookfield; Goodwin Consulting Group, Inc. -54-
61 SPECIAL RISK FACTORS The purchase of the Bonds described in this Official Statement involves a degree of risk that may not be appropriate for some investors. The following is a description of certain risk factors affecting the District, the property owners in the District, the parcels subject to the levy of Special Tax and the payment of and security for the Bonds. The following discussion of risks is not meant to be a complete list of the risks associated with the purchase of the Bonds and does not necessarily reflect the relative importance of the various risks. Potential investors are advised to consider the following factors along with all other information in this Official Statement in evaluating the investment quality of the Bonds. There can be no assurance that other risk factors will not become material in the future. Limited Obligation of the City to Pay Debt Service The City has no obligation to pay principal of and interest on the Bonds in the event Special Tax collections are delinquent, other than from amounts, if any, on deposit in the Reserve Fund or funds derived from the tax sale or foreclosure and sale of parcels on which levies of the Special Tax are delinquent, nor is the City obligated to advance funds to pay such debt service on the Bonds. The Bonds are not general obligations of the City but are limited obligations of the City and Improvement Area No. 1 payable solely from the proceeds of the Special Tax and certain funds held under the Fiscal Agent Agreement, including amounts deposited in the Reserve Fund and investment income thereon, and the proceeds, if any, from the sale of property subject to the Special Tax in the event of a foreclosure. See SECURITY AND SOURCES OF PAYMENT FOR THE BONDS. Any tax for the payment of the Bonds will be limited to the Special Taxes to be collected within the jurisdiction of Improvement Area No. 1. Neither the faith and credit nor the taxing power of the City or the State of California or of any of their respective political subdivisions is pledged to the payment of the Bonds. Special Tax Not a Personal Obligation An owner of property in Improvement Area No. 1 is not personally obligated to pay the Special Tax attributable to the property in Improvement Area No. 1. Rather, the Special Tax is an obligation only against the parcel of property, secured by the amount which could be realized in a foreclosure proceeding against the property, and not by any promise of the owner of any property to pay. If the value of the property is not sufficient for the payment of debt service on the Bonds, taking into account other obligations also constituting a lien against the property, the City, Fiscal Agent and owners of the Bonds have no recourse against the owner, such as filing a lawsuit to collect money. Concentration of Ownership All of the land within Improvement Area No. 1 is currently owned by the Developer and the Merchant Builders, as there have not yet been any transfers to homeowners. The lack of diversity in ownership of property in the District, and the consequent lack of diversity in the obligation to pay the Special Tax levied in the District, represents significant risk to the owners of the Bonds in that the ability of the Developer and the Merchant Builders to pay the Special Tax levied on property they own will depend, in part, on the successful sales of lots and homes in the District. Failure of the current owners, or any future owners, of significant property subject to the Special Taxes in Improvement Area No. 1 to pay installments of Special Taxes when due could -55-
62 cause the depletion of the Reserve Fund prior to reimbursement from the resale of foreclosed property or payment of the delinquent Special Tax and, consequently, result in the delinquency rate reaching a level that would cause an insufficiency in collection of the Special Tax to meet obligations on the Bonds. For a description of the Developer and the Merchant Builders, see OWNERSHIP OF PROPERTY WITHIN IMPROVEMENT AREA NO. 1 The Developer. In that event, there could be a delay or failure in payments on the Bonds. See SPECIAL RISK FACTORS Bankruptcy and Foreclosure Delays below and SECURITY FOR THE BONDS Delinquent Payments; Covenant for Superior Court Foreclosure. Development of undeveloped property within Improvement Area No. 1 may be subject to unexpected delays, disruptions and changes which may affect the willingness and ability of the Developer or landowner to pay the Special Taxes when due. Certain infrastructure improvements remain to be completed in order to complete construction of all of the homes in Improvement Area No. 1. No assurance can be given that the remaining proposed residential development will be partially or fully completed, and for purposes of evaluating the investment quality of the Bonds, prospective purchasers should consider the possibility that such parcels will remain vacant and only partially improved. Levy and Collection of the Special Tax General. The principal source of payment of principal of and interest on the Bonds is the proceeds of the annual levy and collection of the Special Tax against property within Improvement Area No. 1. Limitation on Maximum Annual Special Tax Rate. The annual levy of the Special Tax is subject to the maximum annual Special Tax rate authorized in the Rate and Method. The levy cannot be made at a higher rate even if the failure to do so means that the estimated proceeds of the levy and collection of the Special Tax, together with other available funds, will not be sufficient to pay debt service on the Bonds. In addition to the maximum annual Special Tax rate limitation in the Rate and Method, Section 53321(d) of the Act provides that the special tax levied against any parcel for which an occupancy permit for private residential use has been issued may not be increased as a consequence of delinquency or default by the owner of any other parcel within a community facilities district by more than 10% above the amount that would have been levied in such Fiscal Year had there never been any such delinquencies or defaults. In cases of significant delinquency, these factors may result in defaults in the payment of principal of and interest on the Bonds. No Relationship Between Property Value and Special Tax Levy. Because the Rate and Method is not based on property value, the levy of the Special Tax will rarely, if ever, result in a uniform relationship between the value of particular parcels of Taxable Property and the amount of the levy of the Special Tax against those parcels. Thus, there will rarely, if ever, be a uniform relationship between the value of the parcels of Taxable Property and their proportionate share of debt service on the Bonds, and certainly not a direct relationship. Factors that Could Lead to Special Tax Deficiencies. The following are some of the factors that might cause the levy of the Special Tax on any particular parcel of Taxable Property to vary from the Special Tax that might otherwise be expected: -56-
63 Transfers to Governmental Entities. The number of parcels of Taxable Property could be reduced through the acquisition of Taxable Property by a governmental entity and failure of the government to pay the Special Tax based upon a claim of exemption or, in the case of the federal government or an agency thereof, immunity from taxation, thereby resulting in an increased tax burden on the remaining taxed parcels. One parcel is anticipated to be used as a school and be exempt from the levy of the Special Tax; accordingly, this parcel has not been included in the parcels that were appraised by the Appraiser and no portion of the Bonds have been allocated to it in the tables in this Official Statement. Property Tax Delinquencies. Under provisions of the Act, the Special Tax, from which funds necessary for the payment of principal of, and interest on, the Bonds are derived, are being billed to the property within the District on the regular property tax bills sent to owners of the parcels. Such Special Tax installments are due and payable, and bear the same penalties and interest for nonpayment, as do regular property tax installments. Special Tax installment payments cannot be made separately from property tax payments. Therefore, the unwillingness or inability of a property owner to pay regular property tax bills as evidenced by property tax delinquencies may also indicate an unwillingness or inability to make regular property tax payments and Special Tax installment payments in the future. Failure of the owners of Taxable Property to pay property taxes (and, consequently, the Special Tax), or delays in the collection of or inability to collect the Special Tax by tax sale or foreclosure and sale of the delinquent parcels, could result in a deficiency in the collection of Special Tax revenues. For a summary of recent Special Tax collection and delinquency rates in Improvement Area No. 1, see VALUE OF PROPERTY WITHIN IMPROVEMENT AREA NO. 1 herein. Insufficiency of Special Taxes In order to pay debt service on the Bonds, it is necessary that the Special Tax levied against taxable parcels within the District be paid in a timely manner. The City has established the Reserve Fund in an amount equal to the Reserve Requirement to pay debt service on the Bonds and any Parity Bonds to the extent Special Taxes are not paid on time and other funds are not available. See SECURITY AND SOURCES OF PAYMENT FOR THE BONDS Reserve Fund and APPENDIX C Summary of Certain Provisions of the Fiscal Agent Agreement. Under the Fiscal Agent Agreement, the City has covenanted to maintain in the Reserve Fund an amount equal to the Reserve Requirement; subject, however, to the limitation that the City may not levy the Special Tax in any fiscal year at a rate in excess of the Maximum Special Tax rates permitted under the Rate and Method. In addition, the Act imposes certain limitations on increases in Special Taxes on residential parcels as a consequence of delinquencies in payment of the Special Taxes. See SECURITY AND SOURCES OF PAYMENT FOR THE BONDS Special Taxes. Consequently, if a delinquency occurs, the City may be unable to replenish the Reserve Fund to the Reserve Requirement due to the limitation of the Maximum Special Tax rates. If such defaults were to continue in successive years, the Reserve Fund could be depleted and a default on the Bonds would occur if proceeds of a foreclosure sale did not yield a sufficient amount to pay the delinquent Special Taxes. The City has made certain covenants regarding the institution of foreclosure proceedings to sell any property with delinquent Special Taxes in order to obtain funds to pay debt service on the Bonds. See SECURITY AND SOURCES OF PAYMENT FOR THE BONDS Delinquent Payments of Special Tax; Covenant for Superior Court Foreclosure. If foreclosure proceedings -57-
64 were ever instituted, any mortgage or deed of trust holder could, but would not be required to, advance the amount of delinquent Special Taxes to protect its security interest. Appraised Values The Appraisal estimates the market value of the taxable property within Improvement Area No. 1. This market value is merely the present opinion of the Appraiser, and is subject to the assumptions and limiting conditions stated in the Appraisal. Prospective purchasers of the Bonds should not assume that the land within the District could be sold for the appraised amount described in the Appraisal at a foreclosure sale for delinquent Special Taxes the City has not sought the present opinion of any other appraiser of the value of the taxed parcels. A different present opinion of value might be rendered by a different appraiser. The City makes no representation as to the accuracy of the Appraisal. The opinion of value relates to sale by a willing seller to a willing buyer as of the date of valuation, each having similar information and neither being forced by other circumstances to sell or to buy. Consequently, the opinion is of limited use in predicting the selling price at a foreclosure sale, because the sale is forced and the buyer may not have the benefit of full information. In considering the estimates of value evidenced by the Appraisal, it should be noted that the Appraisal is based upon a number of standard and special assumptions which affect the estimates as to value, as well as the hypothetical condition of the Authorized Improvements having been completed, as set forth in the Appraisal (see APPENDIX B hereto). The improvements to be financed by the Bonds were not in place as of the date of inspection; thus, the value estimate is subject to a hypothetical condition (of such improvements being in place). In addition, the opinion of market value in the Appraisal is a present opinion. It is based upon present facts and circumstances. Differing facts and circumstances may lead to differing opinions of value. The appraised market value is not evidence of future value because future facts and circumstances may differ significantly from the present. No assurance can be given that any of the appraised property in Improvement Area No. 1 could be sold in a foreclosure for the estimated market value contained in the Appraisal. Such sale is the primary remedy available to Bondowners if that property should become delinquent in the payment of Special Taxes. A significant portion of the Special Tax is expected to initially be levied on Undeveloped Property with low value to Bond burden values. Although the Act authorizes the City to cause such an action to be commenced and diligently pursued to completion, the Act does not specify any obligation of the City with regard to purchasing or otherwise acquiring any lot or parcel of property sold at the foreclosure sale in any such action if there is no other purchaser at such sale. The City is not obligated and does not expect to be a bidder at any such foreclosure sale. Value-to-Lien Ratios Value-to-lien ratios have traditionally been used in land-secured bond issues as a measure of the collateral supporting the willingness of property owners to pay their special taxes and assessments (and, in effect, their general property taxes as well). The value-to-lien ratio is mathematically a fraction, the numerator of which is the value of the property (usually either the assessed value or a market value as determined by an appraiser) and the denominator of which is the lien of the assessments or special taxes as represented by the -58-
65 principal amount of bonds repaid by such assessment or special tax. A value-to-lien ratio should not, however, be viewed as a guarantee of credit-worthiness. Land values are especially sensitive to economic cycles. A downturn of the economy may depress land values and hence the value-to-lien ratios. Further, the value-to-lien ratio typically cited for a bond issue is an average. Individual parcels in a community facilities district may fall above or below the average, sometimes even below a 1:1 ratio (with a ratio below 1:1, the land is worth less than the unpaid principal of the bonded debt allocable to it). Although judicial foreclosure proceedings can be initiated rapidly, the process can take several years to complete, and the bankruptcy courts may impede the foreclosure action. Finally, local agencies may form overlapping community facilities districts or assessment districts. Such local agencies typically do not coordinate their bond issuances. Debt issuance by an entity other than the City for the District can therefore dilute value-to-lien ratios. Exempt Properties Certain properties are exempt from the Special Tax in accordance with the Rate and Method. In addition, the Act provides that properties or entities of the state, federal or local government are exempt from the Special Tax; provided, however, that property within the District acquired by a public entity through a negotiated transaction, or by gift or devise, that is not otherwise exempt from the Special Tax, will continue to be subject to the Special Tax. It is possible that property acquired by a public entity following a tax sale or foreclosure based upon failure to pay taxes could become exempt from the Special Tax. In addition, the Act provides that if property subject to the Special Tax is acquired by a public entity through eminent domain proceedings, the obligation to pay the Special Tax with respect to that property, for outstanding Bonds only, is to be treated as if it were a special assessment. The constitutionality and operation of these provisions of the Act have not been tested. In particular, insofar as the Act requires payment of the Special Tax by a federal entity acquiring property within the District, it may be unconstitutional. If for any reason property within the District becomes exempt from taxation by reason of ownership by a nontaxable entity such as the federal government or another public agency, subject to the limitation of the Maximum Special Tax, the Special Tax will be reallocated to the remaining taxable properties within the District. This would result in the owners of such property paying a greater amount of the Special Tax and could have an adverse impact upon the timely payment of the Special Tax. Moreover, if a substantial portion of land within the District becomes exempt from the Special Tax because of public ownership, or otherwise, the maximum rate that could be levied upon the remaining acreage might not be sufficient to pay principal of and interest on the Bonds when due and a default would occur with respect to the payment of such principal and interest. The Act further provides that no other properties or entities are exempt from the Special Tax unless the properties or entities are expressly exempted in a resolution of consideration to levy a new special tax or to alter the rate or method of apportionment of an existing special tax. Property Values and Property Development The value of taxable property within Improvement Area No. 1 is a critical factor in determining the investment quality of the Bonds. If a property owner defaults in the payment of the Special Tax, the City s only remedy is to foreclose on the delinquent property in an attempt to obtain funds with which to pay the delinquent Special Tax. Land values could be adversely affected by economic and other factors beyond the City s control including, without limitation, a general economic downturn, relocation of employers out of the area, shortages of water, -59-
66 electricity, natural gas or other utilities, destruction of property caused by earthquake, flood, wildfires, or other natural disasters, environmental pollution or contamination, inability to obtain necessary permits or agreements with governmental entities, or unfavorable economic conditions. The Appraisal (which is set forth in APPENDIX B to this Official Statement) is based on certain assumptions made by the Appraiser in estimating the market value of the property within Improvement Area No. 1 as of the date indicated. No assurance can be given that the land values are accurate if these assumptions are incorrect or that the values will not decline in the future if one or more events, such as natural disasters or adverse economic conditions, occur. See Appraised Values above. Neither the District nor the City has evaluated development risks related to the development of land in the District. Since these are largely business risks of the type that property owners customarily evaluate individually, and inasmuch as changes in land ownership may well mean changes in the evaluation with respect to any particular parcel, the District is issuing the Bonds without regard to any such evaluation. Thus, the creation of the District and the issuance of the Bonds in no way implies that the District or the City has evaluated these risks or the reasonableness of these risks. The following is a discussion of specific risk factors that could affect the timing or scope of property development in Improvement Area No. 1 or the value of property in Improvement Area No. 1. Land Development. Land values are influenced by the level of development in the area in many respects. First, undeveloped or partially developed land is generally less valuable than developed land and provides less security to the Owners of the Bonds should it be necessary for the City to foreclose on undeveloped or partially developed property due to the nonpayment of Special Taxes. Second, failure to complete development on a timely basis could adversely affect the land values of those parcels that have been completed. Lower land values would result in less security for the payment of principal of and interest on the Bonds and lower proceeds from any foreclosure sale necessitated by delinquencies in the payment of the Special Tax. See APPRAISED VALUE OF PROPERTY WITHIN IMPROVEMENT AREA NO. 1 - Value to Special Tax Burden Ratios. No assurance can be given that the proposed development within Improvement Area No. 1 will be completed, and in assessing the investment quality of the Bonds, prospective purchasers should evaluate the risks of non-completion. Neither the Developer nor any other person provides any assurances that the project currently envisioned for the land in the District will be completed, or that sources of financing that will actually be available to the Developer will be sufficient to complete such projected development. The Developer has no obligation to the City or to owners of the Bonds to complete the project. Risks of Real Estate Investment Generally. Continuing development of land within Improvement Area No. 1 may be adversely affected by changes in general or local economic conditions, fluctuations in the real estate market, increased construction costs, development, financing and marketing capabilities of individual property owners, water or electricity shortages, -60-
67 and other similar factors. Development in Improvement Area No. 1 may also be affected by development in surrounding areas, which may compete with the development. In addition, land development operations are subject to comprehensive federal, state and local regulations, including environmental, land use, zoning and building requirements. There can be no assurance that proposed land development operations within Improvement Area No. 1 will not be adversely affected by future government policies, including, but not limited to, governmental policies to restrict or control development, or future growth control initiatives. There can be no assurance that land development operations within Improvement Area No. 1 will not be adversely affected by these risks. Natural Disasters. The value of the parcels in Improvement Area No. 1 in the future can be adversely affected by a variety of natural occurrences, particularly those that may affect infrastructure and other public improvements and private improvements on the parcels in the District and the continued habitability and enjoyment of such private improvements. For example, the areas in and surrounding the District, like those in much of the State, may be subject to earthquakes or other unpredictable seismic activity. According to the Seismic Safety Commission, District is located within Zone 4, which is considered to be the highest risk zone in California. There are only two zones in California: Zone 4, which is assigned to areas near major faults; and Zone 3, which is assigned to all other areas of more moderate seismic activity. In addition, the District is located in a Fault-Rupture Hazard Zone (formerly referred to as an Alquist- Priolo Special Study Zone), as defined by Special Publication 42 (revised January 1994) of the California Department of Conservation, Division of Mines and Geology. Other natural disasters could include, without limitation, landslides, floods, droughts or tornadoes. One or more natural disasters could occur and could result in damage to improvements of varying seriousness. The damage may entail significant repair or replacement costs and that repair or replacement may never occur either because of the cost, or because repair or replacement will not facilitate habitability or other use, or because other considerations preclude such repair or replacement. Under any of these circumstances there could be significant delinquencies in the payment of Special Taxes, and the value of the parcels may well depreciate. Legal Requirements. Other events that may affect the value of a parcel include changes in the law or application of the law. Such changes may include, without limitation, local growth control initiatives, local utility connection moratoriums and local application of statewide tax and governmental spending limitation measures. Development in the District may also be adversely affected by the application of laws protecting endangered or threatened species. Hazardous Substances. Any discovery of a hazardous substance detected on property within the District would affect the marketability and the value of some or all of the property in the District. In that event, the owners and operators of a parcel within the District may be required by law to remedy conditions of the parcel relating to releases or threatened releases of hazardous substances. The federal Comprehensive Environmental Response, Compensation and Liability Act of 1980, sometimes referred to as CERCLA or the Superfund Act, is the most well-known and widely applicable of these laws. State law with regard to hazardous substances are also applicable to property within the District and are as stringent as the federal laws. Under many of these laws, the owner (or operator) is obligated to remedy a hazardous substance condition of property whether or not the owner (or operator) has anything to do with creating or handling the hazardous substance. The effect, therefore, should any of the parcels be contaminated by a hazardous substance is to reduce the marketability and value of the -61-
68 parcel by the costs of remedying the condition, because the purchaser, upon becoming owner, will become obligated to remedy the condition just as is the seller. The values set forth in the Appraisal do not take into account the possible reduction in marketability and value of any of the parcels within the District by reason of the possible liability of the owner (or operator) for the remedy of a hazardous substance condition on a parcel. Although the City is not aware that the owner (or operator) of any of the property within the District has a current liability for a hazardous substance with respect to any of the parcels, it is possible that such liabilities do currently exist and that the City is not aware of them. Further, it is possible that liabilities may arise in the future with respect to any of the parcels within the District resulting from the existence, currently, on the parcel of a substance presently classified as hazardous but which has not been released or the release of which is not presently threatened, or may arise in the future resulting from the existence, currently, on the parcel of a substance not presently classified as hazardous but which may in the future be so classified. Further, such liabilities may arise not simply from the existence of a hazardous substance but from the method of handling it. All of these possibilities could significantly affect the value of a parcel within the District that is realizable upon a foreclosure sale. The City has not independently verified, but is not aware of, the presence of any hazardous substances within the District. Endangered and Threatened Species. It is illegal to harm or disturb any plants or animals in their habitat that have been listed as endangered species by the United States Fish & Wildlife Service under the Federal Endangered Species Act or by the California Fish & Game Commission under the California Endangered Species Act without a permit. The discovery of an endangered plant or animal could delay development of undeveloped property in the District or reduce the value of such property. Other Possible Claims Upon the Value of Taxable Property While the Special Taxes are secured by the taxable property in Improvement Area No. 1, the security only extends to the value of such property that is not subject to priority and parity liens and similar claims. The table in the section entitled APPRAISED VALUE OF PROPERTY WITHIN IMPROVEMENT AREA NO. 1 Overlapping Liens and Priority of Lien shows the presently outstanding amount of governmental obligations (with stated exclusions), the tax or assessment for which is or may become an obligation of one or more of the parcels of taxable property. The table also states the additional amount of general obligation bonds the tax for which, if and when issued, may become an obligation of one or more of the parcels of taxable property. The table does not specifically identify which of the governmental obligations are secured by liens on one or more of the parcels of taxable property. The City, the County and certain other public agencies are authorized by the Act to form other community facilities districts and improvement areas and, under other provisions of State law, to form special assessment districts, either or both of which could include all or a portion of the land within Improvement Area No. 1. Other governmental obligations may be authorized and undertaken or issued in the future, the tax, assessment or charge for which may become an obligation of one or more of the parcels of taxable property and may be secured by a lien on a parity with the lien of the Special Tax securing the Bonds. The City has no control over the ability of other entities to issue indebtedness secured by special taxes or assessments payable from all or a portion of the taxable property within the District subject to the levy of the Special -62-
69 Tax. The imposition of additional indebtedness could reduce the willingness and the ability of the property owners within the District to pay the Special Taxes when due. In general, as long as the Special Tax is collected on the County tax roll, the Special Tax and all other taxes, assessments and charges also collected on the tax roll are on a parity, that is, are of equal priority. Questions of priority become significant when collection of one or more of the taxes, assessments or charges is sought by some other procedure, such as foreclosure and sale. In the event of proceedings to foreclose for delinquency of Special Taxes securing the Bonds, the Special Tax will be subordinate only to existing prior governmental liens, if any. Otherwise, in the event of such foreclosure proceedings, the Special Taxes will generally be on a parity with the other taxes, assessments and charges, and will share the proceeds of such foreclosure proceedings on a pro rata basis. Although the Special Taxes will generally have priority over non-governmental liens on a parcel of Taxable Property, regardless of whether the non-governmental liens were in existence at the time of the levy of the Special Tax or not, this result may not apply in the case of bankruptcy. Bankruptcy and Foreclosure Delays The Fiscal Agent Agreement generally provides that the Special Tax is to be collected in the same manner as ordinary ad valorem property taxes are collected and, except as provided in the special covenant for foreclosure described in SECURITY FOR THE BONDS Delinquent Payments of Special Tax; Covenant for Superior Court Foreclosure and in the Act, is subject to the same penalties and the same procedure, sale and lien priority in case of delinquency as is provided for ordinary ad valorem property taxes. Under these procedures, if taxes are unpaid for a period of five years or more, the property is deeded to the State and then is subject to sale by the County. If sales or foreclosures of property are necessary, there could be a delay in payments to owners of the Bonds pending such sales or the prosecution of foreclosure proceedings and receipt by the City of the proceeds of sale if the Reserve Fund is depleted. See SECURITY AND SOURCES OF PAYMENT FOR THE BONDS Delinquent Payments of Special Tax; Covenant for Superior Court Foreclosure. No assurances can be given that a taxable parcel in the District that would be subject to a judicial foreclosure sale for delinquent Special Taxes will be sold or, if sold, that the proceeds of such sale will be sufficient to pay the delinquent Special Tax installment. Although the Act authorizes the City to cause such an action to be commenced and diligently pursued to completion, the Act does not specify any obligation of the City with regard to purchasing or otherwise acquiring any lot or parcel of property sold at the foreclosure sale in any such action if there is no other purchaser at such sale and the City has not in any way agreed nor does it expect to be such a bidder. The ability of the City to collect interest and penalties specified by State law and to foreclose against properties having delinquent Special Tax installments may be limited in certain respects with regard to properties in which the Federal Deposit Insurance Corporation (the FDIC ) has or obtains an interest. The FDIC would obtain such an interest by taking over a financial institution that has made a loan that is secured by property within the District. The payment of the Special Tax and the ability of the City to foreclose the lien of a delinquent unpaid Special Tax may also be limited by bankruptcy, insolvency or other laws generally affecting creditors rights or by the laws of the State of California relating to judicial foreclosure. Although bankruptcy proceedings would not cause the Special Tax to become extinguished, bankruptcy of a property owner or any other person claiming an interest in the -63-
70 property could result in a delay in superior court foreclosure proceedings and could result in the possibility of Special Tax installments not being paid in part or in full. Such a delay would increase the likelihood of a delay or default in payment of the principal of and interest on the Bonds. The various legal opinions to be delivered concurrently with the delivery of the Bonds (including Bond Counsel s approving legal opinion) will be qualified as to the enforceability of the various legal instruments by bankruptcy, insolvency, reorganization, moratorium and other similar laws affecting creditors rights, by the application of equitable principles and by the exercise of judicial discretion in appropriate cases. Other laws generally affecting creditors rights or relating to judicial foreclosure may affect the ability to enforce payment of Special Taxes or the timing of enforcement of Special Taxes. For example, the Soldiers and Sailors Civil Relief Act of 1940 affords protections such as a stay in enforcement of the foreclosure covenant, a six-month period after termination of military service to redeem property sold to enforce the collection of a tax or assessment and a limitation on the interest rate on the delinquent tax or assessment to persons in military service if the court concludes the ability to pay such taxes or assessments is materially affected by reason of such service. To the extent that property in Improvement Area No. 1 continues to be owned by a limited number of property owners, the chances are increased that the Reserve Fund could be fully depleted during any such delay in obtaining payment of delinquent Special Taxes. As a result, sufficient moneys would not be available in the Reserve Fund to make up shortfalls resulting from delinquent payments of the Special Tax and thereby to pay principal of and interest on the Bonds on a timely basis. No Acceleration Provisions The Bonds do not contain a provision allowing for their acceleration in the event of a payment default or other default under the terms of the Bonds or the Fiscal Agent Agreement or in the event interest on the Bonds becomes included in gross income for federal income tax purposes. Under the Fiscal Agent Agreement, a Bondowner is given the right for the equal benefit and protection of all Bondowners similarly situated to pursue certain remedies. So long as the Bonds are in book-entry form, DTC will be the sole Bondowner and will be entitled to exercise all rights and remedies of Bond holders, in accordance with its procedures and rules. Loss of Tax Exemption As discussed under the caption LEGAL MATTERS Tax Exemption, interest on the Bonds might become includable in gross income for purposes of federal income taxation retroactive to the date the Bonds were issued as a result of future acts or omissions of the City in violation of its covenants in the Fiscal Agent Agreement. Neither the Bonds nor the Fiscal Agent Agreement contain a special redemption feature triggered by the occurrence of an event of taxability. As a result, if interest on the Bonds were to become includable in gross income for purposes of federal income taxation, the Bonds would continue to remain outstanding until maturity unless earlier redeemed pursuant to optional redemption, mandatory sinking fund redemption or special mandatory redemption upon prepayment of the Special Taxes. In addition, Congress is or may be considering in the future legislative proposals, including some that carry retroactive effective dates, that, if enacted, would alter or eliminate the exclusion from gross income for federal income tax purposes of interest on municipal bonds, such as the Bonds. Prospective purchasers of the Bonds should consult their own tax advisors -64-
71 regarding any pending or proposed federal tax legislation. The City can provide no assurance that federal tax law will not change while the Bonds are outstanding or that any such changes will not adversely affect the exclusion of interest on the Bonds from gross income for federal income tax purposes. If the exclusion of interest on the Bonds from gross income for federal income tax purposes were amended or eliminated, it is likely that the market price for the Bonds would be adversely impacted. Enforceability of Remedies The remedies available to the Fiscal Agent and the registered owners of the Bonds upon a default under the Fiscal Agent Agreement or any other document described in this Official Statement are in many respects dependent upon regulatory and judicial actions that are often subject to discretion and delay. Under existing law and judicial decisions, the remedies provided for under such documents may not be readily available or may be limited. Any legal opinions to be delivered concurrently with the issuance of the Bonds will be qualified to the extent that the enforceability of the legal documents with respect to the Bonds is subject to limitations imposed by bankruptcy, reorganization, insolvency or other similar laws affecting the rights of creditors generally and by equitable remedies and proceedings generally. Judicial remedies, such as foreclosure and enforcement of covenants, are subject to exercise of judicial discretion. A California court may not strictly apply certain remedies or enforce certain covenants if it concludes that application or enforcement would be unreasonable under the circumstances and it may delay the application of such remedies and enforcement. No Secondary Market No representation is made concerning any secondary market for the Bonds. There can be no assurance that any secondary market will develop for the Bonds. Investors should understand the long-term and economic aspects of an investment in the Bonds and should assume that they will have to bear the economic risks of their investment to maturity. An investment in the Bonds may be unsuitable for any investor not able to hold the Bonds to maturity. Disclosure to Future Purchasers The willingness or ability of an owner of a parcel to pay the Special Tax, even if the value of the property is sufficient to justify payment, may be affected by whether or not the owner was given due notice of the Special Tax authorization at the time the owner purchased the parcel, was informed of the amount of the Special Tax on the parcel should the Special Tax be levied at the maximum tax rate and, at the time of such a levy, has the ability to pay it as well as pay other expenses and obligations. The City has caused a Notice of Special Tax Lien to be recorded in the Office of the Recorder for the County against the real property in the District. Although title companies normally refer to such notices in title reports, there can be no guarantee that such reference will be made or, if made, that a prospective purchaser or lender will consider such Special Tax obligation when purchasing real property within the District or lending money thereon, as applicable. California Civil Code Section b requires that, in the case of transfers, the seller must at least make a good faith effort to notify the prospective purchaser of the special tax lien in a format prescribed by statute. Failure by an owner of the property to comply with the above requirements, or failure by a purchaser or lessor to consider or understand the nature and -65-
72 existence of the Special Tax, could adversely affect the willingness and ability of the purchaser or lessor to pay the Special Tax when due. IRS Audit of Tax-Exempt Bond Issues The Internal Revenue Service (the IRS ) has initiated an expanded program for the auditing of tax-exempt bond issues, including both random and targeted audits. It is possible that the Bonds will be selected for audit by the IRS. It is also possible that the market value of such Bonds might be affected as a result of such an audit of such Bonds (or by an audit of similar bonds or securities). Voter Initiatives From time to time, initiative measures qualify for the State ballot pursuant to the State s constitutional initiative process and those measures could be adopted by State voters. The adoption of any such initiative might place limitations on the ability of the State, the City, the County or other local districts to increase revenues or to increase appropriations or on the ability of the landowners to complete the development of the District. See Property Values and Property Development above. Under the State Constitution, the power of initiative is reserved to the voters for the purpose of enacting statutes and constitutional amendments. Since 1978, the voters have exercised this power through the adoption of Proposition 13 and similar measures, including Proposition 218, which was approved in the general election held on November 5, 1996, and Proposition 26, which was approved on November 2, Any such initiative may affect the collection of fees, taxes and other types of revenue by local agencies such as the District. Subject to overriding federal constitutional principles, such collection may be materially and adversely affected by voter-approved initiatives, possibly to the extent of creating cash-flow problems in the payment of outstanding obligations such as the Special Tax Bonds. Proposition 218 Voter Approval for Local Government Taxes Limitation on Fees, Assessments, and Charges Initiative Constitutional Amendment, added Articles XIIIC and XIIID to the State Constitution, imposing certain vote requirements and other limitations on the imposition of new or increased taxes, assessments and property-related fees and charges. On November 2, 2010, State voters approved Proposition 26, entitled the Supermajority Vote to Pass New Taxes and Fees Act. Section 1 of Proposition 26 declares that Proposition 26 is intended to limit the ability of the State Legislature and local government to circumvent existing restrictions on increasing taxes by defining the new or expanded taxes as fees. Proposition 26 amended Articles XIIIA and XIIIC of the State Constitution. The amendments to Article XIIIA limit the ability of the State Legislature to impose higher taxes (as defined in Proposition 26) without a two-thirds vote of the Legislature. Article XIIIC requires that all new local taxes be submitted to the electorate before they become effective. Taxes for general governmental purposes require a majority vote and taxes for specific purposes ( special taxes ) require a two-thirds vote. The Special Taxes and the Bonds were each authorized by a vote of the Developer as the sole landowner, who constituted the qualified electors at the time of such voted -66-
73 authorization. The District believes, therefore, that issuance of the Bonds does not require the conduct of further proceedings under the Act, Proposition 218 or Proposition 26. Like their antecedents, Proposition 218 and Proposition 26 are likely to undergo both judicial and legislative scrutiny before the impact on the District can be determined. Certain provisions of Proposition 218 and Proposition 26 may be examined by the courts for their constitutionality under both State and federal constitutional law, the outcome of which cannot be predicted. Recent Case Law Related to the Mello-Roos Act On August 1, 2014, the California Court of Appeal, Fourth Appellate District, issued its opinion in City of San Diego v. Melvin Shapiro, et al. (D063997). The case involved a Convention Center Facilities District (the CCFD ) established by the City of San Diego. The CCFD is a financing district established under San Diego s city charter (the Charter ) and was intended to function much like a community facilities district established under the Act. The CCFD was comprised of all of the real property in the entire city. However, the CCFD special tax was to be levied only on properties in the CCFD that were improved with a hotel. At the election to authorize the CCFD special tax, the CCFD proceedings limited the electorate to owners of hotel properties and lessees of real property owned by a governmental entity on which a hotel was located. Registered voters in the City of San Diego were not permitted to vote. This definition of the qualified electors of the CCFD was based on Section 53326(c) of the Act, which generally provides that, if a special tax will not be apportioned in any tax year on residential property, the legislative body may provide that the vote shall be by the landowners of the proposed community facilities district whose property would be subject to the special tax. The San Diego Court held that the CCFD special tax election did not comply with its Charter and with applicable provisions of the State Constitution -- specifically Article XIIIA, section 4 ( Cities, Counties and special districts, by a two-thirds vote of the qualified electors of such district, may impose special taxes on such district.... ) and Article XIIIC, section 2(d) ( No local government may impose, extend, or increase any special tax unless and until that tax is submitted to the electorate and approved by a two-thirds vote. ) -- because the electors in the CCFD election should have been the registered voters residing within the CCFD (the boundaries of which were coterminous with the boundaries of the City of San Diego). As to the District, there were no registered voters within the District at the time of the election to authorize the Special Taxes. Significantly, the San Diego Court expressly stated that it was not addressing the validity of a landowner election to impose special taxes on property pursuant to the Act in situations where there are fewer than 12 registered voters. Therefore, by its terms, the San Diego Court s holding does not apply to the special tax election in the District. Moreover, Sections and of the Act establish a limited period of time in which special taxes levied under the Act may be challenged by a third party, which time period has now passed. -67-
74 CONTINUING DISCLOSURE The City The City has covenanted for the benefit of owners of the Bonds to provide certain financial information and operating data relating to Improvement Area No. 1 by not later than January 15th of each year (the City Annual Report ) commencing with its report for the Fiscal Year (due January 15, 2018) and to provide notices of the occurrence of certain enumerated events. The City Annual Reports and notice of a listed event will be filed with the Municipal Securities Rulemaking Board. The covenants of the City have been made in order to assist the Underwriter in complying with Securities and Exchange Commission Rule 15c2-12(b)(5) (the Rule ). The specific nature of the information to be contained in the annual reports or the notices of listed events by the City is summarized in APPENDIX G-1. The City did not have any obligation to file continuing disclosure reports or listed events at any time during the previous five years. The City has retained Goodwin Consulting Group Inc., as dissemination agent, in connection with entering into its undertaking under the Rule related to the Bonds. Brookfield BAH The information under this caption has been provided by representatives of Brookfield BAH and has not been independently confirmed or verified by the Underwriter, the City or the District. Brookfield BAH, on behalf of itself and its Affiliates (which specifically includes Brookfield Wilshire LLC and Brookfield Fillmore LLC, but specifically excludes the Developer and CalAtlantic) has also agreed for the benefit of owners of the Bonds to provide certain information relating to the property it or its affiliates owns in Improvement Area No. 1 by not later than December 15th and June 15th of each year (reflecting reported information as of a date no more than 60 days prior) beginning with the report due December 15, 2017 (the Brookfield BAH Periodic Reports ) and to provide notices of the occurrence of certain enumerated events. The obligation of Brookfield BAH to provide such information is in effect only so long as the Brookfield BAH and its Affiliates are collectively responsible for 20% or more of the Special Taxes. Brookfield BAH s reporting obligation may end in certain other circumstances, as described in APPENDIX G-2. Brookfield Bay Area Holdings LLC has not entered into any continuing disclosure undertakings in the last five years. Both Brookfield Wilshire and Brookfield Fillmore are entities created specifically for Dublin Crossing, and so have no prior continuing disclosure undertakings. CalAtlantic The information under this caption has been provided by representatives of CalAtlantic and has not been independently confirmed or verified by the Underwriter, the City or the District. CalAtlantic will execute a Continuing Disclosure Agreement (the CalAtlantic Continuing Disclosure Agreement ), pursuant to which CalAtlantic has agreed for the benefit of owners of the Bonds to provide, or cause to be provided, certain information relating to the property it owns in Improvement Area No. 1 by not later than December 15th and June 15th of -68-
75 each year (reflecting reported information as of a date no more than 60 days prior) beginning with the report due December 15, 2017 (the CalAtlantic Periodic Reports ) and to provide notices of the occurrence of certain enumerated events. The obligation of CalAtlantic to provide such information is in effect only so long as CalAtlantic and its Affiliates are collectively responsible for 20% or more of the Special Taxes. CalAtlantic s reporting obligation may end in certain other circumstances, as described in the CalAtlantic Continuing Disclosure Agreement. A default under the CalAtlantic Continuing Disclosure Agreement will not, in itself, constitute an Event of Default under the Fiscal Agent Agreement, and the sole remedy under the CalAtlantic Continuing Disclosure Agreement in the event of any failure of CalAtlantic or the Dissemination agent, to comply with the CalAtlantic Continuing Disclosure Agreement will be an action to compel performance. See APPENDIX G-3 FORM OF CONTINUING DISCLOSURE UNDERTAKINGS Continuing Disclosure Agreement (Developer-CalAtlantic Group, Inc.). Prior Disclosure Compliance by CalAtlantic. Except as disclosed in the next paragraph, to the Actual Knowledge of CalAtlantic (as defined below), CalAtlantic has not materially failed during the past five years to comply in any material respect with any previous undertaking by it to provide periodic continuing disclosure reports or notices of material events with respect to any community facilities districts or assessment districts in California. Actual Knowledge of CalAtlantic shall mean the knowledge of the authorized officer or representative of CalAtlantic (the Authorized Officer ) signing the Certificate of CalAtlantic Group, Inc. to be delivered in connection with the issuance of the Bonds (the CalAtlantic Certificate ) currently has as of the date of the CalAtlantic Certificate or has obtained through (i) interviews with such current officers and responsible employees of CalAtlantic and its Affiliates (as defined in the CalAtlantic Certificate) as such Authorized Officer has determined are reasonably likely, in the ordinary course of their respective duties, to have knowledge of the matters set forth in the CalAtlantic Certificate, and/or (ii) review of documents that were reasonably available to such Authorized Officer and which such Authorized Officer has reasonably deemed necessary for such Authorized Officer to obtain knowledge of the matters set forth in CalAtlantic Certificate. The Authorized Officer has not conducted any extraordinary inspection or inquiry other than such inspections or inquiries as are prudent and customary in connection with the ordinary course of CalAtlantic s current business and operations. Individuals who are no longer employees of CalAtlantic and its Affiliates have not been contacted. CalAtlantic further notes that it recently completed a merger with The Ryland Group, Inc., a Maryland corporation ( Ryland Group ), pursuant to which Ryland Group merged with and into CalAtlantic, with CalAtlantic being the surviving entity. Individuals who were employees and officers of Ryland Group and its subsidiaries prior to the merger have not been consulted or contacted and documents entered into by Ryland Group and its subsidiaries or related to their properties and projects have not been reviewed. Identification of the below-described event does not constitute a representation by CalAtlantic that such event was material. On September 30, 2013, CalAtlantic filed a Semi-Annual Report pursuant to the Major Developer Continuing Disclosure Agreement, dated June 1, 2006 (the 2006 Disclosure Agreement ), in connection with the issuance of the Poway Unified School District Community Facilities District No. 14 (Del Sur) Improvement Area A 2006 Special Tax Bonds (the 2006 Bonds ). Pursuant to the terms of the 2006 Disclosure Agreement, CalAtlantic was not required to file a Semi-Annual Report once property it owned was no longer responsible for payment of 15% or more of the special taxes securing the 2006 Bonds. Pursuant to the terms of the 2006 Disclosure Agreement, CalAtlantic should have filed a Notice to Repositories of Termination of Reporting Obligations (the Notice ) rather than a Semi-Annual Report. CalAtlantic failed to file -69-
76 a Semi-Annual Report or Notice prior to the April 1, 2014 Report Date. On May 22, 2014, CalAtlantic filed the Notice and CalAtlantic has no further obligations under the 2006 Disclosure Agreement. UNDERWRITING The Bonds were purchased through negotiation by Prager & Co., LLC (the Underwriter ). The Underwriter agreed to purchase the Bonds at a price of $35,388, (which is equal to the par amount of the Bonds, plus an original issue premium of $3,138, and less the Underwriter s discount of $489,463.00). The initial public offering prices set forth on the inside cover page hereof may be changed by the Underwriter. The Underwriter may offer and sell the Bonds to certain dealers and others at a price lower than the public offering prices set forth on the cover page hereof. MUNICIPAL ADVISOR The City has retained Fieldman, Rolapp & Associates, Irvine, California, as Municipal Advisor (the Municipal Advisor ) in connection with the planning, structuring and issuance of the Bonds. The Municipal Advisor is not obligated to undertake, and has not undertaken to make, an independent verification or assume responsibility for the accuracy, completeness, or fairness of the information contained in this Official Statement. The fees of the Municipal Advisor are contingent upon the sale and delivery of the Bonds. LEGAL OPINION The validity of the Bonds and certain other legal matters are subject to the approving opinion of Bond Counsel. A complete copy of the proposed form of Bond Counsel opinion is contained in APPENDIX F to this Official Statement, and the final opinion will be made available to registered owners of the Bonds at the time of delivery. The fees of Bond Counsel are contingent upon the sale and delivery of the Bonds. TAX MATTERS In the opinion of Jones Hall, A Professional Law Corporation, San Francisco, California, Bond Counsel, subject, however to the qualifications set forth below, under existing law, the interest on the Bonds is excluded from gross income for federal income tax purposes and such interest is not an item of tax preference for purposes of the federal alternative minimum tax imposed on individuals and corporations, provided, however, that, for the purpose of computing the alternative minimum tax imposed on corporations (as defined for federal income tax purposes), such interest is taken into account in determining certain income and earnings. The opinions set forth in the preceding paragraph are subject to the condition that the District comply with all requirements of the Internal Revenue Code of 1986, as amended (the Tax Code ) that must be satisfied subsequent to the issuance of the Bonds. The District has covenanted to comply with each such requirement. Failure to comply with certain of such requirements may cause the inclusion of such interest in gross income for federal income tax purposes to be retroactive to the date of issuance of the Bonds. -70-
77 If the initial offering price to the public (excluding bond houses and brokers) at which a Bond is sold is less than the amount payable at maturity thereof, then such difference constitutes original issue discount for purposes of federal income taxes and State of California personal income taxes. If the initial offering price to the public (excluding bond houses and brokers) at which a Bond is sold is greater than the amount payable at maturity thereof, then such difference constitutes original issue premium for purposes of federal income taxes and State of California personal income taxes. De minimis original issue discount and original issue premium is disregarded. Under the Tax Code, original issue discount is treated as interest excluded from federal gross income and exempt from State of California personal income taxes to the extent properly allocable to each owner thereof subject to the limitations described in the first paragraph of this section. The original issue discount accrues over the term to maturity of the Bond on the basis of a constant interest rate compounded on each interest or principal payment date (with straightline interpolations between compounding dates). The amount of original issue discount accruing during each period is added to the adjusted basis of such Bonds to determine taxable gain upon disposition (including sale, redemption, or payment on maturity) of such Bond. The Tax Code contains certain provisions relating to the accrual of original issue discount in the case of purchasers of the Bonds who purchase the Bonds after the initial offering of a substantial amount of such maturity. Owners of such Bonds should consult their own tax advisors with respect to the tax consequences of ownership of Bonds with original issue discount, including the treatment of purchasers who do not purchase in the original offering, the allowance of a deduction for any loss on a sale or other disposition, and the treatment of accrued original issue discount on such Bonds under federal individual and corporate alternative minimum taxes. Under the Tax Code, original issue premium is amortized on an annual basis over the term of the Bond (said term being the shorter of the Bond s maturity date or its call date). The amount of original issue premium amortized each year reduces the adjusted basis of the owner of the Bond for purposes of determining taxable gain or loss upon disposition. The amount of original issue premium on a Bond is amortized each year over the term to maturity of the Bond on the basis of a constant interest rate compounded on each interest or principal payment date (with straight-line interpolations between compounding dates). Amortized Bond premium is not deductible for federal income tax purposes. Owners of premium Bonds, including purchasers who do not purchase in the original offering, should consult their own tax advisors with respect to State of California personal income tax and federal income tax consequences of owning such Bonds. In the further opinion of Bond Counsel, interest on the Bonds is exempt from California personal income taxes. Owners of the Bonds should also be aware that the ownership or disposition of, or the accrual or receipt of interest on, the Bonds may have federal or state tax consequences other than as described above. Bond Counsel expresses no opinion regarding any federal or state tax consequences arising with respect to the Bonds other than as expressly described above. -71-
78 NO RATINGS The City has not applied to a rating agency for the assignment of a rating to the Bonds and does not contemplate applying for a rating. NO LITIGATION At the time of delivery of and payment for the Bonds, the City Attorney will deliver his opinion that to the best of its knowledge there is no action, suit, proceeding, inquiry or investigation at law or in equity before or by any court or regulatory agency pending against the City affecting its existence or the titles of its officers to office or seeking to restrain or to enjoin the issuance, sale or delivery of the Bonds, the application of the proceeds thereof in accordance with the Fiscal Agent Agreement, or the collection or application of the Special Tax to pay the principal of and interest on the Bonds, or in any way contesting or affecting the validity or enforceability of the Bonds, the Fiscal Agent Agreement or any action of the City contemplated by any of said documents, or in any way contesting the completeness or accuracy of this Official Statement or any amendment or supplement thereto, or contesting the powers of the City or its authority with respect to the Bonds or any action of the City contemplated by any of said documents. PROFESSIONAL FEES Fees payable to certain professionals, including Jones Hall, A Professional Law Corporation, San Francisco, California, as Bond Counsel and Disclosure Counsel, Fieldman Rolapp & Associates, as Municipal Advisor, the Trustee and the Underwriter are contingent upon the issuance of the Bonds. EXECUTION The execution and delivery of this Official Statement by the City has been duly authorized by the City Council on behalf of the District and Improvement Area No. 1. CITY OF DUBLIN By: /s/ Colleen Tribby Administrative Services Director/ Finance Director -72-
79 APPENDIX A RATE AND METHOD OF APPORTIONMENT OF SPECIAL TAX A-1
80 (THIS PAGE INTENTIONALLY LEFT BLANK)
81 EXHIBIT A IMPROVEMENT AREA NO. 1 CITY OF DUBLIN COMMUNITY FACILITIES DISTRICT NO (DUBLIN CROSSING) RATE AND METHOD OF APPORTIONMENT OF SPECIAL TAX A Special Tax applicable to each Assessor s Parcel in Improvement Area No. 1 of the City of Dublin Community Facilities District No (Dublin Crossing) shall be levied and collected according to the tax liability determined by the City or its designee, through the application of the appropriate amount or rate for Taxable Property, as described herein. All of the property in Improvement Area No. 1 of the CFD, unless exempted by law or by the provisions of Section H herein, shall be taxed for the purposes, to the extent, and in the manner herein provided, including property subsequently annexed to Improvement Area No. 1. A. DEFINITIONS The terms hereinafter set forth have the following meanings: Acre or Acreage means the land area of an Assessor s Parcel as shown on an Assessor s Parcel Map, or if the land area is not shown on an Assessor s Parcel Map, the land area shown on the applicable Final Map or other parcel map recorded at the County Recorder s Office. Act means the Mello-Roos Community Facilities Act of 1982, as amended, being Chapter 2.5, (commencing with Section 53311), Division 2 of Title 5 of the Government Code of the State of California. Administrative Expenses means any or all of the following: the fees and expenses of any fiscal agent or trustee (including any fees or expenses of its counsel) employed in connection with any Bonds, and the expenses of the City in carrying out its duties with respect to Improvement Area No. 1 and the Bonds, including, but not limited to, the levy and collection of the Special Tax, the fees and expenses of its counsel, charges levied by the County in connection with the levy and collection of Special Taxes, costs related to property owner inquiries regarding the Special Tax, amounts needed to pay rebate to the federal government with respect to Bonds, costs associated with complying with continuing disclosure requirements under the California Government Code and Rule 15c2-12 of the Securities and Exchange Act of 1934 with respect to the Bonds and the Special Tax, and all other costs and expenses of the City in any way related to the establishment or administration of Improvement Area No. 1. Administrator shall mean the person or firm designated by the City to administer the Special Tax according to this RMA. CFD No IA No. 1 1 May 6, 2015
82 Assessor s Parcel or Parcel means a lot or parcel shown on an Assessor s Parcel Map with an assigned Assessor s Parcel number. Assessor s Parcel Map means an official map of the County Assessor designating Parcels by Assessor s Parcel number. Authorized Facilities means those facilities that are authorized to be funded by CFD No Bonds means bonds or other debt (as defined in the Act), whether in one or more series, issued, or assumed by Improvement Area No. 1 to fund Authorized Facilities. Buffer Release shall occur at such time as the Administrator determines that (i) the Final Bond Sale has occurred, and (ii) the sum of the Maximum Special Taxes that can be collected from all Parcels of Developed Property, combined with (A) the Maximum Special Taxes that would be generated if the Residential Units expected to be built on all remaining Parcels of Single Family Detached Property are assumed to fall within the smallest Square Footage Category for Single Family Detached Property, and (B) the Maximum Special Taxes that would be generated if the Residential Units expected to be built on all remaining Parcels of Multi- Family Property are assumed to fall within the smallest Square Footage Category for Multi- Family Property, is sufficient to provide the Required Coverage for Improvement Area No. 1. To estimate the number of remaining Residential Units, the Administrator shall reference current Final Maps, condominium plans, site plans, and other such development plans. After making such determination, the Special Tax Buffer shall no longer be needed, and such amount shall be available to factor into future calculations of debt service coverage. Building Permit means a permit that allows for vertical construction of a Residential Unit or a building with multiple Residential Units, and shall not include a separate permit issued for construction of the foundation thereof. Capitalized Interest means funds in any capitalized interest account available to pay debt service on Bonds. CFD or CFD No means City of Dublin Community Facilities District No (Dublin Crossing). CFD Formation means the date on which the Resolution of Formation to form Improvement Area No. 1 was adopted by the City Council. City means the City of Dublin. City Council means the City Council of the City of Dublin, acting as the legislative body of CFD No County means the County of Alameda. CFD No IA No. 1 2 May 6, 2015
83 Developed Property means, in any Fiscal Year, all Parcels of Single Family Detached Property, Multi-Family Property, and Taxable Non-Residential Property for which a Building Permit was issued prior to June 30 of the preceding Fiscal Year. Development Class means, individually, Developed Property and Undeveloped Property. Expected Land Uses means the total number of Residential Units expected within Improvement Area No. 1 at the time of CFD Formation, as identified in Attachment 1 of this RMA. Pursuant to Sections D and E of this RMA, the Administrator shall update Attachment 1 each time there is a Land Use Change or property annexes into Improvement Area No. 1. Expected Maximum Special Tax Revenues means the amount of annual revenue that would be available if the Maximum Special Tax was levied on the Expected Land Uses. The Expected Maximum Special Tax Revenue as of CFD Formation is shown in Attachment 1, and such amount may be adjusted pursuant to Sections D and E of this RMA, or if Parcels within the CFD prepay all or a portion of the Special Tax obligation. Final Bond Sale means the last series of Bonds that will be issued on behalf of Improvement Area No. 1 (excluding any Bond refundings), as determined by the City. Final Map means a final map, or portion thereof, recorded by the County pursuant to the Subdivision Map Act (California Government Code Section et seq.) that creates lots which do not need to be further subdivided prior to issuance of a building permit for a residential structure. The term Final Map shall not include any Assessor s Parcel map or subdivision map, or portion thereof, that does not create lots that are in their final configuration, including Assessor s Parcels that are designated as remainder parcels. Fiscal Year means the period starting July 1 and ending on the following June 30. Future Annexation Area means that geographic area that, at the time of CFD Formation, was considered potential annexation area for the CFD and which was, therefore, identified as future annexation area on the recorded CFD boundary map. Such designation does not mean that any or all of the Future Annexation Area will annex into Improvement Area No. 1, but should property designated as Future Annexation Area choose to annex, the annexation may be processed pursuant to the streamlined annexation procedures provided in the Act. Homeowners Association means the homeowners association, including any master or subassociation, that provides services to, and collects dues, fees, or charges from, property within Improvement Area No. 1. Homeowners Association Property means any property within the boundaries of Improvement Area No. 1 that is owned in fee or by easement by the Homeowners Association, not including any such property that is located directly under a residential structure. Improvement Area No. 1 means Improvement Area No. 1 of the City of Dublin Community Facilities District No (Dublin Crossing). CFD No IA No. 1 3 May 6, 2015
84 Indenture means the bond indenture, fiscal agent agreement, trust agreement, resolution or other instrument pursuant to which Bonds are issued, as modified, amended, and/or supplemented from time to time, and any instrument replacing or supplementing the same. Land Use Change means a proposed or approved change to the Expected Land Uses within Improvement Area No. 1 after CFD Formation. Maximum Special Tax means the greatest amount of Special Tax that can be levied on an Assessor s Parcel in any Fiscal Year determined in accordance with Section C below. Maximum Special Tax Revenue means the aggregate Maximum Special Tax that can be levied on all Parcels of Taxable Property within Improvement Area No. 1 in any given Fiscal Year. Multi-Family Property means, in any Fiscal Year, all Parcels for which a Building Permit was issued for construction of a residential structure consisting of two or more Residential Units that share common walls. Net Expected Maximum Special Tax Revenues means the Expected Maximum Special Tax Revenues less the Special Tax Buffer. Non-Residential Property means, in any Fiscal Year, all Parcels of Developed Property within the boundaries of Improvement Area No. 1 that are not Single Family Detached Property, Homeowner Association Property, Multi-Family Property, or Public Property, as defined herein. Proportionately means, for Developed Property, that the ratio of the actual Special Tax levied in any Fiscal Year to the Maximum Special Tax authorized to be levied in that Fiscal Year is equal for all Parcels of Developed Property. For Undeveloped Property, Proportionately means that the ratio of the actual Special Tax levied to the Maximum Special Tax authorized to be levied is equal for all Parcels of Undeveloped Property. For Taxable Non-Residential Property, Proportionately means that the ratio of the actual Special Tax levied to the Maximum Special Tax is equal for all Parcels of Taxable Non-Residential Property. For Taxable Homeowners Association Property, Proportionately means that the ratio of the actual Special Tax levied to the Maximum Special Tax is equal for all Parcels of Taxable Homeowners Association Property. For Taxable Public Property, Proportionately means that the ratio of the actual Special Tax levied to the Maximum Special Tax is equal for all Parcels of Taxable Public Property. Public Property means any property within the boundaries of Improvement Area No. 1 that is owned by the federal government, State of California or other local governments or public agencies. Required Coverage means the amount by which the Maximum Special Tax Revenues must exceed the Bond debt service and required Administrative Expenses, as set forth in the Indenture, Certificate of Special Tax Consultant, or other formation or bond document that sets forth the minimum required debt service coverage. CFD No IA No. 1 4 May 6, 2015
85 Residential Unit means, for Single Family Detached Property, an individual single-family detached unit, and, for Multi-Family Property, an individual residential unit within a duplex, halfplex, triplex, fourplex, townhome, live/work or condominium structure, or apartment building. RMA means this Rate and Method of Apportionment of Special Tax for Improvement Area No. 1. Single Family Detached Property means, in any Fiscal Year, all Parcels for which a Building Permit was issued for construction of a Residential Unit that does not share a common wall with another Residential Unit. Special Tax means a Special Tax levied in any Fiscal Year to pay the Special Tax Requirement. Special Tax Buffer means a portion of the Maximum Special Tax Revenues that shall not be used to size Bonds to avoid reducing debt service coverage on the Bonds to an amount less than the Required Coverage. Prior to the Buffer Release, the Special Tax Buffer shall be subtracted from the Maximum Special Tax Revenues in order to size the issuance of Bonds. The Special Tax Buffer for Fiscal Year is $60,535, which amount shall be (i) escalated each Fiscal Year by an amount equal to 2.0% of the amount in effect in the prior Fiscal Year, (ii) adjusted if there are changes to the Expected Land Uses, as set forth in Sections D and E, that result in an adjustment to the Expected Maximum Special Tax Revenues with the adjusted Special Tax Buffer being equal to 4.0% of the new Expected Maximum Special Tax Revenues, and (iii) reduced if and when the Administrator determines that Building Permits issued within Improvement Area No. 1 will result in more Residential Units within the smaller Square Footage Categories when compared to the Expected Land Uses. Each time additional Building Permits are issued, the Administrator shall compare the Building Permits issued to the Expected Land Uses and determine if there is a reduction in the Expected Maximum Special Tax Revenues. Any such reduction shall be subtracted from the Special Tax Buffer, and the reduced Special Tax Buffer shall, in the next Fiscal Year and each Fiscal Year thereafter, be escalated by two percent (2%) of the amount in effect in the prior Fiscal Year. Special Tax Requirement means the amount necessary in any Fiscal Year (i) to pay principal and interest on Bonds which are due in the calendar year which begins in such Fiscal Year, (ii) to create and/or replenish reserve funds for the Bonds to the extent such replenishment has not been included in the computation of Special Tax Requirement in a previous Fiscal Year, (iii) to cure any delinquencies in the payment of principal or interest on Bonds which have occurred in the prior Fiscal Year, (iv) to pay Administrative Expenses, and (v) to pay the costs of Authorized Facilities so long as the direct payment for Authorized Facilities does not increase the Special Taxes on Undeveloped Property. The Special Tax Requirement may be reduced in any Fiscal Year by (i) interest earnings on or surplus balances in funds and accounts for the Bonds to the extent that such earnings or balances are available to apply against debt service pursuant to the Indenture or other legal document that sets forth these terms, (ii) proceeds from CFD No IA No. 1 5 May 6, 2015
86 the collection of penalties associated with delinquent Special Taxes, and (iii) any other revenues available to pay debt service on the Bonds as determined by the Administrator. Square Foot or Square Footage means the square footage of a Residential Unit reflected on a Building Permit, condominium plan, site plan, or other such document. If the Square Footage shown on a site plan or condominium plan is inconsistent with the Square Footage reflected on the Building Permit issued for construction of the Residential Unit, the Square Footage from the Building Permit shall be used to determine the appropriate Square Footage Category for the Residential Unit. Square Footage Category means one of the six different categories of Single Family Detached Property and Multi-Family Property set forth in Section C below. Taxable Homeowners Association Property means, in any Fiscal Year, all Parcels of Homeowners Association Property that are not exempt pursuant to Section H below. Taxable Non-Residential Property means, in any Fiscal Year, all Parcels of Non-Residential Property that are not exempt pursuant to Section H below. Taxable Property means all of the Assessor s Parcels within the boundaries of Improvement Area No. 1 which are not exempt from the Special Tax pursuant to law or Section H below. Taxable Public Property means, in any Fiscal Year, all Parcels of Public Property that are not exempt pursuant to Section H below. Undeveloped Property means, in any Fiscal Year, all Parcels of Taxable Property that are not Developed Property. B. DATA FOR ADMINISTRATION OF SPECIAL TAX Each Fiscal Year, the Administrator shall (i) categorize each Parcel of Taxable Property as Developed Property or Undeveloped Property, (ii) categorize each Parcel of Developed Property as Single Family Detached Property, Multi-Family Property, or Taxable Non-Residential Property, and (iii) determine if there is any Taxable Homeowners Association Property or Taxable Public Property. For Multi-Family Property, the number of Residential Units shall be determined by referencing the condominium plan, apartment plan, site plan or other development plan. In addition, the Administrator shall, on an ongoing basis, track the current balance of the Special Tax Buffer and determine whether the Buffer Release can take place. In any Fiscal Year, if it is determined that: (i) a parcel map for property in Improvement Area No. 1 was recorded after January 1 of the prior Fiscal Year (or any other date after which the Assessor will not incorporate the newly-created Parcels into the then current tax roll), (ii) because of the date the parcel map was recorded, the Assessor does not yet recognize the new Parcels created by the parcel map, and (iii) one or more of the newly-created parcels is in a different Development Class than other parcels created by the subdivision, the Administrator CFD No IA No. 1 6 May 6, 2015
87 shall calculate the Special Tax for the property affected by recordation of the parcel map by determining the Special Tax that applies separately to the property within each Development Class, then applying the sum of the individual Special Taxes to the Parcel that was subdivided by recordation of the parcel map. C. MAXIMUM SPECIAL TAX 1. Developed Property The following maximum Special Tax rates shall apply to all Parcels of Developed Property within Improvement Area No. 1 for each Fiscal Year in which the Special Tax is levied and collected: Land Use Single Family Detached Property Single Family Detached Property Single Family Detached Property Multi-Family Property Multi-Family Property Multi-Family Property TABLE 1 Developed Property Fiscal Year Maximum Special Taxes * Square Footage Category Residential Units greater than 2,300 Square Feet Residential Units 2,100 to 2,300 Square Feet Residential Units less than 2,100 Square Feet Residential Units greater than 1,800 Square Feet Residential Units 1,600 to 1,800 Square Feet Residential Units Less than 1,600 Square Feet Maximum Special Tax (Fiscal Year )* $4,878 per Residential Unit $4,528 per Residential Unit $4,174 per Residential Unit $4,087 per Residential Unit $3,685 per Residential Unit $3,273 per Residential Unit *On July 1, 2016 and on each July 1 thereafter, the Maximum Special Taxes shown in Table 1 shall be increased by an amount equal to 2.0% of the amount in effect for the prior Fiscal Year. CFD No IA No. 1 7 May 6, 2015
88 Once a Special Tax has been levied on a Parcel of Developed Property, the Maximum Special Tax applicable to that Parcel shall not be reduced in future Fiscal Years because of changes in land use on the Parcel. Notwithstanding the foregoing, the actual Special Tax levied on a Parcel of Developed Property in any Fiscal Year may be less than the Maximum Special Tax if the Special Tax Requirement does not require the levy of the Maximum Special Tax pursuant to Section F below. 2. Taxable Non-Residential Property, Taxable Homeowners Association Property and Taxable Public Property The Maximum Special Tax for Parcels of Taxable Non-Residential Property, Taxable Homeowners Association Property and Taxable Public Property in Fiscal Year is $269,300 per Acre, which shall be increased on July 1, 2016 and on each July 1 thereafter by an amount equal to 2.0% of the amount in effect for the prior Fiscal Year. 3. Undeveloped Property The Maximum Special Tax for Parcels of Undeveloped Property in Fiscal Year is $269,300 per Acre, which shall be increased on July 1, 2016 and on each July 1 thereafter by an amount equal to 2.0% of the amount in effect for the prior Fiscal Year. D. LAND USE CHANGES The Expected Maximum Special Tax Revenues for Improvement Area No. 1, which is shown in Attachment 1, was calculated based on the Expected Land Uses at CFD Formation. As set forth in Section E herein, Attachment 1 shall be modified to reflect the Expected Land Uses and Expected Maximum Special Tax Revenues for Improvement Area No. 1 if property is annexed to Improvement Area No. 1. Attachment 1 is also subject to modification upon the occurrence of Land Use Changes, as described below. The Administrator shall review all Land Use Changes within Improvement Area No. 1 and compare the revised land uses to the Expected Land Uses to evaluate the impact on the Expected Maximum Special Tax Revenues. If, prior to the first Bond sale, a Land Use Change is proposed that will result in a reduction in the Expected Maximum Special Tax Revenues, no action will be needed pursuant to this Section D. Upon approval of the Land Use Change, the Administrator shall update Attachment 1 to show the reduced Net Expected Maximum Special Tax Revenues, which shall then be the amount used to size Bond sales. If, after the first Bond sale, a Land Use Change is proposed that will result in a reduction in the Expected Maximum Special Tax Revenues, no action will be needed pursuant to this Section D as long as the reduction in Net Expected Maximum Special Tax Revenues does not reduce debt service coverage on outstanding Bonds below the Required Coverage. Upon approval of the Land Use Change, the Administrator shall update Attachment 1 to show the reduced Net Expected Maximum Special Tax Revenues, which shall then be the amount used to size future bond sales. CFD No IA No. 1 8 May 6, 2015
89 If, after the first Bond sale, the Administrator determines that a proposed Land Use Change would reduce debt service coverage on outstanding Bonds below the Required Coverage, a prepayment must be made by the landowner requesting the Land Use Change in an amount sufficient to retire Bonds in the amount necessary to maintain the Required Coverage. E. ANNEXATIONS If, in any Fiscal Year, a property owner within the Future Annexation Area wants to annex property into Improvement Area No. 1, the Administrator shall apply the following steps as part of the annexation proceedings: Step 1. Working with City staff and the landowner, the Administrator shall determine the number of Residential Units within each Square Footage Category that are expected to be built within the area to be annexed. Step 2. The Administrator shall prepare and keep on file an updated Attachment 1 that adds the annexed property and identifies the revised Expected Land Uses, Expected Maximum Special Tax Revenues, and Special Tax Buffer for Improvement Area No. 1. After the annexation is complete, the application of Sections D, F and I of this RMA shall be based on the adjusted Expected Land Uses and Expected Maximum Special Tax Revenues including the newly annexed property. Step 3. The Administrator shall ensure that a Notice of Special Tax Lien is recorded against all Parcels that are annexed to the CFD. Step 4. The Administrator shall recalculate the Public Facilities Requirement used in the prepayment calculation in Section I below to include the estimated net proceeds that can be generated to fund Authorized Facilities based on the Maximum Special Tax capacity from the annexed area. The adjusted Public Facilities Requirement shall be calculated by (i) dividing the increased Expected Maximum Special Tax Revenues that can be collected after the annexation by the Expected Maximum Special Tax Revenues that were in place prior to the annexation, and (ii) multiplying the quotient by the Public Facilities Requirement that was in place prior to the annexation. Step 5. The Administrator shall increase the acreage of exempt Public Property and exempt Homeowners Association Property to include such acreage as estimated in the area that was annexed. F. METHOD OF LEVY OF THE SPECIAL TAX Each Fiscal Year, the Administrator shall determine the Special Tax Requirement to be collected in that Fiscal Year. A Special Tax shall then be levied according to the following steps: CFD No IA No. 1 9 May 6, 2015
90 Step 1. In all Fiscal Years prior to the earlier of (i) the funding of all the Authorized Facilities or (ii) the fifteenth Fiscal Year in which a Special Tax is levied on Parcels in Improvement Area No. 1, the Maximum Special Tax shall be levied on all Parcels of Developed Property. Pursuant to the flow of funds set forth in the Indenture, any Special Tax proceeds collected that are not needed to pay debt service on the Bonds, replenish reserves, or pay Administrative Expenses shall be used to pay directly for Authorized Facilities. After the Fiscal Year in which the earlier of the two dates set forth above occurs, the Special Tax shall be levied Proportionately on each Parcel of Developed Property, up to 100% of the Maximum Special Tax for each Parcel of Developed Property until the amount levied is equal to the Special Tax Requirement. Step 2. Step 3. Step 4. If additional revenue is needed after Step 1 to pay the Special Tax Requirement, the Special Tax shall be levied Proportionately on each Parcel of Undeveloped Property up to 100% of the Maximum Special Tax for each Parcel of Undeveloped Property. If additional revenue is needed after Step 2 to pay the Special Tax Requirement, the Special Tax shall be levied Proportionately on each Parcel of Taxable Homeowners Association Property up to 100% of the Maximum Special Tax for each Parcel of Taxable Homeowners Association Property. If additional revenue is needed after Step 3 to pay the Special Tax Requirement, the Special Tax shall be levied Proportionately on each Parcel of Taxable Public Property, up to 100% of the Maximum Special Tax for each Parcel of Taxable Public Property. G. MANNER OF COLLECTION OF SPECIAL TAXES The Special Tax shall be collected in the same manner and at the same time as ordinary ad valorem property taxes, provided, however, that prepayments are permitted as set forth in Section I below and provided further that the City may directly bill the Special Tax, may collect Special Taxes at a different time or in a different manner, and may collect delinquent Special Taxes through foreclosure or other available methods. The Special Tax shall be levied and collected until principal and interest on all Bonds have been repaid, costs of constructing or acquiring Authorized Facilities have been paid, and all Administrative Expenses have been paid or reimbursed. However, in no event shall Special Taxes be levied after Fiscal Year Under no circumstances may the Special Tax on a Parcel in residential use be increased in any Fiscal Year as a consequence of delinquency or default in payment of the Special Tax levied on another Parcel or Parcels by more than ten percent (10%) above the amount that would have been levied in that Fiscal Year had there never been any such delinquencies or defaults. CFD No IA No May 6, 2015
91 H. EXEMPTIONS Notwithstanding any other provision of this RMA, no Special Tax shall be levied on up to 1.91 Acres of Public Property and Acres of Homeowners Association Property in Improvement Area No. 1, which acreage amounts will be adjusted with each annexation of property into Improvement Area No. 1 as set forth in Section E above. Tax-exempt status will be assigned by the Administrator separately to Public Property and Homeowners Association Property in chronological order based on the date on which Parcels are transferred to a Public Agency or the Homeowners Association. As of CFD Formation, there was no Non-Residential Property expected within Improvement Area No. 1; therefore, all Non-Residential Property in Improvement Area No. 1 shall be Taxable Non-Residential Property for purposes of this RMA. I. PREPAYMENT OF SPECIAL TAX The following definitions apply to this Section I: Construction Fund means the account (regardless of its name) identified in the Indenture to hold funds which are currently available for expenditure to acquire or construct Authorized Facilities. Outstanding Bonds means all Previously Issued Bonds which remain outstanding, with the following exception: if a Special Tax has been levied against, or already paid by, an Assessor s Parcel making a prepayment, and a portion of the Special Tax will be used to pay a portion of the next principal payment on the Bonds that remain outstanding (as determined by the Administrator), that next principal payment shall be subtracted from the total Bond principal that remains outstanding, and the difference shall be used as the amount of Outstanding Bonds for purposes of this prepayment formula. Previously Issued Bonds means all Bonds that have been issued prior to the date of prepayment. Public Facilities Requirement means either $21.1 million in 2015 dollars, escalated two percent (2.0%) per year beginning July 1, 2016 and each July 1 thereafter, or such lower number as shall be determined by the City as sufficient to fund the Authorized Facilities. Remaining Facilities Costs means the Public Facilities Requirement minus public facility costs funded by Previously Issued Bonds or Special Taxes. 1. Full Prepayment The Special Tax obligation applicable to an Assessor s Parcel in Improvement Area No. 1 may be prepaid and the obligation of the Assessor s Parcel to pay the Special Tax permanently satisfied as described herein, provided that a prepayment may be made only if there are no CFD No IA No May 6, 2015
92 delinquent Special Taxes with respect to such Assessor s Parcel at the time of prepayment. An owner of an Assessor s Parcel intending to prepay the Special Tax obligation shall provide the City with written notice of intent to prepay. Within 30 days of receipt of such written notice, the City or its designee shall notify such owner of the prepayment amount for such Assessor s Parcel. Prepayment must be made not less than 75 days prior to any redemption date for Bonds to be redeemed with the proceeds of such prepaid Special Taxes. Under no circumstance shall a prepayment be allowed that would reduce debt service coverage below the Required Coverage. The Prepayment Amount shall be calculated as follows (capitalized terms as defined above or below): Bond Redemption Amount plus Remaining Facilities Amount plus Redemption Premium plus Defeasance Requirement plus Administrative Fees and Expenses less Reserve Fund Credit equals Prepayment Amount As of the proposed date of prepayment, the Prepayment Amount shall be determined by application of the following steps: Step 1. Step 2. Step 3. Step 4. Step 5. Step 6. Determine the greater of (i) the total Maximum Special Tax that could be collected from the Assessor s Parcel prepaying the Special Tax in the Fiscal Year in which prepayment would be received by the City, or (ii) the Maximum Special Tax that could be collected from the Parcel at buildout based on Expected Land Uses at the time the prepayment is calculated. Divide the Maximum Special Tax computed pursuant to Step 1 for such Assessor s Parcel by the lesser of (i) the Maximum Special Tax Revenue that could be collected in that Fiscal Year from property in Improvement Area No. 1, or (ii) the Maximum Special Tax revenues that could be generated at buildout of property in Improvement Area No. 1 based on the Expected Land Uses at the time the prepayment is calculated. Multiply the quotient computed pursuant to Step 2 by the Outstanding Bonds to compute the amount of Outstanding Bonds to be retired and prepaid (the Bond Redemption Amount ). Compute the current Remaining Facilities Costs (if any). Multiply the quotient computed pursuant to Step 2 by the amount determined pursuant to Step 4 to compute the amount of Remaining Facilities Costs to be prepaid (the Remaining Facilities Amount ). Multiply the Bond Redemption Amount computed pursuant to Step 3 by the applicable redemption premium, if any, on the Outstanding Bonds to be redeemed (the Redemption Premium ). CFD No IA No May 6, 2015
93 Step 7. Step 8. Step 9. Step 10. Step 11. Step 12. Compute the amount needed to pay interest on the Bond Redemption Amount starting with the last Bond interest payment date on which interest has been or will be paid by Special Taxes already levied until the earliest redemption date for the Outstanding Bonds. If Bonds are callable at or prior to the last Bond interest payment date on which interest has been or will be paid by Special Taxes already levied, Steps 7, 8 and 9 of this prepayment formula will not apply. Compute the amount of interest the City reasonably expects to derive from reinvestment of the Bond Redemption Amount plus the Redemption Premium from the first Bond interest payment date after which the prepayment has been received until the redemption date for the Outstanding Bonds. Subtract the amount computed pursuant to Step 8 from the amount computed pursuant to Step 7 (the Defeasance Requirement ). The administrative fees and expenses associated with the prepayment will be determined by the Administrator and include the costs of computing the prepayment, redeeming Bonds and recording any notices to evidence the prepayment and the redemption (the Administrative Fees and Expenses ). If, at the time the prepayment is calculated, the reserve fund is greater than or equal to the reserve requirement, and to the extent so provided in the Indenture, a reserve fund credit shall be calculated as a reduction in the applicable reserve fund for the Outstanding Bonds to be redeemed pursuant to the prepayment (the Reserve Fund Credit ). The Special Tax prepayment is equal to the sum of the amounts computed pursuant to Steps 3, 5, 6, 9, and 10, less the amount computed pursuant to Step 11 (the Prepayment Amount ). Step 13. From the Prepayment Amount, the amounts computed pursuant to Steps 3, 6, and 9 shall be deposited into the appropriate fund as established under the Indenture and be used to retire Outstanding Bonds or make debt service payments. The amount computed pursuant to Step 5 shall be deposited into the Construction Fund. The amount computed pursuant to Step 10 shall be retained in the account or fund that is established to pay Administrative Expenses of Improvement Area No. 1. Once a full prepayment has been received, a Notice of Cancellation of Special Tax Lien shall be recorded against the Parcel. However, a Notice of Cancellation of Special Tax Lien shall not be recorded until all Special Taxes levied on the Parcel in the current or prior Fiscal Years have been collected. CFD No IA No May 6, 2015
94 2. Partial Prepayment A partial prepayment may be made in an amount equal to any percentage of full prepayment desired by the party making a partial prepayment, except that the full amount of Administrative Fees and Expenses determined in Step 10 shall be included in the partial prepayment. The Maximum Special Tax that can be levied on a Parcel after a partial prepayment is made shall be determined as follows: Step 1. Step 2. Step 3. Step 4. Calculate the full prepayment (not including the amount collected for Administrative Fees and Expenses) that would be due from the Parcel if the entire Special Tax obligation were being prepaid pursuant to Section I.1 above. Divide the partial prepayment amount for the Parcel (not including the amount collected for Administrative Fees and Expenses) by the amount computed in Step 1 to determine a percentage. Subtract the percentage computed in Step 2 from 100% to determine the Remaining Percentage. Multiply the Remaining Percentage from Step 3 by the Maximum Special Tax for the Parcel to determine the new Maximum Special Tax that will be in effect for the Parcel after the partial prepayment is applied. When a partial prepayment is received, the proceeds shall be deposited as follows: The amount computed pursuant to Step 10 in Section I.1 shall be deposited into the account or fund that is established to pay Administrative Expenses of Improvement Area No. 1. The sum of the amounts computed pursuant to Steps 3, 6, and 9 in Section I.1 shall be multiplied by the percentage determined in Step 2 of this Section I.2, and the product shall be the amount deposited into the appropriate fund established under the Indenture to be used to retire Outstanding Bonds or make debt service payments. The amount computed pursuant to Step 5 in Section I.1 shall be multiplied by the percentage determined in Step 2 of this Section I.2, and the product shall be the amount deposited into the Construction Fund. Once a partial prepayment has been received, an Amendment to Special Tax Lien shall be recorded against the Parcel. However, an Amendment to Special Tax Lien shall not be recorded until all Special Taxes levied on the Parcel in the current or prior Fiscal Years have been collected. CFD No IA No May 6, 2015
95 J. INTERPRETATION OF SPECIAL TAX FORMULA The City reserves the right to make minor administrative and technical changes to this document that do not materially affect the rate and method of apportioning Special Taxes. In addition, the interpretation and application of any section of this document shall be left to the City s discretion. Interpretations may be made by the City by ordinance or resolution for purposes of clarifying any vagueness or ambiguity in this RMA. CFD No IA No May 6, 2015
96 ATTACHMENT 1 Improvement Area No. 1 City of Dublin Community Facilities District No (Dublin Crossing) Expected Land Uses and Expected Maximum Special Tax Revenue Land Use Single Family Detached Property Single Family Detached Property Single Family Detached Property Multi-Family Property Multi-Family Property Multi-Family Property Square Footage Category Residential Units greater than 2,300 Square Feet Residential Units 2,100 to 2,300 Square Feet Residential Units less than 2,100 Square Feet Residential Units greater than 1,800 Square Feet Residential Units 1,600 to 1,800 Square Feet Residential Units less than 1,600 Square Feet Expected Number of Units Maximum Special Tax per Unit FY [1] $4,878 per Residential Unit $4,528 per Residential Unit $4,174 per Residential Unit $4,087 per Residential Unit $3,685 per Residential Unit $3,273 per Residential Unit Expected Maximum Special Tax Revenue [1] $131,706 $131,312 $112,698 $412,787 $394,295 $330,573 Expected Maximum Special Tax Revenues at CFD Formation (FY $) $1,513,371 Less: Special Tax Buffer ( $) (4% of Expected Max Special Tax Revenues) ($60,535) Net Special Tax Revenues Available for Bond Sizing ( $) $1,452,836 [1]: On July 1, 2016 and each July 1 thereafter, all dollar amounts shown above shall be increased by two percent (2%) of the amount in effect in the previous Fiscal Year.
97 APPENDIX B THE APPRAISAL B-1
98 (THIS PAGE INTENTIONALLY LEFT BLANK)
99 Appraisal Report City of Dublin Community Facilities District No (Dublin Crossing) Improvement Area No. 1 (Phases 1A & 1B) Dublin, California Date of Report: June 14, 2017 Prepared For: Mr. Christopher L. Foss, City Manager City of Dublin 100 Civic Plaza Dublin, California Prepared By: Kevin K. Ziegenmeyer, MAI Eric A. Segal, MAI Sara A. Gilbertson, Appraiser
100 June 14, 2017 Mr. Christopher L. Foss, City Manager City of Dublin 100 Civic Plaza Dublin, California RE: City of Dublin Community Facilities District No (Dublin Crossing) Improvement Area No. 1 (Phases 1A & 1B) City of Dublin, California Dear Mr. Foss: At your request and authorization, Seevers Jordan Ziegenmeyer has prepared an appraisal report for the purpose of estimating the market value (fee simple estate) of the taxable properties within the boundaries of Improvement Area No. 1 of the City of Dublin Community Facilities District No (Dublin Crossing) (the CFD ), under the conditions and assumptions set forth in the attached report. The appraisal report has been conducted in accordance with appraisal standards and guidelines found in the Uniform Standards of Professional Appraisal Practice (USPAP) and the Appraisal Standards for Land Secured Financing published by the California Debt and Investment Advisory Commission (2004). This document is an Appraisal Report, which is intended to comply with the reporting requirements set forth under Standards Rule 2-2(a) of the edition of USPAP. The appraised properties represent the taxable land areas in Improvement Area No. 1 of the CFD, a portion of the Dublin Crossing master planned community ( Dublin Crossing. More specifically, the appraised properties consist of 453 residential units (129 detached and 324 attached) held by one master developer and two separate merchant builders. Any properties within the boundaries of the CFD outside of Improvement Area No. 1 and any property within Improvement Area No. 1 that is not subject to the Lien of the Special Tax securing the Bonds (e.g., public and quasi-public land use sites) are not a part of this appraisal. Dublin Crossing is generally located at the northwest quadrant of Dublin Boulevard and Arnold Road; Phases 1A and 1B are noncontiguous with Phase 1A along the north line of Dublin Boulevard between Fernandez Street and Keppler Street and Phase 1B along the west line of Arnold Road and the south line of 6 th Street. We have been requested to provide a market value of the appraised properties by ownership, as well as a cumulative, or aggregate, value of the appraised properties within Improvement Area No. 1 of the CFD, under the assumptions and conditions cited in the attached report. The value estimates assume a transfer would reflect a cash transaction or terms that are considered to be equivalent to cash. The estimates are also premised on an assumed sale after reasonable exposure in a competitive market under all conditions requisite to a fair sale, with buyer and seller each acting prudently, knowledgeably, for their own self-interest and assuming neither is under duress Atherton Road, Suite 500 Rocklin, CA Phone: Fax:
101 Mr. Christopher L. Foss June 14, 2017 Page 2 The market value of the appraised properties, by ownership, as well as the cumulative, or aggregate, value, are subject to the hypothetical condition various public improvements to be financed by the City of Dublin CFD No (Dublin Crossing) Improvement Area No. 1 Bonds (the Bonds )have been paid. The estimates of value also account for the impact of the Lien of the Special Tax securing the Bonds. As a result of our analysis, it is our opinion the market values of the fee simple interest in the appraised properties, subject to the hypothetical condition various public improvements to be financed by the Bonds are in place, in accordance with the assumptions and conditions set forth in the attached document, as of the date of value (inspection), May 17, 2017, is presented in the table on the below: Property Owner No. of Conclusion of Type Units Value (Rd.) CalAtlantic Group, Inc. Phase 1A: Union Attached 62 $16,340,000 Phase 1A: Madison Attached 107 $30,950,000 Phase 1B: Sunset Detached 60 $28,200,000 Subtotal 229 $75,490,000 Brookfield Entities Phase 1A: Wilshire Attached 75 $22,660,000 Phase 1A: Huntington (A) Detached 45 $19,830,000 Phase 1B: Fillmore Attached 80 $25,340,000 Subtotal 200 $67,830,000 Dublin Crossing, LLC Phase 1A: Huntington (B) Detached 24 $9,890,000 Subtotal 24 $9,890,000 Aggregate (Cumulative) Value of Improvement Area No. 1 $153,210,000 Please note the aggregate value noted herein is not the market value of the appraised properties in bulk. As defined by The Dictionary of Real Estate Appraisal, an aggregate value is the total of multiple market value conclusions. For purposes of this report, market value is estimated by ownership. The appraisers certify this assignment was not based on a minimum, maximum, or specified value. We also certify the market data obtained during the appraisal process was impartially collected, considered and analyzed. Further, we have no past, present or anticipated future interest in the subject property. This letter must remain attached to the report, which contains 107 pages, plus related exhibits and Appendix, in order for the value opinion contained herein to be considered valid.
102 Mr. Christopher L. Foss June 14, 2017 Page 3 Thank you for the opportunity to work with your office on this assignment. Sincerely, Kevin Ziegenmeyer, MAI Eric A. Segal, MAI State Certification No.: AG State Certification No.: AG Expires: June 4, 2019 Expires: February 18, 2019 Sara A. Gilbertson, Appraiser State Certification No.: Expires: May 29, 2018 /dtn
103 TABLE OF CONTENTS Summary of Important Facts and Conclusions 1 Introduction Client, Intended User and Intended Use of the Appraisal 4 Type and Definition of Value 4 Appraisal Report Format 4 Property Rights Appraised 5 Dates of Inspection, Value and Report 5 Scope of Work 5 Extraordinary Assumptions and Hypothetical Conditions 8 General Assumptions and Limiting Conditions 9 Certification Statements 11 Subject Property Property History 14 Property Identification and Legal Data 19 Site Description 30 Subject Photographs 33 Market Area Alameda County 35 Neighborhood 40 Residential Market 44 Highest and Best Use Analysis 57 Valuation Analysis Approaches to Value 60 Market Valuation Residential Land 63 Land Residual Analysis 64 Sales Comparison Approach 80 Reconciliation of Improved (Finished) Lot Values 103 Market Valuation by Ownership 104 Summary and Conclusion 106 Exposure Time 107 Appendix A Glossary of Terms B Qualifications of Appraiser(s)
104 SUMMARY OF IMPORTANT FACTS AND CONCLUSIONS Property Name: The appraised properties represent the taxable land areas in Improvement Area No. 1 within the boundaries of the City of Dublin CFD No (Dublin Crossing). Specifically, the appraised properties consist of 453 residential units (129 detached and 324 attached) held by one master developer and two separate merchant builders. A summary of the appraised properties unit counts by ownership is provided in the table below. No. of Property Owner Neighborhood Type Units CalAtlantic Phase 1A: Union Attached 62 Phase 1A: Madison Attached 107 Phase 1B: Sunset Detached 60 Subtotal 229 Brookfield Entities Phase 1A: Wilshire Attached 75 Phase 1A: Huntington (A) Detached 45 Phase 1B: Fillmore Attached 80 Subtotal 200 Dublin Crossing, LLC Phase 1A: Huntington (B) Detached 24 Subtotal 24 Total Number of Units Appraised within Improvement Area No Property Location: Assessor s Parcel Numbers/Ownership: Dublin Crossing is generally located at the northwest quadrant of Dublin Boulevard and Arnold Road; Improvement Area No. 1, Phases 1A and 1B are noncontiguous, with Phase 1A along the north line of Dublin Boulevard between Fernandez Street and Keppler Street and Phase 1B along the west line of Arnold Road and the south line of 6 th Street. Improvement Area No. 1 (Phases 1A and 1B) of the Dublin Crossing development has undergone large lot line adjustments; whereby, the subject property is contained within assessor s parcel numbers though -5 and (portion of), which consists of approximately acres of land area. Final subdivision maps for parts of Phase 1A (Tract Map Nos. 8306, 8307 and 8308) have been recorded, but maps creating individual lots (units) for the 24 lots owned by Dublin Crossing, LLC and in Phase 1B have not yet been recorded; individual APNs have not yet been assigned. Property Type/Current Use: Zoning/Land Use: Partially improved residential lots with home construction underway The appraised properties are zoned Dublin Crossing Medium-High Density Residential (DC M-HDR), Seevers Jordan Ziegenmeyer 1
105 Dublin Crossing Medium Density Residential (DC MDR), and General Commercial/Dublin Crossing High Density Residential (GC/DC HDR). For a complete description of the governing zoning ordinances, please refer to the Property Identification and Legal Data section of this report. Flood Zone: The appraised properties are located in Flood Zone X areas determined to be outside of the 500-year floodplain and determined to be outside of the 1% and 0.2% annual chance floodplains. Earthquake Zone: Highest and Best Use: According to the Seismic Safety Commission, the subject site is located within Zone 4, which is considered to be the highest risk zone in California. There are only two zones in California: Zone 4, which is assigned to areas near major faults; and Zone 3, which is assigned to all other areas of more moderate seismic activity. In addition, the subject is located in a Fault-Rupture Hazard Zone (formerly referred to as an Alquist-Priolo Special Study Zone), as defined by Special Publication 42 (revised January 1994) of the California Department of Conservation, Division of Mines and Geology. Single-family residential development, as approved and proposed Date of Inspection: May 17, 2017 Effective Date of Value: May 17, 2017 Date of Report: June 14, 2017 Property Rights Appraised: Conclusions of Value: Fee simple estate As a result of our analysis, it is our opinion the market values of the fee simple interest in the appraised properties, subject to the hypothetical condition various public improvements to be financed by the Bonds are in place, in accordance with the assumptions and conditions set forth in the attached document, as of the date of value (inspection), May 17, 2017, is presented in the table on the following page. Seevers Jordan Ziegenmeyer 2
106 Property Owner No. of Conclusion of Type Units Value (Rd.) CalAtlantic Group, Inc. Phase 1A: Union Attached 62 $16,340,000 Phase 1A: Madison Attached 107 $30,950,000 Phase 1B: Sunset Detached 60 $28,200,000 Subtotal 229 $75,490,000 Brookfield Entities Phase 1A: Wilshire Attached 75 $22,660,000 Phase 1A: Huntington (A) Detached 45 $19,830,000 Phase 1B: Fillmore Attached 80 $25,340,000 Subtotal 200 $67,830,000 Dublin Crossing, LLC Phase 1A: Huntington (B) Detached 24 $9,890,000 Subtotal 24 $9,890,000 Aggregate (Cumulative) Value of Improvement Area No. 1 $153,210,000 Any properties within the appraised portion of Improvement Area No. 1 of the CFD not subject to the Lien of the Special Tax securing the Bonds (e.g., public and quasi-public land use sites), are not a part of this appraisal and, therefore, are not included in the table above. It s worth noting, vertical construction is underway in Phase 1A; however, no contributory value is assigned to these partially completed homes. Please note the aggregate value noted above is not the market value of the appraised properties in bulk. As defined by The Dictionary of Real Estate Appraisal, an aggregate value is the total of multiple market value conclusions. For purposes of this report, market value is estimated by ownership. The estimates of market value account for the impact of the Lien of the Special Taxes securing the Bonds. Seevers Jordan Ziegenmeyer 3
107 CLIENT, INTENDED USER AND INTENDED USE The client and intended user of the report is the City of Dublin and the associated Finance Team. The appraisal report is intended for use as an aid in bond underwriting. Seevers Jordan Ziegenmeyer authorizes the reproduction of this appraisal report for inclusion in the Preliminary Official Statement (POS) and Official Statement (OS) for the express purpose of marketing the Bonds. APPRAISAL REPORT FORMAT This document is an Appraisal Report, which is intended to comply with the reporting requirements set forth under Standards Rule 2-2(a) of the edition of the Uniform Standards of Professional Appraisal Practice (USPAP). TYPE AND DEFINITION OF VALUE The purpose of this appraisal is to estimate the market value, by ownership, and cumulative, or aggregate, value (fee simple estate) of the appraised (taxable) properties comprising Improvement Area No. 1 of the CFD, subject to the hypothetical condition various public improvements to be financed by the Bonds are in place. Market value and aggregate value are defined as follows: Market Value: The most probable price which a property should bring in a competitive and open market under all conditions requisite to a fair sale, the buyer and seller each acting prudently and knowledgeably, and assuming the price is not affected by undue stimulus. Implicit in this definition is the consummation of a sale as of a specified date and the passing of title from seller to buyer under conditions whereby: (1) Buyer and seller are typically motivated; (2) Both parties are well informed or well advised, and acting in what they consider their own best interests; (3) A reasonable time is allowed for exposure in the open market; (4) Payment is made in terms of cash in U.S. dollars or in terms of financial arrangements comparable thereto; and (5) The price represents the normal consideration for the property sold unaffected by special or creative financing or sales concessions granted by anyone associated with the sale. 1 Aggregate Value: The sum of the separate and distinct market value opinions for each of the units in a condominium, subdivision development, or portfolio of properties, as of the date of valuation. The aggregate of retail values does not represent the value of all the units as though sold together in a single transaction; it is simply the total of the individual market value conclusions. 2 1 Code of Federal Regulations, Title 12, Section (55 Federal Register 34696, Aug. 24, 1990; as amended at 57 Federal Register 12202, Apr. 9, 1992; 59 Federal Register 29499, June 7, 1994). 2 The Dictionary of Real Estate Appraisal, 6 th ed. (Chicago: Appraisal Institute, 2015), 6. Seevers Jordan Ziegenmeyer 4
108 PROPERTY RIGHTS APPRAISED The estimates of value derived in this report are for the fee simple estate. The definition of this real property interest is offered below. Fee Simple Estate: absolute ownership unencumbered by any other interest or estate, subject only to the limitations imposed by the governmental powers of taxation, eminent domain, police power, and escheat. 3 The rights appraised are also subject to the General and Extraordinary Assumptions and Limiting and Hypothetical Conditions contained in this report and to any exceptions, encroachments, easements and rights-of-way recorded. The value estimates account for the impact of the Lien of the Special Tax securing the Bonds. DATES OF INSPECTION, VALUE AND REPORT An inspection of the subject property was completed on May 17, 2017, which represents the effective date of market value of the appraised properties. This appraisal report was completed and assembled on June 14, SCOPE OF WORK This appraisal report has been prepared in accordance with the Uniform Standards of Professional Appraisal Practice (USPAP). This analysis is intended to be an appraisal assignment, as defined by USPAP; the intention is the appraisal service be performed in such a manner that the result of the analysis, opinions, or conclusion be that of a disinterested third party. Several legal and physical aspects of the subject property were researched and documented. A physical inspection of the property was completed and serves as the basis for the site description contained in this report. The sales history was provided by a representative of the master developer. Numerous documents were provided for the appraisal, including: project maps; phasing maps; lot plot maps; development budgets; and market study prepared by Robert Charles Lesser & Co. The zoning and entitlements, earthquake zone, flood zone and utilities were verified with applicable public agencies at the City of Dublin. Property tax information for the current tax year was obtained from the County of Alameda Treasurer-Tax Collector s Office. Data relating to the subject s neighborhood and surrounding market area were analyzed and documented. This information was obtained through personal inspections of portions of the neighborhood and market area; newspaper articles; real estate conferences; and interviews with 3 The Dictionary of Real Estate Appraisal, 90. Seevers Jordan Ziegenmeyer 5
109 various market participants, including property owners, property managers, brokers, developers and local government agencies. In this appraisal, the highest and best use of the subject property as though vacant and improved was determined based on the four standard tests (legal permissibility, physical possibility, financial feasibility and maximum productivity). The purpose of this appraisal assignment is to estimate the market value of the subject property, subject to a hypothetical condition certain public infrastructure, facilities and fees (if any) to be financed by CFD bonds are in place and available for use. It is not uncommon for appraisers to be asked to appraise properties at atypical times, relative to when market participants most often transfer properties. The market recognizes typical points during the development process when master planned projects often transfer, such as upon obtaining entitlements, completion of spinal infrastructure and/or recordation of final subdivision maps, for instance. In valuation assignments that involve value scenarios that do not coincide with the typical transaction points along the development timeline, the appraiser must apply market logic to the particular stage of the project. Since the subject is at one of these atypical points, we have employed market logic in the valuation of the subject in its hypothetical condition. The market value of the residential land, by lot size category, was estimated by employing the use of the sales comparison approach and a land residual analysis, or discounted cash flow analysis (DCF). In the sales comparison approach we analyzed comparable bulk lot sales from the region and adjusted the datum for attributes that varied from the subject s four land development categories. A land residual analysis was also utilized to estimate the market value of the subject lots, by lot size category. The land residual analyses are a discounted cash flow (DCF) analysis that considered home prices and costs for each lot size category, leading to an estimate of residual land value. A DCF analysis is a procedure in which a discount rate is applied to a projected revenue stream generated from the sale of individual components of a project. In this method of valuation, the appraiser specifies the quantity, variability, timing and duration of the revenue streams and discounts each to its present value at a specified yield rate. In the analysis described, the revenue component of the DCF was based on the market value for the proposed homes for each lot size category. A number of assumptions were made in the discounted cash flow analysis, not the least of which is the forecast of absorption, or disposition, of the homes comprising each lot size category. The lot values indicated by each approach were then reconciled into an opinion of market value for the subject s four land development categories as if in finished condition. The residential land comprising Phase 1A has, or will be, transferred to the merchant builders on a blue top lot basis, with the merchant builders obligated to complete remaining in-tract improvements; whereas, Phase 1B has transferred to the merchant builders as finished lots, with the Seevers Jordan Ziegenmeyer 6
110 master developer obligated to complete remaining infrastructure and in-tract development. Thus, the analysis herein derived estimates of market value for the various residential land components comprising Improvement Area No. 1 of the CFD, as if finished with all site development work complete. The deduction for remaining costs to complete (merchant builder obligations) was considered in the valuation by ownership section at the end of this Report. The estimates of market value provided herein are subject to the hypothetical condition various public improvements to be financed by the Bonds are in place. Therefore, for purposes of the analysis herein, it is presumed available construction fund proceeds from the sale of the Bonds will provide for the completion of infrastructure improvements and in-tract improvements obligated to be completed by the master developer (Dublin Crossing, LLC). In light of the fact all of the vested property owners have a specific number of lots/units within various land development categories that could sell in individual bulk transactions within 12 months of exposure, it is the appraisers opinion no further discounting is necessary when estimating value to each of the vested property owners. In light of the fact Phases 1A and 1B are under construction with site development, a deduction for remaining in-tract costs were considered. However, as of the date of inspection (value), a number of permits and impact fees associated with residential construction within Improvement Area No. 1 of the CFD have been paid. Specifically, CalAtlantic is under construction in the Union and Madison subdivisions within Phase 1A, and Brookfield is under construction within the Wilshire and Huntington subdivisions of Phase 1A and has paid permits and impact fees within the Fillmore subdivision in Phase 1B. The contributory value of the permits and impact fees paid were considered herein. The cumulative, or aggregate, value of the appraised properties represents the sum of the value estimates concluded for each ownership interest, which is not equivalent to the market value of the subject property of Improvement Area No. 1 of the CFD as a whole. This appraisal report has been conducted in accordance with appraisal standards and guidelines found in the Uniform Standards of Professional Appraisal Practice (USPAP) and the Appraisal Standards for Land Secured Financing published by the California Debt and Investment Advisory Commission (2004). The individuals involved in the preparation of this appraisal include Kevin K. Ziegenmeyer, MAI, Eric A. Segal, MAI, and Sara Gilbertson, Appraiser. Mr. Ziegenmeyer, Mr. Segal and Ms. Gilbertson inspected the subject property. Mr. Segal and Ms. Gilbertson also 1) reviewed the subject property information provided by the owner/developer, 2) collected and confirmed market data, 3) analyzed the market data and 4) prepared the report. Mr. Ziegenmeyer 1) provided professional input and direction and 2) made any necessary revisions and/or amplifications to the report. Seevers Jordan Ziegenmeyer 7
111 EXTRAORDINARY ASSUMPTIONS AND HYPOTHETICAL CONDITIONS It is noted the use of an extraordinary assumption or hypothetical condition can impact the results of an appraisal. Extraordinary Assumptions 1. It is assumed there are no adverse soil conditions, toxic substances or other environmental hazards that may interfere or inhibit the development of the subject properties. 2. The exact locations of the easements referenced in a preliminary title report were not provided to the appraiser. The appraiser is not a surveyor nor qualified to determine the exact location of the referenced easements. It is assumed the easements which would be noted in a preliminary title report do not have an impact on the opinions of value as provided in this report. If, at some future date, these easements are determined to have a detrimental impact on value, the appraiser reserves the right to amend the opinion(s) of value. The opinions of value presented in this report are predicated on none of the items referenced in the preliminary title report having a detrimental impact upon the utility of the property as proposed, nor the opinions of value. If, at some future date, these exceptions are determined to have a detrimental impact on value, the appraiser reserves the right to amend the opinion(s) of value. Hypothetical Conditions 1. We have been requested to estimate the market value of the appraised properties, by ownership, as well as the cumulative, or aggregate, value of Improvement Area No. 1 of the CFD as of the date of inspection (May 17, 2017), subject to the hypothetical condition various public improvements to be financed by the Bonds are in place and available for use. Seevers Jordan Ziegenmeyer 8
112 GENERAL ASSUMPTIONS AND LIMITING CONDITIONS 1. No responsibility is assumed for the legal description provided or for matters pertaining to legal or title considerations. Title to the property is assumed to be good and marketable unless otherwise stated. 2. No responsibility is assumed for matters of law or legal interpretation. 3. The property is appraised free and clear of any or all liens or encumbrances unless otherwise stated. 4. The information and data furnished by others in preparation of this report is believed to be reliable, but no warranty is given for its accuracy. 5. It is assumed there are no hidden or unapparent conditions of the property, subsoil, or structures that render it more or less valuable. No responsibility is assumed for such conditions or for obtaining the engineering studies that may be required to discover them. 6. It is assumed the property is in full compliance with all applicable federal, state, and local environmental regulations and laws unless the lack of compliance is stated, described, and considered in the appraisal report. 7. It is assumed the property conforms to all applicable zoning and use regulations and restrictions unless nonconformity has been identified, described and considered in the appraisal report. 8. It is assumed all required licenses, certificates of occupancy, consents, and other legislative or administrative authority from any local, state, or national government or private entity or organization have been or can be obtained or renewed for any use on which the value estimate contained in this report is based. 9. It is assumed the use of the land and improvements is confined within the boundaries or property lines of the property described and there is no encroachment or trespass unless noted in the report. 10. Unless otherwise stated in this report, the existence of hazardous materials, which may or may not be present on the property, was not observed by the appraiser. The appraiser has no knowledge of the existence of such materials on or in the property. The appraiser, however, is not qualified to detect such substances. The presence of substances such as asbestos, ureaformaldehyde foam insulation and other potentially hazardous materials may affect the value of the property. The value estimated is predicated on the assumption there is no such material on or in the property that would cause a loss in value. No responsibility is assumed for such conditions or for any expertise or engineering knowledge required to discover them. The intended user of this report is urged to retain an expert in this field, if desired. 11. The Americans with Disabilities Act (ADA) became effective January 26, We have not made a specific survey or analysis of this property to determine whether the physical aspects of the improvements meet the ADA accessibility guidelines. Since compliance matches each owner s financial ability with the cost-to cure the property s potential physical characteristics, the real estate appraiser cannot comment on compliance with ADA. A brief summary of the Seevers Jordan Ziegenmeyer 9
113 subject s physical aspects is included in this report. It in no way suggests ADA compliance by the current owner. Given that compliance can change with each owner s financial ability to cure non-accessibility, the value of the subject does not consider possible non-compliance. Specific study of both the owner s financial ability and the cost-to-cure any deficiencies would be needed for the Department of Justice to determine compliance. 12. The appraisal is to be considered in its entirety and use of only a portion thereof will render the appraisal invalid. 13. Possession of this report or a copy thereof does not carry with it the right of publication nor may it be used for any purpose by anyone other than the client without the previous written consent of Seevers Jordan Ziegenmeyer. 14. Neither all nor any part of the contents of this report (especially any conclusions as to value, the identity of the appraiser, or the firm with which the appraiser is connected) shall be disseminated to the public through advertising, public relations, news, sales, or any other media without the prior written consent and approval of Seevers Jordan Ziegenmeyer. Seevers Jordan Ziegenmeyer authorizes the reproduction of this report for publication in the preliminary official statement and official statement for Bond financing purposes. 15. Acceptance and/or use of the appraisal report constitutes acceptance of all assumptions and limiting conditions stated in this report. 16. An inspection of the subject properties revealed no apparent adverse easements, encroachments or other conditions, which currently impact the subject. However, the exact locations of typical roadway and utility easements, or any additional easements, which would be referenced in a preliminary title report, were not provided to the appraiser. The appraiser is not a surveyor nor qualified to determine the exact location of easements. It is assumed typical easements do not have an impact on the opinion (s) of value as provided in this report. If, at some future date, these easements are determined to have a detrimental impact on value, the appraiser reserves the right to amend the opinion (s) of value. 17. This appraisal report is prepared for the exclusive use of the appraiser s client. No third parties are authorized to rely upon this report without the express consent of the appraiser. Seevers Jordan Ziegenmeyer authorizes the reproduction of this report for publication in the preliminary official statement and official statement for Bond financing purposes. 18. The appraiser is not qualified to determine the existence of mold, the cause of mold, the type of mold or whether mold might pose any risk to the property or its inhabitants. Additional inspection by a qualified professional is recommended. Seevers Jordan Ziegenmeyer 10
114 CERTIFICATION STATEMENT I certify that, to the best of my knowledge and belief: The statements of fact contained in this report are true and correct. The reported analyses, opinions, and conclusions are limited only by the reported assumptions and limiting conditions and are my personal, impartial, and unbiased professional analyses, opinions, and conclusions. I have no present or prospective interest in the property that is the subject of this report and no personal interest with respect to the parties involved. I have not performed services, as an appraiser or in any other capacity, regarding the property that is the subject of this report within the three-year period immediately preceding acceptance of this assignment. I have no bias with respect to the property that is the subject of this report or to the parties involved with this assignment. My engagement in this assignment was not contingent upon developing or reporting predetermined results. My compensation for completing this assignment is not contingent upon the development or reporting of a predetermined value or direction in value that favors the cause of the client, the amount of the value opinion, the attainment of a stipulated result, or the occurrence of a subsequent event directly related to the intended use of this appraisal. My analyses, opinions, and conclusions were developed, and this report has been prepared, in conformity with the Uniform Standards of Professional Appraisal Practice. The reported analyses, opinions, and conclusions were developed, and this report has been prepared, in conformity with the Code of Professional Ethics and Standards of Professional Appraisal Practice of the Appraisal Institute. I have made an inspection of the property that is the subject of this report. Eric A. Segal, MAI, and Sara A. Gilbertson, Appraiser, provided significant real property appraisal assistance to the person signing this certification. The use of this report is subject to the requirements of the Appraisal Institute relating to review by its duly authorized representatives. I certify that my State of California real estate appraiser license has never been revoked, suspended, cancelled, or restricted. I have the knowledge and experience to complete this appraisal assignment. Please see the Qualifications of Appraiser(s) portion of the Addenda to this report for additional information. As of the date of this report, I have completed the continuing education program for Designated Members of the Appraisal Institute. Kevin K. Ziegenmeyer, MAI State Certification No.: AG (Expires June 4, 2019) June 14, 2017 DATE Seevers Jordan Ziegenmeyer 11
115 CERTIFICATION STATEMENT I certify that, to the best of my knowledge and belief: The statements of fact contained in this report are true and correct. The reported analyses, opinions, and conclusions are limited only by the reported assumptions and limiting conditions and are my personal, impartial, and unbiased professional analyses, opinions, and conclusions. I have no present or prospective interest in the property that is the subject of this report and no personal interest with respect to the parties involved. I have not performed appraisal services regarding a portion of the properties that are the subject of this report within the three-year period immediately preceding acceptance of this assignment. I have no bias with respect to the property that is the subject of this report or to the parties involved with this assignment. My engagement in this assignment was not contingent upon developing or reporting predetermined results. My compensation for completing this assignment is not contingent upon the development or reporting of a predetermined value or direction in value that favors the cause of the client, the amount of the value opinion, the attainment of a stipulated result, or the occurrence of a subsequent event directly related to the intended use of this appraisal. My analyses, opinions, and conclusions were developed, and this report has been prepared, in conformity with the Uniform Standards of Professional Appraisal Practice. The reported analyses, opinions, and conclusions were developed, and this report has been prepared, in conformity with the Code of Professional Ethics and Standards of Professional Appraisal Practice of the Appraisal Institute. I have made a personal inspection of the property that is the subject of this report. Sara A. Gilbertson, Appraiser, provided significant real property appraisal assistance to the person signing this certification. Kevin K. Ziegenmeyer, MAI reviewed this report. The use of this report is subject to the requirements of the Appraisal Institute relating to review by its duly authorized representatives. I certify that my State of California real estate appraiser license has never been revoked, suspended, cancelled, or restricted. I have the knowledge and experience to complete this appraisal assignment. Please see the Qualifications of Appraiser(s) portion of the Appendix to this report for additional information. As of the date of this report, I have completed the continuing education program for Designated Members of the Appraisal Institute. Eric A. Segal, MAI State Certification No.: AG (February 18, 2019) June 14, 2017 DATE Seevers Jordan Ziegenmeyer 12
116 CERTIFICATION STATEMENT I certify that, to the best of my knowledge and belief: The statements of fact contained in this report are true and correct. The reported analyses, opinions, and conclusions are limited only by the reported assumptions and limiting conditions and are my personal, impartial, and unbiased professional analyses, opinions, and conclusions. I have no present or prospective interest in the property that is the subject of this report and no personal interest with respect to the parties involved. I have not performed services, as an appraiser or in any other capacity, regarding the property that is the subject of this report within the three-year period immediately preceding acceptance of this assignment. I have no bias with respect to the property that is the subject of this report or to the parties involved with this assignment. My engagement in this assignment was not contingent upon developing or reporting predetermined results. My compensation for completing this assignment is not contingent upon the development or reporting of a predetermined value or direction in value that favors the cause of the client, the amount of the value opinion, the attainment of a stipulated result, or the occurrence of a subsequent event directly related to the intended use of this appraisal. My analyses, opinions, and conclusions were developed, and this report has been prepared, in conformity with the Uniform Standards of Professional Appraisal Practice. The reported analyses, opinions, and conclusions were developed, and this report has been prepared, in conformity with the Code of Professional Ethics and Standards of Professional Appraisal Practice of the Appraisal Institute. I have made an inspection of the property that is the subject of this report. Kevin K. Ziegenmeyer, MAI, and Eric A. Segal, MAI, reviewed this report. The use of this report is subject to the requirements of the Appraisal Institute relating to review by its duly authorized representatives. I certify that my State of California real estate appraiser license has never been revoked, suspended, cancelled, or restricted. I have the knowledge and experience to complete this appraisal assignment. Please see the Qualifications of Appraiser(s) portion of the Addenda to this report for additional information. As of the date of this report, I have completed the Standards and Ethics Education Requirements for Candidates of the Appraisal Institute. Sara A. Gilbertson, Appraiser State Certification No.: (May 29, 2018) June 14, 2017 DATE Seevers Jordan Ziegenmeyer 13
117 PROPERTY HISTORY Property History The appraised properties herein encompass Improvement Area No. 1 of the 189-acre Dublin Crossing Specific Plan area, which is centrally located in the City of Dublin and is bound by a network of streets; 5th and 6th street to the north on the active U.S. Army Camp Parks installation, Arnold Road to the east, Dublin Boulevard to the south and Scarlett Drive (with future extension) to the west. The Specific Plan area is located adjacent to the Iron Horse Regional Trail, and close to the Dublin/Pleasanton BART station, with the station entrance approximately one-third mile to the south of the project area boundary. The Specific Plan area is generally flat and a significant portion is undeveloped. Two seasonal drainage channels traverse the site, one north to south generally through the middle of the project site, and another along the eastern border, parallel to Arnold Street. Of the 189 acres, approximately 62 acres consists of developed land which is generally located in the western part of the Specific Plan area and includes approximately 20 structures and buildings which are currently used for U.S. Army operations, academic activities, administration, equipment storage, and maintenance. Most facilities are currently in use by the U.S. Army, with the exception of a NASA warehouse building that is deteriorated and has not been used for several years. The Specific Plan area is located adjacent to existing urban development. Camp Parks base housing and administrative buildings are located to the north. A complex of office buildings is located east of Arnold Road, along with a vacant parcel at the northeast corner of Dublin Boulevard and Arnold Road. South of Dublin Boulevard is a broad mix of land uses including multi-family residential and commercial. The entrance to the Dublin-Pleasanton BART station is located approximately one-third mile south of the Specific Plan boundary edge adjacent to Interstate 580. Medium-high density single-family residential, retail and industrial uses are located to the west. West of Interstate 680 is Downtown Dublin. In 2002, the US Army formally requested an amendment to the General Plan to change the land use designation on the project site from Public Lands to a combination of commercial retail, office space, residential, and open space uses. On April 15, 2003, the Dublin City Council authorized the commencement of a General Plan Amendment study to initiate a comprehensive General Plan Amendment and Specific Plan program over a 172-acre portion of the 2,485-acre Camp Parks area, an 8.5-acre NASA parcel, and (at a later date) an 8.7-acre Alameda County Surplus Property Authority (ACSPA) parcel. Seevers Jordan Ziegenmeyer 14
118 The General Plan Amendment study did not authorize a change in the land use designation on the property but permitted City Staff, in partnership with the U.S. Army, to engage the involvement of the community in several strategic visioning meetings. These meetings were used to create a cohesive vision for future development of the site. Based on the information provided from several community meetings, five conceptual land use plans, each illustrating different land use scenarios, were formulated. The City Council held a series of meetings in 2005 to review the five conceptual land use alternatives. Input from these meetings served as the basis for selecting a preferred land use plan for future development of the Project. In December 2007 the U.S. Army and NASA prepared a Notice of Availability to solicit a master developer for the Camp Parks Real Property Exchange Area. The Exchange Agreement provides the Army with an opportunity to construct new, and modernize existing, facilities through the provision of 172 acres of U.S. Army owned property (but excluding the NASA parcel and the 8.7-acre Alameda County Surplus Property Authority parcel), to a developer in exchange for Camp Parks facilities improvements. The Exchange Agreement is not a part of the Specific Plan but was necessary to facilitate acquisition of the property by the project developer. In October 2008, the Army announced the selection of a master developer (Dublin Crossing Venture LLC) for the Project, and in April 2011, the developer and the U.S. Army officially finalized the Exchange Agreement, authorizing the developer to commence the General Plan Amendment and Specific Plan process. The following table summarizes the entitlements for the currently taxable property of Improvement Area No. 1 of the CFD, as well as average home size and base pricing within each proposed product line as concluded in the Robert Charles Lesser & Co. Market Pricing and Absorption Analysis, dated April 28, No. of Average Base Price Neighborhood Type Description Units Home Size Average Average/SF Phase 1A Union Attached Motor Court Condos - High Density/10-Unit Bldgs 62 1,732 $707,000 $408 Madison Attached Townhomes 107 1,808 $725,000 $401 Wilshire Attached Motor Court Townhomes - 8-Unit Bldgs 75 1,979 $766,000 $387 Huntington (A) Detached 3-Story Alley Product - "Boomerang" 45 2,553 $1,032,000 $404 Huntington (B) Detached 3-Story Alley Product - "Boomerang" 24 2,552 $1,032,000 $404 Phase 1B Fillmore Attached Pepper Lane Townhomes 80 2,262 $834,000 $369 Sunset Detached 4-Pack 60 2,547 $1,031,000 $ ,120 $835,900 $394 According to an affiliate of the master developer, Phases 1A and 1B require additional site development (in-tract) costs to be completed. It is noted, Phase 1A sold to the merchant builders in blue top condition; whereby, the merchant builder is required to complete additional site Seevers Jordan Ziegenmeyer 15
119 development (in-tract) work to bring the lots to a finished condition. However, the master developer still has approximately $5,385,009, or approximately $17, per lot, in remaining site work to bring the 313 Phase 1A lots to a blue top condition. As for Phase 1B, these lots were sold to the merchant builders as finished lots. According to the master developer, remaining site development costs (including in-tracts) is $10,392,781, or approximately $74, per lot, for the 140 lots in Phase 1B. Sales History Dublin Crossing was, and is in part, owned by the United States Army. Pursuant to an exchange agreement dated March 4, 2011 between Dublin Crossing Venture LLC (the original developer) and the United States Army Corps of Engineers, the original developer and the U.S. Army agreed the original developer has the right to acquire approximately 172 acres comprising a large part of Dublin Crossing from the U.S. Army in phases, as certain facilities (located outside of Dublin Crossing) are constructed by the original developer and conveyed to the U.S. Army. When purchasing property from the original developer (Dublin Crossing Venture LLC), the master developer (Dublin Crossing, LLC) assumed all rights and obligations under the exchange agreement. The original developer and the master developer acquired portions (Phases 1 and 2) of the U.S. Army property. The property in Phases 3 through 5 remain owned by the U.S. Army, but subject to acquisition by the master developer pursuant to the exchange agreement. In addition to the exchange agreement, the original developer entered into an agreement dated January 11, 2013 (the NASA Agreement ) with the National Aeronautics and Space Administration (NASA) for the purchase of 8.5 acres of property located adjacent to the army property. When purchasing property from the original developer, the master developer assumed all rights and obligations under the NASA Agreement. On August 28, 2015, the master developer acquired the NASA property. In addition to the exchange agreement and the NASA Agreement, the original developer entered into an agreement with the City for the purchase of 8.7 acres of surplus County property (the ACSPA Property ). When purchasing property from the original developer, the master developer assumed all rights and obligations under the City agreement. On March 23, 2017, the master developer acquired the ACSPA Property. The army property, the NASA property, and the ACSPA property, collectively, comprise the property to be developed as the Dublin Crossing Project. All such property is subject to the Development Agreement, dated November 19, 2013, by and between the City and the original developer (the Development Agreement ). The Development Agreement allows for the construction of up to 1,995 residential units, up to 200,000 square feet of commercial uses, a 30 net Seevers Jordan Ziegenmeyer 16
120 acre community park, a 5 net acre neighborhood park, privately-owned open space, a 12 acre elementary school site, and associated infrastructure to serve the project area described in the Dublin Crossing Specific Plan, approved by the City in 2013 pursuant to Resolution No The Development Agreement may be amended from time to time. In 2015, the master developer acquired from the original developer certain property in the Dublin Crossing Project (including all of Phase 1A), as well as the rights to develop the remainder of the property in the Dublin Crossing Project. On August 28, 2015, the original developer assigned the Development Agreement to the master developer, and the master developer assumed all of the rights and obligations under the Development Agreement. The Exchange Agreement provides for the acquisition of the property in six phases, as follows: 1. Phase 1A: Phase 1A was acquired from the U.S. Army by the original developer and was sold by the original developer to the master developer on August 28, As consideration for the acquisition from the U.S. Army, the original developer constructed a facility known as the Access Control Point. 2. Phase 1B: Phase 1B was acquired from the U.S. Army by the master developer on October 19, As consideration for the acquisition from the U.S. Army, the master developer constructed various infrastructure roads and utilities for the U.S. Army. 3. Phase 2: Phase 2 was acquired from the U.S. Army by the master developer on March 17, As consideration for the acquisition from the U.S. Army, the master developer constructed area maintenance support facilities. 4. Phase 3: Phase 3 is anticipated to be acquired from the U.S. Army by the master developer in June, 2018 following the completion of a regional medical training site estimated to cost $17,122, Phase 4: Phase 4 is anticipated to be acquired from the U.S. Army by the master developer in December, 2017 following the completion of an army regional training center estimated to cost $10,284, Phase 5: Phase 5 is anticipated to be acquired from the U.S. Army by the master developer in June, 2018 following the completion of a logistical warehouse estimated to cost $11,115,000. The master developer (Dublin Crossing, LLC) is a consortium of two ownership entities: BrookCal Dublin LLC, a Delaware limited liability company ( BrookCal ); and SPIC Dublin LLC, a Seevers Jordan Ziegenmeyer 17
121 Delaware limited liability company ( SPIC ). As part of the development of Dublin Crossing, the master developer (Dublin Crossing, LLC) has entered into agreements with merchant builders affiliated with the two owners of the master developer. In particular, Dublin Crossing, LLC sold property to affiliates of BrookCal (Brookfield Bay Area Holdings LLC, Brookfield Wilshire LLC, and Brookfield Fillmore LLC) and to affiliates of SPIC (CalAtlantic Group, Inc.). The 24 lots in Improvement Area No. 1 (Phase 1A) still held under the ownership of Dublin Crossing, LLC (APN: ), the master developer, are to be sold to Brookfield Bay Area Holding LLC, a Delaware limited liability company, for development as part of the Huntington neighborhood. A summary of the transactions to Brookfield and CalAtlantic, merchant builders, are provided below: Property Merchant Sale No. of Price per Identification Builder Date Sale Price Lots Lot Dublin Crossing - Fillmore (portion of the subject property) Brookfield Dec-16 $21,753, $271,913 NWQ Dublin Boulevard and Arnold Road Fillmore, (attached) (improved) Dublin, Alameda County APN: (portion of) LLC Dublin Crossing - Sunset (portion of the subject property) CalAtlantic Dec-16 $21,554, $359,233 NWQ Dublin Boulevard and Arnold Road Group, Inc. (detached) (improved) Dublin, Alameda County APN: (portion of) Dublin Crossing - Union (portion of the subject property) CalAtlantic Sep-17 $12,256, $197,677 NWQ Dublin Boulevard and Arnold Road Group, Inc. (attached) (blue top) Dublin, Alameda County APN: through -5 (portion of) Dublin Crossing - Wilshire (portion of the subject property) Brookfield Sep-17 $16,348, $217,973 NWQ Dublin Boulevard and Arnold Road Wilshire, (attached) (blue top) Dublin, Alameda County APN: through -5 (portion of) LLC Dublin Crossing - Madison (portion of the subject property) CalAtlantic Sep-17 $24,739, $231,206 NWQ Dublin Boulevard and Arnold Road Group, Inc. (attached) (blue top) Dublin, Alameda County APN: through -5 (portion of) Dublin Crossing - Huntington (portion of the subject property) Brookfield Sep-17 $13,307, $295,711 NWQ Dublin Boulevard and Arnold Road Bay Area (detached) (blue top) Dublin, Alameda County APN: through -5 (portion of) Holdings, LLC Based on our analysis herein, it is determined these transactions are consistent with the market. To the best of our knowledge there have been no other sales of the subject property within the last three years and the subject is not currently being marketed for sale. Seevers Jordan Ziegenmeyer 18
122 PROPERTY IDENTIFICATION AND LEGAL DATA Location Dublin Crossing is generally located at the northwest quadrant of Dublin Boulevard and Arnold Road; Improvement Area No. 1, Phases 1A and 1B are noncontiguous, with Phase 1A along the north line of Dublin Boulevard between Fernandez Street and Keppler Street and Phase 1B along the west line of Arnold Road and the south line of 6 th Street. Assessor s Parcel Number/Ownership Improvement Area No. 1 (Phases 1A and 1B) of the Dublin Crossing development has undergone large lot line adjustments; whereby, the subject property is contained within County of Alemeda Assessor s parcel numbers (APNs) though -5 and (portion of), which consists of approximately acres of land area. Final subdivision maps for parts of Phase 1A (Tract Map Nos. 8306, 8307 and 8308) have been recorded, but maps creating individual lots (units) for the 24 lots owned by Dublin Crossing, LLC and in Phase 1B have not yet been recorded; individual APNs have not yet been assigned. Legal Description A legal description of the appraised properties, which would be contained in a preliminary title report, was not provided for use in this analysis. Assessment and Tax Information Ad Valorem Taxes The property tax system in California was amended in 1978 by Article XIII to the State Constitution, commonly referred to as Proposition 13. It provides for a limitation on ad valorem property taxes and for a procedure to establish the current taxable value of real property by reference to a base year value, which is then modified annually to reflect inflation (if any). Annual increases cannot exceed 2% per year. The base year was set at , or any year thereafter in which the property is substantially improved or changes ownership. When either of these two conditions occur, the property is to be reappraised at market value, which becomes the new base year assessed value. Proposition 13 also limits the maximum tax rate to 1% of the value of the property, exclusive of bonds and supplemental Seevers Jordan Ziegenmeyer 19
123 assessments. Bonded indebtedness approved prior to 1978 and any bonds subsequently approved by a two-thirds vote of the district, in which the property is located, can be added to the 1% tax rate. The existing ad valorem taxes are of nominal consequence in this appraisal, primarily due to the fact these taxes will be adjusted substantially as the remaining infrastructure and property improvements are completed and in consideration of the definition of market value employed in this appraisal, which assumes a sale of the appraised properties. The appraised properties are located in Tax Rate Area , which is subject to a tax rate of %. Special Taxes and Assessments As referenced, the appraised properties are located within the boundaries of Improvement Area No. 1 of the City of Dublin Community Facilities District No (Dublin Crossing). According to the Rate and Method of Apportionment, the annual special taxes applicable to the subject s facilities are as presented in the table below: Land Use Home Size Assigned Annual Special Tax Rate* Single Family Detached Property > 2,300 SF $4,878 per Residential Unit Single Family Detached Property 2,100-2,300 SF $4,528 per Residential Unit Single Family Detached Property < 2,100 SF $4,174 per Residential Unit Multi-Family Property > 1,800 SF $4,087 per Residential Unit Multi-Family Property ,800 SF $3,685 per Residential Unit Multi-Family Property < 1,600 SF $3,273 per Residential Unit * Fiscal Year ; On July 1, 2016 and each July 1 thereafter, all dollar amounts shown above shall be increased by two percent (2%) of the amount in effect in the previous Fiscal Year. General Plan Designation, Zoning and Entitlements The Dublin City Council approved the Dublin Crossing Specific Plan on November 5, 2013 Resolution No (FEIR certification) and Resolution No (adoption of specific plan), which is shown in the exhibit on the following page. Seevers Jordan Ziegenmeyer 20
. The project site is located north of Interstate 580 and Dublin Boulevard, on a portion of the 2,485-acre U.S.")
124 Source: Dublin Crossing Specific Plan Figure 1-2 (Specific Plan Aerial) The Dublin Crossing Specific Plan (Specific Plan) is a plan for the orderly development of approximately 189 acres in the City of Dublin (the City). The project site is located north of Interstate 580 and Dublin Boulevard, on a portion of the 2,485-acre U.S. Army Camp Park Reserve Forces Training Area (Camp Parks), which currently sits in the middle of the City of Dublin, leaving geographically large portions of the City to the east and to the west of the project site. The Specific Plan addresses the development of the proposed Dublin Crossing project (the Project) which is comprised of residential units, commercial uses, parks and open space, and an elementary school. Specifically, the Project includes a maximum of up to 1,995 residential units, up to 200,000 square feet (sf.) of commercial uses, a 30 net-acre Community Park, a five net-acre Neighborhood Park, and an elementary school site. The land use summary table is provided on the next page, followed by an illustrative site plan. Seevers Jordan Ziegenmeyer 21


125 Illustrative Site Plan Seevers Jordan Ziegenmeyer 22

126 Development of the Specific Plan area includes five development phases, with anticipated build-out occurring over a period of approximately 10 years in response to market demands, the acquisition of the property from the U.S. Army, and according to an orderly extension of roadways, infrastructure, public services, and utilities. Over the course of the five phases, park sites, private recreational facilities, the school site, and other amenities will be provided commensurate with the residential and commercial development pursuant to terms in the Project Development Agreement. The project phasing is described in greater detail below: The portion of the Dublin Crossing project considered the subject of this appraisal assignment herein encompass Improvement Area No. 1 (Phase 1), which include the following land uses: Land Use Density Purpose & Permitted Uses Dublin Crossing Medium-High Density Residential (DC M-HDR) units/acre DC Medium-High Density Residential (DC M-HDR) allows for a mix of attached and detached single-family and multi-family housing lot configurations at a density of 14.1 to 25 units/net acre. Medium-High Density Residential development provides a transition from the higher density apartments and condominiums along the project periphery to the DC Medium Density Residential land use district in the core of the Specific Plan area. Residential product types may include a variety of attached and detached housing types, including: Single-Family Conventional Home (Detached) Alley Loaded Home (Detached) Duet Home (Attached) Rowhouse (Attached) Green Court Home (Detached) Seevers Jordan Ziegenmeyer 23
127 Dublin Crossing Medium Density Residential (DC MDR) Motorcourt Home (Detached or Attached) Townhome (Attached) Multi-Family (Attached) 6-14 units/acre The DC Medium Density Residential (DC MDR) land use district allows a mix of residential lot configurations from conventional single-family small-lots including two-pack or zipper lots, to attached multi-family lots at a density of 6-14 units per net acre. General Commercial/ Dublin Crossing High Density Residential (GC/DC HDR) The maximum floor area ratio (FAR) of commercial uses in the district is 1.0 and the maximum density for residential development in the land use district is 20.1 to 60 units/net acre. Secondary dwelling units, accessory structures, and home occupations are permitted in the DC MDR land use district in accordance with the Zoning Ordinance. Residential product types may include a variety of attached and detached housing types, including: Single-Family Conventional Home (Detached) Alley Loaded Home (Detached) Duet Home (Attached) Rowhouse (Attached) Green Court Home (Detached) Motorcourt Home (Detached or Attached) Townhome (Attached) The purpose of this land use is to provide flexibility to accommodate future market conditions and City housing needs, a combination land use district is proposed for areas along Dublin Boulevard west of the Mixed Use land use district. Uses allowed in this district are commercial, mixed use, and residential. In combination with the Mixed Use land use district (which will contain a minimum of 75,000 square feet of commercial uses), the GC/DC HDR land use district can contain an additional 125,000 of commercial uses, up to a Specific Plan area total of 200,000 square feet. Seevers Jordan Ziegenmeyer 24

128 Flood Zone Source: FEMA Flood Zone: Map Panel: FEMA Flood Map Service The appraised properties are located in Flood Zone X areas determined to be outside of the 500-year floodplain and determined to be outside of the 1% and 0.2% annual chance floodplains C-0309G Panel Date: August 3, 2009 Flood Insurance: Not required Earthquake Zone According to the Seismic Safety Commission, the subject site is located within Zone 4, which is considered to be the highest risk zone in California. There are only two zones in California: Zone 4, which is assigned to areas near major faults; and Zone 3, which is assigned to all other areas of more moderate seismic activity. In addition, the subject is located in a Fault-Rupture Hazard Zone (formerly referred to as an Alquist-Priolo Special Study Zone), as defined by Special Publication 42 (revised January 1994) of the California Department of Conservation, Division of Mines and Geology. In general, a number of faults are located in the Southern California and throughout California; thus, the area is subject to severe ground shaking during earthquakes. Competitive sites face similar seismic risk. Seevers Jordan Ziegenmeyer 25
129 Conditions of Title A preliminary title report was not provided for this analysis. It is assumed there are no adverse conditions on title. The appraiser assumes no negative title restrictions and accepts no responsibility for matters pertaining to title. Easements An inspection of the subject property revealed no apparent adverse easements, encroachments or other conditions currently impacting the parcels. Please refer to a preliminary title report for information regarding potential easements, as the appraiser is not a surveyor nor qualified to determine the exact location of any easements. It is assumed that any easements noted in a preliminary title report do not have an impact on the opinion of value set forth in this report. If at some future date, any easements are determined to have a detrimental impact on value, the appraiser reserves the right to amend the opinion of value contained herein. Assessor s Parcel Maps The maps on the following pages identify the boundary of Improvement Area No. 1 of the City of Dublin Community Facilities District No (Dublin Crossing), as well as lot plot maps of each unit within Phases 1A and 1B prepared by Ruggeri-Jensen-Azar, dated February 13, Seevers Jordan Ziegenmeyer 26
130 Improvement Area No. 1 City of Dublin Community Facilities District No (Dublin Crossing) Boundary Map Seevers Jordan Ziegenmeyer 27

131 Improvement Area No. 1: Phase 1A Seevers Jordan Ziegenmeyer 28
132 Improvement Area No. 1: Phase 1B Seevers Jordan Ziegenmeyer 29
 (the CFD ), which encompasses a portion of the Dublin Crossing master planned community, is generally located at the northwest quadrant of Dublin Boulevard and Arnold Road,")
133 SITE DESCRIPTION Improvement Area No. 1 of the City of Dublin Community Facilities District No (Dublin Crossing) (the CFD ), which encompasses a portion of the Dublin Crossing master planned community, is generally located at the northwest quadrant of Dublin Boulevard and Arnold Road, within the City of Dublin, Alameda County, California, approximately 25 miles southeast of Oakland and the Bay Bridge. More specifically, the appraised properties, Phases 1A and 1B, are noncontiguous with Phase 1A along the north line of Dublin Boulevard between Fernandez Street and Keppler Street and Phase 1B along the west line of Arnold Road and the south line of 6 th Street. Improvement Area No. 1 of the CFD currently represents partially improved residential lots proposed for attached and detached development, which is currently under construction. The subject property is further discussed as follows. Size and Shape: Topography: Soil: Improvement Area No. 1 encompasses two noncontiguous development areas identified as Phases 1A and 1B. Phase 1A is irregular in shape and comprises 21.61± acres; Phase 1B is generally rectangular in shape and comprises 11.33± acres. Improvement Area No. 1 comprises a total of approximately 32.94± acres of land area. Generally level A soils study was not provided for this analysis. This appraisal assumes the soil and subsoil conditions are suitable for Seevers Jordan Ziegenmeyer 30
134 development based on the existing development plan being implemented. Adjacent Land Uses: North: East: South: West: Offsite Improvements: Access, Frontage, Visibility: Utilities: Hazardous Waste: Alameda County Jail and Federal Female Prison (FCI Dublin), as well as U.S. military land uses Office and residential development, as well as vacant parcels Residential and industrial development Residential and industrial development As of the date of inspection, all of the off-site improvements servicing Improvement Area No. 1 (Phases 1A and 1B) were in place. The subject has frontage, access and visibility from Dublin Boulevard and Arnold Road. Overall, the accessibility and visibility of the property is good. Public utilities, including electricity, gas, water, and telephone service, have been extended to the subject property and will be extended to the individual lots/units as in-tract improvements are completed. At the time of inspection, the appraiser did not observe the existence of hazardous material, which may or may not be present on the properties. The appraiser has no knowledge of the existence of such materials on the properties. However, the appraiser is not qualified to detect such substances. The presence of potentially hazardous materials could affect the value of the properties. The value estimates are predicated on the assumption that there is no such material on or in the properties that would cause a loss in value. No responsibility is assumed for any such conditions or for any expertise or engineering knowledge required to discover them. Functional Adequacy and Utility: The infrastructure of the master plan, from a conceptual standpoint, has three project entrances from Dublin Boulevard (Columbus Street, Sterling Street and Iron Horse Parkway). An additional entrance will be provided via Scarlet Drive on the west end of the development and two entrances via Arnold Road on the east end. An interior street system will serve all of the various components of development. Based upon this plan, overall functional utility is considered to be typical for similar redevelopment projects in the East Bay Area. Development Plan: The plan for approximately 32.94± acres, which encompasses Improvement Area No. 1, is to develop 453 residential units (129 detached and 324 attached). Seevers Jordan Ziegenmeyer 31


135 The map below summarizes the phasing of Dublin Crossing. Phase 1 (A and B) comprises Neighborhoods 1, 2, 3, 4, 5 and 6 in the map below. Infrastructure Development: Grading: Drainage: Backbone infrastructure improvements are currently underway. Mass grading of the project is complete. There are two seasonal drainage channels traverse the Dublin Crossing site, one north to south generally through the middle of the project site, and another along the eastern border, parallel to Arnold Street. Based on the development plan, a physical inspection of the appraised properties, and assuming typical grading and paving work will be completed, it is expected the appraised properties will have adequate drainage. Conclusion: Overall, the subject property is functional in terms of its size, topography, shape and overall location within the market area. There appears to be no unusual or restrictive physical limitations of the properties. The subject property is considered physically suitable for development. With an aggressive marketing campaign, the Dublin Crossing project should be competitive with other master planned communities in the city of Dublin and throughout the East Bay Area. Seevers Jordan Ziegenmeyer 32


136 SUBJECT PHOTOGRAPHS Dublin Crossing Phase 1A Dublin Crossing Phase 1A Dublin Crossing Phase 1A Dublin Crossing Phase 1A Dublin Crossing Phase 1A Dublin Crossing Phase 1A Seevers Jordan Ziegenmeyer 33


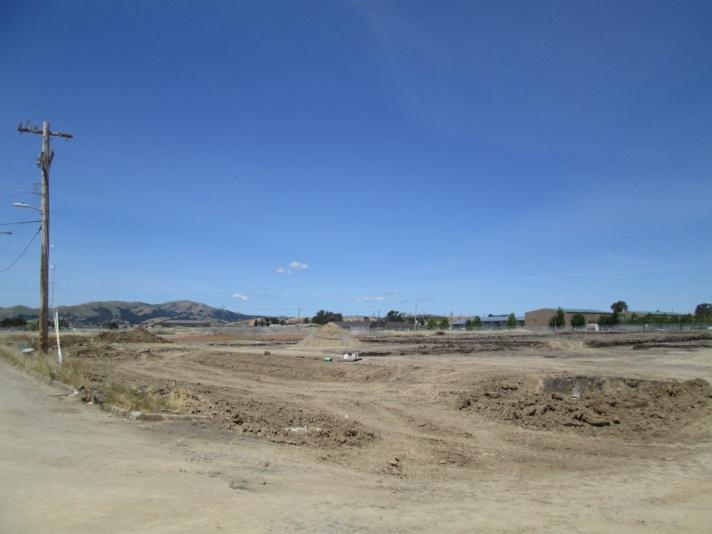
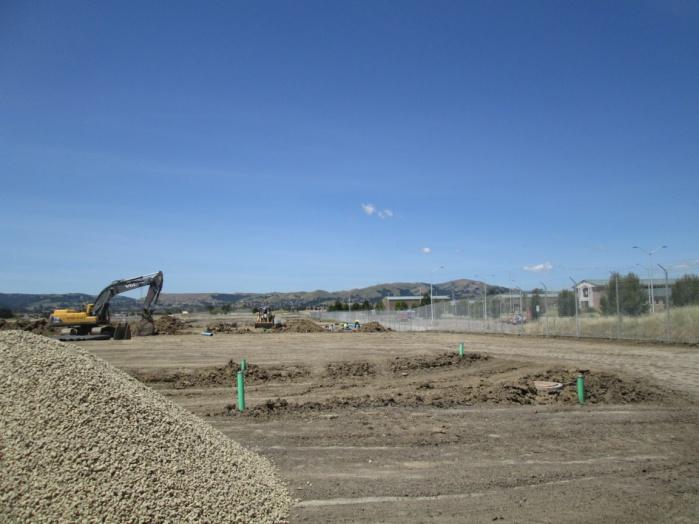
137 Dublin Crossing Phase 1A Dublin Crossing Phase 1A Dublin Crossing Phase 1B Dublin Crossing Phase 1B Dublin Crossing Phase 1B Dublin Crossing Phase 1B Seevers Jordan Ziegenmeyer 34


138 ALAMEDA COUNTY Introduction One of the nine Bay Area counties, Alameda County is located on the eastern shores of the San Francisco Bay, and is bordered on the north by Contra Costa County, on the south by Santa Clara County, on the east by San Joaquin County. The 821 square miles of Alameda offer a variety of topography and geography. A coastal plain stretches some five miles from the Bay to the base of the Berkeley Hills. The county also reaches to the top of the Berkeley Hills on their southwest side. At the south end of the hills, a gap leads to Livermore Valley, which covers most of the eastern part of the county. The coastal plain is covered with urban areas, and the cities extend high into the Berkeley Hills. Livermore Valley is less densely populated and includes areas of farmland. Alameda County enjoys a mild coastal climate with little extremes of temperature and moderate amounts of rainfall. Forests cover large areas of the Berkeley hills, separated by grassy areas. Oakland is the county seat and most populous city in the county. Population The population of Alameda County is over 1.6 million, and has shown moderate to strong growth over the past five years, with an average growth rate of 1.3% per year. The city of Dublin has grown the most, with a very high average annual growth rate of 4.7% over the last five years. With a population of over 422,000, Oakland represents the largest city in the county, followed by Fremont, Hayward and Berkeley. Seevers Jordan Ziegenmeyer 35
139 The following table illustrates population trends for Alameda County over the past few years. POPULATION TRENDS City %/Yr Alameda 74,446 75,210 76,074 76,785 77,657 79, % Albany 18,432 18,625 18,668 18,682 18,841 18, % Berkeley 114, , , , , , % Dublin 46,408 46,956 50,079 53,512 56,014 57, % Emeryville 10,177 10,361 10,592 10,822 10,967 11, % Fremont 216, , , , , , % Hayward 146, , , , , , % Livermore 81,948 82,772 83,768 85,049 86,368 88, % Newark 42,904 43,189 43,464 43,835 44,284 44, % Oakland 394, , , , , , % Piedmont 10,761 10,844 10,921 11,018 11,138 11, % Pleasanton 70,813 71,117 71,153 71,990 73,776 74, % San Leandro 85,701 85,889 85,847 86,453 87,209 87, % Union City 70,054 70,733 71,172 71,719 72,412 72, % Unincorporated 142, , , , , , % Total 1,525,695 1,543,027 1,566,339 1,587,637 1,610,765 1,627, % Source: California Department of Finance Transportation The availability of a broad transportation network has been one of the major factors in the region s growth. The county is served by a number of Interstate routes and freeways, including Interstates 80, 580 and 880. Interstate 80 connects the western portion of the area to San Francisco to the west and the Sacramento region to the east. Interstate 580 connects the eastern portion of the county to San Joaquin County in the Central Valley to the east. Three bridges connect Alameda County across the Bay, including the Bay, Dumbarton and San Mateo Bridges. Bay Area Rapid Transit (BART) serves a large part of the region. The city of Oakland is the terminus of vital interstates and railways and has long been a major West Coast transportation hub for travelers and cargo. In addition, the ports of Alameda and Oakland are active participants in Pacific Rim trade. The city of Emeryville is a passenger stop for Amtrak trains. Oakland International Airport is the main airport serving the region. San Francisco International Airport is also easily accessible. Employment & Economy The California Employment Development Department has reported the following employment data for Alameda County over the past several years. Seevers Jordan Ziegenmeyer 36
140 EMPLOYMENT TRENDS Labor Force 786, , , , , ,900 Employment 707, , , , , ,400 Job Growth 10,300 22,700 16,500 19,000 20,100 16,700 Unemployment Rate 10.1% 8.7% 7.2% 5.8% 4.7% 4.2% Source: California Employment Development Department The unemployment rate in Alameda County was 3.9% in February 2017, which compares to rates of 5.0% for California and 4.7% for the U.S. Most areas within the state and nation, including Alameda County, saw declining unemployment rates in 2004 through 2006, increases from 2007 to 2010, and declines during Alameda County has one of the lowest unemployment rates in the state. Alameda County has a diverse economy, with no one sector accounting for a majority of the employment in the region. The following chart indicates the percentage of total employment for each sector within the county. EMPLOYMENT BY SECTOR Trade/Transportation/Utilities Professional/Business Services Government Education/Health Services Leisure/Hospitality Manufacturing Construction/Mining/Logging Other Services Financial Activities Information Agriculture 0.0% 5.0% 10.0% 15.0% 20.0% Source: California Employment Development Department As can be seen in the chart above, the area s largest employment sectors are Trade/Transportation/ Utilities, which includes retail and wholesale trade (18.1% of total employment); Professional and Business Services (17.5%); Government (16.2%); and Educational and Health Services (15.8%). The following table lists the largest employers in Alameda County. Seevers Jordan Ziegenmeyer 37
141 LARGEST EMPLOYERS Employer Industry Employees 1 University of California, Berkeley Education 19,779 2 County of Alameda Government 9,042 3 Kaiser Permanente Medical Group Healthcare 8,618 4 Lawrence Livermore National Laboratory Manufacturing 8,007 5 Safeway Retail - Grocery 7,570 6 Alta Bates Summit Medical Center Healthcare 7,443 7 Oakland Unified School District Education 5,660 8 City of Oakland Government 4,604 9 Tesla Motors Manufacturing 4, Waste Management Wholesale Trade 3,753 Source: County of Alameda, Comprehensive Annual Financial Report, June 30, 2014 Historically, Alameda County businesses, particularly in Oakland and its urban neighbors, were mostly manufacturing (including World War II shipbuilding), warehousing and distribution, food processing, and printing and publishing. Though many of these businesses survive today, manufacturing has become a much smaller portion of the economy. Oakland s relative affordability of land and less traffic congestion compared to other Bay Area locations, coupled with a state-of-theart fiber-optic network, have attracted many high-tech employers to the area. The closure of the many military installations in the county has also led to new commercial and residential uses. The Alameda Naval Air Station, now Alameda Point, offers deep-water piers, an airport, laboratories and industrial buildings, housing and recreational facilities. The Port of Oakland, the nation s fifth-largest containerized cargo port, remains a powerful economic engine for the county, providing jobs at the seaport and the Oakland International Airport. The port handles 98% of Northern California s containerized cargo, and the airport is the nation s 14 th largest air cargo operation. Scientific research is another Alameda County hallmark. The Lawrence Berkeley National Laboratory and Lawrence Livermore National Laboratory are part of the U.S. Department of Energy and are managed by the University of California. Another facility, Sandia National Laboratories, is operated and managed by Sandia Corporation, a wholly owned subsidiary of Lockheed Martin Corporation, as a contractor for the U.S. Department of Energy. All of these facilities are world-class research leaders, creating thousands of jobs over the years. Many private technology firms have located nearby to partner with the labs on scientific projects. The University of California at Berkeley, one of the nation s top-ranked research universities, is another major employer. The university provides an academic culture and educated workforce that enhance the entire region and attract new businesses to the area. Further south, California State University Hayward also provides higher education and thousands of jobs. Seevers Jordan Ziegenmeyer 38
142 Household Income Median household income represents a broad statistical measure of well-being or standard of living in a community. The median income level divides households into two equal segments with one half of households earning less than the median and the other half earning more. The median income is considered to be a better indicator than the average household income as it is not dramatically affected by unusually high or low values. In the year 2015 (most recent data available from the U.S. Census Bureau), Alameda County s median household income was $81,462, which was significantly higher than the state of California s median income of $64,483. Recreation & Culture Alameda County offers a variety of recreational and cultural opportunities. A number of parks preserve large tracts of land in the Berkeley Hills, including the Redwood Regional Park, Joaquin Miller Park and the Anthony Chabot Regional Park. Excursions to San Francisco are within a short drive and include the Golden Gate Bridge, Alameda Mammal Center, Muir Woods, Alcatraz and Angel Islands, to name a few. Public golf courses, neighborhood parks, community and recreation centers, museums, galleries, restaurants and wineries are located throughout the county. The county is home to three major professional sports franchises: the Oakland Athletics (Major League Baseball), Oakland Raiders (NFL football) and Golden State Warriors (NBA basketball). Conclusion Alameda County has experienced moderate to strong population growth, averaging 1.3% per year over the past five years. Most of this growth has been due to in-migration of businesses and residents from more expensive Bay Area counties. Some of the county s location advantages include its temperate climate, proximity to San Francisco, employment opportunities, low unemployment rate, University presence, good transportation linkages, and relative affordability compared to other Bay Area locations. After a period of contraction in the economy and real estate markets around , the region has seen improvement in employment and economic conditions over the past few years. Unemployment is very low at just 3.9%. Most real estate sectors are showing signs of recovery or expansion. The near-term outlook is for continued growth. Seevers Jordan Ziegenmeyer 39

143 NEIGHBORHOOD Introduction This section of the report provides an analysis of the observable data that indicate patterns of growth, structure and/or change that may enhance or detract from property values. For the purpose of this analysis, a neighborhood is defined as a group of complementary land uses; a congruous grouping of inhabitants, buildings, or business enterprises. 4 Neighborhood Boundaries The boundaries of a neighborhood identify the physical area that influences the value of the subject property. These boundaries may coincide with observable changes in prevailing land use or occupant characteristics. Physical features such as the type of development, street patterns, terrain, vegetation and parcel size tend to identify neighborhoods. Roadways, waterways and changing elevations can also create neighborhood boundaries. The subject property is located in the city of Dublin, in the eastern part of Alameda County. The neighborhood is generally defined by the city limits of Dublin. 4 The Dictionary of Real Estate Appraisal, 6 th ed. (Chicago: Appraisal Institute, 2015), 156. Seevers Jordan Ziegenmeyer 40
144 Demographics According to demographic reports prepared by Esri Business Analyst Online, current demographics within the subject s neighborhood (as defined above) are summarized in the following table. Population (2016) 58,399 persons Population (2021), % change 65,551 persons, % Median Age 36.1 years Number of Households 18,874 Average Household Size 2.80 persons % of Households Owner-Occupied 63.8% % of Households Renter Occupied 36.2% Median Household Income $121,032 Transportation The subject property is located north of Dublin Boulevard, between Dougherty and Arnold Roads, south of 6 th Street. Dublin Boulevard is a six-lane thoroughfare and serves as a major linkage throughout Dublin. Less than one-half mile south of the subject property, running parallel to Dublin Boulevard, is Interstate 580, which provides access to the cities of San Leandro, Oakland, and Berkeley to the west, before joining Highway 101 in San Rafael. To the east, I-580 connects the city of Dublin with the city of Livermore before terminating south of the city of Tracy at Interstate 5. Approximately two miles west of the subject property, Interstate 680 is accessible via Interstate 580 or Dublin Boulevard. Interstate 680 spans the length of the East Bay Area and provides access to the cities of Danville, Walnut Creek, Concord and Martinez to the north before terminating at Interstate 80. To the south, the cities of Pleasanton, Fremont, and Milpitas can be reached via I-680 before terminating in San Jose. Dublin s steady population growth over the past decade is largely attributable to San Francisco and Silicon Valley commuters seeking more affordable housing, who likely favor Dublin over other communities of the East Bay Area for the proximity and access to both the I-580 and I-680 highways. Public transportation is available via the heavy-rail public transit and subway system identified as BART (Bay Area Rapid Transit), which connects the cities of the East Bay Area with the San Francisco peninsula. The West Dublin/Pleasanton BART station is located less than one mile south of the subject property and the East Dublin/Pleasanton BART station is approximately two miles southeast of the subject property. Additionally, bus service is provided by the Livermore Amador Valley Transit Authority (LAVTA), which has stops just south of the subject property along Amador Valley Boulevard. Seevers Jordan Ziegenmeyer 41

145 Land Uses The city of Dublin contains mostly residential development, with a good balance of supporting commercial and community uses. Predominate land uses in the Dublin are presented in the following map: Alameda County Jail Federal Women s Prison City of San Ramon Wallis Ranch Residential Development Stoneridge Mall Residential Development Retail Development Industrial Development City of Pleasanton Office Development Retail Development Residential Development City of Livermore There is significant residential development within the subject s neighborhood. Most of the nearby single-family residential developments represent relatively newer construction, having been built within the last years. Wallis Ranch is a master planned community currently under construction, located at the northern end of the city limits, northeast of Dublin Crossing (identified by the yellow star). In October 2014, a partnership between Trumark and Castlelake, LP acquired Wallis Ranch, an entitled 806-unit master planned community, for $200 million. Since this acquisition, Trumark has subdivided Wallis Ranch into multiple parcels, or eight neighborhoods. There are currently seven active homebuilders developing Wallis Ranch, which include: KB Home, Warmington Residential, Taylor Morrison, Plute Homes, Emerald Homes, D.R. Horton and Trumark Homes. Projects include both attached and detached products with home sizes range from 1,514 to 4,300 square feet. Price points start from the $800,000 to the $1,300,000 range. Just southeast of Dublin Crossing is the Persimmon Place shopping center (anchored by Whole Foods Market and Nordstrom Rack) located along the south side of Dublin Boulevard, between Arnold Road and Hacienda Drive. Just east of this shopping center is the Hacienda Crossings center, anchored by Best Buy, Barnes & Noble, Babies R Us, T.J. Maxx, and a Stadium 20 and IMAX movie theater. Further east along Dublin Boulevard, between Dublin Boulevard and I-580, are several other anchored shopping centers that include Lowe s Home Improvement and Target. Seevers Jordan Ziegenmeyer 42
146 Although just outside the Dublin city limits, south of I-580 and west of I-680 is the Stoneridge Shopping Center, a regional mall that is proximate to the subject property and draws retail consumers to the area. Anchor tenants in the Stoneridge Shopping Center include JCPenney, Nordstrom, Sears, and Macy s. The Dublin Crossing specific plan is located on a portion of the U.S. Army Parks Reserve Forces Training Area (PRFTA), commonly known as Camp Parks. It is currently a semi-active mobilization and training center for U.S. Army Reserve personnel to be used in case of war or natural disaster. Camp Parks has a primary mission of exercising the functions of command, training, security, administration, servicing and supply to all troop units, military activities and other governmental agencies assigned or attached. New and state-of-the-art training facilities have been built and more are planned. In the garrison area are administrative and classroom buildings, upgraded housing, a remodeled dining facility, a modern lodging facility, an informative history center, and other support and training facilities. Camp Parks RFTA is the only local training facility for more than 11,000 Army Reserve Soldiers in the San Francisco Bay Area where a wide variety of training facilities are available. Reserve Units permanently stationed at Parks RFTA conduct weekend inactive duty training throughout the year, and Reserve Component units travel to the base for their two-week annual training. The base also hosts the Federal Correctional Institute, Dublin (FCI Dublin), and is adjacent to Alameda County/Santa Rita Jail. The FCI Dublin is a low-security United States federal prison for female inmates, just west of the Alameda County/Santa Rita Jail. The Alameda County/Santa Rita Jail is located just east of FCI Dublin at the northeast corner of Arnold Road and Broder Boulevard. Santa Rita houses the majority of persons arrested in Alameda County, which occupies most of the East San Francisco Bay Area and includes the cities of Oakland, Berkeley, San Leandro and Alameda. Conclusion In conclusion, the city of Dublin has experienced steady population growth in recent periods, which has fueled the need for additional supporting commercial services. The subject property benefits from its location in Dublin s primary retail corridor. Additionally, the subject has good access to major neighborhood linkages and regional highways. Overall, considering the preceding factors, as well as the subject s location in an area with a high average household income and steady population growth, the subject s neighborhood is expected to remain a viable location for a residential development over the long-run. Seevers Jordan Ziegenmeyer 43
.")

147 RESIDENTIAL MARKET Market Definition The subject property is located in the city of Dublin in the East Bay Area of eastern Alameda County, approximately 25 miles southeast of Oakland and the Bay Bridge. There are 18 projects currently available (12 detached and six attached projects). Home price points at active projects will be described from available projects in an effort to characterize the current status of the residential sector in general. We will begin with a County-wide perspective on incentives and pricing at new homes projects; then we will shift to a localized perspective of the subject property and surrounding area. It is important to note, price points are highest for those areas located closest to the Bay Area. This also holds true for Alameda County as a whole as well; price points are significantly higher the more proximate to San Francisco/Oakland (the Bay Area) in comparison to those east of the I-680 Corridor (i.e., Dublin and Livermore, etc.). Thus, while this market overview begins with the analysis of Alameda County as a whole (macro overview), the market overview for subject s location within the East Bay Area is best described when we hone in on this specific market area of Alameda County later in this section. Some of this residential market overview is based on information provided in the Market Pricing and Absorption Analysis, prepared by Robert Charles Lesser & Co. Real Estate Advisors, dated April 28, Seevers Jordan Ziegenmeyer 44
148 Building Permits Single-family building permits for Alameda County are shown below. As shown, permit levels in Alameda County have been gradually increasing in recent years. Last year (2016) reported the largest number of permits pulled since 2006, but still well below those levels reported in the early 2000 s. Single-family Building Permits Alameda Percent County Change , , % % % % % , % , % , % , % , % Jan. - Feb Source: SOCDS Building Permits Database Seevers Jordan Ziegenmeyer 45


149 The number of single-family permits for the regional area declined significantly from 2006 through 2008, and then remained fairly steady until Permit levels increased significantly in 2012 followed by four years of moderate increases. Future Development According to the City of Dublin s Planning Division, as of March 2017 (latest data available) 123 residential units have been issued within the city with 7,059 left to be issued. A summary of the residential development activity with the city is provided in the table below. March Year-to-Date Estimated Units Remaining Units Issued by Planning Area Eastern Dublin Specific Plan ,316 Dublin Crossing Specific Plan ,918 Downtown Dublin Specific Plan 0 5 1,807 Other Areas Total ,059 A brief summary major residential development projects is summarized below. Boulevard (Dublin Crossing) Multi-phased development comprised of up to 1,995 residential units, up to 200,000 square feet of commercial uses, 35 acres of public parkland, a 12-acre elementary school site and related infrastructure. The overall project specific plan (Dublin Crossing Specific Plan) was approved in Site improvements for the first phase of development are underway. Design review for the first six residential neighborhoods (Phases 1A and 1B) were approved by the Planning Commission on June 14, Site Development Review for Phases 2/3 and 4/5 are under review. The subject property encompasses a portion of this planned development. Seevers Jordan Ziegenmeyer 46

150 Mollar Ranch/Tassajara Hills The Applicant, Toll Brothers Inc., received Planning Commission approval on August 9, 2016, for a Site Development Review Permit for the design and construction of 370 single family detached residential dwellings and a private clubhouse. The General Plan/Specific Plan land use, Planned Development Zoning and Vesting Tentative Subdivision Map were approved by the City Council in This development will include three neighborhoods: The Glen,. The Knolls and The Bluffs. The Glen will include 107 single-family detached units on a minimum of 4,500 square foot lots, The Knolls will include 179 single-family detached units on a minimum of 5,000 square foot lots, and The Bluffs will include 84 single-family detached units on a minimum of 5,500 square foot lots. These neighborhoods are currently in plan check review. The Perch at Downtown Dublin Trumark Homes LLC will construct 60 townhomes on a 2.7 acre site at 7144 Regional Street in Downtown Dublin. The project will include the construction of the residential buildings, site circulation and landscape improvements, and street improvements along Regional Street and San Ramon Road along the project frontages. The project was approved by the Planning Commission on October 13, 2015 and includes Site Design Review approval for the architectural design, a Vesting Tentative Map to create condominium units, and a Conditional Use Permit to authorize a reduced guest parking standard. This project is currently in plan check review. Wanmei Properties, Inc. The Applicant, Wanmei Properties, Inc., is requesting approval of a Planned Development Zoning, Vesting Tentative Map and Site Development Review to subdivide the property and construct 19 single family detached homes. The proposed project includes completing the frontage improvements along Tassajara Road as well as demolition of the existing single family home and ceasing operation of the various landscape contracting businesses that currently exist on the site. Seevers Jordan Ziegenmeyer 47
151 An Initial Study/Mitigated Negative Declaration was prepared for the project and circulated for public review and comment from March 17, 2016 through April 18, Based on new information obtained during the public review period, a revised Initial Study/Mitigated Negative Declaration was prepared and recirculated for public review and comment from October 22, 2016 through November 22, New Home Pricing and Sales According to the Gregory Group, a firm that publishes new homes prices and absorption statistics for areas in California and Nevada, there are presently 18 active new home subdivisions in Dublin, with a total of 66 throughout Alameda County (including Alameda, Dublin, Fremont, Hayward, Livermore, Newark, Oakland and Pleasanton). As previously mentioned, price points are highest for those areas located closest to the Bay Area. Therefore, we have included the communities of Dublin, Livermore and Pleasanton, which presently contain 29 active projects. Below and on the following page we present a table and chart depicting average sale prices for active single-family residential projects in the market area for the past three years. New Home Sales East Bay/Alameda County Average Home Size (SF) Source: The Gregory Group Avg. Net Price / Avg. SF Sold Per Project Per Month Average Base Price Average Net Price Average Incentive % Change Net Price Quarter Sold Number of Projects 1Q 2014 $877,169 $870,931 $6, ,525 $ Q 2014 $873,757 $868,388 $5, % 2,504 $ Q 2014 $889,145 $883,912 $5, % 2,530 $ Q 2014 $896,607 $891,241 $5, % 2,531 $ Q 2015 $962,536 $958,028 $4, % 2,596 $ Q 2015 $900,642 $896,052 $4, % 2,385 $ Q 2015 $887,018 $882,335 $4, % 2,316 $ Q 2015 $921,254 $916,778 $4, % 2,376 $ Q 2016 $859,075 $855,325 $3, % 2,198 $ Q 2016 $898,962 $893,018 $5, % 2,268 $ Q 2016 $923,091 $917,133 $5, % 2,324 $ Q 2016 $963,090 $956,727 $6, % 2,409 $ Q 2017 $932,747 $926,695 $6, % 2,285 $ Seevers Jordan Ziegenmeyer 48
.")
152 New Home Pricing Source: The Gregory Group Net prices have been generally increasing since the First Quarter of 2014, albeit several quarterly dips and a significant increase in the First Quarter of The average net price in First Quarter of 2017 marks a 8.3% increase over the lowest level observed in the First Quarter of 2016 ($855,325). In the following table we show the average net base price divided by the average home size. New Home Average Net Price / Average SF Source: The Gregory Group Seevers Jordan Ziegenmeyer 49
153 Looking at the average price per square foot, this indicator was fairly constant around $350/SF in Since the beginning of 2015 average price per square foot increased steadily, hovering around $400/SF for the last four quarters. The following chart shows recent trends in absorption (number of sales per project per month). New Home Sales per Project per Month Source: The Gregory Group In terms of the number of home sales, there have been ups and downs from quarter to quarter. There were 3.7 sales per project per month in the First Quarter of 2017, which was up from 2.8 in the previous quarter, but slightly down from a year earlier (4.2 sales per project per month). Absorption rates (homes sold per project per month) have fluctuated, but have generally stayed within the range of 2.0 to 4.0 sales per project per month. Over the last 12 months (through the First Quarter of 2017), the average was 2.9 sales per month. Over the last three years, number of home sales has averaged 3.1 per project per month. Active Projects, Current New Home Pricing & Absorption As previously mentioned, there are 18 active projects in Dublin, of which 12 are detached projects and six are attached projects. These projects summarized in the following table, based on data from the First Quarter Seevers Jordan Ziegenmeyer 50
154 Active Projects Summary First Quarter 2017 Avg. Base Age. Home Avg. Price Lot Size Units Units Units Units Project Master Plan Builder Price Size (SF) Per SF (SF) Planned Offered Sold Unsold Barnwell None D.R. Horton $1,293,968 2,541 $ , Bridgecroft Wallis Ranch D.R. Horton $1,429,990 3,970 $ , Capri None Brookfield Residential $953,880 2,085 $ N/Ap Citron Wallis Ranch Pulte Homes $997,157 2,514 $ , Driftsong Wallis Ranch Warmington Residential $964,221 2,416 $ , Fielding Wallis Ranch Trumark Homes $997,000 2,139 $ , Heritage Park None Pulte Homes $1,066,590 2,643 $ , Hillcrest None Lennar Homes $974,880 2,127 $ , Ivy Oak Wallis Ranch Taylor Morrison Homes $1,173,333 3,185 $ , Kingswood None LandSea $749,323 1,930 $ N/Ap Riverton Wallis Ranch KB Home $777,384 1,853 $ N/Ap Schaefer Ranch None Toll Brothers $1,404,745 3,701 $ , Tramore None Lennar Homes $857,547 2,123 $ , Trestle Wallis Ranch Warmington Residential $847,380 2,036 $ N/Ap Tribeca None Pulte Homes $802,933 1,922 $ N/Ap Trio None Brookfield Residential $821,130 2,178 $ N/Ap Westport Village None Lennar Homes $786,280 2,092 $ N/Ap Wexford None Lennar Homes $960,380 2,286 $ , Overall Minimum $749,323 1,853 $ /SF Overall Maximum $1,429,990 3,970 $ /SF Overall Average $992,118 2,430 $ /SF Source: The Gregory Group Project Active Detached Projects Recent Absorption (Number of Sales) Master Plan Avg. Home Price Open Date 1Q Q Q Q Q 2016 Barnwell None $1,293,968 Jun Bridgecroft Wallis Ranch $1,429,990 Oct Capri None $953,880 Aug Citron Wallis Ranch $997,157 Jun Driftsong Wallis Ranch $964,221 Jun Fielding Wallis Ranch $997,000 Jun Heritage Park None $1,066,590 Apr Hillcrest None $974,880 Nov Ivy Oak Wallis Ranch $1,173,333 Nov Schaefer Ranch None $1,404,745 Jun Tramore None $857,547 Dec Wexford None $960,380 Nov Q 2015 Total No. of Projects Sales per Project per Quarter Sales per Project per Month Based on this information, over the last six quarters the monthly absorption rate per detached project has ranged from 1.7 to 3.8 sales, with an average rate of 2.7 sales per project per month. Seevers Jordan Ziegenmeyer 51
155 Project Active Attached Projects Recent Absorption (Number of Sales) Master Plan Avg. Home Price Open Date 1Q Q Q Q Q 2016 Kingswood None $749,323 Jul Riverton Wallis Ranch $777,384 Sep Trestle Wallis Ranch $847,380 Mar Tribeca None $802,933 Jun Trio None $821,130 Feb Westport Village None $786,280 Jun Q 2015 Total No. of Projects Sales per Project per Quarter Sales per Project per Month As for the six active attached projects, over the last six quarters the monthly absorption rate per attached project has ranged from 1.9 to 5.4 sales, also with an average rate of 4.0 sales per project per month. Given market conditions and the subject s location and physical features, we estimate the subject could achieve an average absorption rate of about 4.0 to 5.0 sales per month for the attached product and 2.0 to 3.0 sales per month for the detached product. In addition, a Market Pricing and Absorption Analysis, prepared by Robert Charles Lesser & Co. Real Estate Advisors, dated April 28, 2017, was provided for our review and identified 13 of these 18 active projects as those most similar to the proposed product lines within Improvement Area No. 1 of Dublin Crossing. The Market Pricing and Absorption Analysis projects, in the initial phase, base prices starting in the low-$1,000,000s for detached homes (2,400 to 2,700 square foot homes) and starting in the low-$600,000s for attached homes (1,450 to 3,000 square foot homes). Additional options, upgrades and lot premiums could increase the all-in home price by $30,000 to $100,000. Recommended pricing of the proposed product lines within Improvement Area No. 1 of Dublin Crossing are concluded in the Robert Charles Lesser & Co. are shown in the following table: Seevers Jordan Ziegenmeyer 52
156 No. of Average Base Price Neighborhood Type Units Home Size Average Average/SF Phase 1A Union Attached 62 1,732 $707,000 $408 Madison Attached 107 1,808 $725,000 $401 Wilshire Attached 75 1,979 $766,000 $387 Huntington (A) Detached 45 2,553 $1,032,000 $404 Huntington (B) Detached 24 2,552 $1,032,000 $404 Phase 1B Fillmore Attached 80 2,262 $834,000 $369 Sunset Detached 60 2,547 $1,031,000 $ ,120 $835,900 $394 Price to Unit Size Relationship Improvement Area No.1/Phase 1 of Dublin Crossing Versus Comparable Communities Source: Market Pricing and Absorption Analysis, prepared by Robert Charles Lesser & Co. Real Estate Advisors, dated April 28, 2017 Based on our analysis herein, the base home prices concluded in the Robert Charles Lesser & Co. report are considered reasonable. Seevers Jordan Ziegenmeyer 53
157 Ability to Pay As shown in the valuation sections, based on the range of proposed product lines to be offered in Improvement Area No. 1 (Phases 1A and 1B) of Dublin Crossing on the subject s various land development categories, average home sizes between approximately 1,732 and 2,551 square feet could achieve price points between $750,000 and $1,100,000 (total consideration), which is supported by the Robert Charles Lesser & Co. report. In this section, we will examine the ability to pay among prospective buyers for a representative price point range of $750,000 and $1,100,000. First, we will estimate the required annual household income based on typical mortgage parameters in the subject s market area. Specifically, we will employ a loan-to-value ratio of 80% (down payment of 20%), mortgage interest rate of 4.250%, 360 monthly payments, and a 30% ratio for the mortgage payment as a percent of monthly gross income, which includes a tax rate of % and $80 per month for property insurance. The following tables show estimates of the annual household income that would be required to afford a home priced between $750,000 and $1,100,000. Income Requirement Home Price $750,000 Home Price $1,100,000 Loan % of Price (Loan to Value) 80% Loan % of Price (Loan to Value) 80% Loan Amount $600,000 Loan Amount $880,000 Interest Rate 4.250% Interest Rate 4.250% Mortgage Payment $2,952 Mortgage Payment $4,329 Property Taxes (per month) $729 Property Taxes $1,069 CFD No Special Tax (per month) $307 CFD No Special Tax (per month) $407 Property Insurance $960 Property Insurance $960 Mortgage Payment % of Income 30% Mortgage Payment % of Income 30% Monthly Income $16,492 Monthly Income $22,549 Annual Income $197,906 Annual Income $270,587 We have obtained income data from Esri for a 10-mile radius surrounding the subject property, which is considered representative of typical buyers for the subject property. It is noted this geographic area is wider than the immediate neighborhood profiled previously in the Neighborhood section of original Appraisal report, which focuses on the subject s immediate location. Seevers Jordan Ziegenmeyer 54
 Household Percent Percent Households Income of Households Able to Pay Able to Pay < $15,000 4.5% 0.0% 0.0% $15,000 - $24,999 3.6% 0.0% 0.0% $25,000 - $34,999 3.")
158 In the following tables, we show the income brackets within a 10-mile radius, along with estimates of the percentage of households able to afford a home priced between $750,000 and $1,100,000 within each income bracket. Ability to Pay ($750,000 home) Household Percent Percent Households Income of Households Able to Pay Able to Pay < $15, % 0.0% 0.0% $15,000 - $24, % 0.0% 0.0% $25,000 - $34, % 0.0% 0.0% $35,000 - $49, % 0.0% 0.0% $50,000 - $74, % 0.0% 0.0% $75,000 - $99, % 0.0% 0.0% $100,000 - $149, % 0.0% 0.0% $150,000 - $199, % 4.2% 0.7% $200, % 100.0% 21.1% 100% 21.8% Source: Esri (household income) Seevers Jordan Ziegenmeyer 55
159 The preceding analysis indicates that approximately 21.8% of households (approximately 33,037 households) within a 10-mile radius of the subject property would be able to pay for a home priced at $750,000, and approximately 4.5% of households (approximately 6,762 households) would be able to pay for a $1,100,000 home. Conclusion Ability to Pay ($1,100,000 home) Household Percent Percent Households Income of Households Able to Pay Able to Pay < $15, % 0.0% 0.0% $15,000 - $24, % 0.0% 0.0% $25,000 - $34, % 0.0% 0.0% $35,000 - $49, % 0.0% 0.0% $50,000 - $74, % 0.0% 0.0% $75,000 - $99, % 0.0% 0.0% $100,000 - $149, % 0.0% 0.0% $150,000 - $199, % 0.0% 0.0% $200, % 21.1% 4.5% 100% 4.5% Source: Esri (household income) We have summarized some of the key points from this section, as well as the those found in the Market Pricing and Absorption Analysis prepared by Robert Charles Lesser & Co. Real Estate Advisors (dated April 28, 2017), as follows: Throughout the regional area, new home prices have trended upward over the past two to three years. For new homes in the subject s market area (East Bay/Alameda County), average prices increased, albeit a few quarterly dips, and generally settled in the mid-$900,000 range. The average price per square foot in the subject s market area was fairly constant around $350/SF in Since the beginning of 2015 average price per square foot increased steadily, hovering around $400/SF for the last four quarters. Absorption rates in the subject s market area have fluctuated, but have generally stayed within the range of 2.0 to 4.0 sales per project per month. Among the active detached projects in the subject s competitive market area, the average absorption rate was 3.8 sales per project per month in the First Quarter of 2017, while the active attached projects reported an average rate of 4.6 sales per project per month for the same time period. Overall, demand for new homes in the subject s market area is increasing. The housing market is considered to be in a stage of expansion. Seevers Jordan Ziegenmeyer 56
160 HIGHEST AND BEST USE ANALYSIS The term highest and best use, as used in this report, is defined as follows: The reasonably probable use of property that results in the highest value. The four criteria that the highest and best use must meet are legal permissibility, physical possibility, financial feasibility, and maximum productivity. 5 Two analyses are typically required for highest and best use. The first analysis is highest and best use of the land as though vacant, and the second analysis is the highest and best use as improved (proposed). Definitions of these terms are provided in the Glossary of Terms in the Appendix to this report. Highest and Best Use as though Vacant In accordance with the definition of highest and best use, it is appropriate to analyze the subject as though vacant as it relates to legal permissibility, physical possibility, financial feasibility and maximum productivity. Legal Permissibility The legal factors influencing the highest and best use of the subject property are primarily government regulations such as zoning and building codes. The subject property represents approximately acres of the Dublin Crossing master planned community entitled for 453 residential units (129 detached and 324 attached). The subject property, as proposed and partially improved, represents a portion of a specific plan that has undergone extensive planning and review. Based on the difficulties in obtaining the subject s existing approvals, it is doubtful any significant project changes would be allowed. Physical Possibility The physical and locational characteristics of the properties have been previously described in this report. In summary, the physical characteristics of the site, terrain and soils are suitable for the proposed uses. Location considerations include the compatibility of the subject s proposed use(s) and location with respect to surrounding uses. As indicated previously, the subject represents a portion of a specific plan, which has undergone extensive planning and review. The proposed development has been carefully designed to include an appropriate mix of land uses that are compatible with adjacent uses and uses throughout the planned community. 5 The Dictionary of Real Estate Appraisal, 6th ed. (Chicago: Appraisal Institute, 2015), 109. Seevers Jordan Ziegenmeyer 57
161 It should be noted at the time of inspection the appraiser did not observe the existence of hazardous material, which may or may not be present on the properties. The appraiser has no knowledge of the existence of such materials on the properties. However, the appraiser is not qualified to detect such substances. The presence of potentially hazardous materials could affect the value of the properties. The value estimates herein are predicated on the assumption there is no material on or in the properties that would cause a loss of value. No responsibility is assumed for any such conditions or for any expertise or engineering knowledge required to discover them. The client is urged to retain an expert in the field if desired. There are no known significant easements that would prohibit the development of the properties. Overall, the subject has locational characteristics, access and utilities, which support the subject s intended uses. Financial Feasibility A determination of financial feasibility is dependent primarily upon demand. The subject property is located in an area that has experienced modest population growth in recent years, with the little population growth a direct result of the limited supply of developable land. As noted in the Residential Market overview section, the subject's East Bay Area location has experienced significant increases in land value. Also, sales of production lots and homes in the area remain relatively strong. As shown later in this report by the land residual analyses, where home and remaining site development costs are deducted from current home prices, the subject s land values are positive (reflecting its as vacant condition), which demonstrates that single-family residential development (both detached and attached) is financially feasible. Further, buyers are actively buying homes and builders are earnestly buying land, reflecting ample demand. Development of the subject property as a single-family residential subdivision is financially feasible. Maximum Productivity There is only one land use that is legally permissible, physically possible and financially feasible; to develop the subject property as single-family residential units. Conclusion of the Highest and Best Use As Though Vacant Legal, physical, and market conditions have been analyzed to evaluate the highest and best use of the properties. The analysis is presented to evaluate the type of use(s) that will generate the greatest level of future benefits possible to the properties. The only use that meets the four criteria for determining the highest and best use is a well-balanced single-family residential development. The Seevers Jordan Ziegenmeyer 58
162 subject should be developed according to this land use designation. Based on this analysis, residential development is judged to be the subject s highest and best use as vacant land. Highest and Best Use as Improved (Proposed) Based on the valuation analysis presented later in this Report, the proposed homes to be constructed on the selected subject site are representative of the market for similar product in the area and are considered financially feasible, with reasonable developer s incentive, and maximally productive. Probable Buyer The most probable buyer of the appraised properties is a merchant builder looking to acquire land for production home development. Seevers Jordan Ziegenmeyer 59
163 APPROACHES TO VALUE The valuation process is a systematic set of procedures an appraiser follows to provide answers to a client s questions about real property value. 6 This process involves the investigation, organization and analysis of pertinent market data and other related factors that affect the market value of real estate. The market data is analyzed in terms of any one or all of the three traditional approaches to estimating real estate value. These are the cost, sales comparison, and income capitalization approaches. One additional analysis a discounted cash flow analysis is also applicable. Each approach to value is briefly discussed and defined as follows: Cost Approach The cost approach is based on the premise that no prudent buyer would pay more for a particular property than the cost to acquire a similar site and construct improvements of equivalent desirability and utility. Thus, this approach to value relates directly to the economic principle of substitution, as well as supply and demand. The cost approach is most applicable when valuing properties where the improvements are new or suffer only a minor amount of accrued depreciation, and is especially persuasive when the site value is well supported. The cost approach is also highly relevant when valuing special-purpose or specialty properties and other properties that are not frequently exchanged in the market. The definition of the cost approach is offered as follows: A set of procedures through which a value indication is derived for the fee simple estate by estimating the current cost to construct a reproduction of (or replacement for) the existing structure, including an entrepreneurial incentive or profit; deducting depreciation from the total cost; and adding the estimated land value. Adjustments may then be made to the indicated value of the fee simple estate in the subject property to reflect the value of the property interest being appraised. 7 Sales Comparison Approach The sales comparison approach is based on the premise that the value of a property is directly related to the prices being generated for comparable, competitive properties in the marketplace. Similar to the cost approach, the economic principles of substitution, as well as supply and demand are basic to the sales comparison approach. This approach has broad applicability and is particularly persuasive when there has been an adequate volume of recent, reliable transactions of similar properties that indicate value patterns or trends in the market. When sufficient data are available, this approach is the most direct and systematic approach to value estimation. Typically, the sales comparison approach is most pertinent when valuing land, single-family homes and small, owner-occupied commercial and office properties. 6 The Dictionary of Real Estate Appraisal, 6th ed. (Chicago: Appraisal Institute, 2015), The Dictionary of Real Estate Appraisal, 54. Seevers Jordan Ziegenmeyer 60
164 The definition of the sales comparison approach is offered as follows: The process of deriving a value indication for the subject property by comparing sales of similar properties to the property being appraised, identifying appropriate units of comparison, and making adjustments to the sale prices (or unit prices, as appropriate) of the comparable properties based on relevant, market-derived elements of comparison. 8 Income Capitalization Approach The income capitalization approach is based on the premise that income-producing real estate is typically purchased as an investment. From an investor's point of view, the potential earning power of a property is the critical element affecting value. The concepts of anticipation and change, as they relate to supply and demand issues and substitution, are fundamental to this valuation approach. These concepts are important because the value of income-producing real estate is created by the expectation of benefits (income) to be derived in the future, which is subject to changes in market conditions. Value may be defined as the present worth of the rights to these future benefits. Within the income capitalization approach there are two basic techniques that can be utilized to estimate market value. These techniques of valuation are direct capitalization and yield capitalization. Direct Capitalization: A method used to convert an estimate of a single year s income expectancy into an indication of value in one direct step, either by dividing the net income estimate by an appropriate capitalization rate or by multiplying the income estimate by an appropriate factor. Direct capitalization employs capitalization rates and multipliers extracted or developed from market data. Only one year s income is used. Yield and value changes are implied, but not explicitly identified. 9 Yield Capitalization: A method used to convert future benefits into present value by 1) discounting each future benefit at an appropriate yield rate, or 2) developing an overall rate that explicitly reflects the investment s income pattern, holding period, value change, and yield rate. 10 The definition of the income capitalization approach is offered as follows: Specific appraisal techniques applied to develop a value indication for a property based on its earning capability and calculated by the capitalization of property income. 11 Discounted Cash Flow Analysis A discounted cash flow analysis is a procedure in which a discount rate is applied to a projected revenue stream generated from the sale of individual components of a project. In this method of valuation, the appraiser/analyst specifies the quantity, variability, timing and duration of the revenue 8 The Dictionary of Real Estate Appraisal, 6th ed. (Chicago: Appraisal Institute, 2015), The Dictionary of Real Estate Appraisal, The Dictionary of Real Estate Appraisal, The Dictionary of Real Estate Appraisal, 115. Seevers Jordan Ziegenmeyer 61
165 streams and discounts each to its present value at a specified yield rate. A discounted cash flow analysis will be presented in this appraisal: the Land Residual Analysis, which is defined below. Land Residual Analysis: This analysis considers the residual value of the subject land by deducting costs from home prices over a projected absorption period, with the result representing the value of land. Seevers Jordan Ziegenmeyer 62
166 MARKET VALUATION RESIDENTIAL LAND Improvement Area No. 1 (Phases 1A and 1B) of the Dublin Crossing development comprises various land development categories ranging from high density attached motor-court condominiums to medium density attached townhomes and detached homes. The breakdown of the land development categories comprising the subject are presented below: Land Use Average No. of Category Neighborhood Type Description Home Size Phase Units 1 Union Attached Motor Court Condos - High Density/10-Unit Bldgs 1,732 1A 62 Attached High Density Homes 1,732 2 Madison Attached Townhomes 1,808 1A Wilshire Attached Motor Court Townhomes - 8-Unit Bldgs 1,979 1A 75 Attached Medium Density - Smaller Homes 1,894 3 Fillmore Attached Pepper Lane Townhomes 2,262 1B 80 Attached Medium Density - Larger Homes 2,262 4 Huntington (A) Detached 3-Story Alley Product - "Boomerang" 2,553 1A 45 4 Huntington (B) Detached 3-Story Alley Product - "Boomerang" 2,552 1A 24 4 Sunset Detached 4-Pack 2,547 1B 60 Detached Homes 2,551 For purposes of this analysis, the market data will be compared to the subject s four land development categories described above. Further, a typical 75 lot takedown will form the basis for comparison. The land residual analysis and the sales comparison approach will be used to estimate the value of the subject s residential land. The purpose of the analysis herein is to derive estimates of market value for the various residential land components comprising Improvement Area No. 1 of the CFD, as if finished with all site development work complete. As the residential land comprising Phase 1A has transferred to the merchant builders on a blue top lot basis, with the merchant builders obligated to complete remaining in-tract improvements; whereas, Phase 1B has transferred to the merchant builders as finished lots, with the master developer obligated to complete remaining infrastructure and in-tract development. The deduction for remaining costs to complete (merchant builder obligations) will be considered in the following section under the valuation by ownership. The estimates of market value provided herein is subject to the hypothetical condition various public improvements to be financed by the Bonds are in place. Therefore, for purposes of the analysis herein, it is presumed available construction fund proceeds from the sale of the Bonds will provide for the completion of infrastructure improvements and in-tract improvements obligated to be completed by the master developer (Dublin Crossing, LLC). Seevers Jordan Ziegenmeyer 63
167 LAND RESIDUAL ANALYSIS The land residual analysis is utilized in estimating land value when subdivision and development are the highest and best use of the parcel of land being appraised. All direct and indirect costs are deducted from an estimate of the anticipated gross sales price of the improved product; the resultant net sales proceeds are then discounted to present value at an anticipated rate over the development and absorption period to indicate the value of the land. The land residual analysis is conducted on a quarterly basis. As a discounted cash flow analysis, the land residual analysis consists of four primary components revenue, expenses, absorption and discount rate. Discussions of these four concepts begin below, with the land residual analysis offered at the end of this section. Revenue The projected sales price for the average unit within each neighborhood will vary, as the ultimate sales price is affected by unit size, location within the project, site influences, such as horizontal and vertical construction costs, anticipated premiums achievable at the point of retail sale, as well as external influences such as adjacent land uses. Information in this analysis will be based on the conclusions provided via the market study, prepared by Robert Charles Lesser & Co., commissioned for this land-secured financing. Based on the proposed product lines for each land development category, proposed average home sizes of 1,732 square feet (attached high density homes), 1,894 square feet (attached medium density smaller homes), 2,262 square feet (attached medium density larger homes) and 2,551 square feet (respectively) will be utilized. Based on analysis of prices and floor plans in the Residential Market overview section, as well as Market Pricing and Absorption Analysis, prepared by Robert Charles Lesser & Co. Real Estate Advisors, dated April 28, 2017, the respective homes sizes could achieve prices of $750,000, $800,000, $890,000 and $1,100,000 (total consideration). Based on the layout of the lots indicated by the maps provided, and considering the subject lots are generally similar in size to one another, lot premium allocations are not warranted. The subject does not feature any lots meriting a lot premium, and all lots are generally similar in size. The subject does not feature any atypical premiums such as view or open space frontage. As will be discussed in the expense section that follows, given the typical product line size at Dublin Crossing, it is anticipated a builder will construct three model homes. Upgrade amenity costs are projected at $75,000 each, or $225,000 in total. Typically, builders capture approximately 50% of the cost through the sale of the model and the furniture. Although furnishings are a real cost of the model improvements, they are personal property, not real estate. Thus, furnishings are not included in the opinion of value for the model home premiums. Given this consideration, the recapture cost for model homes are typically reduced to 25% to 40% of model improvement costs. Considering the Seevers Jordan Ziegenmeyer 64
168 anticipated amount foot traffic for the subject property, a recapture amount towards the lower of the range, or 30%, is considered reasonable. Using this percentage, a recapture of $22,500 per model (30% x $75,000) is concluded, or a total of $67,500, which will be considered in the estimate of aggregate retail value. The estimated aggregate retail value for the subject land development categories are as follows: REVENUE SUMMARY - Attached High Density Homes No. of Average Unit Average Sale Average Value Unit Type Units Size $/SF Per Unit Extension* Composite Average 75 1,732 $433 $750,000 $ 56,250,000 Model Recapture $ 67,500 Total 75 1,732 $750,900 $ 56,317,500 (Avg) *Exclusive of appreciation REVENUE SUMMARY - Attached Medium Density Smaller Homes No. of Average Unit Average Sale Average Value Unit Type Units Size $/SF Per Unit Extension* Composite Average 75 1,894 $422 $800,000 $ 60,000,000 Model Recapture $ 67,500 Total 75 1,894 $800,900 $ 60,067,500 (Avg) *Exclusive of appreciation REVENUE SUMMARY - Attached Medium Density Larger Homes No. of Average Unit Average Sale Average Value Unit Type Units Size $/SF Per Unit Extension* Composite Average 75 2,262 $393 $890,000 $ 66,750,000 Model Recapture $ 67,500 Total 75 2,262 $890,900 $ 66,817,500 (Avg) *Exclusive of appreciation REVENUE SUMMARY - Detached Homes No. of Average Unit Average Sale Average Value Unit Type Units Size $/SF Per Unit Extension* Composite Average 75 2,551 $431 $1,100,000 $ 82,500,000 Model Recapture $ 67,500 Total 75 2,551 $1,100,900 $ 82,567,500 (Avg) *Exclusive of appreciation Seevers Jordan Ziegenmeyer 65
169 Closing Projections For the attached product, the typical time required for the construction of units is estimated at approximately nine to 18 months from start to closing. For the detached product, construction of the homes is estimated at approximately six to nine months. It is assumed that closings will occur within six months of the date of sale. These assumptions are reflected in the projected construction schedules shown in the land residual model s project activity table in the section titled direct construction and phasing. Since the land residual analysis is conducted on a quarterly basis, closings are reflected in the following period. Changes in Market Conditions (Price Increases or Decreases) Based on market surveys, responses are mixed whether market participants trend revenues and expenses. Generally market participants prefer not to price trend, but sometimes they will trend when trying to justify a sale price when there is strong competition for land. Or, participants have indicated they may trend if the sell-off period is anticipated to be protracted. However, under current market conditions, there is likelihood of some home price appreciation during the sell-off period. As 75-lot/unit developments, the subject projects are anticipated to achieve sell-out within 2-to-2½ years. We estimate a level appreciation factor of 1% per year (0.25% quarterly) for the subject s selloff. There is a two-period (attached) and one-period (detached) lag between when home contracts are signed and construction is completed and homes are closed. Therefore, closing revenue is connected to the corresponding appreciation factor of the period of sale (contract). Absorption According to the Market Pricing and Absorption Analysis for the Dublin Crossing Improvement Area 1 development, prepared by Robert Charles Lesser & Co., absorption of the subject units will likely range between four and seven units per month, with the upper end of the absorption range reflective of the lowest price point of the product to be developed. For purposes of this analysis, presuming a 75 lot/unit development, it is estimated the subject projects (attached) can achieve an absorption rate of 4.0 sales per month (12.0 sales per quarter), with the detached product selling at a rate beginning at two sales per month and gradually increasing to four per month. Therefore, with sales beginning in Period 1, these projects sell out in Period 6 for the attached projects, with Period 8 needed to complete construction and close escrow, and Period 9 for the detached project, with Period 10 needed to complete construction and close escrow. Expense Projections A deduction will be made for expenses attributable to the project over the holding period. The conclusions estimated on the following pages are drawn upon or supported by the builder/developer survey and reviewed budgets for other similar sized projects throughout the regional area provided in the table below. Seevers Jordan Ziegenmeyer 66
170 Developer Budget No. of Avg. Home Avg. Lot G & A Mkt & Sales Permits & Direct Indirect % Cost per Profit Classification Municipality Date Units Quality Size (SF) Size (SF) % of Rev % of Rev Fees/Unit Cost/SF of Direct Model % of Rev Regional Contra Costa County Average 2,188 2, % 6.2% $35,000 $ % $41, % National City of West Sacramento Average 2,078 6,775 N/Av N/Av $46,822 $62.70 N/Av N/Av N/Av Regional City of Concord Avg./Good 2,000 Attached 1.2% 2.6% $43,714 $ % $81, % Regional City of Lodi Good 2,152 5,554 N/Av 1.3% $29,290 $ % $67, % Local Sonoma County Avg./Good 1,889 3, % 3.5% $36,930 $ % N/Av 19.8% Regional City of Oakley Average 2,305 6,000 N/Av 3.0% $53,000 $ % N/Av 14.6% Local City of Elk Grove Good 2,614 5, % 5.1% $46,000 $ % $27, % Local City of Sacramento Average 1,946 3, % 3.5% $43,284 $ % $36, % Local City of Davis Average 1,829 2, % 3.0% $61,770 $92.28 N/Av $50,000 N/Av Regional City of Roseville Good 2,234 6, % 4.0% $47,844 $ % $145, % Regional City of West Sacramento Avg./Good 2,450 5,000 N/Av 4.2% $35,346 $ % N/Av 8.4% Local City of Fremont Good/Excel. 3,505 6, % 1.8% $170,000 $ % $155, % Minimum 15 Average 1,829 2, % 1.3% $29,290 $ % $27, % Maximum 94 Good/Excel. 3,505 6, % 6.2% $170,000 $ % $155, % Average 39 Average/Good 2,266 4, % 3.5% $54,083 $ % $75, % General and Administrative These expenses consist of management fees, liability and fire insurance, inspection fees, appraisal fees, legal and accounting fees and copying or publication costs. This expense category typically ranges from 2.0% to 4.0%, depending on length of project and if all of the categories are included in a builder s budget. We have used 2.0% for general and administrative expenses. This expense category is spread evenly over the entire sellout period (eight or ten periods, depending on land development category). Marketing and Sales These expenses typically consist of advertising and promotion, closing costs, sales operations, and sales commissions. The expenses are expressed as a percentage of the gross sales revenue. The range of marketing and sales expenses typically found in projects within the subject s market area is 5.0% to 6.5%. Considering the specifics of the subject property, a figure of 5.0%, or 3.0% for marketing and 2.0% for sales, is used in the marketing and sales expense category. Property Taxes (Ad Valorem and Special Taxes) The subject is located within an area with a % tax rate. This amount is applied to the estimated market value and divided by the total number of homes to yield an estimate of ad valorem taxes/home/year. This amount is applied to unclosed inventory over the sell-off period. Property taxes are increased by 2% per year. As referenced, the appraised properties are located within the boundaries of Improvement Area No. 1 of the City of Dublin Community Facilities District No (Dublin Crossing). According to the Rate and Method of Apportionment, the annual special taxes applicable to the subject s facilities are as presented in the table on the following page: Seevers Jordan Ziegenmeyer 67
171 Land Use Home Size Assigned Annual Special Tax Rate* Single Family Detached Property > 2,300 SF $4,878 per Residential Unit Single Family Detached Property 2,100-2,300 SF $4,528 per Residential Unit Single Family Detached Property < 2,100 SF $4,174 per Residential Unit Multi-Family Property > 1,800 SF $4,087 per Residential Unit Multi-Family Property ,800 SF $3,685 per Residential Unit Multi-Family Property < 1,600 SF $3,273 per Residential Unit * Fiscal Year ; On July 1, 2016 and each July 1 thereafter, all dollar amounts shown above shall be increased by two percent (2%) of the amount in effect in the previous Fiscal Year. The total tax expense is gradually reduced over the absorption period, as the land components are sold off. Site Development Costs In this analysis we are determining the value of a finished lot; therefore, no deduction is made for remaining site development costs (including in-tracts and infrastructure) in the valuation. Permits and Fees Permits and fees represent all fees payable upon obtaining building permit for the construction of the proposed units and include school fees and any impact fees. According to the Developer, permits and fees for each land development category within Improvement Area No. 1 (Phases 1A and 1B) are detailed below: Phase 1A Phase 1B Improvement Area No. 1 Total Huntington Wilshire Madison Union Sunset Fillmore Phase 1A Phase 1B Total Fees 69 Lots 75 Lots 107 Lots 62 Lots 60 Lots 80 Lots Land Permits & Fees - Builder Water Connection/Meter/Drain/Waste BP $ 2,105,664 $ 1,954,875 $ 2,788,955 $ 1,616,030 $ 1,855,860 $ 2,127,920 $ 8,465,524 $ 3,983,780 $ 12,449,304 Traffic BP $ 688,539 $ 538,050 $ 767,618 $ 444,788 $ 568,560 $ 530,640 $ 2,438,995 $ 1,099,200 $ 3,538,195 BP $ 188,847 $ 183,225 $ 261,401 $ 151,466 $ 277,200 $ 254,960 $ 784,939 $ 532,160 $ 1,317,099 Public Arts BP $ - $ - $ - Fire BP $ 37,536 $ 40,800 $ 58,208 $ 33,728 $ 32,640 $ 43,520 $ 170,272 $ 76,160 $ 246,432 Other Land BP $ 345 $ 225 $ 321 $ 186 $ 300 $ 240 $ 1,077 $ 540 $ 1,617 Building BP $ 303,324 $ 329,700 $ 470,372 $ 272,552 $ 263,760 $ 351,680 $ 1,375,948 $ 615,440 $ 1,991,388 Zone 7 Water BP $ 1,931,538 $ 2,148,150 $ 2,861,929 $ 1,658,314 $ 1,606,620 $ 2,142,160 $ 8,599,931 $ 3,748,780 $ 12,348,711 Public Facilities Fees BP $ 1,625,088 $ 1,766,400 $ 2,520,064 $ 1,460,224 $ 1,422,180 $ 1,898,480 $ 7,371,776 $ 3,320,660 $ 10,692,436 Total Fee BP $ (1,520,262) $ (1,400,250) $ (1,997,690) $ (1,157,540) $ (1,118,760) $ (1,491,680) $ (6,075,742) $ (2,610,440) $ (8,686,182) Total Land Permits & Fees - Builder (w/o School Fees) $ 5,360,619 $ 5,561,175 $ 7,731,178 $ 4,479,748 $ 4,908,360 $ 5,857,920 $ 23,132,720 $ 10,766,280 $ 33,899,000 Average School Fees - Est ($5.91/SF) $ 1,042,028 $ 872,139 $1,143,018 $634,740 $903,479 $1,044,740 $ 3,691,925 $ 1,948,219 $ 5,640,144 Total Permits & Fees - w/ School Fees $ 6,402,647 $ 6,433,314 $ 8,874,196 $ 5,114,488 $ 5,811,839 $ 6,902,660 $ 26,824,645 $ 12,714,499 $ 39,539,144 Permits & Fees (w/ School Fees) per Lot $92,792 $85,778 $82,936 $82,492 $96,864 $86,283 $85,702 $90,818 $87,283 Direct and Indirect Construction Costs Construction costs are generally classified into two groups, direct and indirect costs. Direct costs reflect the cost of labor and materials to build the project. Indirect items are the carrying costs and fees incurred in developing the project and during the construction cycle. Seevers Jordan Ziegenmeyer 68
172 Construction quality and market-segment are significant factors that affect direct construction costs. In addition, national/public builders, which are able to achieve lower costs due to the larger scale in which orders are placed, routinely achieve lower direct costs. Considering the presumed quality product line for the lots size categories analyzed, direct cost estimates within the range of $95 (detached) and $110 (attached) per square foot is applied to the various concluded hypothetical home sizes. Regarding indirect costs, the following list itemizes some of the typical components that generally comprise indirect costs: Architectural and engineering fees for plans, plan checks, surveys and environmental studies Appraisal, consulting, accounting and legal fees The cost of carrying the investment in land and contract payments during construction. If the property is financed, the points, fees or service charges and interest on construction loans are considered All-risk insurance The cost of carrying the investment in the property after construction is complete, but before sell-out is achieved Developer fee earned by the project coordinator Conversations with homebuilders indicate the indirect costs generally range anywhere from 10% to 15% of the direct costs (excluding marketing, sales, general and administrative expenses and taxes, which are accounted for separately). An estimate of 12% is considered reasonable for the subject property. Model Complex Model upgrade expenses can vary widely depending upon construction quality, targeted market and anticipated length of time on the market. These upgrades, exterior and interior, including furniture, can range from $20,000 per model to over $250,000 per model for executive homes. Based on the quality of the subject s proposed improvements and the targeted buyer segment, a model upgrade cost of $75,000 per model is considered reasonable for the subject property. Therefore, an estimated model complex cost of $225,000 ($75,000 per model) is considered reasonable, assuming three models. Summary The following charts summarize the revenue and expenses discussed on the preceding pages. Seevers Jordan Ziegenmeyer 69
173 REVENUE SUMMARY - Attached High Density Homes No. of Average Unit Average Sale Average Value Unit Type Units Size $/SF Per Unit Extension* Composite Average 75 1,732 $433 $750,000 $ 56,250,000 Model Recapture $ 67,500 Total 75 1,732 $750,900 $ 56,317,500 (Avg) EXPENSES SUMMARY General and Administrative 2.0% of total revenue** $1,133,559 Marketing and Sales 5.0% of total revenue** $2,833,897 Ad Valorem Taxes % - Tax Rate $244,107 Total Number of Units: 75 $3,255 /unit Special Taxes CFD No Special Taxes $3,642 /unit Estimated Permits and Fees at Building Permit/Occupancy Average Permits and Fees/Unit $82,492 x Number of Units 75 Total Permits and Fees $6,186,881 Construction Costs SF Units Cost/SF Extension* Indirects Average Floor Plan 1, $110 $14,289,000 $1,714,680 Average Direct Construction Costs $190,520 Indirect Costs 12% of Direct Costs $22,862 Model Complex $225,000 * Exclusive of appreciation ** Inclusive of appreciation Seevers Jordan Ziegenmeyer 70
174 REVENUE SUMMARY - Attached Medium Density Smaller Homes No. of Average Unit Average Sale Average Value Unit Type Units Size $/SF Per Unit Extension* Composite Average 75 1,894 $422 $800,000 $ 60,000,000 Model Recapture $ 67,500 Total 75 1,894 $800,900 $ 60,067,500 (Avg) EXPENSES SUMMARY General and Administrative 2.0% of total revenue** $1,209,039 Marketing and Sales 5.0% of total revenue** $3,022,597 Ad Valorem Taxes % - Tax Rate $258,802 Total Number of Units: 75 $3,451 /unit Special Taxes CFD No Special Taxes $3,824 /unit Estimated Permits and Fees at Building Permit/Occupancy Average Permits and Fees/Unit $84,357 x Number of Units 75 Total Permits and Fees $6,326,772 Construction Costs SF Units Cost/SF Extension* Indirects Average Floor Plan 1, $110 $15,625,500 $1,875,060 Average Direct Construction Costs $208,340 Indirect Costs 12% of Direct Costs $25,001 Model Complex $225,000 * Exclusive of appreciation ** Inclusive of appreciation Seevers Jordan Ziegenmeyer 71
175 REVENUE SUMMARY - Attached Medium Density Larger Homes No. of Average Unit Average Sale Average Value Unit Type Units Size $/SF Per Unit Extension* Composite Average 75 2,262 $393 $890,000 $ 66,750,000 Model Recapture $ 67,500 Total 75 2,262 $890,900 $ 66,817,500 (Avg) EXPENSES SUMMARY General and Administrative 2.0% of total revenue** $1,344,903 Marketing and Sales 5.0% of total revenue** $3,362,257 Ad Valorem Taxes % - Tax Rate $264,400 Total Number of Units: 75 $3,525 /unit Special Taxes CFD No Special Taxes $3,965 /unit Estimated Permits and Fees at Building Permit/Occupancy Average Permits and Fees/Unit $86,283 x Number of Units 75 Total Permits and Fees $6,471,244 Construction Costs SF Units Cost/SF Extension* Indirects Average Floor Plan 2, $110 $18,661,500 $2,239,380 Average Direct Construction Costs $248,820 Indirect Costs 12% of Direct Costs $29,858 Model Complex $225,000 * Exclusive of appreciation ** Inclusive of appreciation Seevers Jordan Ziegenmeyer 72
176 REVENUE SUMMARY - Detached Homes No. of Average Unit Average Sale Average Value Unit Type Units Size $/SF Per Unit Extension* Composite Average 75 2,551 $431 $1,100,000 $ 82,500,000 Model Recapture $ 67,500 Total 75 2,551 $1,100,900 $ 82,567,500 (Avg) EXPENSES SUMMARY General and Administrative 2.0% of total revenue** $1,668,744 Marketing and Sales 5.0% of total revenue** $4,171,861 Ad Valorem Taxes % - Tax Rate $407,272 Total Number of Units: 75 $5,430 /unit Special Taxes CFD No Special Taxes $4,878 /unit Estimated Permits and Fees at Building Permit/Occupancy Average Permits and Fees/Unit $94,828 x Number of Units 75 Total Permits and Fees $7,112,099 Construction Costs SF Units Cost/SF Extension* Indirects Average Floor Plan 2, $95 $18,175,875 $2,181,105 Average Direct Construction Costs $242,345 Indirect Costs 12% of Direct Costs $29,081 Model Complex $225,000 * Exclusive of appreciation ** Inclusive of appreciation Seevers Jordan Ziegenmeyer 73
177 Developer s Incentive and Discount Rate When employing a land residual analysis, most market participants (homebuilders) analyze projects based on an expected increment of profit and a cost-of-funds discount rate. The developer s profit is expressed as a percent of sales revenue and is included as an expense deduction. The cost-of-funds rate is used to discount each year of net income to present value. This methodology differs from the subdivision development method, in which most market participants (typically land developers) employ a yield rate or internal rate of return (IRR) inclusive of developer s profit, and do not deduct profit as a line item expense. Developer s Profit Based on information obtained from residential builders in the local and regional areas, developer s profit expectations are typically in the range of 8% to 20% of sales revenue. Higher profits are generally required for longer sell-out periods as well as riskier projects. Elements affecting risk include location, supply and demand conditions, construction timeline, product type and quality, etc. Another element considered in profit expectations is the development stage of a project: profit expectations are typically lower for first phases of construction due to cautious or conservative pricing as new subdivisions in competitive areas become established. Below is a survey of profit expectations from active builders in the region: Data Source Regional Builder - (2016) Regional Builder - (2016) Regional Builder - (2016) Local Builder - (2016) Local Builder - (2016) Local Builder - (2016) Local Builder - (2016) Local Builder - (2016) Local Builder - (2016) Regional Builder - (2015) Regional Builder - (2015) Local Builder - (2015) National Builer - (2013) National Builder - (2013) Profit Expectations 19.8% for 15 unit, small lot project 14.6% for 61 unit project with 6,000 SF lots 11.9% for 34 unit project with 15,500 SF lots 8.8% for 32 unit project 9.7% for 35 unit project 12.2% for 74 unit project 15.6% for 27 unit project 7% to 10% profit factor for single-family subdivisions in affordable markets 8% to 12% typical profit factor for single-family subdivisions in afforable markets, for move-up buyer segment 16.0% for 27 unit project with 21,939 SF lots 11.6% for 32 unit project 10% net profit is the target for any residential development, which typically is geared towards move-up homebuyers with a Bay Area concentration 8% to 10% net profit, regardless of product type, market area or lot condition 8% to 10%, with better located projects with less uncertainty regarding pricing and absorption at the lower end of the range and higher risk projects nearer the high end of the range. Based on the characteristics of the subject property, including its location and perceived level of risk, we will employ a developer s profit factor of 10.00% of sales revenue to high density and the medium density smaller homes, and a 12.00% developer s profit factor to the medium density larger homes and the detached homes, consistent with the regional market area. Seevers Jordan Ziegenmeyer 74
178 Discount Rate (Cost of Funds) A discount rate will be employed to convert future cash flows to present value, thus reflecting the time value of money. An appropriate discount rate should reflect the cost of funds under current market conditions. For a cost of funds index, we will use the 11th District Cost of Funds Index (COFI), which is a standard financial index widely used in U.S. capital markets as a benchmark for adjustable-rate loans. Lenders use such an index to adjust interest rates as economic conditions change. Lenders add a certain number of percentage points, or margin, to the index to establish interest rates. The 11th District COFI was 0.58% as of May A typical margin used by banks is about 250 to 350 basis points, or 2.5% to 3.5%, not including additional points or fees. Based on these parameters, we will employ a discount rate (cost of funds) of 6.0% in the land residual analysis, which considers recent rises in the Federal funds rate. Conclusions The land residual analyses are presented on the following pages. Seevers Jordan Ziegenmeyer 75
179 REVENUE AND SALES SUMMARY ATTACHED HIGH DENSITY HOMES Seevers Jordan Ziegenmeyer 76 Period (3 months): Total Sales Interim Construction Period Close of Escrow (COE) Unsold Inventory Sales Price (unappreciated) $ 9,010,800 $ 9,010,800 $ 9,010,800 $ 9,010,800 $ 11,263,500 $ 9,010,800 $ - $ - $ 56,317,500 Inflation (Appreciation) Factor 0.00% 0.25% 0.50% 0.75% 1.00% 1.25% 1.50% 1.75% Appreciated Sales Revenue (COE) $ - $ - $ 9,010,800 $ 9,033,327 $ 9,055,854 $ 9,078,381 $ 11,376,135 $ 9,123,435 Total Sales Revenue $ - $ - $ 9,010,800 $ 9,033,327 $ 9,055,854 $ 9,078,381 $ 11,376,135 $ 9,123,435 $ 56,677,932 EXPENSES AND CASH FLOW SUMMARY Period (3 months): Total General and Administrative ($141,695) ($141,695) ($141,695) ($141,695) ($141,695) ($141,695) ($141,695) ($141,695) $ (1,133,559) Marketing and Sales $0 $0 ($450,540) ($451,666) ($452,793) ($453,919) ($568,807) ($456,172) $ (2,833,897) Ad Valorem Real Estate Taxes ($61,027) ($61,027) ($51,262) ($41,498) ($32,369) ($22,409) ($9,960) $0 $ (279,551) CFD No Special Taxes ($68,283) ($68,283) ($57,357) ($46,432) ($36,217) ($25,073) ($11,144) $0 $ (312,789) Direct Construction Costs ($4,763,000) ($4,774,908) ($4,786,815) $0 $0 $0 $0 $0 $ (14,324,723) Indirect Construction Costs ($571,560) ($572,989) ($574,418) $0 $0 $0 $0 $0 $ (1,718,967) Model Costs ($225,000) $0 $0 $0 $0 $0 $0 $0 $ (225,000) Building Permits ($2,062,294) ($2,062,294) ($2,062,294) $0 $0 $0 $0 $0 $ (6,186,881) Total Expenses ($7,892,858) ($7,681,194) ($8,124,381) ($681,292) ($663,073) ($643,096) ($731,605) ($597,867) $ (27,015,365) NET INCOME BEFORE DEVELOPER'S INCENTIVE $ (7,892,858) $ (7,681,194) $ 886,419 $ 8,352,035 $ 8,392,781 $ 8,435,285 $ 10,644,530 $ 8,525,568 $ 29,662,567 Total Developer's Incentive 10.00% $0 $0 ($901,080) ($903,333) ($905,585) ($907,838) ($1,137,614) ($912,344) $ (5,667,793) NET INCOME (BEFORE DISCOUNTING) $ (7,892,858) $ (7,681,194) $ (14,661) $ 7,448,703 $ 7,487,195 $ 7,527,447 $ 9,506,917 $ 7,613,225 $ 23,994,774 Present Value Factor Discount Rate (Cost of Borrowed Funds) 6.00% Discounted Cash Flow ($7,776,214) ($7,455,841) ($14,021) $7,018,050 $6,950,066 $6,884,168 $8,565,987 $6,758,344 $ 20,930,539 Net Present Value $20,930,539 CONCLUSION OF VALUE BY DISCOUNTED CASH FLOW ANALYSIS (RD) $279,000 /lot $20,930,000
180 REVENUE AND SALES SUMMARY ATTACHED MEDIUM DENSITY - SMALLER HOMES Seevers Jordan Ziegenmeyer 77 Period (3 months): Total Sales Interim Construction Period Close of Escrow (COE) Unsold Inventory Sales Price (unappreciated) $ 9,610,800 $ 9,610,800 $ 9,610,800 $ 9,610,800 $ 12,013,500 $ 9,610,800 $ - $ - $ 60,067,500 Inflation (Appreciation) Factor 0.00% 0.25% 0.50% 0.75% 1.00% 1.25% 1.50% 1.75% Appreciated Sales Revenue (COE) $ - $ - $ 9,610,800 $ 9,634,827 $ 9,658,854 $ 9,682,881 $ 12,133,635 $ 9,730,935 Total Sales Revenue $ - $ - $ 9,610,800 $ 9,634,827 $ 9,658,854 $ 9,682,881 $ 12,133,635 $ 9,730,935 $ 60,451,932 EXPENSES AND CASH FLOW SUMMARY Period (3 months): Total General and Administrative ($151,130) ($151,130) ($151,130) ($151,130) ($151,130) ($151,130) ($151,130) ($151,130) $ (1,209,039) Marketing and Sales $0 $0 ($480,540) ($481,741) ($482,943) ($484,144) ($606,682) ($486,547) $ (3,022,597) Ad Valorem Real Estate Taxes ($64,700) ($64,700) ($54,348) ($43,996) ($34,317) ($23,758) ($10,559) $0 $ (296,380) CFD No Special Taxes ($71,706) ($71,706) ($60,233) ($48,760) ($38,033) ($26,331) ($11,702) $0 $ (328,473) Direct Construction Costs ($5,208,500) ($5,221,521) ($5,234,543) $0 $0 $0 $0 $0 $ (15,664,564) Indirect Construction Costs ($625,020) ($626,583) ($628,145) $0 $0 $0 $0 $0 $ (1,879,748) Model Costs ($225,000) $0 $0 $0 $0 $0 $0 $0 $ (225,000) Building Permits ($2,108,924) ($2,108,924) ($2,108,924) $0 $0 $0 $0 $0 $ (6,326,772) Total Expenses ($8,454,981) ($8,244,565) ($8,717,863) ($725,628) ($706,423) ($685,363) ($780,073) ($637,677) $ (28,952,572) NET INCOME BEFORE DEVELOPER'S INCENTIVE $ (8,454,981) $ (8,244,565) $ 892,937 $ 8,909,199 $ 8,952,431 $ 8,997,518 $ 11,353,562 $ 9,093,258 $ 31,499,360 Total Developer's Incentive 10.00% $0 $0 ($961,080) ($963,483) ($965,885) ($968,288) ($1,213,364) ($973,094) $ (6,045,193) NET INCOME (BEFORE DISCOUNTING) $ (8,454,981) $ (8,244,565) $ (68,143) $ 7,945,716 $ 7,986,546 $ 8,029,230 $ 10,140,198 $ 8,120,165 $ 25,454,167 Present Value Factor Discount Rate (Cost of Borrowed Funds) 6.00% Discounted Cash Flow ($8,330,030) ($8,002,684) ($65,167) $7,486,329 $7,413,594 $7,343,070 $9,136,590 $7,208,361 $ 22,190,063 Net Present Value $22,190,063 CONCLUSION OF VALUE BY DISCOUNTED CASH FLOW ANALYSIS (RD) $296,000 /lot $22,190,000
181 REVENUE AND SALES SUMMARY ATTACHED MEDIUM DENSITY - LARGER HOMES Seevers Jordan Ziegenmeyer 78 Period (3 months): Total Sales Interim Construction Period Close of Escrow (COE) Unsold Inventory Sales Price (unappreciated) $ 10,690,800 $ 10,690,800 $ 10,690,800 $ 10,690,800 $ 13,363,500 $ 10,690,800 $ - $ - $ 66,817,500 Inflation (Appreciation) Factor 0.00% 0.25% 0.50% 0.75% 1.00% 1.25% 1.50% 1.75% Appreciated Sales Revenue (COE) $ - $ - $ 10,690,800 $ 10,717,527 $ 10,744,254 $ 10,770,981 $ 13,497,135 $ 10,824,435 Total Sales Revenue $ - $ - $ 10,690,800 $ 10,717,527 $ 10,744,254 $ 10,770,981 $ 13,497,135 $ 10,824,435 $ 67,245,132 EXPENSES AND CASH FLOW SUMMARY Period (3 months): Total General and Administrative ($168,113) ($168,113) ($168,113) ($168,113) ($168,113) ($168,113) ($168,113) ($168,113) $ (1,344,903) Marketing and Sales $0 $0 ($534,540) ($535,876) ($537,213) ($538,549) ($674,857) ($541,222) $ (3,362,257) Ad Valorem Real Estate Taxes ($66,100) ($66,100) ($55,524) ($44,948) ($35,059) ($24,272) ($10,788) $0 $ (302,791) CFD No Special Taxes ($74,342) ($74,342) ($62,447) ($50,552) ($39,431) ($27,298) ($12,133) $0 $ (340,545) Direct Construction Costs ($6,220,500) ($6,236,051) ($6,251,603) $0 $0 $0 $0 $0 $ (18,708,154) Indirect Construction Costs ($746,460) ($748,326) ($750,192) $0 $0 $0 $0 $0 $ (2,244,978) Model Costs ($225,000) $0 $0 $0 $0 $0 $0 $0 $ (225,000) Building Permits ($2,157,081) ($2,157,081) ($2,157,081) $0 $0 $0 $0 $0 $ (6,471,244) Total Expenses ($9,657,596) ($9,450,013) ($9,979,500) ($799,490) ($779,816) ($758,232) ($865,890) ($709,335) $ (32,999,872) NET INCOME BEFORE DEVELOPER'S INCENTIVE $ (9,657,596) $ (9,450,013) $ 711,300 $ 9,918,037 $ 9,964,438 $ 10,012,749 $ 12,631,245 $ 10,115,100 $ 34,245,260 Total Developer's Incentive 12.00% $0 $0 ($1,282,896) ($1,286,103) ($1,289,310) ($1,292,518) ($1,619,656) ($1,298,932) $ (8,069,416) NET INCOME (BEFORE DISCOUNTING) $ (9,657,596) $ (9,450,013) $ (571,596) $ 8,631,934 $ 8,675,128 $ 8,720,231 $ 11,011,589 $ 8,816,168 $ 26,175,845 Present Value Factor Discount Rate (Cost of Borrowed Funds) 6.00% Discounted Cash Flow ($9,514,873) ($9,172,767) ($546,627) $8,132,872 $8,052,777 $7,975,019 $9,921,737 $7,826,211 $ 22,674,349 Net Present Value $22,674,349 CONCLUSION OF VALUE BY DISCOUNTED CASH FLOW ANALYSIS (RD) $302,000 /lot $22,670,000
182 Seevers Jordan Ziegenmeyer 79 REVENUE AND SALES SUMMARY Period (3 months): Total Sales Interim Construction Period Close of Escrow (COE) Unsold Inventory Sales Price (unappreciated) $ 6,605,400 $ 6,605,400 $ 8,807,200 $ 8,807,200 $ 11,009,000 $ 11,009,000 $ 13,210,800 $ 13,210,800 $ 3,302,700 $ - $ 82,567,500 Inflation (Appreciation) Factor 0.00% 0.25% 0.50% 0.75% 1.00% 1.25% 1.50% 1.75% 2.00% 2.25% Appreciated Sales Revenue (COE) $ - $ 6,605,400 $ 6,621,914 $ 8,851,236 $ 8,873,254 $ 11,119,090 $ 11,146,613 $ 13,408,962 $ 13,441,989 $ 3,368,754 Total Sales Revenue $ - $ 6,605,400 $ 6,621,914 $ 8,851,236 $ 8,873,254 $ 11,119,090 $ 11,146,613 $ 13,408,962 $ 13,441,989 $ 3,368,754 $ 83,437,211 EXPENSES AND CASH FLOW SUMMARY Period (3 months): Total General and Administrative ($166,874) ($166,874) ($166,874) ($166,874) ($166,874) ($166,874) ($166,874) ($166,874) ($166,874) ($166,874) $ (1,668,744) Marketing and Sales $0 ($330,270) ($331,096) ($442,562) ($443,663) ($555,955) ($557,331) ($670,448) ($672,099) ($168,438) $ (4,171,861) Ad Valorem Real Estate Taxes ($101,818) ($93,673) ($85,527) ($74,667) ($66,384) ($51,235) ($37,388) ($20,771) ($4,154) $0 ($535,615) CFD No Special Taxes ($91,463) ($84,146) ($76,829) ($67,073) ($59,632) ($46,024) ($33,585) ($18,658) ($3,732) $0 $ (481,140) Direct Construction Costs ($727,035) ($1,457,705) ($1,704,897) ($1,953,301) ($2,202,916) ($2,453,743) ($2,705,782) ($2,959,032) ($1,853,939) ($371,697) $ (18,390,047) Indirect Construction Costs ($87,244) ($174,925) ($204,588) ($234,396) ($264,350) ($294,449) ($324,694) ($355,084) ($222,473) ($44,604) $ (2,206,806) Model Costs ($225,000) $0 $0 $0 $0 $0 $0 $0 $0 $1 $ (224,999) Building Permits ($568,968) ($568,968) ($758,624) ($758,624) ($948,280) ($948,280) ($1,137,936) ($1,137,936) ($284,484) $0 $ (7,112,099) Total Expenses ($1,968,402) ($2,876,560) ($3,328,434) ($3,697,496) ($4,152,099) ($4,516,560) ($4,963,589) ($5,328,804) ($3,207,756) ($751,611) $ (34,791,311) NET INCOME BEFORE DEVELOPER'S INCENTIVE $ (1,968,402) $ 3,728,840 $ 3,293,479 $ 5,153,740 $ 4,721,155 $ 6,602,530 $ 6,183,023 $ 8,080,158 $ 10,234,233 $ 2,617,143 $ 48,645,900 Total Developer's Incentive 12.00% $0 ($792,648) ($794,630) ($1,062,148) ($1,064,790) ($1,334,291) ($1,337,594) ($1,609,075) ($1,613,039) ($404,250) ($10,012,465) NET INCOME (BEFORE DISCOUNTING) $ (1,968,402) $ 2,936,192 $ 2,498,850 $ 4,091,592 $ 3,656,365 $ 5,268,239 $ 4,845,430 $ 6,471,083 $ 8,621,195 $ 2,212,892 $ 38,633,435 Present Value Factor Discount Rate (Cost of Borrowed Fund 6.00% Discounted Cash Flow ($1,939,312) $2,850,049 $2,389,692 $3,855,033 $3,394,058 $4,818,027 $4,365,862 $5,744,452 $7,540,030 $1,906,777 $ 34,924,669 Net Present Value $34,924,669 DETACHED HOMES CONCLUSION OF VALUE BY DISCOUNTED CASH FLOW ANALYSIS (RD) $466,000 /lot $34,920,000
183 SALES COMPARISON APPROACH This approach is based on the economic principle of substitution. According to The Appraisal of Real Estate, 14 th Edition (Chicago: Appraisal Institute, 2013), The principle of substitution holds that the value of property tends to be set by the cost of acquiring a substitute or alternative property of similar utility and desirability within a reasonable amount of time. The sales comparison approach is applicable when there are sufficient recent, reliable transactions to indicate value patterns or trends in the market. The proper application of this approach requires obtaining recent sales data for comparison with the appraised properties. In order to assemble the comparable sales, we searched public records and other data sources for leads, then confirmed the raw data obtained with parties directly related to the transactions (primarily brokers, buyers and sellers). On the following page, we have arrayed comparable sales that have occurred in the East Bay market area proximate to the subject, including the recent acquisitions of the subject property, as well as recent sales within two master planned communities proximate to the Dublin Crossing development (Wallis Ranch and Jordan Ranch). The summary table is accompanied by a map and followed by details of each comparable. The basis of analysis is price per lot. The comparable data includes finished and unimproved transactions (with adjustments for remaining site costs and profit applied to the unimproved transactions). As previously discussed, the purpose of the analysis herein is to derive estimates of market value for the various residential land components comprising Improvement Area 1 of the CFD, as if finished with all site development work complete. As the residential land comprising Phase 1A has transferred to the merchant builders on a blue top lot basis, with the merchant builders obligated to complete remaining in-tract improvements; whereas, Phase 1B has transferred to the merchant builders as finished lots, with the master developer obligated to complete remaining infrastructure and in-tract development. The deduction for remaining costs to complete (merchant builder obligations) will be considered in the following section under the valuation by ownership. The estimates of market value provided herein is subject to the hypothetical condition various public improvements to be financed by the Bonds are in place. Therefore, for purposes of the analysis herein, it is presumed available construction fund proceeds from the sale of the Bonds will provide for the completion of infrastructure improvements and in-tract improvements obligated to be completed by the master developer (Dublin Crossing, LLC). Seevers Jordan Ziegenmeyer 80
184 ATTACHED BULK LOT COMPARABLE SALES Property Sale No. of Price per No. Identification Date Sale Price Lots Lot 1 Dublin Crossing - Fillmore (portion of the subject property) Dec-16 $21,753, $271,913 NWQ Dublin Boulevard and Arnold Road (attached) (improved) Dublin, Alameda County APN: (portion of) 2 Dublin Crossing - Union (portion of the subject property) Sep-16 $12,256, $197,677 NWQ Dublin Boulevard and Arnold Road (attached) (blue top) Dublin, Alameda County APN: through -5 (portion of) 3 Dublin Crossing - Wilshire (portion of the subject property) Sep-16 $16,348, $217,973 NWQ Dublin Boulevard and Arnold Road (attached) (blue top) Dublin, Alameda County APN: through -5 (portion of) 4 Dublin Crossing - Madison (portion of the subject property) Sep-16 $24,739, $231,206 NWQ Dublin Boulevard and Arnold Road (attached) (blue top) Dublin, Alameda County APN: through -5 (portion of) 5 Jordan Ranch - The Court (Parcel H) Sep-16 $10,000, $222,222 East of Fallon Road, between Central Parkway and Jordan Ranch Drive (attached) (unimproved) Pleasanton, Alameda County APN: Wallis Ranch - Trestle (Neighborhood 5) Feb-16 $16,740, $279,000 Northwest of Tassajara Road and Fallon Road (attached) (blue top) Dublin, Alameda County APN: (portion of, Parcel 5) Seevers Jordan Ziegenmeyer 81
185 DETACHED BULK LOT COMPARABLE SALES Property Sale No. of Price per No. Identification Date Sale Price Lots Lot 1 Dublin Crossing - Sunset (portion of the subject property) Dec-16 $21,554, $359,233 NWQ Dublin Boulevard and Arnold Road (detached) (improved) Dublin, Alameda County APN: (portion of) 2 Dublin Crossing - Huntington (portion of the subject property) Sep-16 $13,307, $295,711 NWQ Dublin Boulevard and Arnold Road (detached) (blue top) Dublin, Alameda County APN: through -5 (portion of) 3 Jordan Ranch - Slates (Neighborhood 5) Dec-15 $24,500, $437,500 East of Fallon Road, between Central Parkway and Jordan Ranch Drive (detached) (unimproved) Pleasanton, Alameda County APN: & Jordan Ranch - Onyx (Neighborhood 7) Dec-15 $19,271, $338,096 East of Fallon Road, between Central Parkway and Jordan Ranch Drive (detached) (unimproved) Pleasanton, Alameda County APN: Wallis Ranch - Fielding (Neighborhood 8) Nov-15 $52,500, $377,698 Northwest of Tassajara Road and Fallon Road (detached) (blue top) Dublin, Alameda County APN: (portion of, Parcel 8) 6 Wallis Ranch - Barnwell (Neighborhood 2) Oct-15 $28,908, $566,833 Northwest of Tassajara Road and Fallon Road (detached) (improved) Dublin, Alameda County APN: (portion of, Tract 7712) 7 Wallis Ranch - Ivy Oak (Neighborhood 3) Oct-15 $35,520, $473,600 Northwest of Tassajara Road and Fallon Road (detached) (blue top) Dublin, Alameda County APN: (portion of, Parcel 3) 8 Wallis Ranch - Driftsong (Neighborhood 7) Oct-15 $25,151, $369,868 Northwest of Tassajara Road and Fallon Road (detached) (blue top) Dublin, Alameda County APN: (portion of, Parcel 7) Seevers Jordan Ziegenmeyer 82

186 Seevers Jordan Ziegenmeyer 83
187 ATTACHED BULK LOT SALE 1 Property Identification Project Name Dublin Crossing - Fillmore (portion of the subject property) Location NWQ Dublin Boulevard and Arnold Road APN (portion of) City Dublin County Alameda County Sale Data Grantor Dublin Crossing, LLC Grantee Brookfield Fillmore, LLC Sale Date December 2016 Deed Book Page N/Av Property Rights Conveyed Fee Simple Conditions of Sale Market Financing Terms Cash Equivalent Sale Price $21,753,000 Special Taxes per Lot $66,573 Land Data Zoning Single-family Topography Generally level Utilities All available Number of Lots 80 Land Area (Acres) 4.56 Density (Units per Acre) Development Status at Sale Improved (Finished) Lots Typical Lot Size (SF) N/Ap Indicators Sale Price $271,913 Bonds $ 66,573 Total Consideration $338,486 Site Development Cost (Per Lot) $ 0 Permits and Fees (Per Lot) $ 86,286 Remarks This transaction represents the recent sale of a portion of the subject property. Seevers Jordan Ziegenmeyer 84
188 ATTACHED BULK LOT SALE 2 Property Identification Project Name Dublin Crossing - Union (portion of the subject property) Location NWQ Dublin Boulevard and Arnold Road APN through -5 (portion of) City Dublin County Alameda County Sale Data Grantor Dublin Crossing, LLC Grantee CalAtlantic Group, Inc. Sale Date September 2016 Deed Book Page N/Av Property Rights Conveyed Fee Simple Conditions of Sale Market Financing Terms Cash Equivalent Sale Price $12,256,000 Special Taxes per Lot $60,025 Land Data Zoning Single-family Topography Generally level Utilities All available Number of Lots 62 Land Area (Acres) 3.22 Density (Units per Acre) Development Status at Sale Blue Top Typical Lot Size (SF) N/Ap Indicators Sale Price $197,677 Bonds $ 60,025 Total Consideration $257,702 Site Development Cost (Per Lot) $ 35,000 Permits and Fees (Per Lot) $ 82,492 Remarks This transaction represents the recent sale of a portion of the subject property. Seevers Jordan Ziegenmeyer 85
189 ATTACHED BULK LOT SALE 3 Property Identification Project Name Dublin Crossing - Wilshire (portion of the subject property) Location NWQ Dublin Boulevard and Arnold Road APN through -5 (portion of) City Dublin County Alameda County Sale Data Grantor Dublin Crossing, LLC Grantee Brookfield Wilshire, LLC Sale Date September 2016 Deed Book Page N/Av Property Rights Conveyed Fee Simple Conditions of Sale Market Financing Terms Cash Equivalent Sale Price $16,348,000 Special Taxes per Lot $66,573 Land Data Zoning Single-family Topography Generally level Utilities All available Number of Lots 75 Land Area (Acres) 3.72 Density (Units per Acre) Development Status at Sale Blue Top Typical Lot Size (SF) N/Ap Indicators Sale Price $217,973 Bonds $ 66,573 Total Consideration $284,546 Site Development Cost (Per Lot) $ 36,035 Permits and Fees (Per Lot) $ 85,778 Remarks This transaction represents the recent sale of a portion of the subject property. Seevers Jordan Ziegenmeyer 86
190 ATTACHED BULK LOT SALE 4 Property Identification Project Name Dublin Crossing - Madison (portion of the subject property) Location NWQ Dublin Boulevard and Arnold Road APN though -5 (portion of) City Dublin County Alameda County Sale Data Grantor Dublin Crossing, LLC Grantee CalAtlantic Group, Inc. Sale Date September 2016 Deed Book Page N/Av Property Rights Conveyed Fee Simple Conditions of Sale Market Financing Terms Cash Equivalent Sale Price $24,739,000 Special Taxes per Lot $66,573 Land Data Zoning Single-family Topography Generally level Utilities All available Number of Lots 107 Land Area (Acres) 5.56 Density (Units per Acre) Development Status at Sale Blue Top Typical Lot Size (SF) N/Ap Indicators Sale Price $231,206 Bonds $ 66,573 Total Consideration $297,779 Site Development Cost (Per Lot) $ 35,000 Permits and Fees (Per Lot) $ 82,936 Remarks This transaction represents the recent sale of a portion of the subject property. Seevers Jordan Ziegenmeyer 87
191 ATTACHED BULK LOT SALE 5 Property Identification Project Name Jordan Ranch The Court (Parcel H) Location East of Fallon Road, between Central Parkway and Jordan Ranch Drive APN City Pleasanton County Alameda County Sale Data Grantor BJP-ROF Jordan Ranch, LLC Grantee TriPointe Homes Sale Date September 29, 2016 Deed Book Page Property Rights Conveyed Fee Simple Conditions of Sale Market Financing Terms Cash Equivalent Sale Price $10,000,000 Special Taxes per Lot $0 Land Data Zoning Single-family Topography Generally level to slightly rolling Utilities All available Number of Lots 45 Land Area (Acres) 4.59 Density (Units per Acre) 9.78 Development Status at Sale Unimproved Lots Typical Lot Size (SF) 2,030 Indicators Sale Price $222,222 Bonds $ 0 Total Consideration $222,222 Site Development Cost (Per Lot) $ 88,889 Permits and Fees (Per Lot) $105,000 (budgeted) Remarks TriPointe Homes purchased 45 fully entitled lots on a 4.59-acre parcel within the Jordan Ranch subdivision, in the city of Pleasanton, for $10 million. At the time of sale the property consisted of unimproved lots, but with all infrastructure in place. TriPointe Homes is proposing to construct five detached two-story homes and 40 three-story duets. The duets are plotted so that each unit shares a common wall at the ground level only. As proposed, the density of this project would be 9.78 units per acre, which is consistent with the proposed Medium Density ( units per acre) land use designation. It is worth noting subsequent to acquiring the land, school fees increased significantly from approximately $6 per square foot to approximately $22 per square foot. Seevers Jordan Ziegenmeyer 88
192 ATTACHED BULK LOT SALE 6 Property Identification Project Names Wallis Ranch Trestle (Neighborhood 5) Location Northwest of Tassajara Road and Fallon Road APN (portion of, Parcel 5) City Dublin County Alameda County Sale Data Grantor Development Solutions WR, LLC Grantee Warmington Properties, Inc. Sale Date February 26, 2016 Deed Book Page Property Rights Conveyed Fee Simple Conditions of Sale Market Financing Terms Cash Equivalent Sale Price $16,740,000 Special Taxes per Lot $0 Land Data Zoning Single-family Topography Rolling Utilities All available Number of Lots 60 Land Area (Acres) 3.30 Density (Units per Acre) Development Status at Sale Blue Top Typical Lot Size (SF) N/Ap Indicators Sale Price $279,000 Bonds $ 0 Total Consideration $279,000 Site Development Cost (Per Lot) $ 35,000 Permits and Fees (Per Lot) $ 95,000 (budgeted) Remarks This transaction represents the sale of a 3.3-acre parcel ( Parcel 5 ), fully entitles for a 60-home subdivision (3-plexes) in the Wallis Ranch master planned community in Dublin. In October 2014, a partnership between Trumark and Castlelake, LP acquired Wallis Ranch, an entitled 806- unit master planned community for $200 million. Since this acquisition, Trumark has subdivided Wallis Ranch into multiple parcels, or eight neighborhoods. This sale represents the transfer of Neighborhood 5 to Warmington Properties. In October 2015 Warmington Properties also acquired Neighborhood 7 (68 lots). This project, Trestle, is currently under construction. It is worth noting subsequent to acquiring the land, school fees increased significantly from approximately $6 per square foot to approximately $22 per square foot. Seevers Jordan Ziegenmeyer 89
193 DETACHED BULK LOT SALE 1 Property Identification Project Name Dublin Crossing - Sunset (portion of the subject property) Location NWQ Dublin Boulevard and Arnold Road APN (portion of) City Dublin County Alameda County Sale Data Grantor Dublin Crossing, LLC Grantee CalAtlantic Group, Inc. Sale Date December 2016 Deed Book Page N/Av Property Rights Conveyed Fee Simple Conditions of Sale Market Financing Terms Cash Equivalent Sale Price $21,554,000 Special Taxes per Lot $79,457 Land Data Zoning Single-family Topography Generally level Utilities All available Number of Lots 60 Land Area (Acres) 4.95 Density (Units per Acre) Development Status at Sale Improved (Finished) Lots Typical Lot Size (SF) N/Av Indicators Sale Price $359,233 Bonds $ 79,457 Total Consideration $438,690 Site Development Cost (Per Lot) $ 0 Permits and Fees (Per Lot) $ 96,864 Remarks This transaction represents the recent sale of a portion of the subject property. Seevers Jordan Ziegenmeyer 90
194 DETACHED BULK LOT SALE 2 Property Identification Project Name Dublin Crossing - Huntington (portion of the subject property) Location NWQ Dublin Boulevard and Arnold Road APN though -5 (portion of) City Dublin County Alameda County Sale Data Grantor Dublin Crossing, LLC Grantee Brookfiled Bay Area Holdings, LLC Sale Date September 2016 Deed Book Page N/Av Property Rights Conveyed Fee Simple Conditions of Sale Market Financing Terms Cash Equivalent Sale Price $13,307,000 Special Taxes per Lot $79,457 Land Data Zoning Single-family Topography Generally level Utilities All available Number of Lots 45 Land Area (Acres) 3.50 Density (Units per Acre) Development Status at Sale Blue Top Typical Lot Size (SF) N/Av Indicators Sale Price $295,711 Bonds $ 79,457 Total Consideration $375,168 Site Development Cost (Per Lot) $112,358 Permits and Fees (Per Lot) $ 92,792 Remarks This transaction represents the recent sale of a portion of the subject property. Seevers Jordan Ziegenmeyer 91
195 DETACHED BULK LOT SALE 3 Property Identification Project Name Jordan Ranch Slates (Neighborhood 5) Location NEQ Central Parkway and Panorama Drive APN & -006 City Pleasanton County Alameda County Sale Data Grantor BJP-ROF Jordan Ranch, LLC Grantee TriPointe Homes Sale Date December 16, 2015 Deed Book Page Property Rights Conveyed Fee Simple Conditions of Sale Market Financing Terms Cash Equivalent Sale Price $24,500,000 Special Taxes per Lot $0 Land Data Zoning Single-family Topography Generally level to slightly rolling Utilities All available Number of Lots 56 Land Area (Acres) 7.80 Density (Units per Acre) 7.18 Development Status at Sale Unimproved Lots Typical Lot Size (SF) 3,200 Indicators Sale Price $437,500 Bonds $ 0 Total Consideration $437,500 Site Development Cost (Per Lot) $ 65,000 Permits and Fees (Per Lot) $110,000 (budgeted) Remarks TriPointe Homes purchased 56 fully entitled lots on a 7.80-acre parcel within the Jordan Ranch subdivision, in the city of Pleasanton, for $24.5 million. TriPointe Homes is proposing to construct 56 traditional, two-story, single-family homes. According to City documents, TriPointe proposes three floor plans ranging from 1,840 to 2,110 square foot homes on the 3,200 square foot lots. It is worth noting subsequent to acquiring the land, school fees increased significantly from approximately $6 per square foot to approximately $22 per square foot. Seevers Jordan Ziegenmeyer 92
196 DETACHED BULK LOT SALE 4 Property Identification Project Name Jordan Ranch Onyx (Neighborhood 7) Location North of Central Parkway, east of Panorama Drive APN City Pleasanton County Alameda County Sale Data Grantor BJP-ROF Jordan Ranch, LLC Grantee TriPointe Homes Sale Date December 16, 2015 Deed Book Page Property Rights Conveyed Fee Simple Conditions of Sale Market Financing Terms Cash Equivalent Sale Price $19,271,500 Special Taxes per Lot $0 Land Data Zoning Single-family Topography Generally level to slightly rolling Utilities All available Number of Lots 57 Land Area (Acres) 5.55 Density (Units per Acre) Development Status at Sale Unimproved Lots Typical Lot Size (SF) 1,856 Indicators Sale Price $338,096 Bonds $ 0 Total Consideration $338,096 Site Development Cost (Per Lot) $ 60,000 Permits and Fees (Per Lot) $106,000 (budgeted) Remarks TriPointe Homes purchased 57 fully entitled lots, a portion of Neighborhood 7 (Onyx) within Jordan Ranch subdivision, in the city of Pleasanton. Neighborhood 7 (Onyx) includes a total of 105 detached alley-loaded lots on 10.1 acres. It is worth noting subsequent to acquiring the land, school fees increased significantly from approximately $6 per square foot to approximately $22 per square foot. Seevers Jordan Ziegenmeyer 93
197 DETACHED BULK LOT SALE 5 Property Identification Project Names Wallis Ranch Fielding (Neighborhood 8) Location Northwest of Tassajara Road and Fallon Road APN (portion of, Parcel 8) City Dublin County Alameda County Sale Data Grantor Development Solutions WR, LLC Grantee Trumark Homes, Inc. Sale Date November 13, 2015 Deed Book Page Property Rights Conveyed Fee Simple Conditions of Sale Market Financing Terms Cash Equivalent Sale Price $52,500,000 Special Taxes per Lot $0 Land Data Zoning Single-family Topography Rolling Utilities All available Number of Lots 139 Land Area (Acres) Density (Units per Acre) Development Status at Sale Blue Top Typical Lot Size (SF) 2,000 Indicators Sale Price $377,698 Bonds $ 0 Total Consideration $377,698 Site Development Cost (Per Lot) $ 35,000 Permits and Fees (Per Lot) $105,000 (budgeted) Remarks This transaction represents the sale of a 12.3-acre parcel fully entitles for a 139 detached homes in a 6-pack court configuration. In October 2014, a partnership between Trumark and Castlelake, LP acquired Wallis Ranch, an entitled 806-unit master planned community for $200 million. Since this acquisition, Trumark has subdivided Wallis Ranch into multiple parcels, or eight neighborhoods. This sale represents the transfer of Neighborhood 8 to Trumark Homes. This project, Fielding, is currently under construction. It is worth noting subsequent to acquiring the land, school fees increased significantly from approximately $6 per square foot to approximately $22 per square foot. Seevers Jordan Ziegenmeyer 94
198 DETACHED BULK LOT SALE 6 Property Identification Project Names Wallis Ranch Barnwell (Neighborhood 2) Location Northwest of Tassajara Road and Fallon Road APN (portion of, Tract 7712) City Dublin County Alameda County Sale Data Grantor Development Solutions WR, LLC Grantee D.R. Horton, Inc. Sale Date October 29, 2015 Deed Book Page Property Rights Conveyed Fee Simple Conditions of Sale Market Financing Terms Cash Equivalent Sale Price $28,908,500 Special Taxes per Lot $0 Land Data Zoning Single-family Topography Rolling Utilities All available Number of Lots 51 Land Area (Acres) Density (Units per Acre) 5.64 Development Status at Sale Improved (Finished) Lots Typical Lot Size (SF) 3,800 4,300 Indicators Sale Price $566,883 Bonds $ 0 Total Consideration $566,883 Site Development Cost (Per Lot) $ 0 Permits and Fees (Per Lot) $112,000 (budgeted) Remarks This transaction represents the sale of a 17.9-acre parcel fully entitles for a 101 detached homes in the Wallis Ranch master planned community in Dublin. In October 2014, a partnership between Trumark and Castlelake, LP acquired Wallis Ranch, an entitled 806-unit master planned community for $200 million. Since this acquisition, Trumark has subdivided Wallis Ranch into multiple parcels, or eight neighborhoods. This sale represents the transfer of Neighborhood 2 to D.R. Horton. This project, Barnwell, is currently under construction. It is worth noting subsequent to acquiring the land, school fees increased significantly from approximately $6 per square foot to approximately $22 per square foot. Seevers Jordan Ziegenmeyer 95
199 DETACHED BULK LOT SALE 7 Property Identification Project Names Wallis Ranch Ivy Oak (Neighborhood 3) Location Northwest of Tassajara Road and Fallon Road APN (portion of, Parcel 3) City Dublin County Alameda County Sale Data Grantor Development Solutions WR, LLC Grantee Taylor Morrison of California, LLC Sale Date October 16, 2015 Deed Book Page Property Rights Conveyed Fee Simple Conditions of Sale Market Financing Terms Cash Equivalent Sale Price $35,520,000 Special Taxes per Lot $0 Land Data Zoning Single-family Topography Rolling Utilities All available Number of Lots 75 Land Area (Acres) 7.40 Density (Units per Acre) Development Status at Sale Blue Top Typical Lot Size (SF) N/Av Indicators Sale Price $473,600 Bonds $ 0 Total Consideration $473,600 Site Development Cost (Per Lot) $ 35,000 Permits and Fees (Per Lot) $110,000 Remarks This transaction represents the sale of Parcel 3 in the Wallis Ranch master planned community in Dublin, fully entitles for 75 detached alley-loaded homes. In October 2014, a partnership between Trumark and Castlelake, LP acquired Wallis Ranch, an entitled 806-unit master planned community for $200 million. Since this acquisition, Trumark has subdivided Wallis Ranch into multiple parcels, or eight neighborhoods. This sale represents the transfer of Neighborhood 3 to Taylor Morrison. This project, Ivy Oak, is currently under construction. It is worth noting subsequent to acquiring the land, school fees increased significantly from approximately $6 per square foot to approximately $22 per square foot. Seevers Jordan Ziegenmeyer 96
200 DETACHED BULK LOT SALE 8 Property Identification Project Names Wallis Ranch Driftsong (Neighborhood 7) Location Northwest of Tassajara Road and Fallon Road APN (portion of, Parcel 7) City Dublin County Alameda County Sale Data Grantor Development Solutions WR, LLC Grantee Warmington Properties, Inc. Sale Date October 7, 2015 Deed Book Page Property Rights Conveyed Fee Simple Conditions of Sale Market Financing Terms Cash Equivalent Sale Price $25,151,000 Special Taxes per Lot $0 Land Data Zoning Single-family Topography Rolling Utilities All available Number of Lots 68 Land Area (Acres) 7.20 Density (Units per Acre) 9.44 Development Status at Sale Blue Top Typical Lot Size (SF) 1,900 (estimate) Indicators Sale Price $369,868 Bonds $ 0 Total Consideration $369,868 Site Development Cost (Per Lot) $ 35,000 Permits and Fees (Per Lot) $106,000 Remarks This transaction represents the sale of a 7.2-acre parcel ( Parcel 7 ), fully entitles for a 68 detached (alley-loaded) subdivision in the Wallis Ranch master planned community in Dublin. In October 2014, a partnership between Trumark and Castlelake, LP acquired Wallis Ranch, an entitled 806-unit master planned community for $200 million. Since this acquisition, Trumark has subdivided Wallis Ranch into multiple parcels, or eight neighborhoods. This sale represents the transfer of Neighborhood 7 to Warmington Properties. In February 2016 Warmington Properties also acquired Neighborhood 5 (60 lots). This project, Driftsong, is currently under construction. It is worth noting subsequent to acquiring the land, school fees increased significantly from approximately $6 per square foot to approximately $22 per square foot. Seevers Jordan Ziegenmeyer 97
201 Adjustments and Conclusion The comparable transactions are adjusted based on the profile of the appraised properties with regard to categories that affect market value. For certain adjustments such as site development cost, permits and fees and Special Taxes, adjustments are made using actual or estimated (present value) dollar amounts. Other adjustments may be categories as either superior or inferior, with percentage adjustments applied accordingly. If a comparable has an attribute considered superior to that of the subject, it is adjusted downward to negate the effect the item has on the price of the comparable. The opposite is true of categories considered inferior to the subject. The adjustments are made in consideration of paired sales, the appraiser s experience and knowledge and interviews with market participants. At a minimum, the appraiser considers the need to make adjustments for the following items: Expenditures after sale (i.e. site development costs (if any), permits and fees, bond encumbrance and atypical carrying costs Property rights conveyed Financing terms Conditions of sale (motivation) Market conditions Location Physical features A detailed analysis involving the adjustment factors is presented below. Loaded Lot Analysis Since each comparable has the same highest and best use as the subject property near term singlefamily residential development we apply adjustments for remaining site development costs (if any) and permits and fees on a dollar-for-dollar basis. That is, the comparables are analyzed on a loadedlot-basis, where any remaining site development costs and permits and fees due at building permit are added to the lot price to yield a price that reflects the total consideration. After all other adjustments are applied (market conditions, physical characteristics, etc.), and at the end of the section, we will deduct the subject s remaining permits and fees and in-tract costs to determine the subject s unimproved lot value. The subject properties sold with the assumption of Bond debt associated with Improvement Area No. 1 of the CFD. The balance of the comparable sales sold without CFD bond debt. As such, Attached Comparables 1, 2, 3 and 4 and Detached Comparables 1 and 2, the prior sales of the subject property are adjusted upward by the present value of the bond encumbrances on a per-lot basis. Seevers Jordan Ziegenmeyer 98
202 Property Rights Conveyed In transactions of real property, the rights being conveyed vary widely and have a significant impact on the sales price. As previously noted, the opinion of value in this report is based on a fee simple estate, subject only to the limitations imposed by the governmental powers of taxation, eminent domain, police power and escheat, as well as non-detrimental easements, community facility districts and conditions, covenants and restrictions (CC&Rs). All the comparables represent fee simple estate transactions. Therefore, adjustments for property rights are not necessary. Financing Terms In analyzing the comparables, it is necessary to adjust for financing terms that differ from market terms. Typically, if the buyer retained third party financing (other than the seller) for the purpose of purchasing the property, a cash price is presumed and no adjustment is required. However, in instances where the seller provides financing as a debt instrument, a premium may have been paid by the buyer for below-market financing terms or a discount may have been demanded by the buyer if the financing terms were above market. The premium or discounted price must then be adjusted to a cash equivalent basis. The comparable sales were cash to the seller transactions and do not require adjustments. Conditions of Sale Adverse conditions of sale can account for a significant discrepancy from the sales price actually paid compared to that of the market. This discrepancy in price is generally attributed to the motivations of the buyer and the seller. Certain conditions of sale are considered to be non-market and may include the following: a seller acting under duress, a lack of exposure to the open market, an inter-family or inter-business transaction for the sake of family or business interest, an unusual tax consideration, a premium paid for site assemblage, a sale at legal auction, or an eminent domain proceeding. All of the comparables were cash to the seller transactions with no unusual conditions of sale reported. No adjustments are warranted. Market Conditions Market conditions vary over time, but the date of this appraisal is for a specific point in time. In a dynamic economy one that is undergoing changes in the value of the dollar, interest rates and economic growth or decline extra attention needs to be paid to assess changing market conditions. Seevers Jordan Ziegenmeyer 99
203 Significant monthly changes in price levels can occur in several areas of a city, while prices in other areas remain relatively stable. Although the adjustment for market conditions is often referred to as a time adjustment, time is not the cause of the adjustment. All of the comparables transferred since October 2015 and are generally indicative of current market conditions; no adjustments are warranted. Physical Characteristics The physical characteristics of a property can impact the selling price. Those that may impact value include the following: Location/Community Appeal The appraised properties are located in the city of Dublin, which is considered a good location relative to other submarkets in the East Bay region. Overall community appeal is also considered good. As observed by the number of transactions within the past 24 months, Dublin is a highly desirable submarket for residential land and homes. In addition to the subject sales, all of the comparables are located in the same general area as the subject, including the nearby master planned communities of Wallis Ranch (Dublin) and Jordan Ranch (Pleasanton). No adjustments are warranted, as all of the comparables are located in similar areas. Number of Lots The benchmark lot category analyzed in this section of the report contains 75 lots. Generally, there is an inverse relationship between the number of lots and price per lot such that larger projects (with a greater number of lots) achieve a lower price per lot. Generally variances in per lot prices, all else being equal, are not observed in transactions between 50 and 250 lots. All of the comparable sales comprise transactions between 45 lots and 139 lots; therefore, no adjustments are warranted. Topography/Utility The subject and comparables have generally similar topography and utility and adjustments in this category do not apply. Lot Premiums/Discounts The subject and the comparables are anticipated to achieve a similar level of lot premiums (cul-desac, corner, inverted corner). None of the comparables benefit from view or significant open space premiums. Adjustments for this factor do not apply. Seevers Jordan Ziegenmeyer 100
204 Conclusion of Value (per lot) Sales Comparison Approach The market data set consists of various sales that are considered reasonable indicators of market value for the fee simple interest in the subject s four land development categories. After accounting for remaining site development costs, permits and fees and special taxes, the data set reflects an unadjusted (loaded lot price) range of $375,194 to $424,772 per attached lot and $504,096 to $678,833 per detached lot. Based upon the analysis presented, a ranking of the subject and the comparable sales is provided in the tables below and on the following page: Property Lot Price per Acre ATTACHED COMPARABLES Remaining Site Development Costs Permits and Fees Special Taxes Loaded Lot Value per Acre Sale 1 $271,913 $0 $86,283 $66,573 $424,769 SUBJECT: ATTACHED MEDIUM DENSITY LARGER HOMES $420,000 Sale 5 $222,222 $88,889 $105,000 $0 $416,111 Sale 4 $231,206 $35,000 $82,936 $66,573 $415,715 SUBJECT: ATTACHED MEDIUM DENSITY SMALLER HOMES $410,000 Sale 6 $279,000 $35,000 $95,000 $0 $409,000 Sale 3 $217,973 $36,035 $85,778 $66,573 $406,359 Sale 2 $197,677 $35,000 $82,492 $60,025 $375,194 SUBJECT: ATTACHED HIGH DENSITY HOMES $375,000 Comparables 1, 2, 3 and 4 are located in Dublin Crossing, within the subject s Improvement Area No. 1 (Phases 1A and 1B). As such, with most emphasis placed on the Dublin Crossing sales, loaded lot indicators of $375,000, $410,000 and $420,000 per lot are concluded for the attached high density homes, attached medium density smaller homes and attached medium density larger home categories, respectively. Deducting permits and fees ($82,492, $84,357 and $86,283 per lot, respectively) from the concluded loaded lot indicators suggest finished lot values of $290,000, $325,000 and $330,000, rounded. Seevers Jordan Ziegenmeyer 101
205 Property Lot Price per Acre DETACHED COMPARABLES Remaining Site Development Costs Permits and Fees Special Taxes Loaded Lot Value per Acre Sale 6 $566,833 $0 $112,000 $0 $678,833 Sale 7 $473,600 $35,000 $110,000 $0 $618,600 Sale 3 $437,500 $65,000 $110,000 $0 $612,500 Sale 2 $295,711 $112,358 $92,792 $79,457 $580,318 SUBJECT: DETACHED HOMES $560,000 Sale 1 $359,233 $0 $96,864 $79,457 $535,554 Sale 5 $377,698 $35,000 $105,000 $0 $517,698 Sale 8 $369,868 $35,000 $106,000 $0 $510,868 Sale 4 $338,096 $60,000 $106,000 $0 $504,096 Similar to the attached analysis, Comparables 1 and 2 are located in Improvement Area No. 1 (Phases 1A and 1B) of Dublin Crossing. With primary emphasis given to these transactions, and support from the balance of the data set, a loaded lot indicator of $560,000 per lot is concluded for the detached homes category. Deducting permits and fees ($94,828 per lot, on average) from the concluded loaded lot indicator suggests a finished lot value of $470,000, rounded ($560,000 - $94,828). Seevers Jordan Ziegenmeyer 102
206 RECONCILIATION OF IMPROVED (FINISHED) LOT VALUES The improved (finished) lot value conclusions indicated by the land residual analysis and sales comparison approach to value are presented below. Land Development Land Sales Category Residual Comparison Difference Conclusion Attached High Density Homes $279,000 /lot $290,000 /lot -3.79% $285,000 /lot Attached Medium Density - Smaller Homes $296,000 /lot $325,000 /lot -8.92% $310,000 /lot Attached Medium Density - Larger Homes $302,000 /lot $330,000 /lot -8.48% $315,000 /lot Detached Homes $466,000 /lot $470,000 /lot -0.85% $470,000 /lot In our opinion both the sales comparison approach and land residual analysis provide reliable indicators of market value for the subject lots, in light of the recent acquisition of the subject lots by merchant builders. Based on the analysis contained herein, and taking into consideration the estimates of value from each approach, our conclusions of improved (finished) lot value are $285,000 per attached high density home, $310,000 per attached medium density smaller home, $315,000 per attached medium density larger home and $470,000 per detached home. Seevers Jordan Ziegenmeyer 103
207 MARKET VALUATION BY OWNERSHIP The appraised properties represent the taxable land areas in Improvement Area No. 1, a portion of the Dublin Crossing master planned community, within the boundaries of City of Dublin CFD No (Dublin Crossing). More specifically, the appraised properties consist of 453 residential units (129 detached and 324 attached) held by one master developer and two separate merchant builders. In this section, the previously concluded market values will be allocated to each ownership group comprising the appraised properties in order to provide a market value of the appraised properties by ownership. A summary of the various ownership group holdings is restated in the following table. No. of Property Owner Neighborhood Type Units CalAtlantic Phase 1A: Union Attached 62 Phase 1A: Madison Attached 107 Phase 1B: Sunset Detached 60 Subtotal 229 Brookfield Phase 1A: Wilshire Attached 75 Phase 1A: Huntington (A) Detached 45 Phase 1B: Fillmore Attached 80 Subtotal 200 Dublin Crossing Land Company Phase 1A: Huntington (B) Detached 24 Subtotal 24 Total Number of Units Appraised within the District 453 The residential land comprising Phase 1A has, or will be, transferred to the merchant builders on a blue top lot basis, with the merchant builders obligated to complete remaining in-tract improvements; whereas, Phase 1B has transferred to the merchant builders as finished lots, with the master developer obligated to complete remaining infrastructure and in-tract development. The previous analysis derived estimates of market value for the various residential land components comprising Improvement Area No. 1 of the CFD, as if finished with all site development work complete. A deduction for remaining costs to complete (merchant builder obligations only) is considered in this section. We were provided remaining in-tract costs for Phase 1A held by Brookfield. The remaining in-tract costs for the lots held by CalAtlantic are estimated based on the Brookfield figures. As of the date of inspection (value), a number of permits and impact fees associated with residential construction within Improvement Area No. 1 of the CFD have been paid. Specifically, CalAtlantic Group, Inc. is under construction in the Union and Madison subdivisions within Phase 1A, and Brookfield Entities is under construction within the Wilshire and Huntington Seevers Jordan Ziegenmeyer 104
208 subdivisions of Phase 1A and has paid permits and impact fees within the Fillmore subdivision in Phase 1B. The contributory value of the permits and impact fees paid will be considered herein. Additionally, the estimates of market value provided herein are subject to the hypothetical condition various public improvements to be financed by the Bonds are in place. Therefore, for purposes of this analysis, it is presumed available construction fund proceeds from the sale of the Bonds will provide for the completion of infrastructure improvements and in-tract improvements obligated to be completed by the master developer (Dublin Crossing, LLC). In light of the fact the property owners have a number of lot(s) that could sell in bulk to one buyer within 12 months, which is supported by the recent acquisition of the subject land, no discounting is necessary. Based on the previous analysis, the estimates of market value (in bulk), by ownership, as well as the cumulative, or aggregate, value of Improvement Area No. 1 of the CFD, subject to the impact of the Lien of the Special Tax securing the Bonds, as of the date of value, May 17, 2017, are estimated below: No. of Market Value Costs to Impact Fees Conclusion of Property Owner Type Units per Unit/Lot Complete Extension Paid Value (Rd.) CalAtlantic Group, Inc. Phase 1A: Union Attached 62 $285,000 ($30,000) $15,810,000 $532,920 $16,340,000 Phase 1A: Madison Attached 107 $310,000 ($30,000) $29,960,000 $994,977 $30,950,000 Phase 1B: Sunset Detached 60 $470,000 $0 $28,200,000 $0 $28,200,000 Subtotal 229 $75,490,000 Brookfield Entities Phase 1A: Wilshire Attached 75 $310,000 ($26,014) $21,298,922 $1,361,820 $22,660,000 Phase 1A: Huntington (A) Detached 45 $470,000 ($58,025) $18,538,870 $1,286,483 $19,830,000 Phase 1B: Fillmore Attached 80 $315,000 $0 $25,200,000 $139,773 $25,340,000 Subtotal 200 $67,830,000 Dublin Crossing, LLC Phase 1A: Huntington (B) Detached 24 $470,000 ($58,025) $9,887,397 $9,890,000 Subtotal 24 $9,890,000 Aggregate (Cumulative) Value of Improvement Area No. 1 $153,210,000 Seevers Jordan Ziegenmeyer 105
209 SUMMARY AND CONCLUSION We have been requested to provide the market value, by ownership, and cumulative, or aggregate, value of the fee simple interest in the appraised properties comprising Improvement Area No. 1 of the City of Dublin Community Facilities District No (Dublin Crossing), under the assumptions and conditions cited in the attached report. The value estimates assume a transfer would reflect a cash transaction or terms that are considered to be equivalent to cash. The estimates are also premised on an assumed sale after reasonable exposure in a competitive market under all conditions requisite to a fair sale, with buyer and seller each acting prudently, knowledgeably, for their own self-interest and assuming neither is under duress. The value of the property in Improvement Area No. 1 of the CFD accounts for the impact of the lien of the Special Tax securing the Bonds. As a result of our analysis, it is our opinion the market value, by ownership, and cumulative, or aggregate, value of the fee simple interest in the appraised properties, as of the date of inspection (May 17, 2017), in accordance with the assumptions and conditions set forth in the attached document (please refer to pages 8 through 10), is: Property Owner No. of Conclusion of Type Units Value (Rd.) CalAtlantic Group, Inc. Phase 1A: Union Attached 62 $16,340,000 Phase 1A: Madison Attached 107 $30,950,000 Phase 1B: Sunset Detached 60 $28,200,000 Subtotal 229 $75,490,000 Brookfield Entities Phase 1A: Wilshire Attached 75 $22,660,000 Phase 1A: Huntington (A) Detached 45 $19,830,000 Phase 1B: Fillmore Attached 80 $25,340,000 Subtotal 200 $67,830,000 Dublin Crossing, LLC Phase 1A: Huntington (B) Detached 24 $9,890,000 Subtotal 24 $9,890,000 Aggregate (Cumulative) Value of Improvement Area No. 1 $153,210,000 Seevers Jordan Ziegenmeyer 106
210 EXPOSURE TIME Exposure time is the period a property interest would have been offered on the market prior to the hypothetical consummation of a sale at market value on the effective date of the appraisal. Marketing time reflects the time it might take to sell an interest in real property at its estimated market value during the period immediately after the effective date of the appraisal. Exposure time and marketing time may or may not be similar depending on whether market activity in the immediate future continues in the same manner as in the immediate past. Indications of the exposure time associated with a market value estimate are provided by the marketing times of sale comparables, interviews with participants in the market, and analysis of general economic conditions. Estimation of a future marketing time is more difficult, requiring forecasting and analysis of trends. The exposure time is estimated for the subject property below. As described above, exposure time is defined as the length of time a property interest would have been offered on the market prior to the hypothetical consummation of a sale at market value on the effective date of the appraisal. It is a retrospective estimate of time based on an analysis of past events assuming a competitive and open market. The residential land market throughout the Bay Area region has shown signs of recovery. A transfer of residential land has typically occurred within 12 months of exposure. Given the size of the subject properties, and the condition of the market, it is expected that if appropriately priced, the exposure time for the subject properties, assuming the properties (by ownership) are not marketed concurrently, would likely be approximately 12 months. Seevers Jordan Ziegenmeyer 107
211 APPENDIX
212 A GLOSSARY OF TERMS
213 GLOSSARY OF TERMS Unless otherwise noted, the following definitions are from The Dictionary of Real Estate Appraisal, 6th ed. (Chicago: Appraisal Institute, 2015). Aggregate of Retail Values: The sum of the separate and distinct market value opinions for each of the units in a condominium, subdivision development, or portfolio of properties, as of the date of valuation. The aggregate of retail values does not represent the value of all the units as though sold together in a single transaction; it is simply the total of the individual market value conclusions. As Is Market Value: The estimate of the market value of real property in its current physical condition, use, and zoning as of the appraisal date. Band of Investment: A technique in which the capitalization rates attributable to components of an investment are weighted and combined to derive a weighted-average rate attributable to the total investment. Bulk Value: The value of multiple units, subdivided plots, or properties in a portfolio as though sold together in a single transaction. Comparative-Unit Method: A method used to derive a cost estimate in terms of dollars per unit of area or volume based on known costs of similar structures that are adjusted for time and physical differences; usually applied to total building area. Cost Approach: A set of procedures through which a value indication is derived for the fee simple estate by estimating the current cost to construct a reproduction of (or replacement for) the existing structure, including an entrepreneurial incentive or profit; deducting depreciation from the total cost; and adding the estimated land value. Adjustments may then be made to the indicated value of the fee simple estate in the subject property to reflect the value of the property interest being appraised. Depreciation: In appraisal, a loss in property value from any cause; the difference between the cost of an improvement on the effective date of the appraisal and the market value of the improvement on the same date. Direct Capitalization: A method used to convert an estimate of a single year s income expectancy into an indication of value in one direct step, either by dividing the net income estimate by an appropriate capitalization rate or by multiplying the income estimate by an appropriate factor. Direct capitalization employs capitalization rates and multipliers extracted or developed from market data. Only one year s income is used. Yield and value changes are implied, but not explicitly identified. Discounted Cash Flow (DCF) Analysis: The procedure in which a discount rate is applied to a set of projected income streams and a reversion. The analyst specifies the quantity, variability, timing, and duration of the income streams and the quantity and timing of the reversion, and discounts each to its present value at a specified yield rate. Discount Rate: A rate of return on capital used to convert future payments or receipts into present value; usually considered to be a synonym for yield rate. Disposition Value: The most probable price that a specified interest in property should bring under the following conditions: 1) consummation of a sale within a specified time, which is shorter than the typical exposure time for such a property in that market; 2) the property is subjected to market conditions prevailing as of the date of valuation; 3) both the buyer and seller are acting prudently and knowledgeably; 4) the seller is under compulsion to sell; 5) the buyer
214 is typically motivated; 6) both parties are acting in what they consider to be their best interests; 7) an adequate marketing effort will be made during the exposure time; 8) payment will be made in cash in US dollars (or the local currency) or in terms of financial arrangements comparable thereto; 9) the price represents the normal consideration for the property sold, unaffected by special or creative financing or sales concessions granted by anyone associated with the sale. Easement: The right to use another s land for a stated purpose. Exposure Time: The estimated length of time that the property interest being appraised would have been offered on the market prior to the hypothetical consummation of a sale at market value on the effective date of the appraisal. External Obsolescence: A type of depreciation; a diminution in value caused by negative external influences and generally incurable on the part of the owner, landlord, or tenant. The external influence may be either temporary or permanent. Extraction: A method of estimating land value in which the depreciated cost of the improvements on an improved property is calculated and deducted from the total sale price to arrive at an estimated sale price for the land. Extraordinary Assumption: An assumption, directly related to a specific assignment, as of the effective date of the assignment results, which, if found to be false, could alter the appraiser s opinions or conclusions. Fair Market Value: The highest price on the date of valuation that would be agreed to by a seller, being willing to sell but under no particular or urgent necessity for so doing, nor obliged to sell, and a buyer, being ready, willing, and able to buy but under no particular necessity for so doing, each dealing with the other with full knowledge of all the uses and purposes for which the property is reasonably adaptable and available. (California Code of Civil Procedure, Section (a)) Fee Simple Estate: Absolute ownership unencumbered by any other interest or estate, subject only to the limitations imposed by the governmental powers of taxation, eminent domain, police power, and escheat. Floor Area Ratio (FAR): The relationship between the above-ground floor area of a building, as described by the zoning or building code, and the area of the plot on which it stands; in planning and zoning, often expressed as a decimal, e.g., a ratio of 2.0 indicates that the permissible floor area of a building is twice the total land area. Functional Obsolescence (Curable): An element of depreciation; a curable defect caused by a flaw in the structure, materials, or design, which can be practically and economically corrected. Functional Obsolescence (Incurable): An element of depreciation; a defect caused by a deficiency or superadequacy in the structure, materials, or design that cannot be practically or economically corrected as of the effective date of the appraisal. Highest and Best Use: The reasonably probable use of property that results in the highest value. The four criteria that the highest and best use must meet are legal permissibility, physical possibility, financial feasibility, and maximum productivity. Hypothetical Condition: A condition, directly related to a specific assignment, which is contrary to what is known by the appraiser to exist on the effective date of the assignment results, but is used for the purpose of analysis.
215 Income Capitalization Approach: Specific appraisal techniques applied to develop a value indication for a property based on its earning capability and calculated by the capitalization of property income. Leased Fee Interest: The ownership interest held by the lessor, which includes the right to receive the contract rent specified in the lease plus the reversionary right when the lease expires. Leasehold Interest: The right held by the lessee to use and occupy real estate for a stated term and under the conditions specified in the lease. Marketing Time: An opinion of the amount of time it might take to sell a real or personal property interest at the concluded market value level during the period immediately after the effective date of an appraisal. Marketing time differs from exposure time, which is always presumed to precede the effective date of an appraisal. Neighborhood: A group of complementary land uses; a congruous grouping of inhabitants, buildings, or business enterprises. Obsolescence: One cause of depreciation; an impairment of desirability and usefulness caused by new inventions, changes in design, improved processes for production, or external factors that make a property less desirable and valuable for a continued use; may be either functional or external. Prospective Opinion of Value: A value opinion effective as of a specified future date. The term does not define a type of value. Instead, it identifies a value opinion as being effective at some specific future date. An opinion of value as of a prospective date is frequently sought in connection with projects that are proposed, under construction, or under conversion to a new use, or those that have not yet achieved sellout or a stabilized level of long-term occupancy. Quantity Survey Method: A cost-estimating method in which the quantity and quality of all materials used and all categories of labor required are estimated and unit cost figures are applied to arrive at a total cost estimate for labor and materials. Replacement Cost: The estimated cost to construct, at current prices as of a specified date, a substitute for a building or other improvements, using modern materials and current standards, design, and layout. Reproduction Cost: The estimated cost to construct, at current prices as of the effective date of the appraisal, an exact duplicate or replica of the building being appraised, using the same materials, construction standards, design, layout, and quality of workmanship and embodying all the deficiencies, superadequacies, and obsolescence of the subject building. Sales Comparison Approach: The process of deriving a value indication for the subject property by comparing sales of similar properties to the property being appraised, identifying appropriate units of comparison, and making adjustments to the sale prices (or unit prices, as appropriate) of the comparable properties based on relevant, market-derived elements of comparison. Site Coverage Ratio: The gross area of the building footprint divided by the site area. Stabilized Occupancy: 1. The occupancy of a property that would be expected at a particular point in time, considering its relative competitive strength and supply and demand conditions at the time, and presuming it is priced at market rent and has had reasonable market exposure. A property is at stabilized occupancy when it is capturing its appropriate share of market demand. 2. An expression of the average or typical occupancy that would be expected for a property over a specified projection period or over its economic life.
216 Subdivision Development Method: A method of estimating land value when subdividing and developing a parcel of land is the highest and best use of that land. When all direct and indirect costs and entrepreneurial incentive are deducted from an estimate of the anticipated gross sales price of the finished lots (or the completed improvements on those lots), the resultant net sales proceeds are then discounted to present value at a marketderived rate over the development and absorption period to indicate the value of the land. Superadequacy: An excess in the capacity or quality of a structure or structural component; determined by market standards. Unit-In-Place Method: A cost-estimating method in which total building cost is estimated by adding together the unit costs for the various building components as installed; also called the segregated cost method. Yield Capitalization: A method used to convert future benefits into present value by 1) discounting each future benefit at an appropriate yield rate, or 2) developing an overall rate that explicitly reflects the investment s income pattern, holding period, value change, and yield rate. Yield Rate: A rate of return on capital, usually expressed as a compound annual percentage rate. A yield rate considers all expected property benefits, including the proceeds from sale at the termination of the investment.
217 B QUALIFICATIONS OF APPRAISER(S)
218 Kevin K. Ziegenmeyer, MAI, Partner Introduction Mr. Ziegenmeyer is a partner with Seevers Jordan Ziegenmeyer, a real estate appraisal firm that engages in a wide variety of real estate valuation and consultation assignments. In 1989, Mr. Ziegenmeyer began his career in real estate as a controller for a commercial and residential real estate development corporation. In 1991 he began appraising and continued to be involved in appraisal assignments covering a wide variety of properties, including office, retail, industrial, residential income and subdivisions throughout the Central Valley area of California, Northern Nevada, and within the Sacramento Metropolitan Area. Over the past several years, Mr. Ziegenmeyer has handled many of the firm s master-planned property appraisals and has developed expertise in the valuation of Community Facilities Districts and Assessment Districts. In early 2015, Mr. Ziegenmeyer obtained the Appraisal Institute's MAI designation. Professional Affiliations Appraisal Institute MAI Designation Certified General Real Estate Appraiser - State of California (No. AG013567) Education Academic: Bachelor of Science in Accounting, Azusa Pacific University, California Appraisal and Real Estate Courses: Standards of Professional Practice, Parts A, B & C Basic Valuation Procedures Real Estate Appraisal Principles Capitalization Theory and Techniques, Part A Advanced Income Capitalization Report Writing and Valuation Analysis Advanced Applications IRS Valuation Summit I & II 2008, 2009, 2010 & 2011 Economic Forecast Business Practices and Ethics Contemporary Appraisal Issues with Small Business Administration Financing General Demonstration Appraisal Report Writing Seminar 7-Hour National USPAP Update Course Valuation of Easements and Other Partial Interests 2009 Summer Conference Uniform Appraisal Standards for Federal Land Acquisitions 2008 Economic Update Valuation of Conservation Easements Subdivision Valuation (continued on next page..)
219 (..continued from previous page) 2005 Annual Fall Conference General Comprehensive Exam Module I, II, III & IV Advanced Income Capitalization Advanced Sales Comparison & Cost Approaches 2004 Central CA Market Update Computer-Enhanced Cash Flow Modeling Forecast 2000, 2001, 2002, 2003 & 2004 Land Valuation Assignments Land Valuation Adjustment Procedures Highest & Best Use and Market Analysis Entitlements, Land Subdivision & Valuation Real Estate Value Cycles El Dorado Hills Housing Symposium Federal Land Exchanges M & S Computer Cost-Estimating, Nonresidential Appraisal Experience General-purpose: Offices Retail Industrial Apartments Subdivisions Land Special-purpose: Athletic Clubs Churches Educational Facilities Restaurants Assisted-living Facilities Auto Sales and Service Lodging Facilities
220 Sample of Appraisal Experience Hunters Point Shipyard Phase I San Francisco, San Francisco County, California City of San Mateo Community Facilities District No (Bay Meadows) San Mateo, San Mateo County, California City of Redwood City Community Facilities District No (One Marina) Redwood City, San Mateo County, California County of San Joaquin Community Facilities District No (Vernalis Interchange) Vernalis, San Joaquin County, California This appraisal was completed for use by the developer for determination of possible refinancing of the Redevelopment Agency of the City and County of San Francisco Community Facilities District (CFD) No. 7 (Hunters Point Shipyard) Bonds. The appraised property comprises Phase I of the Hunters Point Shipyard redevelopment area, which is commonly referred to as the Hilltop and Hillside subdivisions, and comprises approximately gross acres of land, which includes 23.72± developable acres proposed for the construction of 1,142 residential units in a variety of attached singlefamily, townhouse and stacked residential units. Specifically, the Hilltop development contains 15.92± acres of land to be developed with 768 residential units, and the Hillside development contains 7.8± acres to be developed with 374 single-family residential units. In addition, Phase I will include 36.0± acres dedicated to parks and open space and 15.6± acres of streets and rights-of-way. This appraisal was completed for use in a land-secured financing associated with the development of 52± developable acres proposed for the development of 724,225 square feet of office space, approximately 85,374 square feet of retail space and 1,121 residential housing units, with 832 residential housing units being developed on the residential land component and the balance (289 units) to be developed as part of the mixed-use component. The report was prepared for the City of San Mateo Department of Finance. This appraisal was completed for use in a land-secured financing associated with the development of 16.62± acres proposed for the construction of 231 townhome and flat-style residential units within 24 detached buildings. The report was prepared for the City of Redwood City Department of Finance. This assignment involved the appraisal of approximately 3, gross acres of land comprising 40 separate Assessor s parcels devoted to (or intended for) aggregate mining operations by six independent mining operators, including Teichert, West Coast Aggregates, Granite, Knife River, DeSilva Gates and Cemex. The summary appraisal was completed for bond financing purposes, with the proceeds intended to finance the construction of a new interchange on State Route 132 at Bird Road, which is intended to enhance traffic operation safety at this intersection. This report was prepared for the County of San Joaquin.
221 Sample of Appraisal Experience (continued) Bickford Ranch Community Facilities District No Placer County, California El Dorado Hills Community Facilities District No (portion) El Dorado County, California Community Facilities District No. 16 West Sacramento, California Community Facilities District No. 17 West Sacramento, California Diablo Grande Community Facilities District No. 1 (Series 2002) Stanislaus County, California Plumas Lake Community Facilities District No Yuba County, California The hypothetical market valuation of a proposed master planned community that will include acres of land designated for 1,783 residential lots and a 9.7- acre commercial component. The appraisal will be used for bond underwriting purposes and was prepared for the County of Placer. This assignment involved the hypothetical cumulative or aggregate, valuation of a sizeable portion of the existing Serrano master planned community. The appraisal included 1,597 single-family residential lots, 382 custom single-family residential lots, acres of commercial land and 344 existing single-family residences. The appraisal will be used for bond underwriting purposes and was prepared for the County of El Dorado. This project involved the valuation of Bridgeway Lakes, a high-end 609-lot single-family residential community located in the Southport area of West Sacramento. Lot densities within the project varied from low and medium density to rural estate lots. This report was prepared for the City of West Sacramento. This assignment concerned the valuation of 252 singlefamily lots and 252 proposed multifamily units comprising the Parella residential community in the Southport area of West Sacramento. This report was prepared for the City of West Sacramento. The appraisal involved the valuation of a partially improved resort and master planned community offering 1,410 residential lots, multifamily land, commercial land, a hotel site, vineyards and two 18- hole championship golf courses. The appraisal was used for bond underwriting purposes and was prepared for Western Hills Water District. This appraisal included the valuation of a portion of the proposed, and partially improved, Plumas Lake Specific Plan area, and comprised 3,314 detached single-family residential lots. The appraisal was used for bond underwriting purposes and was prepared for the Olivehurst Public Utility District.
222 Sample of Appraisal Experience (continued) Brentwood Assessment District No Brentwood, Contra Costa County, California Patterson Gardens & Keystone Pacific Business Park Patterson, Stanislaus County, California Syrah Condominiums Sacramento, Sacramento County, California This assignment involved the valuation of an assessment district containing commercial and residential components comprising 5.66 acres of commercial land, 882 single-family residential lots and 15.8 acres of multifamily land. The appraisal was used for bond underwriting purposes and was prepared for the City of Brentwood. This appraisal involved the valuation of a 985-lot single-family residential master planned community that included residential, commercial and public use components, and a non-contingent 224-acre industrial park. This report was prepared for Bank of America. Syrah is a proposed 245-unit residential condominium development with dual phase valuations. This report was prepared for KeyBank.
223
224 Eric A. Segal, MAI, Partner Introduction Mr. Segal is a Certified General real estate appraiser with Seevers Jordan Ziegenmeyer, a real estate appraisal firm that engages in a wide variety of real estate valuation and consultation assignments. In 1998, Mr. Segal began his career in real estate as a research analyst/appraiser trainee for SJZ. By 1999, he began writing narrative appraisal reports covering a variety of commercial properties, with an emphasis on residential master planned communities and subdivisions. Today, Mr. Segal is a partner in the firm and is involved in appraisal assignments covering a wide variety of properties including office, retail, industrial, multifamily housing, master planned communities, and specializes in the appraisal of Mello-Roos and Assessment Districts for land-secured municipal financings. He has developed the experience and background necessary to deal with complex assignments covering an array of property types. Professional Affiliations Appraisal Institute MAI designation Certified General Real Estate Appraiser State of California (No. AG026558) Real Estate Appraiser - Certified General State of Nevada (No. A CG) Education Academic: Bachelor of Science in Business Administration (Concentrations in Finance and Real Estate & Land Use Affairs), California State University, Sacramento Appraisal and Real Estate Courses: Uniform Standards of Professional Appraisal Practice Appraisal Principles Basic Income Capitalization Highest & Best Use and Market Analysis Advanced Income Capitalization Report Writing and Valuation Analysis Appraisal Litigation Practice and Courtroom Management Computer Enhanced Cash Flow Modeling Advanced Sales Comparison & Cost Approaches Advanced Applications
225 Sample of Appraisal Experience Pleasant Valley Mixed-Use Development Visitacion Valley Neighborhood San Francisco, San Francisco County, California Hunters Point Shipyard Phase I San Francisco, San Francisco County, California Santa Barbara Palms Las Vegas, Clark County, Nevada City of Dixon Community Facilities District No (Parklane) Dixon, Solano County, California This appraisal was prepared for loan underwriting. The Pleasant Valley mixed-use development comprises approximately gross acres of land to be developed in three phases. Phase 1 will contain 568 residential units, a grocery store, in-line retail stores, office space, public park and pedestrian access to the Caltrain Bayshore station, which is located just east of the development. Phase 2 will contain approximately 556 residential units and an additional public park (Visitacion Park). Phase 3 will contain approximately 555 residential units. In total, Pleasant Valley is expected to be developed with 1,679 residential units of studio/loft, 1, 2, 3 and 4-bedroom unit types. This appraisal was completed for use by the developer for determination of possible refinancing of the Redevelopment Agency of the City and County of San Francisco Community Facilities District (CFD) No. 7 (Hunters Point Shipyard) Bonds. The appraised property comprises Phase I of the Hunters Point Shipyard redevelopment area, which is commonly referred to as the Hilltop and Hillside subdivisions, and comprises approximately gross acres of land, which includes 23.72± developable acres proposed for the construction of 1,142 residential units in a variety of attached singlefamily, townhouse and stacked residential units. Specifically, the Hilltop development contains 15.92± acres of land to be developed with 768 residential units, and the Hillside development contains 7.8± acres to be developed with 374 single-family residential units. In addition, Phase I will include 36.0± acres dedicated to parks and open space and 15.6± acres of streets and rights-of-way. Santa Barbara Palms is a 114-unit, age-restricted, lowincome housing apartment project in Las Vegas. The appraisal was prepared under Section 223(f) of the Federal Housing Administration (FHA) MAP Program for a 223(f) Refinance for Capital One Multifamily Finance, LLC. This assignment involved the appraisal of gross acres of land approved for the development of 401 singlefamily homes under construction by Brookefield Homes. The proposed Bond proceeds were to be used to reimburse the developer for infrastructure improvements. The estimate of market value accounted for the impact of the lien of the special taxes securing the proposed Bonds, and the estimated value was subject to a hypothetical condition such improvements were in place and available for use.
226 Sample of Appraisal Experience (continued) City of San Mateo Community Facilities District No (Bay Meadows) San Mateo, San Mateo County, California City of Redwood City Community Facilities District No (One Marina) Redwood City, San Mateo County, California County of San Joaquin Community Facilities District No (Vernalis Interchange) Vernalis, San Joaquin County, California HUD 223(f) Apartment Portfolio San Francisco, San Francisco County, California The Parkway & Quinto Ranch Santa Nella, Merced County, California This appraisal was completed for use in a land-secured financing associated with the development of 52± developable acres proposed for the development of 724,225 square feet of office space, approximately 85,374 square feet of retail space and 1,121 residential housing units, with 832 residential housing units being developed on the residential land component and the balance (289 units) to be developed as part of the mixed-use component. The report was prepared for the City of San Mateo Department of Finance. This appraisal was completed for use in a land-secured financing associated with the development of 16.62± acres proposed for the construction of 231 townhome and flat-style residential units within 24 detached buildings. The report was prepared for the City of Redwood City Department of Finance. This assignment involved the appraisal of approximately 3, gross acres of land comprising 40 separate Assessor s parcels devoted to (or intended for) aggregate mining operations by six independent mining operators, including Teichert, West Coast Aggregates, Granite, Knife River, DeSilva Gates and Cemex. The summary appraisal was completed for bond financing purposes, with the proceeds intended to finance the construction of a new interchange on State Route 132 at Bird Road, which is intended to enhance traffic operation safety at this intersection. This report was prepared for the County of San Joaquin. This appraisal assignment involved the appraisal of nine multifamily properties in San Francisco containing between seven and 50 units, as well as mixed-use properties including ground floor retail tenants. The selfcontained appraisals were completed in compliance with Federal regulatory requirements and guidelines that may apply as well as the requirements of the Federal Housing Administration (FHA) MAP Program for a 223(f) Refinance. This report was prepared for Column Guaranteed, LLC. This appraisal involved the valuation of a 1,464-lot singlefamily residential master planned community that included residential, commercial and public use components, and a non-contingent 1,644-acre ranch subject to a conservation easement. This report was prepared for IndyMac Bank.
227 Sample of Appraisal Experience (continued) Reclamation District No. 17 Mossdale Tract (portion) County of San Joaquin, California Bickford Ranch Community Facilities District No Placer County, California El Dorado Hills Community Facilities District No (portion) El Dorado County, California Diablo Grande Community Facilities District No. 1 (Series 2002) Stanislaus County, California Plumas Lake Community Facilities District No Yuba County, California Patterson Gardens & Keystone Pacific Business Park Patterson, Stanislaus County, California The appraised properties represented a portion of Reclamation District No. 17 identified as vacant residential, vacant commercial and vacant industrial land, and excluded those properties within the boundaries of the District zoned as agricultural and public use, and those properties with an assessed improvement value on the most recent property tax roll. Reclamation District No. 17 (Mossdale Tract) is located in San Joaquin County and contains approximately 16, acres of land comprising approximately 13,335 assessor s parcels. This report was prepared for Reclamation District No. 17. The hypothetical market valuation of a proposed master planned community that will include acres of land designated for 1,783 residential lots and a 9.7-acre commercial component. The appraisal will be used for bond underwriting purposes and was prepared for the County of Placer. This assignment involved the hypothetical cumulative, or aggregate, valuation of a sizeable portion of the existing Serrano master planned community. The appraisal included 1,597 single-family residential lots, 382 custom single-family residential lots, acres of commercial land and 344 existing single-family residences. The appraisal will be used for bond underwriting purposes and was prepared for the County of El Dorado. The appraisal involved the valuation of a partially improved resort and master planned community offering 1,410 residential lots, multifamily land, commercial land, a hotel site, vineyards and two 18-hole championship golf courses. The appraisal was used for bond underwriting purposes and was prepared for Western Hills Water District. This appraisal included the valuation of a portion of the proposed, and partially improved, Plumas Lake Specific Plan area, and comprised 3,314 detached single-family residential lots. The appraisal was used for bond underwriting purposes and was prepared for the Olivehurst Public Utility District. This appraisal involved the valuation of a 985-lot singlefamily residential master planned community that included residential, commercial and public use components, and a non-contingent 224-acre industrial park. This report was prepared for Bank of America.

228
229 Sara Gilbertson, Appraiser Introduction Ms. Gilbertson is a licensed appraiser with Seevers Jordan Ziegenmeyer, a real estate appraisal firm that engages in a wide variety of real estate valuation and consultation assignments. She joined the firm in April 2011 after completing her bachelor's degree at California State University, Sacramento and has been writing narrative appraisal reports for a variety of commercial properties. She is now involved in appraisal assignments covering office, retail, industrial, land and mixed-use properties, as well as special-use properties including self-storage facilities, hotels and mobile home parks. Ms. Gilbertson has developed the experience and background necessary to deal with complex assignments covering an array of property types. Professional Affiliations Certified General Real Estate Appraiser - State of California (No ) Education Academic: Bachelor of Science in Business Administration (Concentration in Real Estate and Land Development), California State University, Sacramento Appraisal Institute Courses: Basic Appraisal Principles Basic Appraisal Procedures Uniform Standards of Professional Appraisal Practice Real Estate Finance and Statistics and Valuation Modeling Sales Comparison Approach Report Writing and Case Studies Market Analysis and Highest and Best Use Site Valuation and Cost Approach Basic Income Capitalization Expert Witness for Commercial Appraisers Commercial Appraisal Review
230 Sample of Appraisal Experience 27-Room Hotel Stockton, California 76,971 SF Multi-Building Office Complex Sacramento, California 120,944 SF Office Building & 6,000 SF Bank Building Modesto, California 14,703 SF Retail Building (Proposed) Escalon, California Commercial Laundry Facility Gilroy, California Mobile Home Park Lakeport, California Mixed-Use Commercial Development (Proposed) Fresno, California In this assignment for Wells Fargo Bank, we estimated the market value of the going concern of 27-room, limited service hotel. The market value of the going concern was also allocated between real property, FF&E (personal property), and business enterprise. This appraisal involved the valuation of a three, multi-tenant office buildings. In this assignment, we estimated the market value of the leased fee interest in the property as of a current inspection date, and the prospective market value upon stabilized occupancy. The as-is and prospective values were provided for each building, as well as in bulk. The client for this assignment was Mechanics Bank. In this assignment for Bank of America, the subject property consisted of a five-story medical office building and a free standing bank branch building. We estimated the hypothetical market value of the property as if stabilized, the as-is market value, and the prospective market value upon stabilized occupancy. This report involved the valuation of a commercial-zoned site proposed for development of a single tenant retail building with a credit tenant in place (build-to-suit). The valuation scenarios included the prospective market value (leased fee interest) upon completion of construction and at stabilized occupancy, the hypothetical market value (leased fee interest) at completion of construction and stabilized occupancy, and the as-is market value of the land (fee simple interest). The client for this assignment was Wells Fargo. This report involved the valuation of a two-building commercial laundry facility. We estimated the retrospective market value of the leased fee interest. The client was Libitzky Property Companies. This assignment involved the valuation of multifamily project consisting of 19 income producing mobile home lots and two for-ret duplexes (or four apartment units). The valuation involved the prospective market value upon stabilized occupancy and the as-is market value which accounted for the renovation of the duplex units and deferred maintenance. This appraisal involved the valuation of an acre portion of master planned community proposed for retail, office, and multifamily development, as well as a plaza, lake, and recreation area. The valuation of multifamily parcels included some second level ( air rights ) area. We estimated the as-is market value, hypothetical market values assuming all backbone infrastructure is in place in bulk, by parcel and the aggregate retail value. This report was prepared for Wells Fargo.

231
232 (THIS PAGE INTENTIONALLY LEFT BLANK)
233 APPENDIX C SUMMARY OF CERTAIN PROVISIONS OF THE FISCAL AGENT AGREEMENT The following contains a summary of certain provisions of the Fiscal Agent Agreement not otherwise described in the Official Statement. Reference is made to the full text of Fiscal Agent Agreement, a copy of which is available from the City, for the complete terms thereof. Certain Definitions "Administrative Expenses" means costs directly related to the administration of the CFD including but not limited to: the costs of computing the Special Taxes and preparing the annual Special Tax collection schedules (whether by a City employee or consultant or both) and the costs of collecting the Special Taxes (whether on the secured property tax roll of the County or otherwise); the costs of remitting the Special Taxes to the Fiscal Agent; costs of the Fiscal Agent (including its legal counsel) in the discharge of its duties under the Agreement; the costs of the City or its consultants relating to the annexation of property to the CFD; the costs of the City or its designee of complying with the disclosure provisions of the Act and the Agreement, including those related to public inquiries regarding the Special Tax and both initial and continuing disclosures; the costs of the City or its designee related to an appeal of the Special Tax; any amounts required to be rebated to the federal government; an allocable share of the salaries of the City staff directly related to the foregoing and a proportionate amount of City general administrative overhead related thereto. Administrative Expenses shall also include amounts advanced by the City for any administrative purpose of the CFD, including costs related to prepayments of Special Taxes, recordings related to such prepayments and satisfaction of Special Taxes, amounts advanced to ensure maintenance of tax exemption of interest on the Bonds, and the costs of prosecuting foreclosure on account of delinquent Special Taxes. "Administrative Services Director" means the official of the City having that title or the official having equivalent duties, or such official's designee, who acts in the capacity as the chief financial officer of the City. "Administrator" means the Administrative Services Director or other official of the City designated to administer the Special Tax in accordance with the Rate and Method; initially, the Administrative Services Director shall perform the duties of the Administrator under the Agreement and the Rate and Method. "Agreement" or Fiscal Agent Agreement means the Fiscal Agent Agreement, as it may be amended or supplemented from time to time by any Supplemental Agreement adopted pursuant to the provisions hereof. "Annual Debt Service" means, for each Bond Year, the sum of (i) the interest due on the Outstanding Bonds in such Bond Year, assuming that the Outstanding Bonds are retired as scheduled, and (ii) the principal amount of the Outstanding Bonds due in such Bond Year (including any mandatory sinking payment due in such Bond Year). "Auditor" means the Auditor/Controller of the County, or such other official at the County who is responsible for preparing property tax bills. "Authorized Officer" means the City Manager, the Assistant City Manager, the Administrative Services Director or any other officer or employee authorized by the City Council C-1
234 of the City or by an Authorized Officer to undertake an action referenced in the Agreement as required to be undertaken by an Authorized Officer. "Bond Counsel" and "Bond and Disclosure Counsel" means Jones Hall, A Professional Law Corporation or any other attorney or firm of attorneys acceptable to the City and nationally recognized for expertise in rendering opinions as to the legality and tax-exempt status of securities issued by public entities. "Bond" or "Bonds" means the 2017 Bonds and, if the context requires, any Parity Bonds, at any time Outstanding under the Agreement or any Supplemental Agreement and all of which are secured by and are payable from proceeds of the Special Taxes of Improvement Area No. 1. "Bond Year" means the one-year period beginning on September 2nd in each year and ending on September 1 in the following year, except that the first Bond Year shall begin on the Closing Date and shall end on September 1, "Business Day" means any day other than (i) a Saturday or a Sunday or (ii) a day on which banking institutions in the state in which the Fiscal Agent has its principal corporate trust office are authorized or obligated by law or executive order to be closed. "City Attorney" means any attorney or firm of attorneys employed by the City in the capacity of City attorney. "Closing Date" means the date upon which there is a physical delivery of the 2017 Bonds in exchange for the amount representing the purchase price of the 2017 Bonds by the Original Purchaser. "Costs of Issuance" means items of expense payable or reimbursable directly or indirectly by the City and related to the authorization, sale, delivery and issuance of the 2017 Bonds, which items of expense shall include, but not be limited to, printing costs, costs of reproducing and binding documents, closing costs, appraisal costs, filing and recording fees, fees and expenses of counsel to the City, initial fees and charges of the Fiscal Agent including its first annual administration fees and its legal fees and charges, including the allocated costs of in-house attorneys, expenses incurred by the City in connection with the issuance of the 2017 Bonds, bond (underwriter s) discount, legal fees and charges, including those of Bond and Disclosure Counsel, financial consultant s fees, charges for execution, authentication, transportation and safekeeping of the 2017 Bonds and any other costs, charges and fees of a like nature. "Costs of Issuance Fund" means the fund designated the "City of Dublin Community Facilities District No (Dublin Crossing) Improvement Area No. 1 Special Tax Bonds, Costs of Issuance Fund" established and administered under the Agreement. "Dated Date" means the dated date of the 2017 Bonds, which is the Closing Date. "Debt Service" means the scheduled amount of interest and amortization of principal payable on the 2017 Bonds under the Agreement and the scheduled amount of interest and amortization of principal payable on any Parity Bonds during the period of computation, in each case excluding amounts scheduled during such period which relate to principal which has been retired before the beginning of such period. C-2
235 "Depository" means (a) initially, DTC, and (b) any other Securities Depository acting as Depository for book-entry under the Agreement. "Developer" means Dublin Crossing, LLC, and its successors and assigns. "Director of Public Works" means the official of the City having that title, or such official s designee. "Fair Market Value" means with respect to Permitted Investments, the price at which a willing buyer would purchase the investment from a willing seller in a bona fide, arm s length transaction (determined as of the date the contract to purchase or sell the investment becomes binding) if the investment is traded on an established securities market (within the meaning of section 1273 of the Tax Code) and, otherwise, the term "Fair Market Value" means the acquisition price in a bona fide arm s length transaction (as referenced above) if (i) the investment is a certificate of deposit that is acquired in accordance with applicable regulations under the Tax Code, (ii) the investment is an agreement with specifically negotiated withdrawal or reinvestment provisions and a specifically negotiated interest rate (for example, a guaranteed investment contract, a forward supply contract or other investment agreement) that is acquired in accordance with applicable regulations under the Tax Code, (iii) the investment is a United States Treasury Security State and Local Government Series that is acquired in accordance with applicable regulations of the United States Bureau of Public Debt, or (iv) any commingled investment fund in which the City and related parties do not own more than a ten percent (10%) beneficial interest if the return paid by such fund is without regard to the source of the investment. "Federal Securities" means: (a) any direct general obligations of the United States of America (including obligations issued or held in book entry form on the books of the Department of the Treasury of the United States of America), the payment of principal of and interest on which are unconditionally and fully guaranteed by the United States of America; and (b) any obligations the principal of and interest on which are unconditionally guaranteed by the United States of America. "Fiscal Agent" means U.S. Bank National Association, the Fiscal Agent appointed by the City and acting as an independent fiscal agent with the duties and powers herein provided, its successors and assigns, and any other corporation or association which may at any time be substituted in its place, as provided in the Agreement. "Fiscal Year" means the twelve-month period extending from July 1 in a calendar year to June 30 of the succeeding year, both dates inclusive. "Improvement Area No. 1 Value" means the market value, as of the date of the appraisal described below and/or the date of the most recent County real property tax roll, as applicable, of all parcels of real property in Improvement Area No. 1 subject to the levy of the Special Taxes and not delinquent in the payment of any Special Taxes then due and owing, including with respect to such nondelinquent parcels the value of the then existing improvements and any facilities to be constructed or acquired with any amounts then on deposit in the Improvement Fund (and any subaccounts therein) and with the proceeds of any proposed series of Parity Bonds, as determined with respect to any parcel or group of parcels by reference to (i) an appraisal performed within six (6) months of the date of issuance of any proposed Parity Bonds by an MAI appraiser (the "Appraiser") selected by the City, or (ii) in the alternative, the assessed value of all such nondelinquent parcels and improvements thereon as shown on the then current County real property tax roll available to the Administrative Services Director. It is expressly acknowledged C-3
236 that, in determining the Improvement Area No. 1 Value, the City may rely on an appraisal to determine the value of some or all of the parcels in Improvement Area No. 1 and/or the most recent County real property tax roll as to the value of some or all of the parcels in Improvement Area No. 1. Neither the City nor any Authorized Officer shall be liable to the Owners, the Original Purchaser or any other person or entity in respect of any appraisal provided for purposes of this definition or by reason of any exercise of discretion made by any Appraiser pursuant to this definition. "Improvement Fund" means the fund designated "City of Dublin Community Facilities District No (Dublin Crossing) Improvement Area No. 1 Improvement Fund," together with the Bond Proceeds Subaccount and Special Tax Proceeds Subaccount, established under the Agreement. "Independent Financial Consultant" means any consultant or firm of such consultants appointed by the City or the Administrative Services Director, and who, or each of whom: (i) is judged by the Administrative Services Director to have experience in matters relating to the issuance and/or administration of bonds under the Act; (ii) is in fact independent and not under the domination of the City; (iii) does not have any substantial interest, direct or indirect, with or in the City, or any owner of real property in the CFD, or any real property in the CFD; and (iv) is not connected with the City as an officer or employee of the City, but who may be regularly retained to make reports to the City. "Information Services" means (i) the Municipal Securities Rulemaking Board s Electronic Municipal Market Access website and (ii) in accordance with then current guidelines of the Securities and Exchange Commission, such other addresses and/or such services providing information with respect to called bonds as the City may designate in an Officer s Certificate delivered to the Fiscal Agent. "Maximum Annual Debt Service" means the largest Annual Debt Service for any Bond Year after the calculation is made through the final maturity date of any Outstanding Bonds. "Officer s Certificate" means a written certificate of the City signed by an Authorized Officer of the City. "Ordinance" means any ordinance of the City Council of the City levying the Special Taxes, including but not limited to Ordinance 3-15 adopted by the Council on June 16, "Original Purchaser" means Prager & Co., LLC, the first purchaser of the 2017 Bonds from the City. "Outstanding," when used as of any particular time with reference to Bonds, means (subject to the provisions of the Agreement) all Bonds except (i) Bonds theretofore canceled by the Fiscal Agent or surrendered to the Fiscal Agent for cancellation; (ii) Bonds paid or deemed to have been paid within the meaning of the Agreement; and (iii) Bonds in lieu of or in substitution for which other Bonds shall have been authorized, executed, issued and delivered by the City under the Agreement or any Supplemental Agreement. "Owner" or "Bondowner" means any person who shall be the registered owner of any Outstanding Bond. C-4
237 "Parity Bonds" means bonds issued by the City for the CFD in addition to the 2017 Bonds and payable on a parity with any then Outstanding Bonds pursuant to the Agreement. "Permitted Investments" means any of the following which at the time of investment are legal investments under the laws of the State and the City's investment policies for the moneys proposed to be invested therein (the Fiscal Agent is entitled to conclusively rely on written investment direction of the City as a determination by the City that such investment is a legal investment), but only to the extent that the same are acquired at Fair Market Value: (a) Federal Securities; (b) bonds, debentures, notes or other evidence of indebtedness issued or guaranteed by any of the following federal agencies and provided such obligations are backed by the full faith and credit of the United States of America (stripped securities are only permitted if they have been stripped by the agency itself): (i) direct obligations or fully guaranteed certificates of beneficial ownership of the U.S. Export-Import Bank; (ii) certificates of beneficial ownership of the Farmers Home Administration; (iii) obligations of the Federal Financing Bank; (iv) debentures of the Federal Housing Administration; (v) participation certificates of the General Services Administration; (vi) guaranteed mortgage-backed bonds or guaranteed passthrough obligations of the Government National Mortgage Association; (vii) guaranteed Title XI financings of the U.S. Maritime Administration; and (viii) project notes, local authority bonds, new communities debentures and U.S. public housing notes and bonds of the U.S. Department of Housing and Urban Development; (c) bonds, debentures, notes or other evidence of indebtedness issued or guaranteed by any of the following non-full faith and credit U.S. government agencies (stripped securities are only permitted if they have been stripped by the agency itself): (i) senior debt obligations of the Federal Home Loan Bank System; (ii) participation certificates and senior debt obligations of the Federal Home Loan Mortgage Corporation; (iii) mortgage-backed securities and senior debt obligations of the Federal National Mortgage Association (excluding stripped mortgage securities which are valued greater than par on the portion of unpaid principal); (iv) senior debt obligations of the Student Loan Marketing Association; (v) obligations (but only the interest component of stripped obligations) of the Resolution Funding Corporation; and (vi) consolidated system-wide bonds) and notes of the Farm Credit System; (d) money market funds (including funds of the Fiscal Agent or its affiliates) registered under the Federal Investment Company Act of 1940, whose shares are registered under the Federal Securities Act of 1933, and having a rating by S&P of "AAAm-G", "AAAm", or "AAm," or, if rated by Moody s, rated "Aaa-mf", "Aa-mf' or "A-mf"; (e) certificates of deposit secured at all times by collateral described in (a) or (b) above, which have a maturity of one year or less, which are issued by commercial banks, savings and loan associations or mutual savings banks, and such collateral must be held by a third party, and the Fiscal Agent must have a perfected first security interest in such collateral; (f) certificates of deposit, savings accounts, deposit accounts or money market deposits (including those of the Fiscal Agent and its affiliates) which are fully insured by the Federal Deposit Insurance Corporation; (g) investment agreements, including guaranteed investment contracts, forward purchase agreements and Reserve Account put agreements, which are general obligations of an C-5
238 entity whose long term debt obligations, or claims paying ability, respectively, is rated in one of the two highest rating categories by Moody's or S&P; (h) commercial paper rated, at the time of purchase, "Prime-1" by Moody's and "A 1" or better by S&P; (i) bonds or notes issued by any state or municipality which are rated by Moody's and S&P in one of the two highest rating categories assigned by such agencies; (j) deposit accounts, federal funds or bankers acceptances with a maximum term of one year of any bank which has an unsecured, uninsured and unguaranteed obligation rating of "Prime-1" or "A3" or better by Moody's and "A-1" or "A" or better by S&P; (k) repurchase agreements which provide for the transfer of securities from a dealer bank or securities firm (seller/borrower) to the Fiscal Agent and the transfer of cash from the Fiscal Agent to the dealer bank or securities firm with an agreement that the dealer bank or securities firm will repay the cash plus a yield to the Fiscal Agent in exchange for the securities at a specified date, which satisfy the following criteria: (i) repurchase agreements must be between the Fiscal Agent and (A) a primary dealer on the Federal Reserve reporting dealer list which falls under the jurisdiction of the Securities Investors Protection Corporation which are rated "A" or better by Moody's and S&P, or (B) a bank rated "A" or better by Moody's and S&P; (ii) the written repurchase agreement contract must include the following: (A) securities acceptable for transfer, which may be direct U.S. government obligations, or federal agency obligations backed by the full faith and credit of the U.S. government; (B) the term of the repurchase agreement may be up to 30 days; (C) the collateral must be delivered to the Fiscal Agent or a third party acting as agent for the Fiscal Agent simultaneous with payment (perfection by possession of certificated securities); (D) the Fiscal Agent must have a perfected first priority security interest in the collateral; (E) the collateral must be free and clear of third-party liens and, in the case of a broker which falls. under the jurisdiction of the Securities Investors Protection Corporation, are not subject to a repurchase agreement or a reverse repurchase agreement; (F) failure to maintain the requisite collateral percentage, after a two-day restoration period, will require the Fiscal Agent to liquidate the collateral; (G) the securities must be valued weekly, marked-to-market at current market price plus accrued interest and the value of collateral must be equal to 104% of the amount of cash transferred by the Fiscal Agent to the dealer bank or securities firm under the repurchase agreement plus accrued interest (unless the securities used as collateral are obligations of the Federal National Mortgage Association or the Federal Home Loan Mortgage Corporation, in which case the collateral must be equal to 105% of the amount of cash transferred by the Fiscal Agent to the dealer bank or securities firm under the repurchase agreement plus accrued interest). If the value of securities held as collateral falls below 104% of the value of the cash transferred by the Fiscal Agent, then additional cash and/or acceptable securities must be transferred; and (iii) a legal opinion must be delivered to the Fiscal Agent to the effect that the repurchase agreement meets guidelines under state law for legal investment of public funds; (l) the Local Agency Investment Fund of the State of California, created pursuant to Section of the California Government Code, to the extent the Fiscal Agent C-6
239 is authorized to register such investment in its name; and (k) the California Asset Management Program. "Principal Office" means such corporate trust office of the Fiscal Agent as may be designated from time to time by written notice from the Fiscal Agent to the City, initially being at the address set forth in the Agreement, or such other office designated by the Fiscal Agent from time to time; except that with respect to presentation of Bonds for payment or for registration of transfer and exchange such term shall mean the office or agency of the Fiscal Agent at which, at any particular time, its corporate trust agency business shall be conducted, initially in San Francisco, California. "Proceeds" when used with reference to the Bonds, means the face amount of the Bonds, plus any accrued interest and original issue premium, less any original issue and/or underwriter s discount. "Project" means those items described as the "Authorized CFD Public Improvements" in the Resolution of Intention. "Rating Agency" means any nationally recognized rating agency. "Refunding Bonds" means bonds issued by the City for the CFD, the net proceeds of which are used to refund all or a portion of the then-outstanding Bonds; provided that (i) the total interest cost to maturity on the refunding bonds plus the principal amount of the refunding bonds is less than the total interest cost to maturity on the Bonds to be refunded plus the principal amount of the Bonds to be refunded and (ii) the final maturity of the Refunding Bonds is not later than the final maturity of the Bonds being refunded. "Reserve Requirement" means, as of the date of any calculation, an amount equal to the lesser of (i) Maximum Annual Debt Service on the Outstanding Bonds, (ii) 125% of average Annual Debt Service on the Outstanding Bonds and (iii) 10% of the original principal amount of the respective Bonds covered by the Reserve Fund (or the issue price of the respective Bonds excluding accrued interest, if the net original issue discount or premium is less than 98% or more than 102% of the principal amount of the respective Bonds), as calculated by the City; provided, that in no event shall the City, in connection with the issuance of Parity Bonds covered by the Reserve Fund pursuant to a Supplemental Agreement be obligated to deposit an amount in the Reserve Fund which is in excess of the amount permitted by the applicable provisions of the Code to be so deposited from the proceeds of tax-exempt bonds without having to restrict the yield of any investment purchased with any portion of such deposit and, in the event the amount of any such deposit into the Reserve Fund is so limited, the Reserve Requirement shall, in connection with the issuance of such Parity Bonds, be increased only by the amount of such deposit as permitted by the Code. "Resolution of Formation" means Resolution No adopted by the Council on June 2, 2015, forming the CFD "Resolution of Intention" means Resolution No adopted by the Council on April 21, C-7
240 "Securities Depositories" means DTC and, in accordance with then current guidelines of the Securities and Exchange Commission, such other securities depositories as the City may designate in an Officer s Certificate delivered to the Fiscal Agent. "Special Tax Prepayments" means the proceeds of any Special Tax prepayments received by the City with respect to Improvement Area No. 1, as calculated pursuant to the Rate and Method, less any administrative fees or penalties collected as part of any such prepayment. "Supplemental Agreement" means an agreement the execution of which is authorized by a resolution which has been duly adopted by the City Council under the Act and which agreement is amendatory of or supplemental to the Agreement, but only if and to the extent that such agreement is specifically authorized under the Agreement. "Tax Code" means the Internal Revenue Code of 1986 as in effect on the date of issuance of the Bonds or (except as otherwise referenced herein) as it may be amended to apply to obligations issued on the date of issuance of the Bonds, together with applicable temporary and final regulations promulgated, and applicable official public guidance published, under the Tax Code. "2017 Bonds" means the City of Dublin Community Facilities District No (Dublin Crossing) Improvement Area No. 1 Special Tax Bonds, Series "Verification Agent" means an individual or firm of individuals appointed by the City or the Administrative Services Director to advise the City with respect to the sufficiency of cash and/or Federal Securities, as provided in the sections of the Agreement relating to the discharge of the Agreement, and who, or each of whom, (i) is judged by the Administrative Services Director to have experience in matters relating to such determinations; (ii) is in fact independent and not under the domination of the City; (iii) does not have any substantial interest, direct or indirect, with or in the City, or any owner of real property in the CFD, or any real property in the CFD; and (iv) is not connected with the City as an officer or employee of the City, but who may be regularly retained to make reports to the City. Bond Fund Creation of Bond Fund, and Accounts Therein. The Bond Fund is established as a separate fund to be held by the Fiscal Agent to the credit of which deposits shall be made as required by the Agreement. Moneys in the Bond Fund shall be held by the Fiscal Agent for the benefit of the Owners of the Bonds, and shall be disbursed for the payment of the principal of, and interest and any premium on, the Bonds as provided below. Within the Bond Fund there is hereby established a separate account designated as the "Capitalized Interest Account" to be held by the Fiscal Agent for the benefit of the City and the Owners of the 2017 Bonds into which shall be deposited the amount specified in the Agreement. Amounts on deposit in the Capitalized Interest Account shall be used and withdrawn by the Fiscal Agent solely for the payment of interest on the 2017 Bonds first becoming due. When the amount in the Capitalized Interest Account is fully expended for the payment of interest, the account shall be closed. There is also created in the Bond Fund a separate account to be held by the Fiscal Agent, designated as the "Special Tax Prepayments Account," to the credit of which deposits shall be made as provided in the Agreement. Disbursements. At least ten Business Days before each Interest Payment Date, the Fiscal Agent shall notify the Administrative Services Director in writing as to the principal and premium, C-8
241 if any, and interest due on the 2017 Bonds on the next Interest Payment Date (including principal and premium, if any, due as a result of (i) scheduled maturity of 2017 Bonds, (ii) optional redemption of 2017 Bonds, (iii) scheduled mandatory partial redemption of 2017 Bonds, or (iv) redemption of 2017 Bonds from proceeds of Special Tax Prepayments. On each Interest Payment Date, the Fiscal Agent shall withdraw from the Bond Fund and pay to the Owners of the 2017 Bonds the principal of, and interest and any premium, due and payable on such Interest Payment Date on the Bonds. At least three Business Days prior to each Interest Payment Date, the Fiscal Agent shall determine if the balance then on deposit in the Bond Fund is sufficient to pay the debt service due on the 2017 Bonds on the next Interest Payment Date. In the event that the balance in the Bond Fund is insufficient for such purpose, the Fiscal Agent promptly shall notify the Administrative Services Director by telephone (and confirm in writing) of the amount of the insufficiency. In the event that the balance in the Bond Fund is insufficient for the purpose set forth in the preceding paragraph with respect to any Interest Payment Date, the Fiscal Agent shall withdraw from the Reserve Fund, in accordance with the provisions regarding the same, to the extent of any funds or Permitted Investments therein, amounts to cover the amount of such Bond Fund insufficiency. Amounts so withdrawn from the Reserve Fund shall be deposited in the Bond Fund. If, after the foregoing transfers, there are insufficient funds in the Bond Fund to make the payments provided for above, the Fiscal Agent shall apply the available funds first to the payment of interest on the 2017 Bonds, then to the payment of principal due on the 2017 Bonds other than by reason of mandatory partial redemptions, if any, and then to payment of principal due on the 2017 Bonds by reason of mandatory partial redemptions. Each such payment shall be made ratably to the Owners of the 2017 Bonds based on the then Outstanding principal amount of the 2017 Bonds, if there are insufficient funds to make the corresponding payment for all of the then Outstanding 2017 Bonds. Any mandatory partial redemption payment not made as scheduled shall be added to the mandatory partial redemption amount to be made on the next mandatory partial redemption date. Deficiencies. If at any time it appears to the Fiscal Agent that there is a danger of deficiency in the Bond Fund and that the Fiscal Agent may be unable to pay Debt Service on the 2017 Bonds in a timely manner, the Fiscal Agent shall report to the Administrative Services Director such fact. The City covenants to increase the levy of the Special Taxes in the next Fiscal Year (subject to the maximum amount authorized by the Rate and Method) in accordance with the procedures set forth in the Act for the purpose of curing Bond Fund deficiencies. Excess. Any excess moneys remaining in the Bond Fund (not including moneys in the Capitalized Interest Account) following the payment of Debt Service on the 2017 Bonds on any September 1, shall be transferred to the Special Tax Fund. C-9
242 Reserve Fund The Reserve Fund is established as a separate fund to be held by the Fiscal Agent, and within the Reserve Fund shall be established a 2017 Subaccount, to the credit of which a deposit shall be made as required by the Fiscal Agent Agreement, which deposit, as of the Closing Date, is equal to the initial Reserve Requirement with respect to the 2017 Bonds, and deposits shall be made as provided in the Fiscal Agent Agreement. For each respective Series of Parity Bonds covered by the Reserve Fund, the Fiscal Agent shall establish a separate subaccount within the Reserve Fund for each such Series. Moneys in each subaccount of the Reserve Fund shall be held by the Fiscal Agent for the benefit of the Owners of the Bonds covered by the Reserve Fund, as a reserve for the payment of the principal of, and interest and any premium on, such Bonds and shall be subject to a lien in favor of the Owners of such Bonds. Except as otherwise provided in this Section, all amounts deposited in the Reserve Fund shall be used and withdrawn by the Fiscal Agent solely for the purpose of making transfers to the Bond Fund in the event of the insufficiency at any time of the balance in the Bond Fund to pay the amount then required for payment of the principal of, and interest and any premium on, the Bonds covered by the Reserve Fund or, in accordance with the provisions of this Section, for the purpose of redeeming Bonds covered by the Reserve Fund from the Bond Fund. Whenever a transfer is made from the Reserve Fund to the Bond Fund due to a deficiency in the Bond Fund, the Fiscal Agent shall provide written notice thereof to the Administrative Services Director, specifying the amount withdrawn. Whenever, on or before any Interest Payment Date, or on any other date at the request of the Administrative Services Director, the amount in the Reserve Fund exceeds the Reserve Requirement, the Fiscal Agent shall transfer an amount equal to the excess from the Reserve Fund (i) to the Special Tax Proceeds Subaccount of the Improvement Fund until the Improvement Fund is closed pursuant to the Fiscal Agent Agreement and (ii) thereafter to the Bond Fund, to be used to pay interest on the Bonds covered by the Reserve Fund on the next Interest Payment Date. Notwithstanding the provisions of the preceding paragraph, no amounts shall be transferred from the Reserve Fund until after: (i) the calculation of any amounts due to the federal government and withdrawal or set aside of any such amount for purposes of making such payment to the federal government; and (ii) payment of any fees and expenses due to the Fiscal Agent. Amounts in the Reserve Fund shall be withdrawn for purposes of making payment to the federal government to comply with the Fiscal Agent Agreement, upon receipt by the Fiscal Agent of an Officer's Certificate specifying the amount to be withdrawn and to the effect that such amount is needed for rebate purposes; provided, however, that no amounts in the Reserve Fund shall be used for rebate unless the amount in the Reserve Fund following such withdrawal equals the Reserve Requirement. Whenever the balance in the Reserve Fund, together with the balance in the Bond Fund, exceeds the amount required to redeem or pay the Outstanding C-10
243 Bonds covered by the Reserve Fund, including interest accrued to the date of payment or redemption and premium, if any, due upon redemption, the Fiscal Agent shall, upon the written request of the Administrative Services Director, transfer any cash or Permitted Investments in the Reserve Fund to the Bond Fund to be applied, on the redemption date to the payment and redemption, of all of the Outstanding Bonds covered by the Reserve Fund. In the event that the amount so transferred from the Reserve Fund to the Bond Fund exceeds the amount required to pay and redeem the Outstanding Bonds covered by the Reserve Fund, the balance in the Reserve Fund shall be transferred to the Administrative Services Director to be used by the City for any lawful purpose. Whenever Special Taxes are prepaid and Bonds covered by the Reserve Fund are to be redeemed with the proceeds of such prepayment, a proportionate amount in the Reserve Fund (determined on the basis of the principal of Bonds covered by the Reserve Fund to be redeemed and the then-outstanding principal of the Bonds, but in any event not in excess of the amount that will leave the balance in the Reserve Fund following the proposed redemption equal to the Reserve Requirement) shall be transferred on the Business Day prior to the redemption date by the Fiscal Agent to the Bond Fund to be applied to the redemption of the Bonds covered by the Reserve Fund. The Administrative Services Director shall deliver to the Fiscal Agent an Officer s Certificate specifying any amount to be so transferred, and the Fiscal Agent may rely on any such Officer s Certificate. Certain Covenants of the City Collection of Special Tax Revenues. The City shall comply with all requirements of the Rate and Method and the Act so as to assure the timely collection of Special Tax Revenues, including without limitation, the enforcement of delinquent Special Taxes. On or within five (5) Business Days of each May 1, the Fiscal Agent shall provide the Administrator with a notice stating the amount then on deposit in the Bond Fund and the Reserve Fund, and, if the amount in the Reserve Fund is less than the Reserve Requirement, informing the Administrator that replenishment of the Reserve Fund is necessary. The receipt of or failure to receive such notice by the Administrator shall in no way affect the obligations of the Administrator under the following two paragraphs and the Fiscal Agent shall not be liable for failure to provide such notices to the Administrator. The Administrator shall effect the levy of the Special Taxes in accordance with the Rate and Method (including, during the Remainder Taxes Period, levying the Special Taxes at the Maximum Special Tax rate on Developed Property before considering any Capitalized Interest) each Fiscal Year that the 2017 Bonds are outstanding, or otherwise such that the computation of the levy is complete and transmitted to the Auditor before the final date on which the Auditor will accept the transmission of the Special Tax amounts for the parcels within Improvement Area No. 1 for inclusion on the next real property tax roll. Upon the completion of the computation of the amounts of the levy, the Administrator shall prepare or cause to be prepared, and shall transmit to the Auditor, such data as the Auditor requires to include the levy of the Special Taxes on the next real property tax roll. The Administrative Services Director shall fix and levy the Special Taxes within Improvement Area No. 1 in accordance with the Rate and Method so as to assure the timely payment of principal of and interest on any outstanding 2017 Bonds becoming due and payable during the ensuing calendar year, including any necessary replenishment or expenditure of the C-11
244 Reserve Fund for the 2017 Bonds and an amount estimated to be sufficient to pay the Administrative Expenses, including amounts necessary to discharge any rebate obligation, during such year, and to pay Project costs to be paid from Special Taxes during the ensuing calendar year; provided that the Special Taxes so levied shall not exceed the authorized amounts as provided by the Rate and Method. Except as set forth in the Ordinance, Special Taxes shall be payable and be collected in the same manner and at the same time and in the same installment as the general taxes on real property are payable, and have the same priority, become delinquent at the same time and in the same proportionate amounts and bear the same proportionate penalties and interest after delinquency as do the ad valorem taxes on real property. The fees and expenses of the Administrator and the costs and expenses of the Administrative Services Director (including a charge for City staff time) in conducting its duties under the Agreement shall be an Administrative Expense. Books and Records. The City will keep, or cause to be kept, proper books of record and accounts, separate from all other records and accounts of the City, in which complete and correct entries shall be made of all transactions relating to the Special Tax Revenues. Such books of record and accounts shall at all times during business hours be subject to the inspection of the Fiscal Agent and the Owners of not less than ten percent (10%) of the principal amount of the 2017 Bonds then Outstanding, or their representatives duly authorized in writing. Private Activity Bond Limitations. The City shall assure that the proceeds of the 2017 Bonds are not so used as to cause the 2017 Bonds to satisfy the private business tests of section 141(b) of the Tax Code or the private loan financing test of section 141(c) of the Tax Code. Federal Guarantee Prohibition. The City shall not take any action or permit or suffer any action to be taken if the result of the same would be to cause the 2017 Bonds to be "federally guaranteed" within the meaning of Section 149(b) of the Tax Code. Rebate Requirement. The City shall take any and all actions necessary to assure compliance with section 148(f) of the Tax Code, relating to the rebate of excess investment earnings, if any, to the federal government, to the extent that such section is applicable to the 2017 Bonds. The Administrative Services Director shall take note of any investment of monies under the Agreement in excess of the yield on the 2017 Bonds, and shall take such actions as are necessary to ensure compliance with this provision, such as increasing the portion of the Special Tax levy for Administrative Expenses as appropriate to have funds available in the Administrative Expense Fund to satisfy any rebate liability under this provision. If necessary to satisfy its obligations, the City may use: (A) amounts in the Reserve Fund if the amount on deposit in the Reserve Fund, following the proposed transfer, is at least equal to the Reserve Requirement; (B) amounts on deposit in the Administrative Expense Fund; and (C) any other funds available to the City, in its sole discretion, to be repaid to the City as soon as practicable from amounts described in the preceding clauses (A) and (B). No Arbitrage. The City shall not take, or permit or suffer to be taken by the Fiscal Agent or otherwise, any action with respect to the proceeds of the 2017 Bonds which, if such action had been reasonably expected to have been taken, or had been deliberately and intentionally taken, on the date of issuance of the 2017 Bonds would have caused the 2017 Bonds to be "arbitrage bonds" within the meaning of section 148 of the Tax Code. C-12
245 Maintenance of Tax-Exemption. The City shall take all actions necessary to assure the exclusion of interest on the 2017 Bonds from the gross income of the Owners of the 2017 Bonds to the same extent as such interest is permitted to be excluded from gross income under the Tax Code as in effect on the date of issuance of the 2017 Bonds. Amendment of Rate and Method The City shall not initiate proceedings under the Act to modify the Rate and Method if such modification would adversely affect the security for the 2017 Bonds. If an initiative is adopted that purports to modify the Rate and Method in a manner that would adversely affect the security for the 2017 Bonds, the City shall, to the extent permitted by law, commence and pursue reasonable legal actions to prevent the modification of the Rate and Method in a manner that would adversely affect the security for the 2017 Bonds. Deposit and Investment of Moneys in Funds. General. Moneys in any fund or account created or established by the Agreement and held by the Fiscal Agent shall be invested by the Fiscal Agent in Permitted Investments, which in any event by their terms mature prior to the date on which such moneys are required to be paid out under the Agreement, as directed pursuant to an Officer s Certificate filed with the Fiscal Agent at least two (2) Business Days in advance of the making of such investments. In the absence of any such Officer s Certificate, the Fiscal Agent hold such funds uninvested. The Administrative Services Director shall make note of any investment of funds under the Agreement in excess of the yield on the 2017 Bonds so that appropriate actions can be taken to assure compliance with the rebate provisions of the Agreement. Moneys in Funds. Moneys in any fund or account created or established by the Agreement and held by the Administrative Services Director shall be invested by the Administrative Services Director in any Permitted Investment or in any other lawful investment for City funds, which in any event by its terms matures prior to the date on which such moneys are required to be paid out under the Agreement. Obligations purchased as an investment of moneys in any fund shall be deemed to be part of such fund or account, subject, however, to the requirements of the Agreement for transfer of interest earnings and profits resulting from investment of amounts in funds and accounts. Whenever in the Agreement any moneys are required to be transferred by the City to the Fiscal Agent, such transfer may be accomplished by transferring a like amount of Permitted Investments. Actions of Officials. The Fiscal Agent and its affiliates or the Administrative Services Director may act as sponsor, advisor, depository, principal or agent in the acquisition or disposition of any investment. Neither the Fiscal Agent nor the Administrative Services Director shall incur any liability for losses arising from any investments made pursuant to the Agreement. The Fiscal Agent shall not be required to determine the legality of any investments. Valuation of Investments. Except as otherwise provided in the next sentence, all investments of amounts deposited in any fund or account created by or pursuant to the Agreement, or otherwise containing gross proceeds of the 2017 Bonds (within the meaning of section 148 of the Tax Code) shall be acquired, disposed of, and valued (as of the date that valuation is required by the Agreement or the Tax Code) at Fair Market Value. Investments in funds or accounts (or portions thereof) that are subject to a yield restriction under the applicable provisions of the Tax Code and (unless valuation is undertaken at least annually) investments of funds in the Reserve Fund shall be valued at their present value (within the meaning of section C-13
246 148 of the Tax Code). The Fiscal Agent shall not be liable for verification of the application of such sections of the Tax Code or for any determination of Fair Market Value or present value and may conclusively rely upon an Officer s Certificate as to such valuations. Commingled Money. Investments in any and all funds and accounts may be commingled in a separate fund or funds for purposes of making, holding and disposing of investments, notwithstanding provisions herein for transfer to or holding in or to the credit of particular funds or accounts of amounts received or held by the Fiscal Agent or the Administrative Services Director under the Agreement, provided that the Fiscal Agent or the Administrative Services Director, as applicable, shall at all times account for such investments strictly in accordance with the funds and accounts to which they are credited and otherwise as provided in the Agreement. Confirmations Waiver. The Fiscal Agent will furnish the City periodic cash transaction statements which include will detail for all investment transactions made by the Fiscal Agent under the Agreement. Upon the City s election, such statements will be delivered via the Fiscal Agent s online service and upon electing such service, paper statements will be provided only upon request. Sale of Investments. The Fiscal Agent or the Administrative Services Director, as applicable, shall sell at Fair Market Value, or present for redemption, any investment security whenever it shall be necessary to provide moneys to meet any required payment, transfer, withdrawal or disbursement from the fund or account to which such investment security is credited and neither the Fiscal Agent nor the Administrative Services Director shall be liable or responsible for any loss resulting from the acquisition or disposition of such investment security in accordance herewith. Liability of City General. The City shall not incur any responsibility in respect of the Bonds or the Agreement other than in connection with the duties or obligations explicitly herein or in the Bonds assigned to or imposed upon it. The City shall not be liable in connection with the performance of its duties under the Agreement, except for its own negligence or willful default. The City shall not be bound to ascertain or inquire as to the performance or observance of any of the terms, conditions, covenants or agreements of the Fiscal Agent or of any of the documents executed by the Fiscal Agent in connection with the 2017 Bonds, or as to the existence of a default or event of default thereunder. Reliance. In the absence of bad faith, the City, including the Administrative Services Director, may conclusively rely, as to the truth of the statements and the correctness of the opinions expressed therein, upon certificates or opinions furnished to the City by the Fiscal Agent or an Independent Financial Consultant and conforming to the requirements of the Agreement. The City, including the Administrative Services Director, shall not be liable for any error of judgment made in good faith unless it shall be proved that it was negligent in ascertaining the pertinent facts. The City may rely and shall be protected in acting or refraining from acting upon any notice, resolution, request, consent, order, certificate, report, warrant, bond or other paper or document believed by it to be genuine and to have been signed or presented by the proper party or proper parties. The City may consult with counsel, who may be the City Attorney, with regard to legal questions, and the opinion of such counsel shall be full and complete authorization and protection in respect of any action taken or suffered by it under the Agreement in good faith and in accordance therewith. C-14
247 No General Liability. No provision of the Agreement shall require the City to expend or risk its own general funds or otherwise incur any financial liability (other than with respect to the Special Tax Revenues) in the performance of any of its obligations under the Agreement, or in the exercise of any of its rights or powers, if it shall have reasonable grounds for believing that repayment of such funds or adequate indemnity against such risk or liability is not reasonably assured to it. Owner of Bonds. The City shall not be bound to recognize any person as the Owner of a 2017 Bond unless and until such 2017 Bond is submitted for inspection, if required, and his title thereto satisfactorily established, if disputed. Employment of Agents by City In order to perform its duties and obligations under the Agreement, the City may employ such persons or entities as it deems necessary or advisable. The City shall not be liable for any of the acts or omissions of such persons or entities employed by it in good faith under the Agreement, and shall be entitled to rely, and shall be fully protected in doing so, upon the opinions, calculations, determinations and directions of such persons or entities. Amendments Permitted With Consent. The Agreement and the rights and obligations of the City and of the Owners of the 2017 Bonds may be modified or amended at any time by a Supplemental Agreement pursuant to the affirmative vote at a meeting of Owners, or with the written consent without a meeting, of the Owners of at least sixty percent (60%) in aggregate principal amount of the Bonds then Outstanding, exclusive of 2017 Bonds disqualified as provided in the Agreement. No such modification or amendment shall (i) extend the maturity of any 2017 Bond or reduce the interest rate thereon, or otherwise alter or impair the obligation of the City to pay the principal of, and the interest and any premium on, any 2017 Bond, without the express consent of the Owner of such Bond, or (ii) permit the creation by the City of any pledge or lien upon the Special Taxes superior to or on a parity with the pledge and lien created for the benefit of the 2017 Bonds (except as otherwise permitted by the Act, the laws of the State of California or the Agreement), or reduce the percentage of 2017 Bonds required for the amendment hereof. Without Consent. The Agreement and the rights and obligations of the City and of the Owners may also be modified or amended at any time by a Supplemental Agreement, without the consent of any Owners, only to the extent permitted by law and only for any one or more of the following purposes: (i) to add to the covenants and agreements of the City, other covenants and agreements to be observed, or (b) to limit or surrender any right or power herein reserved to or conferred upon the City; (ii) to make modifications not adversely affecting any Outstanding 2017 Bonds in any material respect, including, but not limited to, amending the Rate and Method, so long as the amendment does not result in debt service coverage less than that set forth in the Parity Bonds provisions of the Agreement; (iii) to make such provisions for the purpose of curing any ambiguity, or of curing, correcting or supplementing any defective provision contained in the Agreement, or in regard to questions arising under the Agreement, as the City and the Fiscal Agent C-15
248 may deem necessary or desirable and not inconsistent with the Agreement, and not adversely affecting the rights of the Owners of the 2017 Bonds in any material respect; (iv) to make such additions, deletions or modifications as may be necessary or desirable to assure exclusion from gross income for federal income tax purposes of interest on the 2017 Bonds; (v) in connection with the issuance of any Parity Bonds under and pursuant to the Agreement. Fiscal Agent s Consent. Any amendment of the Agreement may not modify any of the rights or obligations of the Fiscal Agent without its written consent. The Fiscal Agent shall, if it should so request, be furnished an opinion of counsel that any such Supplemental Agreement entered into by the City and the Fiscal Agent complies with the provisions of the Agreement and the Fiscal Agent may conclusively rely on such opinion and shall be absolutely protected in so relying. Owners Meetings. The City may at any time call a meeting of the Owners. In such event the City is authorized to fix the time and place of said meeting and to provide for the giving of notice thereof and to fix and adopt rules and regulations for the conduct of said meeting. Procedure for Amendment with Written Consent of Owners. The City and the Fiscal Agent may at any time adopt a Supplemental Agreement amending the provisions of the 2017 Bonds or of the Agreement or any Supplemental Agreement, to the extent that such amendment is permitted by the Agreement, to take effect when and as provided in the Agreement. A copy of such Supplemental Agreement, together with a request to Owners for their consent thereto, shall be mailed by first class mail, by the Fiscal Agent, at the expense of the City), to each Owner of 2017 Bonds Outstanding, but failure to mail copies of such Supplemental Agreement and request shall not affect the validity of the Supplemental Agreement when assented to as in the Agreement. Such Supplemental Agreement shall not become effective unless there shall be filed with the Fiscal Agent the written consents of the Owners of at least sixty percent (60%) in aggregate principal amount of the 2017 Bonds then Outstanding (exclusive of Bonds disqualified as provided in the Agreement) and a notice shall have been mailed as hereinafter provided. Each such consent shall be effective only if accompanied by proof of ownership of the 2017 Bonds for which such consent is given, which proof shall be such as is permitted by the Agreement. Any such consent shall be binding upon the Owner of the 2017 Bonds giving such consent and on any subsequent Owner (whether or not such subsequent Owner has notice thereof) unless such consent is revoked in writing by the Owner giving such consent or a subsequent Owner by filing such revocation with the Fiscal Agent prior to the date when the notice hereinafter provided for has been mailed. After the Owners of the required percentage of 2017 Bonds shall have filed their consents to the Supplemental Agreement, the City shall mail a notice to the Owners in the manner hereinbefore provided for the mailing of the Supplemental Agreement, stating in substance that the Supplemental Agreement has been consented to by the Owners of the required percentage of 2017 Bonds and will be effective as provided (but failure to mail copies of said notice shall not affect the validity of the Supplemental Agreement or consents thereto). Proof of the mailing of such notice shall be filed with the Fiscal Agent. A record, consisting of the papers required by this provision to be filed with the Fiscal Agent, shall be proof of the matters therein stated until the contrary is proved. The Supplemental Agreement shall become effective upon the filing with the C-16
249 Fiscal Agent of the proof of mailing of such notice, and the Supplemental Agreement shall be deemed conclusively binding (except as otherwise hereinabove specifically provided) upon the City and the Owners of all 2017 Bonds at the expiration of sixty (60) days after such filing, except in the event of a final decree of a court of competent jurisdiction setting aside such consent in a legal action or equitable proceeding for such purpose commenced within such sixty-day period. Discharge of Agreement. The City may pay and discharge the entire indebtedness on all or any portion of 2017 Bonds Outstanding in any one or more of the following ways: (A) by paying or causing to be paid the principal of, and interest and any premium on, all 2017 Bonds Outstanding, as and when the same become due and payable; (B) by depositing with the Fiscal Agent, irrevocably, at or before maturity, money which, together with the amounts then on deposit in the funds and accounts provided for in the Bond Fund and the Reserve Fund hereof, is fully sufficient to pay all 2017 Bonds Outstanding, including all principal, interest and redemption premiums; or (C) by irrevocably depositing with the Fiscal Agent, irrevocably, cash and/or Federal Securities in such amount as the City shall determine, as confirmed by an independent certified public accountant, will, together with the interest to accrue thereon and moneys then on deposit in the fund and accounts provided for in the Bond Fund and the Reserve Fund (to the extent invested in Federal Securities), be fully sufficient to pay and discharge the indebtedness on all 2017 Bonds (including all principal, interest and redemption premiums) at or before their respective maturity dates. If the City shall have taken any of the actions specified in (A), (B) or (C) above, and if such 2017 Bonds are to be redeemed prior to the maturity thereof and notice of such redemption shall have been given as in the Agreement provided or provision satisfactory to the Fiscal Agent shall have been made for the giving of such notice, then, at the election of the City, and notwithstanding that any such 2017 Bonds shall not have been surrendered for payment, the pledge of the Special Taxes and other funds provided for in the Agreement and all other obligations of the City under the Agreement with respect to such 2017 Bonds shall cease and terminate. Notice of such election shall be filed with the Fiscal Agent. Notwithstanding the foregoing, the following obligations and pledges of the City shall continue in any event: (i) the obligation of the City to pay or cause to be paid to the Owners of the 2017 Bonds not so surrendered and paid all sums due thereon, (ii) the obligation of the City to pay amounts owing to the Fiscal Agent pursuant to the Agreement, and (iii) the obligation of the City to assure that no action is taken or failed to be taken if such action or failure adversely affects the exclusion of interest on the 2017 Bonds from gross income for federal income tax purposes. Upon compliance by the City with the foregoing with respect to all 2017 Bonds Outstanding, any funds held by the Fiscal Agent after payment of all fees and expenses of the Fiscal Agent, which are not required for the purposes of the preceding paragraph, shall be paid over to the City and any Special Taxes thereafter received by the City shall not be remitted to the Fiscal Agent but shall be retained by the City to be used for any purpose permitted under the Act. C-17
250 (THIS PAGE INTENTIONALLY LEFT BLANK)
251 APPENDIX D THE CITY OF DUBLIN AND ALAMEDA COUNTY General The City. Incorporated in 1982, the City of Dublin (the City ) is a suburban city of the San Francisco East Bay and Tri-Valley regions of Alameda County (the County ). It is located approximately 35 miles east of downtown San Francisco, 23 miles east of downtown Oakland, and 31 miles north of downtown San Jose. The City operates under the Council-Manager form of government. Policy making and legislative authority are vested in the City Council, which consists of an elected Mayor, who serves a two-year term, and four Council members each elected to a four-year term. The County. The County is located on the east side of the San Francisco Bay, south of the City of Oakland and approximately ten miles west of the City of San Francisco. Access to San Francisco is provided by the San Francisco Bay Bridge. The northern part of Alameda County has direct access to San Francisco Bay and the City of San Francisco. It is highly diversified with residential areas, as well as traditional heavy industry, the University of California at Berkeley, the Port of Oakland, and sophisticated manufacturing, computer services and biotechnology firms. The middle of the County is also highly developed including older established residential and industrial areas. The southeastern corner of the County has seen strong growth in residential development and manufacturing. Many high-tech firms have moved from neighboring Silicon Valley in Santa Clara County to this area. The southwestern corner of the County has seen the most development in recent years due to land availability. Agriculture and the rural characteristics of this area are disappearing as the region maintains its position as the fastest growing residential, commercial and industrial part of the County. [Remainder of page intentionally left blank] D-1
252 Population The following table lists population estimates for the City, the County and the State of California for the last five calendar years, as of January 1. CITY OF DUBLIN, ALAMEDA COUNTYAND STATE OF CALIFORNIA Population Estimates Calendar Years 2013 through 2017 as of January 1 Year City of Dublin Alameda County State of California ,197 1,567,091 38,238, ,648 1,588,348 38,572, ,164 1,611,318 38,915, ,394 1,629,233 39,189, ,686 1,645,359 39,523,613 Source: State Department of Finance estimates (as of January 1). [Remainder of page intentionally left blank] D-2
253 Employment and Industry The District is included in the Oakland-Hayward-Berkeley Metropolitan Division ( MD ). The unemployment rate in the Oakland-Hayward-Berkeley MD was 3.5 percent in April 2017, down from a revised 3.9 percent in March 2017, and below the year-ago estimate of 4.3 percent. This compares with an unadjusted unemployment rate of 4.5 percent for California and 4.1 percent for the nation during the same period. The unemployment rate was 3.5 percent in the County and 3.6 percent in Contra Costa County. The table below list employment by industry group for Alameda and Contra Costa Counties for the years 2012 to OAKLAND-FREMONT-HAYWARD MD (Alameda and Contra Costa Counties) Annual Averages Civilian Labor Force, Employment and Unemployment, Employment by Industry (March 2016 Benchmark) Civilian Labor Force (1) 1,336,300 1,344,100 1,355,600 1,374,800 1,394,400 Employment 1,218,700 1,245,500 1,275,000 1,308,100 1,334,200 Unemployment 117,500 98,600 80,600 66,700 60,200 Unemployment Rate 8.8% 7.3% 5.9% 4.8% 4.3% Wage and Salary Employment: (2) Agriculture 1,500 1,400 1,300 1,200 1,300 Mining and Logging Construction 52,000 56,400 58,600 62,400 67,500 Manufacturing 79,900 80,100 82,800 86,600 89,900 Wholesale Trade 43,700 45,200 46,200 47,600 49,000 Retail Trade 104, , , , ,000 Transportation, Warehousing, Utilities 32,900 33,500 35,600 38,300 38,700 Information 22,100 21,500 21,300 22,400 26,400 Finance and Insurance 33,400 33,500 32,600 32,800 40,300 Real Estate and Rental and Leasing 15,400 16,200 16,800 16,800 17,000 Professional and Business Services 166, , , , ,800 Educational and Health Services 164, , , , ,900 Leisure and Hospitality 91,800 97, , , ,400 Other Services 36,400 37,000 37,500 38,000 39,200 Federal Government 14,200 13,800 13,800 13,800 13,900 State Government 38,500 38,900 39,300 39,800 39,800 Local Government 110, , , , ,200 Total, All Industries (3) 1,008,000 1,037,500 1,063,600 1,096,300 1,136,200 (1) Labor force data is by place of residence; includes self-employed individuals, unpaid family workers, household domestic workers, and workers on strike. (2) Industry employment is by place of work; excludes self-employed individuals, unpaid family workers, household domestic workers, and workers on strike. (3) Totals may not add due to rounding. Source: State of California Employment Development Department. D-3
254 Principal Employers The following table shows the principal employers in the City, as shown in the City s Comprehensive Annual Financial Report for the fiscal year ending June 30, CITY OF DUBLIN Principal Employers As of June Employer Number of Employees Rank United States Government & Federal Correction Institute 2,100 1 Dublin Unified School District SAP (Formerly: Sybase Corporation) Ross Stores Headquarters Zeiss Meditec Target Stores Callidus Cloud County of Alameda De Silva Gates Construction Micro Dental Laboratories Safeway City of Dublin Whole Foods Source: City of Dublin, California. Comprehensive Annual Financial Report for the fiscal year ended June 30, [Remainder of page intentionally left blank] D-4
255 Major Employers The table below lists the major employers in the County, listed alphabetically. ALAMEDA COUNTY Major Employers Employer Name Location Industry Alameda County Law Enforcement Oakland Government Offices-County Alameda County Sheriff s Ofc Oakland Government Offices-County Alameda Health System San Leandro Health Care Management Alta Bates Summit Medical Ctr Berkeley Hospitals Alta Bates Summit Medical Ctr Oakland Hospitals Bayer Health Care Berkeley Laboratories-Pharmaceutical (mfrs) California State-East Bay Hayward Schools-Universities & Colleges Academic Children s Hosp & Research Ctr Oakland Hospitals Coopervision Inc Advanced Pleasanton Optical Good-Wholesale Dell EMC Pleasanton Computer Software East Bay Water Oakland Transit Lines Highland Hospital Oakland Hospitals Kaiser Oakland Oakland Health Services Life Scan Inc Fremont Physicians & Surgeons Equip & Supls-Mfrs Merritt Pavilion Lab Oakland Laboratories-Medical Oakland Police Patrol Div Oakland Police Departments Residential Stdents Svc Program Berkeley Schools-Universities & Colleges Academic Safeway Inc Pleasanton Grocers-Retail Tesla Motors Fremont Automobile Dealers-Electric Cars Transportation Dept-California Oakland Government Offices-State University of Ca-Berkeley Berkeley Schools-Universities & Colleges Academic University of CA-BERKELEY Berkeley Schools-Universities & Colleges Academic Valley Care Health System Livermore Health Services Washington Hospital Healthcare Sys Fremont Hospitals Western Digital Corp Fremont Electronic Equipment & Supplies-Mfrs Source: State of California Employment Development Department, extracted from the America s Labor Market Information System (ALMIS) Employer Database, nd Edition. [Remainder of page intentionally left blank] D-5
256 Construction Activity Provided below are the building permits and valuations for the City and the County for calendar years 2012 through Data for calendar year 2017 are not yet available. CITY OF DUBLIN Total Building Permit Valuations (Valuations in Thousands) Permit Valuation New Single-family $214,736.6 $256,827.4 $199,190.9 $143,137.7 $182,687.1 New Multi-family 108, , , , ,534.4 Res. Alterations/Additions 2, , , , ,984.6 Total Residential 325, , , , ,206.1 New Commercial 3, , , , ,794.8 New Industrial New Other , , , ,395.8 Com. Alterations/Additions 2, , , , ,204.1 Total Nonresidential 7, , , , ,394.7 New Dwelling Units Single Family Multiple Family TOTAL , Source: Construction Industry Research Board, Building Permit Summary. ALAMEDA COUNTY Total Building Permit Valuations (Valuations in Thousands) Permit Valuation New Single-family $372,939.4 $451,279.5 $400,498.1 $576,948.5 $791,891.2 New Multi-family 343, , , , ,341.3 Res. Alterations/Additions 235, , , , ,239.6 Total Residential 951, , ,118, ,378, ,755,472.1 New Commercial 94, , , , ,308.9 New Industrial 29, , , , ,242.1 New Other 6, , , , ,213.3 Com. Alterations/Additions 352, , , , ,031.8 Total Nonresidential 483, , ,026, ,146, ,359,796.1 New Dwelling Units Single Family 1,119 1,339 1,076 1,671 2,348 Multiple Family 1,508 2,023 2,048 3,370 3,171 TOTAL 2,627 3,362 3,124 5,041 5,519 Source: Construction Industry Research Board, Building Permit Summary. D-6
257 Effective Buying Income Effective Buying Income is defined as personal income less personal tax and nontax payments, a number often referred to as disposable or after-tax income. Personal income is the aggregate of wages and salaries, other labor-related income (such as employer contributions to private pension funds), proprietor s income, rental income (which includes imputed rental income of owner-occupants of non-farm dwellings), dividends paid by corporations, interest income from all sources, and transfer payments (such as pensions and welfare assistance). Deducted from this total are personal taxes (federal, state and local), nontax payments (fines, fees, penalties, etc.) and personal contributions to social insurance. According to U.S. government definitions, the resultant figure is commonly known as disposable personal income. The following table summarizes the median household effective buying income for the City, the County, the State and the United States for the period 2012 through Year CITY OF DUBLIN AND ALAMEDA COUNTY Effective Buying Income Median Household As of January 1, 2012 Through 2016 Area Total Effective Buying Income (000 s Omitted) Median Household Effective Buying Income 2012 City of Dublin $1,669,493 $82,308 Alameda County 43,677,855 55,396 California 864,088,828 47,307 United States 6,737,867,730 41, City of Dublin $1,719,630 $84,244 Alameda County 43,770,518 57,467 California 858,676,636 48,340 United States 6,982,757,379 43, City of Dublin $1,896,895 $87,311 Alameda County 47,744,408 60,575 California 901,189,699 50,072 United States 7,357,153,421 45, City of Dublin $2,149,098 $94,247 Alameda County 52,448,661 64,030 California 981,231,666 53,589 United States 7,357,153,421 45, City of Dublin 2,278,236 95,456 Alameda County 56,091,066 67,631 California 1,036,142,723 55,681 United States 8,132,748,136 48,043 Source: The Nielsen Company (US), Inc. D-7
258 Taxable Transactions Summaries of historic taxable sales within the City and the County during the past five years in which data is available are shown in the following tables. Annual figures are not yet available for Total taxable sales during calendar year 2015 in the City were reported to be $1.68 billion, a 4.77% increase over the total taxable sales of $1.61 billion reported during calendar year CITY OF DUBLIN Taxable Transactions Number of Permits and Valuation of Taxable Transactions (Valuations in Thousands) Retail Stores Total All Outlets Number of Permits Taxable Transactions Number of Permits Taxable Transactions ,042,872 1,033 1,241, ,213,278 1,071 1,436, ,261,933 1,099 1,518, ,329,250 1,125 1,606, * N/A 1,379,226 N/A 1,683,547 *Annual permit figures for calendar year 2015 are not yet available. Source: California State Board of Equalization, Taxable Sales in California (Sales & Use Tax). Total taxable transactions during calendar year 2015 in the County were reported to be $29.77 billion, a 4.91% increase over the total taxable transactions of $28.38 billion reported during calendar year ALAMEDA COUNTY Taxable Transactions Number of Permits and Valuation of Taxable Transactions (Valuations in Thousands) Retail Stores Total All Outlets Number of Permits Taxable Transactions Number of Permits Taxable Transactions ,809 14,519,756 38,577 23,430, ,027 15,781,349 39,706 25,181, ,017 16,893,102 40,662 26,624, ,152 17,820,857 40,746 28,377, * N/A 18,702,806 N/A 29,770,157 *Annual permit figures for calendar year 2015 are not yet available. Source: California State Board of Equalization, Taxable Sales in California (Sales & Use Tax). D-8
259 APPENDIX E PRICING REPORT E-1
260 (THIS PAGE INTENTIONALLY LEFT BLANK)
261 Market Pricing and Absorption Analysis Proposed Dublin Crossing CFD Dublin, California Prepared for City of Dublin Dublin, California April 28, 2017 Robert Charles Lesser & Co. Real Estate Advisors rclco.com

262 Introduction Contents Executive Summary 4 Local Area Analysis 6 Residential Market Analysis 9 Critical Assumptions 14 Appendix 16 Illustrative Site Plan Dublin Crossing; Dublin, CA Background The City of Dublin retained RCLCO ( Robert Charles Lesser & Co., LLC ) to provide an updated third-party pricing and absorption evaluation of Phase 1 of the residential development program encompassed within the proposed Dublin Crossing master-planned community. Development plans for Dublin Crossing envision a transit-oriented, master-planned community within walking distance of the Dublin/Pleasanton BART station (DeMarcus Boulevard/Interstate 580). Proposed land uses include single family and multifamily residential units, 75,000 to 200,000 square feet of commercial space, a 30-acre community park, a five-acre neighborhood park, a 12-acre elementary school, and a trail system that connects to the Iron Horse Trail 35 park acres. Phase 1 of the community, the subject of this market analysis, comprises 453 homes, including 129 single-family detached units and 324 single-family attached units. Phase 1 will be developed by Brookfield Residential and CalAtlantic Homes. Source: Brookfield Residential 2 Dublin Crossing City of Dublin April 28, 2017 E
263 Introduction (cont.) Objectives At issue is the preparation of the market analysis of the Phase 1 forsale residential component of the proposed Dublin Crossing masterplanned community to underpin the issuance of the proposed CFD bond. Bond proceeds will enable the construction of various public improvements relating to the Dublin Crossing project. The market analysis will be included in the bond offering statement and provide input to the work undertaken by the appraiser and financial consultant. Specific analytical objectives which we addressed in conducting the market analysis included: Market Potential market demand for new for-sale homes at Dublin Crossing derived from the synthesis of demand/market demographics and historical sales trends. Financial Projection of achievable pricing and absorption for the proposed units. Methodology Major analytical tasks leading to the fulfillment of the above objectives consisted of the following: Evaluated the location merits of the Dublin Crossing master-planned community, focusing on the subject s location, access and visibility, quality of surrounding development, execution, and proximity to key amenities/places. Examined and evaluated the competitive environment, examining actively-selling single-family detached and attached communities in Dublin that could inform potential residential pricing at Dublin Crossing. Planned and proposed developments in the area were also examined. Analyzed market demand/depth for new for-sale homes at the subject location, utilizing the demographic makeup (age, income, tenure, and turnover) of the Oakland MD as the basis for local demand given the wide geographic draw for new ownership housing in Dublin. Translated the market research findings into development conclusions addressing market depth available for capture by prospective residential development at Dublin Crossing and achievable pricing (constant 2017 dollars) informed by the preceding demand analysis, the local market comparables, and our understanding from the City of Dublin that the total property tax rate for Dublin Crossing s homes would be 1.75% (the proposed tax rate for the proposed Community Facilities District would be approximately 0.5%). Described short-term economic development trends for the Oakland-Fremont-Hayward Metropolitan Division ( Oakland MD ) as a whole, i.e., regional economic and job growth outlook underpinning the economic development context and setting for the proposed new homes in Dublin. 3 Dublin Crossing City of Dublin April 28, 2017 E
264 Executive Summary (cont.) Our overriding conclusion is that the market depth for new homes in the City of Dublin continues to grow and supports the development of a well-executed master-planned community at Dublin Crossing, due in large part to the following: The high performance of local schools is a major draw to households with school-age children from all over the Oakland MD, as well as from the greater San Francisco Bay Area. The location in the heart of the growing and affluent community of Dublin, which provides convenient access to the Dublin-Pleasanton BART station as well as retail services. The outlook for Dublin is positive and Dublin Crossing should perform in-line with top of the market residential offerings in the area as one of the few large master-planned communities in the area with proximity to transit. Achievable Pricing In the initial phase, RCLCO projects base prices starting in the low- $1,000,000s for detached homes (2,400 to 2,700-square foot homes) and starting in the low-$600,000s for attached homes (1,450 to 3,000- square foot homes). Given these price points, the project would achieve base pricing of $394 per square foot on average 1, which would place the subject site development consistent with actively-selling communities in Dublin. Additional options, upgrades and lot premiums could increase the all-in home price by $30,000 to $100,000. Dublin Crossing is assumed to be a well-executed, master-planned community similar, if not superior, to other top-performing planned communities in the area. At build-out, Dublin Crossing will feature the following amenities: a 30-acre community park, a 5-acre neighborhood park, an elementary or K-8 school, an extensive internal bicycle trail, an open space wildlife refuge facility, the Iron Horse Trail corridor that runs through the site to Pleasanton and Concord, and Iron Horse Trail bridge that crosses Dublin Boulevard. The community should be positioned as one of the premier masterplanned communities in Alameda County near the top of the local housing market and as a value alternative for those moving from the East Bay and other areas in the broader San Francisco Bay Area that seek high-quality, new housing at relatively affordable prices. Recommended Pricing of Planned Program for Phase 1 Dublin Crossing; Dublin, CA HOME SIZE RANGE (SF) BASE PRICE RANGE (constant 2017 dollars) PROGRAM LOTS AVG. AVG. AVG./SF Attached Tract ,732 $707,000 $408 Tract ,808 $725,000 $401 Tract ,979 $766,000 $387 Tract ,262 $834,000 $369 Detached Tract 4A 45 2,553 $1,032,000 $404 Tract 4B 24 2,552 $1,032,000 $404 Tract ,547 $1,031,000 $405 TOTAL 453 2,120 $835,900 $394 1 The recommended pricing also incorporates the impacts of the CFD, which would increase the total property tax rate in Dublin Crossing to 1.75%. Source: RCLCO 4 Dublin Crossing City of Dublin April 28, 2017 E
265 Executive Summary (cont.) Market Depth and Absorption Potential Building on the above achievable price points, we measured depth of market derived in large part from income and pertinent demographic characteristics of the Oakland MD households. The Oakland MD constitutes the Primary Market Area ( PMA ), defined as the geographic area from which we expect 90% of the demand to originate for Dublin Crossing s new ownership housing based on conversations with sales agents in Dublin and secondary research. PMA s for-sale demand potential. Based on the City of Dublin s capture of the Tri-Valley s sales activity in the past year, we estimate that the City of Dublin would capture between 25% and 50% of projected Tri-Valley housing demand depending on price points, bringing the total demand for households in Dublin to 1,400 homes. As noted above, building on discussions with sales agents at nearby actively-selling planned communities and analysis of migration data, we estimate that 10% of total demand for Dublin originates from outside the PMA or outside of our screening criteria. The PMA, which comprises 967,100 households, has approximately 418,800 households earning sufficient income to afford a home above $500,000 (See Exhibit VI-3B for an evaluation of housing affordability by income). Our analysis of affordability has determined that the approximate minimum household income that qualify prospective buyers to purchase new housing at Dublin Crossing at the current recommended pricing are $101,000 for households under age 55 and $88,000 for households age 55+. Of these households who meet the affordability threshold within the PMA, approximately 20,000 households per year are projected to demand for-sale housing after additional adjustments that consider age, home ownership, and annual turnover. The inclusion of new households moving to the PMA in the relevant income ranges raises the annual demand to approximately 23,100. RCLCO performed a capture rate analysis that estimates the Tri- Valley Area (comprised of the following cities: Dublin, Pleasanton, San Ramon, Danville, and Livermore) would capture 17% of the We then estimate that Dublin Crossing could capture 12% to 18% of the demand for new homes in Dublin priced between $500,000 and $1.2 million, equating to an annual demand potential ranging from approximately 160 to 220 units, or 13 to 18 units per month (Exhibit V-2A). These capture rates suggest absorption of homes at Dublin Crossing would represent a significant share of housing activity in the city, as the introduction of the 453 units in Phase 1 will be one of the larger offerings and should attract a significant pool of buyers based on its location and expected execution. Given the product program for Phase 1 and our recommended pricing, homes priced between $500,000 and $700,000 would likely sell out in 5 to 6 months, homes priced from $700,000 to $900,000 would sell out in 36 to 46 months, homes priced between $900,000 and $1 million would sell out in 23 to 35 months, and homes priced between $1 million and $1.2 million would sell out in 46 to 67 months. Projected Home Sale Velocity by Price Range; Dublin Crossing DISTRIBUTION BY PRICE RANGE PRODUCT TYPE UNDER $500,000 $500,000- $700,000 $700,000- $900,000 $900,000- $1,000,000 $1,000,000- $1,200,000 $1,200,000+ TOTAL TOTAL/WTD. AVG Distribution by Price Range 0% 9% 50% 8% 33% 0% 100% Scenario 1 - Years of Supply by Price Range Scenario 2 - Years of Supply by Price Range Source: RCLCO 5 Dublin Crossing City of Dublin April 28, 2017 E

266 Local Area Analysis Site Assessment Dublin Crossing is located at the geographic center of the City of Dublin, north of Dublin Boulevard between Iron Horse Regional Trail/Scarlett Drive and Arnold Road. Key location characteristics of the subject site are: The proposed Dublin Crossing planned community is located within half of a mile of the Dublin/Pleasanton BART station, which connects Dublin to the broader San Francisco Bay Area (San Francisco, Oakland, San Jose and Berkeley). Given that many buyers of new housing in Dublin commute to jobs in Oakland, San Jose/Silicon Valley, and San Francisco, we would expect that the proximity of Dublin Crossing s new ownership housing to a nearby BART Station will be a significant marketing draw. For commuters, Dublin Crossing is also conveniently located approximately one mile from two on-/off-ramps to Interstate 580 which provides access to the East Bay and the broader region. Additionally, on-/off-ramps to Interstate-680, which provides access north to Walnut Creek and south to San Jose, are accessible within two miles of the site. Dublin Unified School District covers the City of Dublin and provides K-12 instruction. Local public schools within Dublin Crossing s schools district include Frederiksen Elementary, Wells Middle School, and Dublin High School, as well as an elementary school that will be developed within the community. These existing schools achieve significantly higher API scores and GreatSchools ratings than the schools in Alameda County and the PMA as a whole, and achieve relatively similar scores to the schools in surrounding cities, such as Pleasanton and San Ramon. From our discussions with sales personnel at the active-selling communities, the quality of the schools is a powerful draw for many families looking to buy a new home in Dublin. Site Map Dublin Crossing Dublin, CA Subject Site: Dublin Crossing Dublin Crossing is located within a mile of Hacienda Crossings, a power center featuring a variety of entertainment, restaurants, and shopping destinations. Persimmon Place, a new retail shopping center, recently opened adjacent to Hacienda Crossings and is anchored by Whole Foods, Nordstrom Rack, and Home Goods. The site is also approximately 1.5 miles from the next nearest grocery store, anchored by Safeway. In addition, Stoneridge Shopping Center, a Class A regional mall with 1.3 million square feet of retail, is located approximately 2.5 miles away. Several power centers anchored by a Wal-Mart Supercenter and Target are also located both to the east and west. Source: RCLCO 6 Dublin Crossing City of Dublin April 28, 2017 E
267 Employment Growth Rate Local Area Analysis Socioeconomic Context Regional Employment Reflective of national economic conditions, the Oakland MD, which comprises Alameda and Contra Costa Counties, has made great strides since emerging from the recent Great Recession, recovering slightly faster than California as a whole. The region has experienced accelerated growth, led by Education and Health Services as well as Professional and Business Services. Since 2011, the region has added 152,000 jobs 9,000 jobs (0.9%) in 2011, 28,000 (2.9%) in 2012, 30,000 jobs (3.0%) in 2013, 26,000 jobs (2.5%) in 2014, 32,000 jobs (3.0%) in 2015, and another 27,000 jobs (2.5%) in (Exhibit III-1A). When compared to the U.S over the 2010 to 2016 period, job gains in the Oakland MD rose by 12.7%, outperforming the nation s 9.6% growth. In 2012 and 2013, the rate of job growth in the Oakland MD approached levels last seen in the county during the tech bubble of the late 1990s. From 2014 to 2016, however, growth tapered off to more sustainable levels as the total jobs reached pre-recession highs. Overall employment growth is poised to continue in with growth rates expected to be in the 1% to 2% range. Economy.com, a reputable source that prepares regional economic forecasts, is projecting a gain of 17,900 jobs in Beyond 2017, the region is forecasted to add an additional 18,800 jobs (1.7%) in 2018 and 17,600 jobs (1.5%) in The new home market should benefit from the healthy economic performance. Historical and Forecasted Total Employment Growth Rate; Oakland-Fremont-Hayward MD; % 2% 0% -2% -4% -6% -8% Historical Moody's Projection Historical Avg. Moody's Projection Avg. Source: Moody s Analytics 1 According to the National Bureau of Economic Research, the Great Recession lasted 18 months, from December 2007 to June Nationally, the 2007 to 2009 recession was the deepest on record since the Great Depression, at least in terms of job losses. 7 Dublin Crossing City of Dublin April 28, 2017 E
268 Local Area Analysis Socioeconomic Context (cont.) Demographic Factors In 2016, the City of Dublin s population stood at approximately 58,400, with an average household size of 3.09 persons per household. Of the 18,900 households in the city, 12,000 households (63%) are home owners, and 10,800 (65%) have incomes over $100,000 (Exhibit II-2 and II-4A). Median household income in Dublin stood at $121,000 in 2016 and was 61% higher than Alameda County as a whole. As stated previously, the Primary Market Area includes all of Alameda and Contra Counties (Oakland MD) and is derived in large part from our field surveys of competitive for-sale housing developments in Dublin where agents commented on the geographic area from which their home buyers originate. Most home buyers can be expected to be commuters to job locations in the East Bay, San Jose/Silicon Valley and San Francisco. The PMA had an estimated population of 2.7 million in Household Growth Dublin, Alameda County, and Contra Costa County Average household size in the PMA is 2.81, slightly lower than the City of Dublin. Of the 967,100 PMA households, 553,000 (57%) are owners, and 386,800 (40%) have annual incomes over $100,000 (Exhibit II-2, II- 3H and II-3I). PMA households are less affluent than the City of Dublin and less likely to own homes. The projected household growth rate for 2016 to 2021 in the PMA is approximately 10,540 households or 1.1% per year. Dublin, however, is projected to grow by 470 households or 2.4% per year. Household Distribution by Income Dublin and Alameda and Contra Costa Counties; % 25% 20% 15% 4.0% 10% 2.4% 5% 0.9% 0.8% 0.6% 1.1% 1.0% 0.8% 0% CITY OF DUBLIN Axis Title ALAMEDA COUNTY CONTRA COSTA COUNTY CALIFORNIA Source: ESRI Business Analyst; RCLCO Dublin Alameda & Contra Costa Counties 8 Dublin Crossing City of Dublin April 28, 2017 E
269 Residential Market Analysis Housing Market Trends Housing permit information from the U.S. Department of Housing and Urban Development reveals a moderate increase in permitting for Alameda County as a whole over the past five years, but a significant increase in permitting in Dublin. County permits have grown by an average of 22% over the past five years, since the end of the last recession, and are now near 2006 levels but well below their peak in In Dublin, permits increased at a significant rate since 2010, averaging 870 permits per year between from 2011 to 2016 and representing 23% of all permits in the County. By comparison, Dublin has represented historically only 1% to 10% of total permits in the County from 1990 to In the past year, a total of 343 homes have sold throughout the City of Dublin, of which 174 were single-family detached. Single-family detached homes sold for an average sale price of approximately $1.13 million with an average size of 2,800 square feet. The remaining 169 attached home sales had an average sale price of approximately $664,400 with an average size of 1,700 square feet. Of the 343 total home sales, 211 homes (62%) sold for between $500,000 and $1 million, and only 72 homes (or 21% of sales) sold for more than $1.2 million. In the past year, the City of Dublin captured approximately 35.8% of single-family home sales in the Tri-Valley Area. The City of Dublin has no housing activity above $2,500,000 in the past year, while the rest of the Tri-Valley offers a wider range of housing products in all price ranges. As such, the City of Dublin decreases its capture rates as we move towards higher price ranges, with an approximately 53% capture of the Tri-Valley Area home sales below $500,000, but more moderate approximately 26% capture of home sales between $1,200,000 and $2,500,000. (see Exhibit IV-2). Home Sales by Price Range Dublin and Tri-Valley Area; March 2016-March < $500K $500K - $700K $700K - $900K $900K - $1M $1M - $1.2M $1.2M - $2.5M $2.5M+ CITY OF DUBLIN TRI-VALLEY Source: U.S. Department of Housing and Urban Development; RCLCO 9 Dublin Crossing City of Dublin April 28, 2017 E
270 Residential Market Analysis (cont.) Competitive Projects RCLCO characterized the market supply pertinent to Dublin Crossing s Phase 1 program by surveying actively-selling new home communities in the Competitive Market Area (the area in which other product will likely compete with Dublin Crossing, which we determined includes the cities of Dublin, Livermore, Pleasanton, San Ramon, and Danville) including: Tribeca (Pulte Homes) in Dublin Station, the development adjacent to the BART station, Heritage Park (Pulte Homes), located west of Dublin Crossing in Downtown Dublin, Westport Village, Tramore, and Hillcrest (Lennar) located in eastern Dublin along Dublin Blvd, Kingswood (Landsea Homes) in Jordan Ranch, a large master-planned community in East Dublin, and Riverton (KB Home), Fielding (Trumark Homes), Ivy Oak (Taylor Morrison), Driftsong (Warmington), Citron (Pulte Homes), Bridgecrodt (DR Horton), and Barnwell (DR Horton) in Wallis Ranch, a master-planed community in northern Dublin along Tassajara Road. See the map and table below for more details on these communities. Planned and Proposed Development Dublin is experiencing significant new housing activity with approximately 790 units remaining in active communities and 1,820 units in the planning process, including approximately 850 homes that are either under construction or will begin construction in the near-term. Summary of Selected Comparable New Home Communities; Dublin, Ca 2 1 MAP HOME PRICE KEY COMMUNITY BUILDER SIZE TOTAL $/SF SUBJECT SITE -- DUBLIN CROSSING 1 Tribeca Pulte Homes 1,923 $789,323 $411 2 Heritage Park Pulte Homes 2,643 $1,066,590 $404 3 Riverton KB Home 2,094 $812,000 $388 3 Fielding Trumark Homes 2,140 $1,035,400 $484 3 Ivy Oak Taylor Morrison 3,185 $1,173,333 $368 3 Driftsong Warmington 2,416 $982,333 $407 3 Citron Pulte Homes 2,516 $1,046,323 $416 3 Bridgecroft DR Horton 3,970 $1,515,491 $382 3 Barnwell DR Horton 3,584 $1,354,500 $378 4 Westport Village Lennar 2,064 $779,280 $377 4 Tramore Lennar 2,123 $842,213 $397 4 Hillcrest Lennar 2,127 $971,547 $457 5 Kingswood Landsea Homes 1,930 $748,323 $ Source: RCLCO 10 Dublin Crossing City of Dublin April 28, 2017 E
271 Base Price Residential Market Analysis (cont.) Achievable Pricing Relevant actively-selling new home communities in the Competitive Market Area provided comparable price points from which we established the achievable pricing for homes at Dublin Crossing. The pricing methodology which we employed was as follows: Using each market comparable s price to size relationship and our industry experience to arrive at a price slope, we made sales price adjustments of competitive developments to reflect envisioned unit sizes at Dublin Crossing. We adjusted communities based on the attractiveness of product offerings, with Dublin Crossing discounted 2.5% relative to identified competitive developments that offer two-floor product to reflect buyer preferences. We accounted for location qualities as well by assessing the supportive character of uses surrounding the competitive planned communities and regional access. Based on our site visits, we adjusted each competitive planned development s overall execution in relation to the high-quality, planning vision for Dublin Crossing, a qualitative effort to reflect design of the community, infrastructure improvements, parks, and the overall character of the community. We accounted for the home purchasing power implications of proposed property tax rates at Dublin Crossing (total property tax rate of 1.75%) versus the lower property taxes at the competitive communities (total property tax rates range from 1.18% to 1.25% at comparable communities). Given that buyers with the same income would be able to afford higher-priced homes in a community with lower property taxes, we adjusted the Dublin Crossing home prices downward in relation to the competition to reflect the property tax differential. The resulting achievable prices for the homes at Dublin Crossing are shown below and in Exhibit I-1. These prices reflect base prices before upgrade considerations, however buyers are expected to add upgrades to their home purchases ranging on average between 5% and 10% of the base price. Price to Unit Size Relationship Phase 1 of Dublin Crossing Versus Comparable Communities $1,700,000 $1,500,000 $1,300,000 $1,100,000 $900,000 $700,000 $500,000 1,000 1,500 2,000 2,500 3,000 3,500 4,000 4,500 Source: RCLCO Unit Size (SF) Attached Detached Tribeca Heritage Park Riverton Ivy Oak Driftsong Citron Bridgecroft Barnwell Westport Village Fielding Tramore Hillcrest Kingswood 11 Dublin Crossing City of Dublin April 28, 2017 E
272 Residential Market Analysis (cont.) Demand Outlook We have projected annual demand for for-sale residential development at Dublin Crossing derived largely from the demographic characteristics of the PMA (defined, as noted above, as the Oakland Metropolitan Division). Our demographic demand model based on income-qualified households and several other factors (age, tenure, and annual turnover) reveals an annual absorption potential at Dublin Crossing ranging from 160 to 220 units, equivalent to a monthly absorption of about 13 to 18 units. A summary of this demand model forecast methodology follows (See Exhibit VI-3A for details): Households in the Primary Market Area were both age-qualified (households under age 55 and households age 55 and older ) and income-qualified as buyers. Appropriate household income qualifications for Dublin Crossing was determined to start at $90,000 based on the following assumptions: typical downpayments of 20% for households under age 55 and 35% for households above age 55, 30-year fixed mortgage with a 4.0% interest rate, property taxes at 1.75% per year (~0.5% provides repayment of the proposed CFD bonds), HOA and Insurance payments averaging $300 per month, and total housing costs (mortgage, HOA fees, insurance, and property tax) comprising 35% of household income. Household growth projections for the PMA, qualified using the same criteria as above for existing households, provided short-term demand potential from household growth, which indicates that an average of about 2,940 newly formed households would be in the market for for-sale housing annually over the next five years. Based on a historical capture analysis, we estimate that the Tri- Valley could capture approximately 17% of the Oakland Metropolitan Division s annual for-sale demand potential, representing demand potential for approximately 3,950 home sales in the Tri-Valley Area. Building on discussions with sales agents at nearby actively-selling planned communities, we estimate that 10% of total demand for Dublin originates from outside the city or outside of our screening criteria. Based on the City of Dublin s capture of the Tri-Valley s sales activity in the past year, we estimate that the City of Dublin would capture between 25% and 50% of projected Tri-Valley housing demand depending on price points. At the achievable pricing, we estimate that Dublin Crossing should capture 12% to 18% of the Dublin demand for new housing priced $500,000 and $1.2 million. The resulting demand potential is 170 to 220 units per year at Dublin Crossing, equivalent to 13 to 18 units per month. Annual Demand Methodology Oakland MD and City of Dublin HH Growth Turnover 2,936 16,800 3,949 2,740 Source: ESRI Business Analyst; American Community Survey; RCLCO 1 Age 55 represents a shift in household dynamics where housing preferences likely change due to life stage. 12 Dublin Crossing City of Dublin April 28, 2017 E
273 Residential Market Analysis (cont.) Demand Outlook (cont.) As shown in Exhibit I-1B, a large share of the units in Phase 1 approximately 50% would be offered in the $700,000 to $900,000 price range, after accounting for options and upgrades of approximately 5% to10% of base prices. Given the product program for Phase 1 and the achievable pricing (and without accounting for the phasing of the proposed development), homes priced between $500,000 and $700,000 would likely sell out in 5 to 6 months, homes priced from $700,000 to $900,000 would sell out in 3.0 to 3.8 years, homes priced between $900,000 and $1,000,000 would sell out in 1.9 to 2.9 years, and homes priced between $1,000,000 and $1,200,000 would sell out in 3.8 to 5.6 years. Distribution of Product Program and Estimated Demand by Price Dublin Crossing BASE PRICE RANGE 1 OPTIONS, UPRGRADE S, AND PREMIUMS ALL-IN PRICE RANGE PRODUCT TYPE MIN- MAX MIN - MAX MIN- MAX AVG. TOTAL UNITS UNDER $500,000 $500,000- $700,000 DISTRIBUTION BY PRICE RANGE 2 $700,000- $900,000- $1,000,000- $900,000 $1,000,000 $1,200,000 $1,200,000 + TOTAL Tract 1 $636,000- $791,000 5%- 10% $667,800- $870,100 $768, % 25.0% 75.0% 0.0% 0.0% 0.0% 100.0% Tract 2 $612,000- $798,000 5%- 10% $642,600- $877,800 $760, % 23.4% 76.6% 0.0% 0.0% 0.0% 100.0% Tract 3 $683,000- $1,025,000 5%- 10% $717,150- $1,127,500 $922, % 0.0% 86.7% 0.0% 13.3% 0.0% 100.0% Tract 5 $676,000- $918,000 5%- 10% $709,800- $1,009,800 $859, % 0.0% 38.8% 46.3% 15.0% 0.0% 100.0% Tract 4A $1,001,000- $1,066,000 5%- 10% $1,051,050- $1,172,600 $1,111, % 0.0% 0.0% 0.0% 100.0% 0.0% 100.0% Tract 4B $1,001,000- $1,066,000 5%- 10% $1,051,050- $1,172,600 $1,111, % 0.0% 0.0% 0.0% 100.0% 0.0% 100.0% Tract 6 $997,000- $1,065,000 5%- 10% $1,046,850- $1,171,500 $1,109, % 0.0% 0.0% 0.0% 100.0% 0.0% 100.0% TOTAL/WTD. AVG Distribution by Price Range 0% 9% 50% 8% 33% 0% 100% Potential Annual Absorption by Price Range Scenario Years of Supply by Price Range Potential Annual Absorption by Price Range Scenario Years of Supply by Price Range See Exhibit I-1A. 2 Assumes a uniform pricing distribution within product types. 3 Scenario 1 assumes Dublin Crossing captures 12%-14% of total housing demand in the City of Dublin. Scenario 2 assumes Dublin captures 18% of housing demand. Source: RCLCO 13 Dublin Crossing City of Dublin April 28, 2017 E
274 Critical Assumptions Our conclusions are based on our analysis of the information available from our own sources and from the client as of the date of this report. Weassume that the information is correct, complete, and reliable. We made certain assumptions about the future performance of the global, national, and local economy and real estate market, and on other factors similarly outside either our control or that of the client. We analyzed trends and the information available to us in drawing these conclusions. However, given the fluid and dynamic nature of the economy and real estate markets, as well as the uncertainty surrounding particularly the near-term future, it is critical to monitor the economy and markets continuously and to revisit the aforementioned conclusions periodically to ensure that they are reflective of changing market conditions. We assume that the economy and real estate markets will grow at a stable and moderate rate to 2020 and beyond. However, stable and moderate growth patterns are historically not sustainable over extended periods of time, the economy is cyclical, and real estate markets are typically highly sensitive to business cycles. Further, it is very difficult to predict when an economic and real estate upturn will end. With the above in mind, we assume that the long term average absorption rates and price changes will be as projected, realizing that most of the time performance will be either above or below said average rates. Our analysis does not consider the potential impact of future economic shocks on the national and/or local economy, and does not consider the potential benefits from major "booms that may occur. Similarly, the analysis does not reflect the residual impact on the real estate market and the competitive environment of such a shock or boom. Also, it is important to note that it is difficult to predict changing consumer and market psychology. As such, we recommend the close monitoring of the economy and the marketplace, and updating this analysis as appropriate. Further, the project and investment economics should be stress tested to ensure that potential fluctuations in revenue and cost assumptions resulting from alternative scenarios regarding the economy and real estate market conditions will not cause failure. In addition, we assume that the following will occur in accordance with current expectations: Economic, employment, and household growth. Other forecasts of trends and demographic and economic patterns, including consumer confidence levels. The cost of development and construction. Tax laws (i.e., property and income tax rates, deductibility of mortgage interest, and so forth). Availability and cost of capital and mortgage financing for real estate developers, owners and buyers. Competitive projects will be developed as planned (active and future) and that a reasonable stream of supply offerings will satisfy real estate demand. Major public works projects occur and are completed as planned. Should any of the above change, this analysis should be updated, with the conclusions reviewed accordingly (and possibly revised). 14 Dublin Crossing City of Dublin April 28, 2017 E
275 General Limiting Conditions Reasonable efforts have been made to ensure that the data contained in this study reflect accurate and timely information and are believed to be reliable. This study is based on estimates, assumptions, and other information developed by RCLCO from its independent research effort, general knowledge of the industry, and consultations with the client and its representatives. No responsibility is assumed for inaccuracies in reporting by the client, its agent, and representatives or in any other data source used in preparing or presenting this study. This report is based on information that to our knowledge was current as of the date of this report, and RCLCO has not undertaken any update of its research effort since such date. Possession of this study does not carry with it the right of publication thereof or to use the name of "Robert Charles Lesser & Co." or "RCLCO" in any manner without first obtaining the prior written consent of RCLCO. No abstracting, excerpting, or summarization of this study may be made without first obtaining the prior written consent of RCLCO. This report is not to be used in conjunction with any public or private offering of securities or other similar purpose where it may be relied upon to any degree by any person other than the client without first obtaining the prior written consent of RCLCO. This study may not be used for any purpose other than that for which it is prepared or for which prior written consent has first been obtained from RCLCO. Our report may contain prospective financial information, estimates, or opinions that represent our view of reasonable expectations at a particular time, but such information, estimates, or opinions are not offered as predictions or assurances that a particular level of income or profit will be achieved, that particular events will occur, or that a particular price will be offered or accepted. Actual results achieved during the period covered by our prospective financial analysis may vary from those described in our report, and the variations may be material. Therefore, no warranty or representation is made by RCLCO that any of the projected values or results contained in this study will be achieved. 15 Dublin Crossing City of Dublin April 28, 2017 E
276 Appendix: Supporting Exhibits 16 Dublin Crossing City of Dublin April 28, 2017 E
277 CITY OF DUBLIN LIST OF EXHIBITS I. PRICING AND COMPETITIVE SUPPLY Exhibit I-1A Summary of Achievable Pricing; Dublin Crossing; Dublin, CA; April 2017 Exhibit I-1B Projected Home Sales Velocity by Price Range; Dublin Crossing Master-Planned Community, Phase 1; Dublin, California; Exhibit I-2A Comparable Communities Base Pricing Adjustment Matrix; Dublin Crossing; Dublin, CA; April 2017 Exhibit I-2B Internal Pricing Adjustments; Dublin Crossing; Dublin, CA; April 2017 Exhibit I-2C Price to Size Relationship - RCLCO Recommendations; Dublin Crossing; Dublin, CA; April 2017 Exhibit I-3A Exhibit I-3B Price to Unit Size Relationship - All Products; Dublin Crossing Versus Comparable Communities; Dublin, CA; April 2017 Price to Unit Size Relationship - Attached Product; Dublin Crossing Versus Comparable Communities; Dublin, CA; April 2017 Exhibit I-4 CFD Sales Price Adjustments; Dublin Crossing Versus Comparable Communities; Dublin, CA; April 2017 Exhibit I-5 Map of Selected Comparable New Home Communities; Dublin, CA; April 2017 Exhibit I-6 Summary of Selected Comparable New Home Communities; Dublin, CA; April 2017 Exhibit I-7 Planned and Proposed Residential Projects; Dublin, Pleasanton, and San Ramon, CA; as of April 2017 Page i E April 28, 2017
278 CITY OF DUBLIN II. DEMOGRAPHIC AND HUD PERMIT TRENDS LIST OF EXHIBITS Exhibit II-1 Exhibit II-2 Map of Local Cities; Dublin, Pleasanton, Livermore, San Ramon, and Danville, CA Comparative Socioeconomic Characteristics; Cities of Dublin, Pleasanton, Livermore, San Ramon, Danville, Alameda County, Contra Costa County and California; Exhibit II-3 Median Household Income by Zip Codes; Dublin, CA; 2016 Exhibit II-4A Household Distribution by Income and Age; Dublin, Pleasanton, Livermore, San Ramon, Danville, Alameda & Contra Costa County, and California; 2016 Exhibit II-4B Age of Householder by Income; City of Dublin; 2016 Exhibit II-4C Age of Householder by Income; City of Pleasanton; 2016 Exhibit II-4D Age of Householder by Income; City of Livermore; 2016 Exhibit II-4E Age of Householder by Income; City of San Ramon; 2016 Exhibit II-4F Age of Householder by Income; City of Danville; 2016 Exhibit II-4G Age of Householder by Income; Alameda County; 2016 Exhibit II-4H Age of Householder by Income; Contra Costa County; 2016 Exhibit II-4I Age of Householder by Income; California; 2016 Exhibit II-5A Residential Permitting Activity; Dublin; California; Exhibit II-5B Residential Permitting Activity; Pleasanton; California; Exhibit II-5C Residential Permitting Activity; Livermore; California; Exhibit II-5D Residential Permitting Activity; San Ramon; California; Page ii E April 28, 2017
279 CITY OF DUBLIN Exhibit II-5E Residential Permitting Activity; Danville; California; LIST OF EXHIBITS Exhibit II-5F Residential Permitting Activity; Alameda County; California; Exhibit II-5G Residential Permitting Activity; Contra Costa County; California; Exhibit II-6A Commute Patterns - Employment Locations of Dublin Residents; Dublin, CA; 2014 Exhibit II-6B Commute Patterns - Residential Locations of Dublin Workers; Dublin, CA; 2014 Exhibit II-7A Commute Patterns - Employment Locations of Oakland Residents; Oakland, CA; 2014 Exhibit II-7B Commute Patterns - Residential Locations of Oakland Workers; Oakland, CA; 2014 Exhibit II-8A Commute Patterns - Employment Locations of San Francisco Residents; San Francisco, CA; 2014 Exhibit II-8B Commute Patterns - Residential Locations of San Francisco Workers; San Francisco, CA; 2014 III. ECONOMIC TRENDS Exhibit III-1A Exhibit III-1B Exhibit III-2 Historical and Forecasted Non-Agricultural Employment, Households, and Population; Oakland- Hayward-Berkeley, CA MD; ; (In Thousands) Historical and Forecasted Non-Agricultural Employment, Household, and Population Growth Rates; Oakland-Hayward-Berkeley, CA MD; Historical and Forecasted Non-Agricultural Employment Growth Rates; Oakland-Hayward-Berkeley, CA MD and United States; Exhibit III-3 Historical and Forecasted Non-Agricultural Employment; Oakland-Hayward-Berkeley, CA MD; ; (In Thousands) Exhibit III-4 Historical and Forecasted Non-Agricultural Employment by Industry; Oakland-Hayward-Berkeley, CA MD; ; (In Thousands) Page iii E April 28, 2017
280 CITY OF DUBLIN IV. FOR-SALE HOME SALES TRENDS LIST OF EXHIBITS Exhibit IV-1A Residential Listings and Sales by Size Range Built 2005 or Later; City of Dublin; as of March 2017 Exhibit IV-1B Residential Listings and Sales by Price Range Built 2005 or Later; City of Dublin; as of March 2017 Exhibit IV-1C Residential Listings and Sales by Size Range Built 2005 or Later; Tri-Valley Area; as of March 2017 Exhibit IV-1D Residential Listings and Sales by Price Range Built 2005 or Later; Tri-Valley Area; as of March 2017 Exhibit IV-2 Residential Home Sale Capture Rates; City of Dublin in Relation to the Tri-Valley Area; March March 2017 Exhibit IV-3 Single-Family Home/Townhome Resales Built 2005 or Later; Tri-Valley Area; March 2016-March 2017 Exhibit IV-4A Monthly Median Home Price; Existing Single-Family Detached Homes; Contra Costa County, Alameda County, and California; January 1990-June 2016 Exhibit IV-4B Monthly Median Home Price; Cities in Tri-Valley Area; January 1997-June 2016 V. SITE ANALYSIS Exhibit V-1A Regional Map; Dublin Crossing Master-Planned Community; Dublin, CA and San Francisco Bay Area; April 2017 Exhibit V-1B Map of Subject Site Area; Dublin Crossing Master-Planned Community; Dublin, CA; April 2017 Exhibit V-1C Map of Surrounding Uses; Dublin Crossing Master-Planned Community; Dublin, CA; April 2017 Exhibit V-2 Site Assessment; Dublin Crossing Master-Planned Community; Dublin, CA; April 2017 Exhibit V-3A Map of Local Schools; Dublin, CA; April 2017 Page iv E April 28, 2017
281 CITY OF DUBLIN Exhibit V-3B LIST OF EXHIBITS Aggregate School Rankings by City; Dublin, Livermore, Pleasanton, San Ramon, and Danville; April 2017 Exhibit V-3C School Rankings by City; Dublin, Livermore, Pleasanton, and San Ramon; April 2017 VI. DEMAND ANALYSIS Exhibit VI-1 Dublin Crossing Absorption Potential; Oakland Metropolitan Division; Exhibit VI-2 Capture Rate Analysis; Tri-Valley Area and Oakland Metropolitan Division Exhibit VI-3A Annual For-Sale Demand Potential; Oakland Metropolitan Division; Exhibit VI-3B Housing Affordability; Dublin, CA; April 2017 Page v E April 28, 2017
282 CITY OF DUBLIN I. PRICING AND COMPETITIVE SUPPLY
283 CITY OF DUBLIN Exhibit I-1A SUMMARY OF ACHIEVABLE PRICING DUBLIN CROSSING DUBLIN, CA APRIL 2017 LOCATION: COMMUNITY EXECUTION: POSITIONING: The site is located in the heart of Dublin and the project will bridge the gap between the existing western and growing eastern portions of the city. The site is proximate to the Dublin/Pleasanton BART station as well as on- and off-ramps to I-580 and I-680, providing access to surrounding cities and the greater San Francisco Bay Area. Various retail options are located nearby, including Hacienda Crossing and the newly opened Persimmon Place which includes a Nordstrom's Rack and Whole Foods as key anchor tenants. Local schools are significantly better than Alameda Couty as a whole, and generally on par when compared to the highperforming schools in the surrounding cities of San Ramon, Livermore, Danville and Pleasanton. Dublin Crossing is assumed to be a well-executed, master-planned community similar, if not superior, to other top-performing planned communities in the area. At build-out, Dublin Crossing will feature the following amenities: 30-acre community park, a 5- acre neighborhood park, an elementary or K-8 school, Iron Horse Trail corridor that runs through the site to Pleasanton and Concord, an extensive internal bicycle trail, an open space wildlife refuge facility, and Iron Horse Trail bridge that crosses Dublin Boulevard. These amenities will begin development starting in Phase 2 and will not be developed or available for use for the beginning of Phase 1. The community should be positioned as one of the premier master-planned communities in Alameda County near the top of the local housing market and as a value alternative for those moving into the area from the East Bay and other areas in the broader San Francisco Bay Area that seek high-quality, new housing at relatively affordable prices. In Phase 1, RCLCO concludes pricing (base prices) should start in the mid $600,000s for attached homes and rise to the low $1,000,000s for relatively high-density, single-family detached homes. HOME SIZE RANGE (SF) BASE PRICE RANGE (constant 2017 dollars) PROGRAM LOTS MIN - MAX AVG. MIN - MAX AVG. AVG./SF Attached Tract ,443-2,076 1,732 $636,000 - $791,000 $707,000 $408 Tract ,337-2,112 1,808 $612,000 - $798,000 $725,000 $401 Tract ,623-3,097 1,979 $683,000 - $1,025,000 $766,000 $387 Tract ,548-2,642 2,262 $676,000 - $918,000 $834,000 $369 Detached Tract 4A 45 2,424-2,691 2,553 $1,001,000 - $1,066,000 $1,032,000 $404 Tract 4B 24 2,424-2,691 2,552 $1,001,000 - $1,066,000 $1,032,000 $404 Tract ,405-2,688 2,547 $997,000 - $1,065,000 $1,031,000 $405 TOTAL 453 1,337-3,097 2,120 $612,000 - $1,066,000 $835,900 $394 SOURCE: RCLCO Exhibit I-1A E Printed: 4/28/2017
284 CITY OF DUBLIN Exhibit I-1B PROJECTED HOME SALES VELOCITY BY PRICE RANGE DUBLIN CROSSING MASTER-PLANNED COMMUNITY, PHASE 1 DUBLIN, CALIFORNIA OPTIONS, UPRGRADES, BASE PRICE RANGE 1 AND PREMIUMS ALL-IN PRICE RANGE DISTRIBUTION BY PRICE RANGE 2 PRODUCT TYPE MIN - MAX MIN - MAX MIN - MAX AVG. UNDER $500,000 $500,000- $700,000 $700,000- $900,000 $900,000- $1,000,000 $1,000,000- $1,200,000 $1,200,000+ TOTAL Tract 1 $636,000 - $791,000 5% - 10% $667,800 - $870,100 $768, % 25.0% 75.0% 0.0% 0.0% 0.0% 100.0% Tract 2 $612,000 - $798,000 5% - 10% $642,600 - $877,800 $760, % 23.4% 76.6% 0.0% 0.0% 0.0% 100.0% Tract 3 $683,000 - $1,025,000 5% - 10% $717,150 - $1,127,500 $922, % 0.0% 86.7% 0.0% 13.3% 0.0% 100.0% Tract 5 $676,000 - $918,000 5% - 10% $709,800 - $1,009,800 $859, % 0.0% 38.8% 46.3% 15.0% 0.0% 100.0% Tract 4A $1,001,000 - $1,066,000 5% - 10% $1,051,050 - $1,172,600 $1,111, % 0.0% 0.0% 0.0% 100.0% 0.0% 100.0% Tract 4B $1,001,000 - $1,066,000 5% - 10% $1,051,050 - $1,172,600 $1,111, % 0.0% 0.0% 0.0% 100.0% 0.0% 100.0% Tract 6 $997,000 - $1,065,000 5% - 10% $1,046,850 - $1,171,500 $1,109, % 0.0% 0.0% 0.0% 100.0% 0.0% 100.0% TOTAL/WTD. AVG Distribution by Price Range 0% 9% 50% 8% 33% 0% 100% Potential Annual Absorption by Price Range Scenario Years of Supply by Price Range Potential Annual Absorption by Price Range Scenario Years of Supply by Price Range TOTAL UNITS 1 See Exhibit I-1A. 2 Assumes a uniform pricing distribution within product types. 3 See Exhibit V-2A. SOURCE: RCLCO Exhibit I-1B E Printed: 4/28/2017
285 CITY OF DUBLIN Exhibit I-2A COMPARABLE COMMUNITIES BASE PRICING ADJUSTMENT MATRIX DUBLIN CROSSING DUBLIN, CA APRIL 2017 SIZE ADJUSTED 1 ADJUSTMENTS ADJUSTED BASE PRICES PROJECT COMMUNITY LOT SIZE (SF) UNIT SIZE (SF) BASE PRICE BASE $/SF UNIT SIZE (SF) BASE PRICE BASE $/SF PRODUCT TYPE 2 SURROUNDING USES/ACCESS 3 COMMUNITY EXECUTION 4 CFD 6 TOTAL PRICE PRICE/SF WEIGHT ATTACHED PRODUCT 1,808 Tribeca Dublin Station 1,500 1,923 $789,323 $411 1,808 $760,959 $ % 0.00% 2.50% -4.10% 98.4% $748,783 $414 25% Riverton Wallis Ranch 2,000 2,094 $812,000 $388 1,808 $745,345 $ % 2.50% 1.00% -4.60% 98.9% $737,146 $408 25% Westport Village Irongate 1,250 2,064 $779,280 $377 1,808 $721,098 $ % 1.00% 2.50% -4.10% 96.9% $698,744 $387 25% Kingswood Jordan Ranch 1,300 1,930 $748,323 $388 1,808 $719,756 $ % 1.00% 2.50% -3.90% 99.6% $716,877 $397 25% TOTAL/WEIGHTED AVERAGE 1,808 $725,000 $ % DETACHED PRODUCT 2,552 Heritage Park Heritage Park 4,200 2,643 $1,066,590 $404 2,552 $1,044,509 $ % 0.00% 2.50% -4.60% 95.4% $996,462 $390 20% Fielding Wallis Ranch 2,450 2,140 $1,035,400 $484 2,552 $1,155,142 $ % 2.50% 1.00% -4.60% 96.4% $1,113,557 $436 7% Ivy Oak Wallis Ranch 2,533 3,185 $1,173,333 $368 2,552 $1,033,417 $ % 2.50% 1.00% -4.60% 98.9% $1,022,050 $400 7% Driftsong Wallis Ranch 1,650 2,416 $982,333 $407 2,552 $1,015,426 $ % 2.50% 1.00% -4.60% 98.9% $1,004,256 $394 7% Citron Wallis Ranch 2,600 2,516 $1,046,323 $416 2,552 $1,055,390 $ % 2.50% 1.00% -4.60% 98.9% $1,043,781 $409 7% Bridgecroft Wallis Ranch 4,750 3,970 $1,515,491 $382 2,552 $1,190,710 $ % 2.50% 1.00% -4.60% 96.4% $1,147,844 $450 7% Barnwell Wallis Ranch 4,080 3,584 $1,354,500 $378 2,552 $1,120,540 $ % 2.50% 1.00% -4.60% 97.7% $1,094,207 $429 7% Tramore Irongate 3,750 2,123 $842,213 $397 2,552 $944,231 $ % 1.00% 2.50% -4.10% 99.4% $938,566 $368 20% Hillcrest Irongate 4,500 2,127 $971,547 $457 2,552 $1,087,913 $ % 1.00% 2.50% -4.10% 99.4% $1,081,386 $424 20% TOTAL/WEIGHTED AVERAGE 2,552 $1,032,000 $ % 1 Applies a 60% price slope to the incremental price gained/lost by a change in size. 2 Adjustment to reflect the difference in buyer's preferences for a two-floor product over a three-floor product. 3 Accounts for the uses surrounding each community, such as retail, open space, etc. 4 Reflects the overall quality and amenitization of the comparables communities in relation to plans for Dublin Crossing. 5 Adjustment to reflect the differences in product type and quality (if any). 6 Adjustment for the impact of property tax rates on price. Assumes Dublin Crossing would have a total property tax rate of 1.75%. See Exhibit I-4 for more details. SOURCE: Redfin; RCLCO Exhibit I-2A E Printed: 4/28/2017
286 CITY OF DUBLIN Exhibit I-2B INTERNAL PRICING ADJUSTMENTS DUBLIN CROSSING DUBLIN, CA APRIL 2017 AVERAGE POSITIONING ATTACHED PRODUCT 1 PRODUCT TYPE HOME SIZE BASE PRICE BASE $/SF Tract 2 1,808 $725,000 $401 PRODUCT TYPE HOME SIZE (SF) INTERNAL PRICING ADJUSTMENTS PRICE SLOPE 2 PRICE ADJUSTMENT ADJUSTED BASE PRICE BASE $/SF Tract 1 1,732 60% ($18,000) $707,000 $408 Tract 2 1,808 60% $0 $725,000 $401 Tract 3 1,979 60% $41,000 $766,000 $387 Tract 5 2,262 60% $109,000 $834,000 $369 AVERAGE POSITIONING DETACHED PRODUCT 1 PRODUCT TYPE HOME SIZE BASE PRICE BASE $/SF Tract 4B 2,552 $1,032,000 $404 PRODUCT TYPE INTERNAL PRICING ADJUSTMENTS SIZE PRICE PRICE (SF) SLOPE 2 ADJUSTMENT ADJUSTED BASE PRICE BASE $/SF Tract 4A 2,553 60% $0 $1,032,000 $404 Tract 4B 2,552 60% $0 $1,032,000 $404 Tract 6 2,547 60% ($1,000) $1,031,000 $405 1 See Exhibit I-2A 2 Applies a 60% price slope to the incremental price gained/lost by a change in size. SOURCE: RCLCO Exhibit I-2B E Printed: 4/28/2017
287 CITY OF DUBLIN Exhibit I-2C PRICE TO SIZE RELATIONSHIP - RCLCO RECOMMENDATIONS DUBLIN CROSSING DUBLIN, CA APRIL 2017 $1,100,000 $1,000,000 $900,000 Base Price $800,000 $700,000 $600,000 $500,000 1,000 1,500 2,000 2,500 3,000 3,500 Unit Size (SF) Attached Detached SOURCE: RCLCO Exhibit I-2C E Printed: 4/28/2017
288 CITY OF DUBLIN Exhibit I-3A PRICE TO UNIT SIZE RELATIONSHIP - ALL PRODUCTS DUBLIN CROSSING VERSUS COMPARABLE COMMUNITIES DUBLIN, CA APRIL 2017 $1,700,000 $1,500,000 $1,300,000 Base Price $1,100,000 $900,000 $700,000 $500,000 1,000 1,500 2,000 2,500 3,000 3,500 4,000 4,500 Unit Size (SF) Attached Detached Tribeca Heritage Park Riverton Ivy Oak Driftsong Citron Bridgecroft Barnwell Westport Village Fielding Tramore Hillcrest Kingswood SOURCE: RCLCO Exhibit I-3A E Printed: 4/28/2017
289 CITY OF DUBLIN Exhibit I-3B PRICE TO UNIT SIZE RELATIONSHIP - ATTACHED PRODUCT DUBLIN CROSSING VERSUS COMPARABLE COMMUNITIES DUBLIN, CA APRIL 2017 $1,100,000 $1,000,000 $900,000 Base Price $800,000 $700,000 $600,000 $500,000 1,000 1,500 2,000 2,500 3,000 3,500 Unit Size (SF) Attached Tribeca Riverton Westport Village Kingswood SOURCE: RCLCO Exhibit I-3B E Printed: 4/28/2017
290 CITY OF DUBLIN Exhibit I-3C PRICE TO UNIT SIZE RELATIONSHIP - DETACHED PRODUCT DUBLIN CROSSING VERSUS COMPARABLE COMMUNITIES DUBLIN, CA APRIL 2017 $1,700,000 $1,500,000 $1,300,000 Base Price $1,100,000 $900,000 $700,000 $500,000 1,000 1,500 2,000 2,500 3,000 3,500 4,000 4,500 Unit Size (SF) Detached Heritage Park Ivy Oak Driftsong Citron Bridgecroft Barnwell Fielding Tramore Hillcrest SOURCE: RCLCO Exhibit I-3C E Printed: 4/28/2017
291 CITY OF DUBLIN Exhibit I-4 CFD SALES PRICE ADJUSTMENTS DUBLIN CROSSING VERSUS COMPARABLE COMMUNITIES DUBLIN, CA APRIL 2017 PROJECT CITY TOTAL TAX RATE DIFFERENCE FROM SUBJECT SITE TAX RATE DIFFERENCE IN ANNUAL PAYMENT PER $100,000 PRESENT VALUE OF PAYMENT DIFFERENCE PER $100,000 1 CFD ADJUSTMENT Tribeca Dublin 1.25% -0.50% ($500) ($4,100) -4.1% Heritage Park Dublin 1.18% -0.57% ($570) ($4,600) -4.6% Riverton Dublin 1.18% -0.57% ($570) ($4,600) -4.6% Fielding Dublin 1.18% -0.57% ($570) ($4,600) -4.6% Ivy Oak Dublin 1.18% -0.57% ($570) ($4,600) -4.6% Driftsong Dublin 1.18% -0.57% ($570) ($4,600) -4.6% Citron Dublin 1.18% -0.57% ($570) ($4,600) -4.6% Bridgecroft Dublin 1.18% -0.57% ($570) ($4,600) -4.6% Barnwell Dublin 1.18% -0.57% ($570) ($4,600) -4.6% Westport Village Dublin 1.25% -0.50% ($500) ($4,100) -4.1% Tramore Dublin 1.25% -0.50% ($500) ($4,100) -4.1% Hillcrest Dublin 1.25% -0.50% ($500) ($4,100) -4.1% Kingswood Dublin 1.27% -0.48% ($480) ($3,900) -3.9% Proposed Dublin Crossing Maximum Property Tax Rate 1.75% 1 Present Value of Payment Difference assumes a 4% discount rate and a 10-year hold period. SOURCE: Real Estate Economics; RCLCO Exhibit I-4 E Printed: 4/28/2017
292 CITY OF DUBLIN Exhibit I-5 MAP OF SELECTED COMPARABLE NEW HOME COMMUNITIES DUBLIN, CA APRIL MAP HOME PRICE KEY COMMUNITY BUILDER SIZE TOTAL $/SF SUBJECT SITE -- DUBLIN CROSSING Dublin Station 1 Tribeca Pulte Homes 1,923 $789,323 $411 Heritage Park 2 Heritage Park Pulte Homes 2,643 $1,066,590 $ Wallis Ranch 3 Riverton KB Home 2,094 $812,000 $388 3 Fielding Trumark Homes 2,140 $1,035,400 $484 3 Ivy Oak Taylor Morrison 3,185 $1,173,333 $368 3 Driftsong Warmington 2,416 $982,333 $407 3 Citron Pulte Homes 2,516 $1,046,323 $416 3 Bridgecroft DR Horton 3,970 $1,515,491 $382 3 Barnwell DR Horton 3,584 $1,354,500 $378 Irongate 4 Westport Village Lennar 2,064 $779,280 $377 4 Tramore Lennar 2,123 $842,213 $397 4 Hillcrest Lennar 2,127 $971,547 $457 Jordan Ranch 5 Kingswood Landsea Homes 1,930 $748,323 $388 SOURCE: Google; RCLCO Exhibit I-5 E Printed: 4/28/2017
293 CITY OF DUBLIN Exhibit I-6 SUMMARY OF SELECTED COMPARABLE NEW HOME COMMUNITIES DUBLIN, CA APRIL 2017 MAP COMMUNITY/ HOMES LOT SIZE (SF)/ HOME KEY ADDRESS BUILDER FLOORPLAN TOTAL REMAINING BEDS BATHS STORIES DENSITY SIZE (SF) BASE PRICE BASE $/SF ABSORPTION 1 Tribeca Pulte Homes Average ,500 1,923 $789,323 $411 Dublin Station Plan ,500 1,827 $768,990 $ Campbell Lane Plan ,500 1,886 $784,990 $416 Dublin, CA Plan ,500 2,055 $813,990 $ units sold since June Sold out in January Heritage Park Pulte Homes Average ,200 2,643 $1,066,590 $404 N/A Plan ,200 2,013 $935,990 $ Dublin Blvd. Plan ,200 2,425 $1,019,990 $421 Dublin, CA Plan ,200 2,584 $1,059,990 $410 Plan ,200 3,066 $1,151,990 $376 Plan ,200 3,128 $1,164,990 $372 3 Riverton KB Home Average ,000 2,094 $812,000 $388 Wallis Ranch Plan ,000 1,962 $809,000 $ Wallis Ranch Plan ,000 2,160 $822,000 $381 Dublin, CA Plan 5A ,000 2,160 $805,000 $373 3 Fielding Trumark Homes Average ,450 2,140 $1,035,400 $484 Wallis Ranch Plan ,450 1,809 $975,000 $ Wallis Ranch Plan 1 - Alt ,450 1,877 $995,000 $530 Dublin, CA Plan ,450 2,069 $1,019,000 $493 Plan ,450 2,258 $1,049,000 $465 Plan ,450 2,685 $1,139,000 $424 3 Ivy Oak Taylor Morrison Average ,533 3,185 $1,173,333 $368 Wallis Ranch Plan ,650 3,016 $1,145,000 $ Kenwood Rd Plan ,975 3,180 $1,175,000 $369 Dublin, CA Plan ,975 3,359 $1,200,000 $357 3 Driftsong Warmington Average ,650 2,416 $982,333 $407 Wallis Ranch Plan ,650 2,210 $949,000 $ Calistoga Lane Plan ,650 2,264 $959,000 $424 Dublin, CA Plan ,650 2,775 $1,039,000 $ units sold since May units left to be sold. Sold 10 of 125 homes since October Sold 15 of 139 homes since June homes sold since August homes sold since May Page 1 of 2 Exhibit I-6 E Printed: 4/28/2017
294 CITY OF DUBLIN Exhibit I-6 SUMMARY OF SELECTED COMPARABLE NEW HOME COMMUNITIES DUBLIN, CA APRIL 2017 MAP COMMUNITY/ HOMES LOT SIZE (SF)/ HOME KEY ADDRESS BUILDER FLOORPLAN TOTAL REMAINING BEDS BATHS STORIES DENSITY SIZE (SF) BASE PRICE BASE $/SF ABSORPTION 3 Citron Pulte Homes Average ,600 2,516 $1,046,323 $416 Wallis Ranch Plan ,600 1,975 $942,990 $ Trolan Lane Plan ,600 2,228 $992,990 $446 Dublin, CA Plan ,600 2,446 $1,032,990 $422 Plan ,600 2,459 $1,052,990 $428 Plan ,600 2,903 $1,122,990 $387 Plan ,600 3,083 $1,132,990 $367 3 Bridgecroft DR Horton Average ,750 3,970 $1,515,491 $382 Wallis Ranch Plan ,750 3,627 $1,455,440 $ Atlas Peak Dr. Plan ,750 3,680 $1,516,365 $412 Dublin, CA Plan ,750 4,273 $1,540,158 $360 Plan ,750 4,300 $1,550,000 $360 3 Barnwell DR Horton Average ,080 3,584 $1,354,500 $378 Wallis Ranch Plan ,080 2,944 $1,328,000 $ Atlas Peak Dr. Plan ,080 3,445 $1,400,000 $406 Dublin, CA Plan 2Y ,080 3,463 $1,402,000 $405 Plan 1X ,080 3,706 $1,304,000 $352 Plan 2X ,080 3,949 $1,337,000 $339 Plan 3X ,080 3,995 $1,356,000 $339 4 Westport Village Lennar Average ,250 2,064 $779,280 $377 Irongate Plan ,250 1,879 $752,880 $ Maguire Way Plan ,250 1,976 $762,880 $386 Dublin, CA Plan ,250 2,131 $792,880 $372 Plan ,250 2,140 $792,880 $371 Plan ,250 2,196 $794,880 $362 4 Tramore Lennar Average ,750 2,123 $842,213 $397 Irongate Plan ,750 1,996 $832,880 $ Three Castles Way Plan 2A ,750 2,076 $830,880 $400 Dublin, CA Plan 3A ,750 2,298 $862,880 $375 4 Hillcrest Lennar Average ,500 2,127 $971,547 $457 Irongate Plan ,500 1,862 $899,880 $ Randall Loop Plan ,500 2,214 $996,880 $450 Dublin, CA Plan ,500 2,306 $1,017,880 $441 5 Kingswood Landsea Homes Average ,300 1,930 $748,323 $388 Jordan Ranch Plan ,300 1,666 $680,990 $ Central Pkwy Plan ,300 2,002 $748,990 $374 Dublin, CA Plan ,300 2,123 $814,990 $384 Sold 56 units 7 homes sold since June May Sold 2 homes since September Sold 28 homes since June homes old since June homes sold of 69 since December homes sold since November homes sold since June SOURCE: Real Estate Economics; RCLCO Page 2 of 2 Exhibit I-6 E Printed: 4/28/2017
295 CITY OF DUBLIN Exhibit I-7 PLANNED AND PROPOSED RESIDENTIAL PROJECTS DUBLIN, CA AS OF APRIL 2017 PROJECT/ LOCATION DEVELOPER TOTAL MARKET RATE UNITS STATUS DESCRIPTION DUBLIN Jordan Ranch - Slate TriPointe 56 Under Construction Under Construction Single-Family Detached development. Homes will be two stories. Jordan Ranch - Onyx TriPointe 105 Under Construction Jordan Ranch - Parcel H TriPointe 45 Under Construction Under Construction Single-Family Detached development. Homes will be three stories. Includes 40 duet homes and five single-family detached homes on the northeast corner of Central Parkway and Fallon Road. There are three different floor plans ranging in size from 2,020 square feet to 2,196 square feet. Irongate - Ashbourne Lennar 107 Under Construction Three-Story Townhome project Wallis Ranch - Trestle Warmington Homes 60 Under Construction Three-plex subdivision. Enclave at Tassajara Highlands STL Co. 48 Grading began in Fall 2016 Single-Family detached subdivision. The Glen at Tassajar Hills Toll Brothers 107 In planning review Typical SFD subdivision. The Knolls at Tassajar Hills Toll Brothers 179 In planning review Typical SFD subdivision. The Bluffs at Tassajar Hills Toll Brothers 84 In planning review Typical SFD subdivision. Schaefer Ranch - Unit 3 Discovery 418 In planning review Single-Family Detached Development. Grafton Plaza Mixed-Use Talor Morrison 122 Under review Townhomes. Schaefer Ranch - Unit 2 Toll Brothers 418 Under Construction Single-Family Detached Development. The Perch at Downtown Dublin Trumark 60 Under Construction Townhome Development. N/A Wanmei Properties 19 Application Under Review Single-Family Detached. SOURCE: RCLCO; City of Dublin Planning Department Exhibit I-7 E Printed: 4/28/2017
296 CITY OF DUBLIN II. DEMOGRAPHIC AND HUD PERMIT TRENDS

297 CITY OF DUBLIN Exhibit II-1 MAP OF LOCAL CITIES DUBLIN, PLEASANTON, LIVERMORE, SAN RAMON, AND DANVILLE, CA SUBJECT SITE SOURCE: RCLCO; ESRI Business Analyst Exhibit II-1 E Printed: 4/28/2017
298 CITY OF DUBLIN Exhibit II-2 COMPARATIVE SOCIOECONOMIC CHARACTERISTICS CITIES OF DUBLIN, PLEASANTON, LIVERMORE, SAN RAMON, DANVILLE, ALAMEDA COUNTY, CONTRA COSTA COUNTY AND CALIFORNIA CHARACTERISTIC CITY OF DUBLIN CITY OF PLEASANTON CITY OF LIVERMORE CITY OF SAN RAMON CITY OF DANVILLE ALAMEDA COUNTY CONTRA COSTA COUNTY CALIFORNIA 2010 Population 46,036 70,317 81,117 72,013 42,039 1,510,271 1,049,025 37,253, Population 58,399 75,521 86,111 78,180 44,022 1,604,083 1,114,491 38,986, Population 65,551 80,847 91,736 84,171 46,191 1,702,529 1,178,090 40,718,391 Pop. Growth Rate, % 1.2% 1.0% 1.4% 0.8% 1.0% 1.0% 0.8% Pop. Growth Rate, % 1.4% 1.3% 1.5% 1.0% 1.2% 1.1% 0.9% 2010 Households 14,913 25,257 29,180 25,234 15, , ,364 12,577, Households 18,874 26,815 30,757 26,917 15, , ,883 13,029, Households 21,222 28,533 32,630 28,736 16, , ,637 13,549,437 Household Growth Rate, % 1.0% 0.9% 1.1% 0.6% 0.9% 0.8% 0.6% Household Growth Rate, % 1.2% 1.2% 1.3% 0.9% 1.1% 1.0% 0.8% 2016 Household Size Per Capita Income $48,652 $56,227 $46,257 $55,446 $67,620 $37,906 $40,989 $30, Median Household Income $121,032 $121,792 $103,300 $130,941 $139,237 $75,368 $82,977 $62, Average Household Income $145,596 $157,401 $129,360 $160,891 $186,056 $104,064 $115,160 $90, % Average Household Growth Rates, % 1.0% 0.9% 0.6% 1.1% 0.9% 0.8% 1.2% 1.2% 1.3% 0.9% 1.1% 1.0% 0.6% 0.8% CITY OF DUBLIN CITY OF PLEASANTON CITY OF LIVERMORE CITY OF DANVILLE CITY OF SAN RAMON ALAMEDA COUNTY Axis Title CONTRA COSTA COUNTY CALIFORNIA SOURCE: ESRI Business Analyst; RCLCO Exhibit II-2 E Printed: 4/28/2017

299 CITY OF DUBLIN Exhibit II-3 MEDIAN HOUSEHOLD INCOME BY ZIP CODES DUBLIN, CA Household Income Ranges <$50,000 $50,000 - $75,000 $75,000 - $100,000 $100,000 - $150,000 $150,000+ SUBJECT SITE SOURCE: ESRI Business Analyst Exhibit II-3 E Printed: 4/28/2017
300 CITY OF DUBLIN Exhibit II-4A HOUSEHOLD DISTRIBUTION BY INCOME AND AGE DUBLIN, PLEASANTON, LIVERMORE, SAN RAMON, DANVILLE, ALAMEDA & CONTRA COSTA COUNTY, AND CALIFORNIA % Household Distribution by Income 30% 25% 20% 15% 10% 5% 0% Less than $15,000 $15,000-$24,999 $25,000-$34,999 $35,000-$49,999 $50,000-$74,999 $75,000-$99,999 $100,000-$149,999 $150,000-$199,999 $200,000 and above Dublin Pleasanton Livermore San Ramon Danville Alameda & Contra Costa Counties California 35% Household Distribution by Age 30% 25% 20% 15% 10% 5% 0% Under and over Dublin Pleasanton Livermore San Ramon Danville Alameda & Contra Costa Counties California SOURCE: ESRI Business Analyst; RCLCO Exhibit II-4A E Printed: 4/28/2017
301 CITY OF DUBLIN Exhibit II-4B AGE OF HOUSEHOLDER BY INCOME CITY OF DUBLIN 2016 UNDER TOTAL INCOME RANGE TOTAL PCT TOTAL PCT TOTAL PCT TOTAL PCT TOTAL PCT TOTAL PCT TOTAL PCT TOTAL PCT Less than $15, % 125 4% 161 3% 94 2% 108 4% 71 4% 86 10% 694 4% $15,000 - $24, % 83 3% 107 2% 71 2% 78 3% 74 5% 91 11% 528 3% $25,000 - $34, % 105 3% 118 2% 78 2% 71 2% 66 4% 77 9% 540 3% $35,000 - $49, % 142 5% 174 3% 123 3% 103 3% 107 7% % 795 4% $50,000 - $74, % % 473 9% 361 8% % % % 2,181 12% $75,000 - $99, % % % 390 9% % % 53 6% 1,905 10% $100,000 - $149, % % 1,503 28% 1,232 28% % % % 5,177 27% $150,000 - $199, % % 1,106 20% % % % 34 4% 3,281 17% $200,000 and above 30 7% % 1,237 23% 1,158 26% % % 53 6% 3,773 20% TOTAL % 3, % 5, % 4, % 3, % 1, % % 18, % Percent of Total 2% 17% 29% 23% 16% 9% 5% 100% Median Income $78,302 $110,430 $133,568 $140,355 $125,236 $98,256 $55,121 $121,032 INCOME DISTRIBUTION DISTRIBUTION OF HOUSEHOLDERS BY AGE 27% 29% 17% 20% 23% 12% 10% 17% 16% 9% 4% 3% 3% 4% 2% 5% Less than $15,000 $15,000- $24,999 $25,000- $34,999 $35,000- $49,999 $50,000- $74,999 Income Range $75,000- $99,999 $100,000- $149,999 $150,000- $199,999 $200,000 and above Under and over Age of Householder SOURCE: ESRI Business Analyst; RCLCO Exhibit II-4B E Printed: 4/28/2017
302 CITY OF DUBLIN Exhibit II-4C AGE OF HOUSEHOLDER BY INCOME CITY OF PLEASANTON 2016 UNDER TOTAL INCOME RANGE TOTAL PCT TOTAL PCT TOTAL PCT TOTAL PCT TOTAL PCT TOTAL PCT TOTAL PCT TOTAL PCT Less than $15, % 107 4% 136 3% 165 2% 230 4% 139 4% % 1,113 4% $15,000 - $24, % 76 3% 99 2% 120 2% 142 2% 193 5% % 964 4% $25,000 - $34, % 123 5% 134 3% 137 2% 137 2% 177 5% % 975 4% $35,000 - $49, % 207 8% 252 5% 229 3% 237 4% 255 7% % 1,536 6% $50,000 - $74, % % % 524 7% 482 8% % % 2,852 11% $75,000 - $99, % % % 633 9% % % 186 8% 2,744 10% $100,000 - $149, % % 1,089 23% 1,697 24% 1,307 22% % % 5,949 22% $150,000 - $199, % % % 1,335 19% 1,092 18% % 120 5% 4,315 16% $200,000 and above 20 5% % 1,154 25% 2,374 33% 1,666 28% % 165 7% 6,364 24% TOTAL % 2, % 4, % 7, % 5, % 3, % 2, % 26, % Percent of Total 1% 10% 17% 27% 22% 13% 9% 100% Median Income $64,083 $103,951 $130,740 $152,721 $139,391 $104,759 $51,871 $121,792 INCOME DISTRIBUTION DISTRIBUTION OF HOUSEHOLDERS BY AGE 22% 24% 27% 16% 17% 22% 11% 10% 13% 4% 4% 4% 6% 10% 9% 1% Less than $15,000 $15,000- $24,999 $25,000- $34,999 $35,000- $49,999 $50,000- $74,999 Income Range $75,000- $99,999 $100,000- $149,999 $150,000- $199,999 $200,000 and above Under and over Age of Householder SOURCE: ESRI Business Analyst; RCLCO Exhibit II-4C E Printed: 4/28/2017
303 CITY OF DUBLIN Exhibit II-4D AGE OF HOUSEHOLDER BY INCOME CITY OF LIVERMORE 2016 UNDER TOTAL INCOME RANGE TOTAL PCT TOTAL PCT TOTAL PCT TOTAL PCT TOTAL PCT TOTAL PCT TOTAL PCT TOTAL PCT Less than $15, % 238 6% 243 4% 260 3% 274 4% 185 5% % 1,603 5% $15,000 - $24, % 180 4% 204 4% 195 3% 221 3% 237 6% % 1,438 5% $25,000 - $34, % 217 5% 222 4% 214 3% 191 3% 205 5% % 1,394 5% $35,000 - $49, % 328 8% 371 6% 321 4% 303 5% 333 9% % 2,138 7% $50,000 - $74, % % % 704 9% % % % 3,799 12% $75,000 - $99, % % % 1,001 13% % % 252 9% 4,354 14% $100,000 - $149, % % 1,332 23% 1,737 23% 1,393 22% % % 6,507 21% $150,000 - $199, % % 1,002 17% 1,411 19% 1,093 17% % 114 4% 4,644 15% $200,000 and above 25 4% 346 9% % 1,682 22% 1,215 19% % 110 4% 4,885 16% TOTAL % 4, % 5, % 7, % 6, % 3, % 2, % 30, % Percent of Total 2% 13% 19% 24% 21% 13% 9% 100% Median Income $58,957 $90,201 $111,763 $125,510 $114,099 $87,884 $46,965 $103,300 INCOME DISTRIBUTION DISTRIBUTION OF HOUSEHOLDERS BY AGE 21% 24% 12% 14% 15% 16% 13% 19% 21% 13% 7% 9% 5% 5% 5% 2% Less than $15,000 $15,000- $24,999 $25,000- $34,999 $35,000- $49,999 $50,000- $74,999 Income Range $75,000- $99,999 $100,000- $149,999 $150,000- $199,999 $200,000 and above Under and over Age of Householder SOURCE: ESRI Business Analyst; RCLCO Exhibit II-4D E Printed: 4/28/2017
304 CITY OF DUBLIN Exhibit II-4E AGE OF HOUSEHOLDER BY INCOME CITY OF SAN RAMON 2016 UNDER TOTAL INCOME RANGE TOTAL PCT TOTAL PCT TOTAL PCT TOTAL PCT TOTAL PCT TOTAL PCT TOTAL PCT TOTAL PCT Less than $15, % 120 4% 154 2% 145 2% 152 3% 71 3% % 834 3% $15,000 - $24, % 80 2% 94 1% 81 1% 88 2% 84 3% 117 9% 574 2% $25,000 - $34, % 126 4% 150 2% 141 2% 128 3% 109 4% % 829 3% $35,000 - $49, % 185 6% 208 3% 164 2% 171 3% 187 7% % 1,147 4% $50,000 - $74, % % 474 7% 447 6% 408 8% % % 2,575 10% $75,000 - $99, % % % 602 9% % % 100 7% 2,853 11% $100,000 - $149, % % 1,705 24% 1,684 24% 1,206 24% % % 6,513 24% $150,000 - $199, % % 1,541 22% 1,371 20% % % 81 6% 4,928 18% $200,000 and above 30 6% % 2,059 29% 2,286 33% 1,361 27% % 78 6% 6,663 25% TOTAL % 3, % 7, % 6, % 4, % 2, % 1, % 26, % Percent of Total 2% 12% 26% 26% 19% 10% 5% 100% Median Income $66,712 $108,164 $151,491 $155,159 $138,436 $108,028 $56,523 $130,941 INCOME DISTRIBUTION DISTRIBUTION OF HOUSEHOLDERS BY AGE 24% 25% 26% 26% 18% 19% 10% 11% 12% 10% 3% 2% 3% 4% 2% 5% Less than $15,000 $15,000- $24,999 $25,000- $34,999 $35,000- $49,999 $50,000- $74,999 Income Range $75,000- $99,999 $100,000- $149,999 $150,000- $199,999 $200,000 and above Under and over Age of Householder SOURCE: ESRI Business Analyst; RCLCO Exhibit II-4E E Printed: 4/28/2017
305 CITY OF DUBLIN Exhibit II-4F AGE OF HOUSEHOLDER BY INCOME CITY OF DANVILLE 2016 UNDER TOTAL INCOME RANGE TOTAL PCT TOTAL PCT TOTAL PCT TOTAL PCT TOTAL PCT TOTAL PCT TOTAL PCT TOTAL PCT Less than $15, % 19 2% 44 2% 73 2% 110 3% 58 2% 141 8% 448 3% $15,000 - $24, % 16 2% 28 1% 37 1% 58 1% 88 3% 106 6% 338 2% $25,000 - $34, % 26 3% 48 2% 63 2% 87 2% 96 4% % 504 3% $35,000 - $49, % 57 7% 102 4% 101 3% 139 3% 183 7% % 875 5% $50,000 - $74, % 87 10% 134 6% 194 5% 243 6% % % 1,460 9% $75,000 - $99, % % 215 9% 284 7% 352 9% % 135 7% 1,415 9% $100,000 - $149, % % % % % % % 3,473 22% $150,000 - $199, % % % % % % 113 6% 2,467 15% $200,000 and above 6 8% % % 1,692 42% 1,481 37% % % 4,963 31% TOTAL % % 2, % 4, % 4, % 2, % 1, % 15, % Percent of Total 0% 5% 15% 25% 25% 17% 12% 100% Median Income $73,819 $119,197 $157,644 $172,604 $157,028 $118,470 $59,725 $139,237 INCOME DISTRIBUTION DISTRIBUTION OF HOUSEHOLDERS BY AGE 31% 25% 25% 22% 15% 15% 17% 12% 3% 2% 3% 5% 9% 9% 0% 5% Less than $15,000 $15,000- $24,999 $25,000- $34,999 $35,000- $49,999 $50,000- $74,999 Income Range $75,000- $99,999 $100,000- $149,999 $150,000- $199,999 $200,000 and above Under and over Age of Householder SOURCE: ESRI Business Analyst; RCLCO Exhibit II-4F E Printed: 4/28/2017
306 CITY OF DUBLIN Exhibit II-4G AGE OF HOUSEHOLDER BY INCOME ALAMEDA COUNTY 2016 UNDER TOTAL INCOME RANGE TOTAL PCT TOTAL PCT TOTAL PCT TOTAL PCT TOTAL PCT TOTAL PCT TOTAL PCT TOTAL PCT Less than $15,000 5,438 26% 10,039 11% 9,340 8% 8,493 7% 10,672 10% 6,625 9% 9,650 19% 60,257 10% $15,000 - $24,999 2,887 14% 6,575 7% 6,384 6% 5,464 5% 6,398 6% 6,332 9% 8,690 17% 42,730 7% $25,000 - $34,999 2,708 13% 7,392 8% 7,245 6% 6,033 5% 5,585 5% 6,151 9% 5,782 11% 40,896 7% $35,000 - $49,999 2,845 13% 10,272 11% 11,058 10% 8,648 7% 8,415 8% 8,805 13% 7,318 14% 57,361 10% $50,000 - $74,999 3,077 14% 14,677 16% 15,081 13% 15,914 13% 15,948 15% 12,148 17% 7,680 15% 84,525 15% $75,000 - $99,999 1,575 7% 11,965 13% 14,458 13% 15,016 13% 14,586 13% 7,460 11% 4,279 8% 69,339 12% $100,000 - $149,999 1,737 8% 16,594 18% 23,008 20% 24,202 21% 19,927 18% 10,259 15% 4,944 10% 100,671 18% $150,000 - $199, % 7,557 8% 12,716 11% 14,501 12% 11,970 11% 5,368 8% 1,674 3% 54,347 9% $200,000 and above 415 2% 4,917 5% 14,064 12% 19,741 17% 15,714 14% 7,257 10% 1,994 4% 64,102 11% TOTAL 21, % 89, % 113, % 118, % 109, % 70, % 52, % 574, % Percent of Total 4% 16% 20% 21% 19% 12% 9% 100% Median Income $33,077 $66,373 $86,395 $98,803 $86,278 $62,718 $37,989 $75,368 INCOME DISTRIBUTION DISTRIBUTION OF HOUSEHOLDERS BY AGE 15% 18% 20% 21% 19% 10% 10% 12% 9% 11% 16% 12% 7% 7% 9% 4% Less than $15,000 $15,000- $24,999 $25,000- $34,999 $35,000- $49,999 $50,000- $74,999 Income Range $75,000- $99,999 $100,000- $149,999 $150,000- $199,999 $200,000 and above Under and over Age of Householder SOURCE: ESRI Business Analyst; RCLCO Exhibit II-4G E Printed: 4/28/2017
307 CITY OF DUBLIN Exhibit II-4H AGE OF HOUSEHOLDER BY INCOME CONTRA COSTA COUNTY 2016 UNDER TOTAL INCOME RANGE TOTAL PCT TOTAL PCT TOTAL PCT TOTAL PCT TOTAL PCT TOTAL PCT TOTAL PCT TOTAL PCT Less than $15,000 1,613 17% 4,533 9% 4,589 7% 4,525 5% 5,845 7% 3,633 7% 5,644 14% 30,382 8% $15,000 - $24, % 3,093 6% 3,227 5% 2,975 4% 3,751 5% 4,201 8% 5,941 14% 24,127 6% $25,000 - $34,999 1,180 13% 3,885 8% 3,858 5% 3,685 4% 3,727 5% 4,443 8% 4,844 12% 25,622 7% $35,000 - $49,999 1,522 16% 5,970 12% 6,400 9% 5,511 7% 5,823 7% 6,624 12% 6,402 15% 38,252 10% $50,000 - $74,999 1,815 19% 8,957 18% 9,474 13% 10,722 13% 11,417 14% 9,579 17% 7,278 17% 59,242 15% $75,000 - $99, % 7,432 15% 9,285 13% 10,798 13% 10,998 14% 6,685 12% 3,175 8% 49,343 13% $100,000 - $149, % 9,885 19% 14,821 21% 18,012 22% 16,323 20% 9,334 17% 4,548 11% 73,852 19% $150,000 - $199, % 4,441 9% 8,831 13% 11,195 13% 9,734 12% 4,709 8% 1,729 4% 40,856 10% $200,000 and above 185 2% 2,613 5% 10,032 14% 15,989 19% 13,790 17% 6,559 12% 2,039 5% 51,207 13% TOTAL 9, % 50, % 70, % 83, % 81, % 55, % 41, % 392, % Percent of Total 2% 13% 18% 21% 21% 14% 11% 100% Median Income $43,174 $71,072 $94,745 $106,619 $97,520 $72,846 $44,131 $82,977 INCOME DISTRIBUTION DISTRIBUTION OF HOUSEHOLDERS BY AGE 19% 8% 6% 7% 10% 15% 13% 10% 13% 13% 18% 21% 21% 14% 11% 2% Less than $15,000 $15,000- $24,999 $25,000- $34,999 $35,000- $49,999 $50,000- $74,999 Income Range $75,000- $99,999 $100,000- $149,999 $150,000- $199,999 $200,000 and above Under and over Age of Householder SOURCE: ESRI Business Analyst; RCLCO Exhibit II-4H E Printed: 4/28/2017
308 CITY OF DUBLIN Exhibit II-4I AGE OF HOUSEHOLDER BY INCOME CALIFORNIA 2016 UNDER TOTAL INCOME RANGE TOTAL PCT TOTAL PCT TOTAL PCT TOTAL PCT TOTAL PCT TOTAL PCT TOTAL PCT TOTAL PCT Less than $15,000 98,455 21% 244,582 12% 219,679 9% 209,082 8% 263,140 11% 158,614 9% 226,179 17% 1,419,731 11% $15,000 - $24,999 65,941 14% 181,533 9% 173,096 7% 154,185 6% 171,284 7% 170,099 10% 226,316 17% 1,142,454 9% $25,000 - $34,999 66,777 14% 199,163 10% 194,147 8% 169,137 7% 157,510 6% 170,834 10% 163,824 13% 1,121,392 9% $35,000 - $49,999 76,101 16% 280,146 14% 288,122 12% 245,456 9% 237,629 10% 239,305 14% 200,096 15% 1,566,855 12% $50,000 - $74,999 79,773 17% 366,020 18% 364,334 15% 409,968 16% 403,322 16% 310,502 18% 201,969 15% 2,135,888 16% $75,000 - $99,999 38,111 8% 268,799 13% 316,404 13% 364,174 14% 350,110 14% 183,941 11% 102,907 8% 1,624,446 12% $100,000 - $149,999 37,376 8% 319,166 15% 426,081 18% 483,160 19% 420,183 17% 217,701 13% 107,417 8% 2,011,084 15% $150,000 - $199,999 9,921 2% 130,919 6% 200,414 8% 248,058 10% 211,506 9% 103,170 6% 36,237 3% 940,225 7% $200,000 and above 7,332 2% 83,720 4% 219,575 9% 316,538 12% 267,136 11% 132,078 8% 40,608 3% 1,066,987 8% TOTAL 479, % 2,074, % 2,401, % 2,599, % 2,481, % 1,686, % 1,305, % 13,029, % Percent of Total 4% 16% 18% 20% 19% 13% 10% 100% Median Income $36,241 $56,881 $71,457 $81,226 $75,424 $56,321 $37,035 $82,977 INCOME DISTRIBUTION DISTRIBUTION OF HOUSEHOLDERS BY AGE 11% 9% 9% 12% 16% 12% 15% 7% 8% 16% 18% 20% 19% 13% 10% 4% Less than $15,000 $15,000- $24,999 $25,000- $34,999 $35,000- $49,999 $50,000- $74,999 Income Range $75,000- $99,999 $100,000- $149,999 $150,000- $199,999 $200,000 and above Under and over Age of Householder SOURCE: ESRI Business Analyst; RCLCO Exhibit II-4I E Printed: 4/28/2017
309 CITY OF DUBLIN Exhibit II-5A RESIDENTIAL PERMITTING ACTIVITY DUBLIN CALIFORNIA ,400 ANNUAL AVERAGE SINGLE-FAMILY MULTIFAMILY TOTAL % SINGLE-FAMILY % % % % 120% 1, % 1,000 80% Permits % 40% % Single-Family % 200 0% Multifamily Single-Family % Single-Family 0% 0% 100% 100% 0% 100% 36% 92% 11% 84% 87% 23% 61% 28% 28% 18% 18% 32% 99% 87% 66% 34% 70% 98% 75% 58% 99% -20% NOTE: Data for 2016 are preliminary. SOURCE: HUD Exhibit II-5A E Printed: 4/28/2017
310 CITY OF DUBLIN Exhibit II-5B RESIDENTIAL PERMITTING ACTIVITY PLEASANTON CALIFORNIA ,200 ANNUAL AVERAGE SINGLE-FAMILY MULTIFAMILY TOTAL % SINGLE-FAMILY % % % % 120% 1, % % Permits % % Single-Family % % Multifamily Single-Family % Single-Family 100% 84% 100% 94% 91% 100% 93% 87% 76% 43% 100% 65% 100% 100% 69% 100% 77% 90% 91% 100% 100% 100% 23% 20% 23% 9% 10% 0% NOTE: Data for 2016 are preliminary. SOURCE: HUD Exhibit II-5B E Printed: 4/28/2017
311 CITY OF DUBLIN Exhibit II-5C RESIDENTIAL PERMITTING ACTIVITY LIVERMORE CALIFORNIA ,200 ANNUAL AVERAGE SINGLE-FAMILY MULTIFAMILY TOTAL % SINGLE-FAMILY % % % % 120% 1, % % Permits % % Single-Family % % Multifamily Single-Family % Single-Family 93% 99% 100% 86% 86% 100% 100% 85% 93% 82% 89% 96% 67% 75% 59% 59% 79% 74% 89% 85% 82% 61% 47% 64% 83% 80% 79% 0% NOTE: Data for 2016 are preliminary. SOURCE: HUD Exhibit II-5C E Printed: 4/28/2017
312 CITY OF DUBLIN Exhibit II-5D RESIDENTIAL PERMITTING ACTIVITY SAN RAMON CALIFORNIA ANNUAL AVERAGE SINGLE-FAMILY MULTIFAMILY TOTAL % SINGLE-FAMILY % % % % 120% % % Permits % 40% % Single-Family % % Multifamily Single-Family % Single-Family 0% 69% 44% 58% 88% 81% 100% 100% 51% 52% 100% 100% 100% 0% 0% 100% 100% 100% 100% 0% 0% 0% 100% 0% 0% 12% 7% -20% NOTE: Data for 2016 are preliminary. SOURCE: HUD Exhibit II-5D E Printed: 4/28/2017
313 CITY OF DUBLIN Exhibit II-5E RESIDENTIAL PERMITTING ACTIVITY DANVILLE CALIFORNIA ANNUAL AVERAGE SINGLE-FAMILY MULTIFAMILY TOTAL % SINGLE-FAMILY % % % % Permits Multifamily Single-Family NOTE: Data for 2016 are preliminary. SOURCE: HUD Exhibit II-5E E Printed: 4/28/2017
314 CITY OF DUBLIN Exhibit II-5F RESIDENTIAL PERMITTING ACTIVITY ALAMEDA COUNTY CALIFORNIA ANNUAL AVERAGE SINGLE-FAMILY MULTIFAMILY TOTAL % SINGLE-FAMILY ,703 1,164 3,867 70% ,789 1,988 3,776 47% ,330 1,714 3,044 44% ,035 1,608 3,642 56% 7,000 90% 6,000 80% 70% 5,000 60% Permits 4,000 3,000 2,000 50% 40% 30% 20% % Single-Family 1,000 10% Multifamily 1,074 1, ,165 2,036 1, ,485 1,054 2,331 3,069 2,815 4,641 1,823 1, ,352 1,372 1,690 1,825 3,196 3,462 Single-Family 1,632 1,319 2,357 1,636 2,208 2,277 2,753 4,112 3,795 4,943 3,071 1,764 2,501 2,138 2,309 1,561 1,635 1, ,373 1,391 1,613 1,905 2,288 % Single-Family 60% 47% 77% 74% 73% 81% 78% 66% 65% 77% 76% 54% 70% 48% 43% 36% 26% 42% 40% 61% 51% 38% 50% 45% 47% 37% 40% 0% NOTE: Data for 2016 are preliminary. SOURCE: HUD Exhibit II-5F E Printed: 4/28/2017
315 CITY OF DUBLIN Exhibit II-5G RESIDENTIAL PERMITTING ACTIVITY CONTRA COSTA COUNTY CALIFORNIA ANNUAL AVERAGE SINGLE-FAMILY MULTIFAMILY TOTAL % SINGLE-FAMILY , ,839 84% , ,630 79% , ,866 73% , ,688 80% 8, % 7,000 90% Permits 6,000 5,000 4,000 3,000 2,000 1,000 80% 70% 60% 50% 40% 30% 20% 10% % Single-Family Multifamily 1,149 1, , ,850 1, , ,081 Single-Family 3,132 2,687 3,279 3,014 3,683 3,054 3,078 3,078 3,144 3,909 4,185 4,144 5,071 5,033 4,345 5,513 3,368 2,753 1,023 1, ,268 1,681 1,503 2,072 1,946 % Single-Family 73% 68% 84% 87% 94% 91% 87% 89% 76% 89% 76% 84% 88% 73% 78% 85% 80% 74% 50% 87% 53% 85% 59% 89% 75% 79% 64% 0% NOTE: Data for 2016 are preliminary. SOURCE: HUD Exhibit II-5G E Printed: 4/28/2017

316 CITY OF DUBLIN Exhibit II-6A COMMUTE PATTERNS - EMPLOYMENT LOCATIONS OF DUBLIN RESIDENTS DUBLIN, CA 2014 DISTANCE FROM DUBLIN NO. OF JOBS PERCENT OF TOTAL Less than 10 Miles 6,058 27% Miles 9,509 43% Miles 4,141 19% Greater than 50 Miles 2,435 11% TOTAL 22, % TOP WORK DESTINATION NO. OF JOBS PERCENT OF TOTAL Pleasanton 2,229 10% San Jose 1,475 7% San Francisco 1,425 6% Dublin 1,405 6% Oakland 1,183 5% San Ramon 1,126 5% Fremont 1,037 5% Livermore 1,020 5% Hayward 692 3% Sunnyvale 563 3% All Other Locations 9,988 45% TOTAL 22, % Tri-Valley Region 5,780 26% SOURCE: OnTheMap.CES.Census.gov Exhibit II-6A E Printed: 4/28/2017

317 CITY OF DUBLIN Exhibit II-6B COMMUTE PATTERNS - RESIDENTIAL LOCATIONS OF DUBLIN WORKERS DUBLIN, CA 2014 DISTANCE FROM DUBLIN NO. OF WORKERS PERCENT OF TOTAL Less than 10 Miles 4,936 31% Miles 5,188 33% Miles 3,021 19% Greater than 50 Miles 2,708 17% TOTAL 15, % TOP PLACE OF RESIDENCE NO. OF WORKERS PERCENT OF TOTAL Dublin 1,405 9% Livermore 1,022 6% Pleasanton 791 5% San Ramon 767 5% San Jose 583 4% Oakland 556 4% Hayward 526 3% Fremont 485 3% Castro Valley CDP 426 3% Concord 355 2% All Other Locations 8,937 56% TOTAL 15, % Tri-Valley Region 3,985 25% SOURCE: OnTheMap.CES.Census.gov Exhibit II-6B E Printed: 4/28/2017

318 CITY OF DUBLIN Exhibit II-7A COMMUTE PATTERNS - EMPLOYMENT LOCATIONS OF OAKLAND RESIDENTS OAKLAND, CA 2014 DISTANCE FROM OAKLAND NO. OF JOBS PERCENT OF TOTAL Less than 10 Miles 75,853 42% Miles 58,304 33% Miles 20,079 11% Greater than 50 Miles 25,096 14% TOTAL 179, % TOP WORK DESTINATION NO. OF JOBS PERCENT OF TOTAL Oakland 42,369 27% San Francisco 34,282 22% Berkeley 10,849 7% San Leandro 4,854 3% Hayward 4,207 3% Alameda 3,350 2% Emeryville 2,873 2% San Jose 2,790 2% Walnut Creek 2,113 1% Richmond 2,018 1% All Other Locations 49,246 31% TOTAL 158, % SOURCE: OnTheMap.CES.Census.gov Exhibit II-7A E Printed: 4/28/2017

319 CITY OF DUBLIN Exhibit II-7B COMMUTE PATTERNS - RESIDENTIAL LOCATIONS OF OAKLAND WORKERS OAKLAND, CA 2014 DISTANCE FROM OAKLAND NO. OF WORKERS PERCENT OF TOTAL Less than 10 Miles 87,734 55% Miles 44,949 28% Miles 11,199 7% Greater than 50 Miles 15,069 9% TOTAL 158, % TOP PLACE OF RESIDENCE NO. OF WORKERS PERCENT OF TOTAL Oakland 42,369 24% San Francisco 12,373 7% San Leandro 6,661 4% Alameda 6,290 4% Hayward 5,884 3% Berkeley 5,252 3% Richmond 4,163 2% San Jose 4,047 2% Castro Valley 3,940 2% Concord 2,886 2% Other 85,467 48% TOTAL 179, % SOURCE: OnTheMap.CES.Census.gov Exhibit II-7B E Printed: 4/28/2017

320 CITY OF DUBLIN Exhibit II-8A COMMUTE PATTERNS - EMPLOYMENT LOCATIONS OF SAN FRANCISCO RESIDENTS SAN FRANCISCO, CA 2014 DISTANCE FROM SAN FRANCISCO NO. OF JOBS PERCENT OF TOTAL Less than 10 Miles 260,177 67% Miles 48,429 12% Miles 44,918 12% Greater than 50 Miles 34,871 9% TOTAL 388, % TOP WORK DESTINATION NO. OF JOBS PERCENT OF TOTAL San Francisco 231,620 60% Oakland 12,373 3% Mountain View 8,539 2% South San Francisco 8,229 2% Palo Alto 6,986 2% San Jose 6,893 2% Los Angeles 5,143 1% San Mateo 4,912 1% Burlingame 4,728 1% Berkeley 4,081 1% All Other Locations 94,891 24% TOTAL 388, % SOURCE: OnTheMap.CES.Census.gov Exhibit II-8A E Printed: 4/28/2017

321 CITY OF DUBLIN Exhibit II-8B COMMUTE PATTERNS - RESIDENTIAL LOCATIONS OF SAN FRANCISCO WORKERS SAN FRANCISCO, CA 2014 DISTANCE FROM SAN FRANCISCO NO. OF WORKERS PERCENT OF TOTAL Less than 10 Miles 307,619 50% Miles 132,892 22% Miles 76,568 13% Greater than 50 Miles 93,692 15% TOTAL 610, % TOP PLACE OF RESIDENCE NO. OF WORKERS PERCENT OF TOTAL San Francisco 231,620 38% Oakland 34,282 6% Daly City 21,180 3% San Jose 13,525 2% South San Francisco 10,434 2% Los Angeles 9,663 2% Berkeley 8,944 1% San Mateo 8,732 1% Richmond 7,251 1% Alameda 7,189 1% All Other Locations 257,951 42% TOTAL 610, % SOURCE: OnTheMap.CES.Census.gov Exhibit II-8B E Printed: 4/28/2017
322 CITY OF DUBLIN III. ECONOMIC TRENDS
323 CITY OF DUBLIN YEAR TOTAL Exhibit III-1A HISTORICAL AND FORECASTED NON-AGRICULTURAL EMPLOYMENT, HOUSEHOLDS, AND POPULATION OAKLAND-HAYWARD-BERKELEY, CA MD (in thousands) EMPLOYMENT HOUSEHOLDS POPULATION ANNUAL PERCENT ANNUAL PERCENT ANNUAL CHANGE CHANGE TOTAL CHANGE CHANGE TOTAL CHANGE PERCENT CHANGE JOBS/HH HH SIZE , % % 2, % % % 2, % % % 2, % % % 2, % % % 2, % % % 2, % % % 2, % % % 2, % , % % 2, % , % % 2, % , % % 2, % , % % 2, % , % % 2, % , % % 2, % , % % 2, % , % % 2, % , % % 2, % , % % 2, % % % 2, % % % 2, % % % 2, % , % % 2, % , % % 2, % , % % 2, % , % % 2, % , % 1, % 2, % (f) 1, % 1, % 2, % (f) 1, % 1, % 2, % (f) 1, % 1, % 2, % (f) 1, % 1, % 2, % (f) 1, % 1, % 2, % NOTE: (f) denotes forecasted figure. SOURCE: Moody's Analytics; RCLCO Exhibit III-1A E Printed: 4/28/2017
324 CITY OF DUBLIN Exhibit III-1B HISTORICAL AND FORECASTED NON-AGRICULTURAL EMPLOYMENT, HOUSEHOLD, AND POPULATION GROWTH RATES OAKLAND-HAYWARD-BERKELEY, CA MD % 2% 0% Annual Growth Rate -2% -4% -6% -8% Employment Households Population NOTE: (f) denotes forecasted figure. SOURCE: Moody's Analytics; RCLCO Exhibit III-1B E Printed: 4/28/2017
325 CITY OF DUBLIN Exhibit III-2 HISTORICAL AND FORECASTED NON-AGRICULTURAL EMPLOYMENT GROWTH RATES OAKLAND-HAYWARD-BERKELEY, CA MD AND UNITED STATES % 2% 0% Annual Growth Rate -2% -4% -6% -8% Oakland-Hayward-Berkeley, CA MD United States NOTE: (f) denotes forecasted figure. SOURCE: Moody's Analytics; RCLCO Exhibit III-2 E Printed: 4/28/2017
326 CITY OF DUBLIN Exhibit III-3 HISTORICAL AND FORECASTED NON-AGRICULTURAL EMPLOYMENT OAKLAND-HAYWARD-BERKELEY, CA MD (in thousands) 1,400 Total 1,200 1,000 Employment (000s) Historical Moody's Projection NOTE: (f) denotes forecasted figure. SOURCE: Moody's Analytics; RCLCO Page 1 of 3 Exhibit III-3 E Printed: 4/28/2017
327 CITY OF DUBLIN Exhibit III-3 HISTORICAL AND FORECASTED NON-AGRICULTURAL EMPLOYMENT OAKLAND-HAYWARD-BERKELEY, CA MD (in thousands) 60 Growth Employment Growth (000s) Historical Moody's Projection Historical Avg. Annual Moody's Avg. Projection NOTE: (f) denotes forecasted figure. SOURCE: Moody's Analytics; RCLCO Page 2 of 3 Exhibit III-3 E Printed: 4/28/2017
328 CITY OF DUBLIN Exhibit III-3 HISTORICAL AND FORECASTED NON-AGRICULTURAL EMPLOYMENT OAKLAND-HAYWARD-BERKELEY, CA MD (in thousands) 4% Growth Rate 2% 0% Employment Growth Rate -2% -4% -6% -8% Historical Moody's Projection Historical Avg. Moody's Projection Avg. NOTE: (f) denotes forecasted figure. SOURCE: Moody's Analytics; RCLCO Page 3 of 3 Exhibit III-3 E Printed: 4/28/2017
329 CITY OF DUBLIN Exhibit III-4 HISTORICAL AND FORECASTED NON-AGRICULTURAL EMPLOYMENT BY INDUSTRY OAKLAND-HAYWARD-BERKELEY, CA MD (in thousands) Total Employment (000s) Edu. & Health Services Prof. & Business Services Trade, Transp. & Utilities Government Leisure & Hospitality Construction Manufacturing Financial Activities Other Services Information Natural Resources 50 0 NOTE: (f) denotes forecasted figure. SOURCE: Moody's Analytics; RCLCO Exhibit III-4 E Printed: 4/28/2017
330 CITY OF DUBLIN IV. FOR-SALE HOME SALES TRENDS
331 CITY OF DUBLIN Exhibit IV-1A RESIDENTIAL LISTINGS AND SALES BY SIZE RANGE BUILT 2005 OR LATER CITY OF DUBLIN AS OF MARCH 2017 DUBLIN LISTINGS DUBLIN SALES Single-Family < 1,000 SF 0 0% 0 0% 1, SF 0 0% 0 0% 1,500-2,000 SF 3 7% 25 14% 2,000-2,500 SF 21 49% 45 26% 2,500-3,000 SF 5 12% 32 18% 3,000+ SF 14 33% 72 41% Total % % Average Size Average Price Average Price per SF Attached/Condo 2,744 $1,137,231 $414 2,808 $1,134,293 $404 < 1,000 SF 2 18% 11 7% 1, SF 2 18% 51 30% 1,500-2,000 SF 3 27% 64 38% 2,000-2,500 SF 4 36% 32 19% 2,500-3,000 SF 0 0% 9 5% 3,000+ SF 0 0% 2 1% Total % % Average Size Average Price Average Price per SF ALL 1,679 $709,989 $423 1,698 $664,409 $391 < 1,000 SF 2 4% 11 3% 1, SF 2 4% 51 15% 1,500-2,000 SF 6 11% 89 26% 2,000-2,500 SF 25 46% 77 22% 2,500-3,000 SF 5 9% 41 12% 3,000+ SF 14 26% 74 22% Total % % Average Size Average Price Average Price per SF 2,528 $1,050,201 $416 2,261 $902,776 $398 NOTE: Listings data as of March13, 2017; Sales data from March 13, 2016 to March 13, 2017 SOURCE: Redfin; RCLCO Exhibit IV-1A E Printed: 4/28/2017
332 CITY OF DUBLIN Exhibit IV-1B RESIDENTIAL LISTINGS AND SALES BY PRICE RANGE BUILT 2005 OR LATER CITY OF DUBLIN AS OF MARCH 2017 DUBLIN LISTINGS DUBLIN SALES Single-Family < $500K 0 0% 0 0% $500K - $700K 0 0% 0 0% $700K - $900K 2 5% 36 21% $900K - $1M 13 30% 17 10% $1M - $1.2M 17 40% 49 28% $1.2M - $2.5M 11 26% 72 41% $2.5M+ 0 0% 0 0% Total % % Average Size Average Price Average Price per SF Attached/Condo 2,744 $1,137,231 $414 2,808 $1,134,293 $ < $500K 2 18% 11 7% $500K - $700K 3 27% 88 52% $700K - $900K 6 55% 66 39% $900K - $1M 0 0% 4 2% $1M - $1.2M 0 0% 0 0% $1.2M - $2.5M 0 0% 0 0% $2.5M+ 0 0% 0 0% Total % % Average Size Average Price Average Price per SF ALL 1,679 $709,989 $423 1,698 $664,409 $ < $500K 2 4% 11 3% $500K - $700K 3 6% 88 26% $700K - $900K 8 15% % $900K - $1M 13 24% 21 6% $1M - $1.2M 17 31% 49 14% $1.2M - $2.5M 11 20% 72 21% $2.5M+ 0 0% 0 0% Total % % Average Size Average Price Average Price per SF 2,528 $1,050,201 $416 2,261 $902,776 $398 NOTE: Listings data as of March, ; Sales data from March 13, 2016 to March 13, 2017 SOURCE: Redfin; RCLCO Exhibit IV-1B E Printed: 4/28/2017
333 CITY OF DUBLIN Exhibit IV-1C RESIDENTIAL LISTINGS AND SALES BY SIZE RANGE BUILT 2005 OR LATER TRI-VALLEY AREA AS OF MARCH 2017 TRI-VALLEY LISTINGS TRI-VALLEY SALES Single-Family < 1,000 SF 0 0% 0 0% 1, SF 0 0% 10 2% 1,500-3,000 SF 10 10% % 3,000-3,500 SF 30 29% 84 17% 3,500-4,000 SF 16 16% 84 17% 4,000+ SF 46 45% % Total % % Average Size Average Price Average Price per SF Attached/Condo 3,217 $1,479,501 $460 2,940 $1,262,065 $429 < 1,000 SF 4 13% 26 6% 1, SF 10 31% 88 19% 1,500-3,000 SF 12 38% % 3,000-3,500 SF 6 19% 99 22% 3,500-4,000 SF 0 0% 34 7% 4,000+ SF 0 0% 52 11% Total % % Average Size Average Price Average Price per SF ALL 1,600 $707,940 $443 1,975 $799,213 $405 < 1,000 SF 4 3% 26 3% 1, SF 10 7% 98 10% 1,500-3,000 SF 22 16% % 3,000-3,500 SF 36 27% % 3,500-4,000 SF 16 12% % 4,000+ SF 46 34% % Total % % Average Size Average Price Average Price per SF 2,831 $1,295,248 $456 2,482 $1,042,234 $418 NOTE: Listings data as of March, ; Sales data from March 13, 2016 to March 13, 2017 SOURCE: Redfin; RCLCO Exhibit IV-1C E Printed: 4/28/2017
334 CITY OF DUBLIN Exhibit IV-1D RESIDENTIAL LISTINGS AND SALES BY PRICE RANGE BUILT 2005 OR LATER TRI-VALLEY AREA AS OF MARCH 2017 TRI-VALLEY LISTINGS TRI-VALLEY SALES Single-Family < $500K 0 0% 8 2% $500K - $700K 0 0% 34 7% $700K - $900K 7 7% 79 16% $900K - $1M 21 21% 53 11% $1M - $1.2M 27 26% 83 17% $1.2M - $2.5M 38 37% % $2.5M+ 9 9% 17 3% Total % % Average Size Average Price Average Price per SF Attached/Condo 3,217 $1,479,501 $460 2,940 $1,262,065 $429 < $500K 2 6% 13 3% $500K - $700K 14 44% % $700K - $900K 15 47% % $900K - $1M 1 3% 19 4% $1M - $1.2M 0 0% 45 10% $1.2M - $2.5M 0 0% 48 11% $2.5M+ 0 0% 0 0% Total % % Average Size Average Price Average Price per SF ALL 1,600 $707,940 $443 1,975 $799,213 $405 < $500K 2 1% 21 2% $500K - $700K 14 10% % $700K - $900K 22 16% % $900K - $1M 22 16% 72 8% $1M - $1.2M 27 20% % $1.2M - $2.5M 38 28% % $2.5M+ 9 7% 17 2% Total % % Average Size Average Price Average Price per SF 2,831 $1,295,248 $456 2,481 $1,041,981 $418 NOTE: Listings data as of March, ; Sales data from March 13, 2016 to March 13, 2017 SOURCE: Redfin; RCLCO Exhibit IV-1D E Printed: 4/28/2017
335 CITY OF DUBLIN Exhibit IV-2 RESIDENTIAL HOME SALE CAPTURE RATES CITY OF DUBLIN IN RELATION TO THE TRI-VALLEY AREA MARCH MARCH 2017 CITY OF DUBLIN TRI-VALLEY CITY CAPTURE OF REGION < $500K % $500K - $700K % $700K - $900K % $900K - $1M % $1M - $1.2M % $1.2M - $2.5M % $2.5M % Total % < $500K $500K - $700K $700K - $900K $900K - $1M $1M - $1.2M $1.2M - $2.5M $2.5M+ CITY OF DUBLIN TRI-VALLEY SOURCE: Redfin; RCLCO Exhibit IV-2 E Printed: 4/28/2017
336 CITY OF DUBLIN Exhibit IV-3 SINGLE-FAMILY HOME/TOWNHOME RESALES BUILT 2005 OR LATER TRI-VALLEY AREA MARCH 2016-MARCH 2017 $3,500,000 $3,000,000 $2,500,000 Sale Price $2,000,000 $1,500,000 Dublin Pleasanton San Ramon Livermore Danville $1,000,000 $500,000 $ ,500 2,500 3,500 4,500 5,500 Unit Size (SF) SOURCE: Redfin; RCLCO Exhibit IV-3 E Printed: 4/28/2017
337 CITY OF DUBLIN Exhibit IV-4A MONTHLY MEDIAN HOME PRICE EXISTING SINGLE-FAMILY DETACHED HOMES CONTRA COSTA COUNTY, ALAMEDA COUNTY, AND CALIFORNIA JANUARY 1990-JUNE 2016 $800,000 $700,000 $600,000 $500,000 $400,000 California Contra Costa Alameda County $300,000 $200,000 $100,000 $0 SOURCE: California Association of Realtors; RCLCO Exhibit IV-4A E Printed: 4/28/2017
338 CITY OF DUBLIN Exhibit IV-4B MONTHLY MEDIAN HOME PRICE CITIES IN TRI-VALLEY AREA JANUARY 1997-JUNE 2016 $1,400,000 $1,200,000 $1,000,000 Median Sale Price $800,000 $600,000 Dublin Pleasanton Livermore San Ramon Danville Tri-Valley PMA Average $400,000 $200,000 $0 SOURCE: Zillow; RCLCO Exhibit IV-4B E Printed: 4/28/2017
339 CITY OF DUBLIN V. SITE ANALYSIS

340 CITY OF DUBLIN Exhibit V-1A REGIONAL MAP DUBLIN CROSSING MASTER-PLANNED COMMUNITY DUBLIN, CA AND SAN FRANCISCO BAY AREA APRIL 2017 SUBJECT SITE -- Dublin Crossing Master-Planned Community, Dublin, California SOURCE: Google; RCLCO Exhibit V-1A E Printed: 4/28/2017

341 CITY OF DUBLIN Exhibit V-1B MAP OF SUBJECT SITE AREA DUBLIN CROSSING MASTER-PLANNED COMMUNITY DUBLIN, CA APRIL 2017 Subject Site: Dublin Crossing SOURCE: Google; RCLCO Exhibit V-1B E Printed: 4/28/2017

342 CITY OF DUBLIN Exhibit V-1C MAP OF SURROUNDING USES DUBLIN CROSSING MASTER-PLANNED COMMUNITY DUBLIN, CA APRIL 2017 Dublin Elementary Dublin High School Frederiksen Elementary Federal Correctional Insitution Santa Rita Rehabilitation Center County Sheriffs Office/Highway Patrol Public Works Equipment Repair Fire Station Valley High School Wells MIddle School Camp Parks Subject Site: Dublin Crossing Office/ Hostpitality James Dougherty Elementary Emerald Glen Park Car Dealerships Shops at Waterford Dublin Place/Retail Uses Retail Uses Library/ Public Sports Grounds Industrial/ Office Uses Dublin Station Persimmon Square Hacienda Crossing Office Uses Office/ Hostpitality Club Sport Office/ Industrial Retail D/P BART Station Kaiser Permanente Oracle Metro 580 Retail Office Retail Stoneridge Mall/Retail Dublin San Ramon Services District Office Retail/ Hostpitality Valley Care Medical Center Kaiser Hostpital Fire Station Val Vista Park Hart Middle School Office/ Industrial Retail Fairlands Elementary SOURCE: Google; RCLCO Exhibit V-1C E Printed: 4/28/2017
343 CITY OF DUBLIN Exhibit V-2 SITE ASSESSMENT DUBLIN CROSSING MASTER-PLANNED COMMUNITY DUBLIN, CA APRIL 2017 FACTOR Community Execution Amenities Surrounding Uses Visibility/Access Commute Retail Schools Topography/Aesthetics NOTES Phase 1 is the initial development phase of the larger, multi-phased master-planned community of Dublin Crossing. Phase 1 of Dublin Crossing has plans fpr 453 homes at build out and is assumed to be a well-executed community, similar to those at the top of the market. Dublin Crossing is planned to include a 30-acre community park, a five-acre neighborhood park, an elementary or K-8 school, Iron Horse Trail corridor that runs through the site to Pleasanton and Concord, an extensive internal bicycle trail, an open space wildlife refuge facility, and Iron Horse Trail bridge that crosses Dublin Boulevard. These amenities will commence construction starting in Phase 2. Phase 1 homebuyers will have access to these amenities but not until Phase 2 is underway. Dublin Crossing is located in the center of Dublin. To the south is Dublin Station, a high-density, low-rise residential community featuring both rental and for-sale products. To the east and west is residential and commercial development. Improvement Area 1 or Phase 1 is located in the southern section of Dublin Crossing. The planned community is located along Dublin Boulevard, the primary East-West road in the city, and is located between two freeway on-/off-ramps from I-580. The site is located within half a mile of the Dublin/Pleasanton BART station which connects the area to the broader San Francisco Bay Area. The site is also conveniently located approximately one mile from two on-/off-ramps to Interstate-580 which provides access to the East Bay and the broader region. On-/off-Ramps to Interstate-680, which provides access north to Walnut Creek and south to San Jose, are accessible within 2 miles of the site. The site is located within a mile of Hacienda Crossings, a power center featuring a variety of entertainment, restaurants, and shopping destinations. Persimmon Place, a new retail shopping center, recently opened adjacent to Hacienda Crossings and is anchored by Whole Foods, Nordstrom Rack, and Home Goods. The site is approximately 1.5 miles from the nearest grocery store, anchored by Safeway. In addition, Stoneridge Shopping Center, a Class A regional mall with 1.3 million square feet of retail is located approximately 2.5 miles away. Several Power Centers anchored by a Wal-Mart Supercenter and Target are located both to the east and west. The local schools within Dublin Crossing's school district include Frederiksen Elementary, Wells Middle School, and Dublin High School, as well as the school that will be developed within the community. These schools achieve significantly higher API scores and GreatSchools ratings than the schools in Alameda County, and these scores are relatively similar to comparable schools in surrounding cities, including Pleasanton, Livermore, Danville and San Ramon. The site is flat, featuring no discernible changes in view or topography. The site will, however, have to mitigate the negative perception of being located in close proximity to the Federal Correctional Institution. SOURCE: RCLCO Exhibit V-2 E Printed: 4/28/2017

344 CITY OF DUBLIN Exhibit V-3A MAP OF LOCAL SCHOOLS DUBLIN, CA APRIL 2017 MAP GREAT SCHOOLS API KEY SCHOOL RATING 1 SCORE James Dougherty John Green Dublin Frederiksen Harold William Kolb Murray Eleanor Murray Fallon Wells Dublin Elementary School Middle School High School SUBJECT SITE -- Dublin Crossing 1 Great Schools Rating is a 10-point ranking systme; API Score is a 1,000-point ranking system. NOTE: GreatSchools is a non-profit organization with profiles of more than 200,000 prek-12 schools public, public charter and private and over one million reviews from parents, teachers and students sharing information about the schools. SOURCE: Greatschools.org; RCLCO Exhibit V-3A E Printed: 4/28/2017
$12,850,000 COUNTY OF EL DORADO COMMUNITY FACILITIES DISTRICT NO (CARSON CREEK) SPECIAL TAX BONDS SERIES 2016
 SPECIAL TAX BONDS SERIES 2016") NEW ISSUE-FULL BOOK ENTRY NOT RATED In the opinion of Jones Hall, A Professional Law Corporation, San Francisco, California, Bond Counsel, subject, however to certain qualifications described herein, under
NEW ISSUE-FULL BOOK ENTRY NOT RATED In the opinion of Jones Hall, A Professional Law Corporation, San Francisco, California, Bond Counsel, subject, however to certain qualifications described herein, under
$5,265,000 COMMUNITY FACILITIES DISTRICT NO OF THE MENIFEE UNION SCHOOL DISTRICT 2018 SPECIAL TAX BONDS
 NEW ISSUE NOT RATED In the opinion of Jones Hall, A Professional Law Corporation, San Francisco, California, Bond Counsel, subject, however to certain qualifications described herein, under existing law,
$4,810,000 COMMUNITY FACILITIES DISTRICT NO. 26 (EASTVALE AREA) OF JURUPA COMMUNITY SERVICES DISTRICT SPECIAL TAX BONDS, 2015 SERIES A
 OF JURUPA COMMUNITY SERVICES DISTRICT SPECIAL TAX BONDS, 2015 SERIES A") NEW ISSUE BOOK-ENTRY ONLY NO RATING In the opinion of Best Best & Krieger LLP, Riverside, California, Bond Counsel, subject to certain qualifications described in the Official Statement, under existing
NEW ISSUE BOOK-ENTRY ONLY NO RATING In the opinion of Best Best & Krieger LLP, Riverside, California, Bond Counsel, subject to certain qualifications described in the Official Statement, under existing
SECOND SUPPLEMENT TO THE OFFICIAL STATEMENT DATED MAY 14, 2014
 SECOND SUPPLEMENT TO THE OFFICIAL STATEMENT DATED MAY 14, 2014 relating to the $4,680,000 CALIFORNIA STATEWIDE COMMUNITIES DEVELOPMENT AUTHORITY STATEWIDE COMMUNITY INFRASTRUCTURE PROGRAM REVENUE BONDS
NEW ISSUE, BOOK-ENTRY ONLY RATING: S&P A- (See RATING herein)
") NEW ISSUE, BOOK-ENTRY ONLY RATING: S&P A- (See RATING herein) In the opinion of Quint & Thimmig LLP, Larkspur, California, Bond Counsel, subject however, to certain qualifications described herein, under
NEW ISSUE, BOOK-ENTRY ONLY RATING: S&P A- (See RATING herein) In the opinion of Quint & Thimmig LLP, Larkspur, California, Bond Counsel, subject however, to certain qualifications described herein, under
COUNTY OF EL DORADO COMMUNITIES FACILITIES DISTRICT NO (Blackstone) $20,920, SERIES A SENIOR LIEN SPECIAL TAX BONDS
 $20,920, SERIES A SENIOR LIEN SPECIAL TAX BONDS") NEW ISSUE RATINGS: AGM INSURED BONDS: S&P: AA SENIOR BONDS UNDERLYING RATING: S&P: BBB See RATINGS herein JUNIOR (SUBORDINATE) BONDS NOT RATED OR INSURED In the opinion of Jones Hall, A Professional Law
NEW ISSUE RATINGS: AGM INSURED BONDS: S&P: AA SENIOR BONDS UNDERLYING RATING: S&P: BBB See RATINGS herein JUNIOR (SUBORDINATE) BONDS NOT RATED OR INSURED In the opinion of Jones Hall, A Professional Law
$6,165,000 COMMUNITY FACILITIES DISTRICT NO. 15 OF RIVERSIDE UNIFIED SCHOOL DISTRICT (IMPROVEMENT AREA NO. 3) SPECIAL TAX BONDS, 2013 SERIES C
 SPECIAL TAX BONDS, 2013 SERIES C") NEW ISSUE BOOK-ENTRY-ONLY NO RATING In the opinion of Best Best & Krieger LLP, Riverside, California, Bond Counsel, subject to certain qualifications described in the Official Statement, under existing
NEW ISSUE BOOK-ENTRY-ONLY NO RATING In the opinion of Best Best & Krieger LLP, Riverside, California, Bond Counsel, subject to certain qualifications described in the Official Statement, under existing
Due: September 2 as Shown on the Inside Front Cover.
 NEW ISSUE BOOK-ENTRY ONLY NOT RATED (See CONCLUDING INFORMATION - No Rating on the Bonds; Secondary Market herein) In the opinion of Fulbright & Jaworski L.L.P., Los Angeles, California, under existing
UBS Financial Services Inc.
 In the opinion of Orrick, Herrington & Sutcliffe LLP, Bond Counsel, based upon an analysis of existing laws, regulations, rulings and court decisions, and assuming, among other matters, the accuracy of
$24,210,000 STOCKTON PUBLIC FINANCING AUTHORITY REVENUE BONDS (ARCH ROAD EAST CFD NO ) SERIES 2018A
 SERIES 2018A") NEW ISSUE-FULL BOOK ENTRY NO RATING In the opinion of Quint & Thimmig LLP, Larkspur, California, Bond Counsel, subject to compliance by the Stockton Public Financing Authority and the City of Stockton,
NEW ISSUE-FULL BOOK ENTRY NO RATING In the opinion of Quint & Thimmig LLP, Larkspur, California, Bond Counsel, subject to compliance by the Stockton Public Financing Authority and the City of Stockton,
NEW ISSUE - BOOK-ENTRY ONLY
 NEW ISSUE - BOOK-ENTRY ONLY NOT RATED In the opinion of Bond Counsel, under existing statutes, regulations, rulings and court decisions, and assuming compliance with the tax covenants described herein,
Honorable John Chiang Treasurer of the State of California as Agent for Sale
 NEW ISSUES FULL BOOK-ENTRY NOT RATED In the opinion of Orrick, Herrington & Sutcliffe LLP, Bond Counsel to the Authority, based upon an analysis of existing laws, regulations, rulings and court decisions
$16,135,000 CITY OF ONTARIO COMMUNITY FACILITIES DISTRICT NO. 24 (PARK PLACE FACILITIES PHASE I) SPECIAL TAX BONDS, SERIES 2016
 SPECIAL TAX BONDS, SERIES 2016") NEW ISSUE BOOK-ENTRY-ONLY NO RATING In the opinion of Orrick, Herrington & Sutcliffe LLP, Bond Counsel to the District, based upon an analysis of existing laws, regulations, rulings and court decisions
NEW ISSUE BOOK-ENTRY-ONLY NO RATING In the opinion of Orrick, Herrington & Sutcliffe LLP, Bond Counsel to the District, based upon an analysis of existing laws, regulations, rulings and court decisions
$4,355,000 COMMUNITY FACILITIES DISTRICT NO OF THE TEMECULA VALLEY UNIFIED SCHOOL DISTRICT 2014 SPECIAL TAX BONDS
 NEW ISSUE NOT RATED In the opinion of Bowie, Arneson, Wiles & Giannone, Newport Beach, California, Bond Counsel, subject, however, to certain qualifications described herein, under existing laws, regulations,
Rod Gunn Associates, Inc.
 NEW ISSUE-BOOK ENTRY ONLY NOT RATED (See CONCLUDING INFORMATION - No Rating on the Bonds herein) In the opinion of Fulbright & Jaworski L.L.P., Los Angeles, California, Bond Counsel, under existing law
$5,915,000 CITY OF FONTANA COMMUNITY FACILITIES DISTRICT NO. 71 (SIERRA CREST) SPECIAL TAX BONDS, SERIES 2016
 SPECIAL TAX BONDS, SERIES 2016") NEW ISSUE BOOK-ENTRY-ONLY NO RATING In the opinion of Orrick, Herrington & Sutcliffe LLP, Bond Counsel to the District, based upon an analysis of existing laws, regulations, rulings and court decisions
NEW ISSUE BOOK-ENTRY-ONLY NO RATING In the opinion of Orrick, Herrington & Sutcliffe LLP, Bond Counsel to the District, based upon an analysis of existing laws, regulations, rulings and court decisions
$23,155,000 COUNTY OF SACRAMENTO COMMUNITY FACILITIES DISTRICT NO (NORTH VINEYARD STATION NO. 1) SPECIAL TAX BONDS, SERIES 2016
 SPECIAL TAX BONDS, SERIES 2016") NEW ISSUE (Book-Entry Only) NO RATING In the opinion of Orrick, Herrington & Sutcliffe LLP, Bond Counsel to the County, based upon an analysis of existing laws, regulations, rulings and court decisions,
NEW ISSUE (Book-Entry Only) NO RATING In the opinion of Orrick, Herrington & Sutcliffe LLP, Bond Counsel to the County, based upon an analysis of existing laws, regulations, rulings and court decisions,
$8,800,000 COUNTY OF SAN BERNARDINO COMMUNITY FACILITIES DISTRICT NO (LYTLE CREEK NORTH) IMPROVEMENT AREA NO. 5 SPECIAL TAX BONDS, SERIES 2017
 IMPROVEMENT AREA NO. 5 SPECIAL TAX BONDS, SERIES 2017") NEW ISSUE - BOOK-ENTRY-ONLY NO RATING In the opinion of Orrick, Herrington & Sutcliffe LLP, Bond Counsel to the District, based upon an analysis of existing laws, regulations, rulings and court decisions,
NEW ISSUE - BOOK-ENTRY-ONLY NO RATING In the opinion of Orrick, Herrington & Sutcliffe LLP, Bond Counsel to the District, based upon an analysis of existing laws, regulations, rulings and court decisions,
CELEBRATION COMMUNITY DEVELOPMENT DISTRICT (Osceola County, Florida) $6,035,000 Special Assessment Bonds Series 2003A
 $6,035,000 Special Assessment Bonds Series 2003A") New Issue - Book-Entry Only NOT RATED (See Absence of Ratings herein) In the opinion of Bond Counsel with respect to the Series 2003A Bonds, assuming compliance with certain tax covenants, interest on
New Issue - Book-Entry Only NOT RATED (See Absence of Ratings herein) In the opinion of Bond Counsel with respect to the Series 2003A Bonds, assuming compliance with certain tax covenants, interest on
$12,280,000 CITY OF CHULA VISTA COMMUNITY FACILITIES DISTRICT NO. 16-I (MILLENIA) IMPROVEMENT AREA NO SPECIAL TAX BONDS
 IMPROVEMENT AREA NO SPECIAL TAX BONDS") NEW ISSUE BOOK-ENTRY-ONLY NO RATING In the opinion of Best Best & Krieger, LLP San Diego, California ( Bond Counsel ), subject to certain qualifications described in this Official Statement, under existing
NEW ISSUE BOOK-ENTRY-ONLY NO RATING In the opinion of Best Best & Krieger, LLP San Diego, California ( Bond Counsel ), subject to certain qualifications described in this Official Statement, under existing
Rod Gunn Associates, Inc.
 NEW ISSUE-BOOK ENTRY ONLY NOT RATED (See CONCLUDING INFORMATION - No Rating on the Bonds herein) In the opinion of Fulbright & Jaworski L.L.P., Los Angeles, California, Bond Counsel, under existing law
$75,000,000* MIAMI WORLD CENTER COMMUNITY DEVELOPMENT DISTRICT (Miami-Dade County, Florida) Special Assessment Bonds Series 2017
 Special Assessment Bonds Series 2017") This Preliminary Limited Offering Memorandum and the information contained herein are subject to completion or amendment without notice. These securities may not be sold nor may an offer to buy be accepted
This Preliminary Limited Offering Memorandum and the information contained herein are subject to completion or amendment without notice. These securities may not be sold nor may an offer to buy be accepted
$215,000 Public Finance Authority Multifamily Housing Revenue Bonds (The Rubix Apartments) Taxable Series 2017B
 Taxable Series 2017B") NEW ISSUE - Book Entry Only RATINGS: S&P Senior Bonds A- (Stable Outlook) S&P Subordinate Bonds BBB- (Stable Outlook) See RATINGS herein In the opinion of Butler Snow LLP, Bond Counsel, under existing
NEW ISSUE - Book Entry Only RATINGS: S&P Senior Bonds A- (Stable Outlook) S&P Subordinate Bonds BBB- (Stable Outlook) See RATINGS herein In the opinion of Butler Snow LLP, Bond Counsel, under existing
BOARD OF SUPERVISORS RESOLUTION NO
 Kenosha County BOARD OF SUPERVISORS RESOLUTION NO. 2017- Subject: A Resolution Authorizing and Providing for the Sale and Issuance of $5,315,000 General Obligation Law Enforcement Enhancement Bonds, Series
JH:SRF:JMG:brf AGENDA DRAFT 4/06/2016 ESCROW AGREEMENT
 23090-12 JH:SRF:JMG:brf AGENDA DRAFT 4/06/2016 ESCROW AGREEMENT THIS ESCROW AGREEMENT (the Agreement ) is dated as of May 1, 2016, and is entered into by and between the MT. DIABLO UNIFIED SCHOOL DISTRICT
NEW ISSUE BOOK ENTRY ONLY
 NEW ISSUE BOOK ENTRY ONLY NOT RATED In the opinion of Stradling Yocca Carlson & Rauth, a Professional Corporation, Newport Beach, California, Bond Counsel, under existing statutes, regulations, rulings
Goals and Policies Concerning Use of MELLO-ROOS COMMUNITY FACILITIES ACT OF 1982
 Goals and Policies Concerning Use of MELLO-ROOS COMMUNITY FACILITIES ACT OF 1982 Section TABLE OF CONTENTS Page Introduction 1 1 Policy & Goals 1 2 Definitions 2 3 Eligible Public Facilities 3 4 Value-to-Lien
ISSAQUAH SCHOOL DISTRICT NO. 411 KING COUNTY, WASHINGTON UNLIMITED TAX GENERAL OBLIGATION BONDS, 2013A (TAX-EXEMPT)
") ISSAQUAH SCHOOL DISTRICT NO. 411 KING COUNTY, WASHINGTON UNLIMITED TAX GENERAL OBLIGATION BONDS, 2013A (TAX-EXEMPT) UNLIMITED TAX GENERAL OBLIGATION REFUNDING BONDS, 2013B (TAXABLE) RESOLUTION NO. 1025
ISSAQUAH SCHOOL DISTRICT NO. 411 KING COUNTY, WASHINGTON UNLIMITED TAX GENERAL OBLIGATION BONDS, 2013A (TAX-EXEMPT) UNLIMITED TAX GENERAL OBLIGATION REFUNDING BONDS, 2013B (TAXABLE) RESOLUTION NO. 1025
MATURITY SCHEDULE. (see inside front cover)
") NEW ISSUE BOOK-ENTRY ONLY RATINGS: Moody s: Aa3 ; Standard & Poor s: AA+ (See Ratings herein.) In the opinion of Stradling Yocca Carlson & Rauth, a Professional Corporation, San Francisco, California (
NEW ISSUE BOOK-ENTRY ONLY RATINGS: Moody s: Aa3 ; Standard & Poor s: AA+ (See Ratings herein.) In the opinion of Stradling Yocca Carlson & Rauth, a Professional Corporation, San Francisco, California (
BOARD OF SUPERVISORS RESOLUTION NO
 Kenosha County BOARD OF SUPERVISORS RESOLUTION NO. 2017- Subject: A Resolution Authorizing and Providing for the Sale and Issuance of $13,255,000 General Obligation Promissory Notes, Series 2017A, and
$9,550,000 UNIVERSITY PLACE TRANSPORTATION DEVELOPMENT DISTRICT (ST
 NEW ISSUE NOT RATED Book Entry Only In the opinion of Armstrong Teasdale LLP, Bond Counsel, under existing law and assuming continued compliance with certain requirements of the Internal Revenue Code of
ASSESSMENT BONDS, SERIES 2011 (WAXAHACHIE PUBLIC IMPROVEMENT DISTRICT NO. 1 PHASE I PROJECT)
") NEW ISSUE NOT RATED In the opinion of Bond Counsel, interest on the Series 2011 Bonds will be excludable from gross income for purposes of federal income taxation under the existing statutes, subject to
NEW ISSUE NOT RATED In the opinion of Bond Counsel, interest on the Series 2011 Bonds will be excludable from gross income for purposes of federal income taxation under the existing statutes, subject to
ESCROW AGREEMENT RELATING TO THE DEFEASANCE OF PORTIONS OF
 ESCROW AGREEMENT RELATING TO THE DEFEASANCE OF PORTIONS OF $168,838,667.35 CHABOT-LAS POSITAS COMMUNITY COLLEGE DISTRICT (Alameda and Contra Costa Counties, California) General Obligation Bonds, Election
$93,110,000 COMMUNITY FACILITIES DISTRICT NO OF THE COUNTY OF ORANGE (VILLAGE OF ESENCIA) SERIES A OF 2016 SPECIAL TAX BONDS
 SERIES A OF 2016 SPECIAL TAX BONDS") NEW ISSUE BOOK-ENTRY ONLY NO RATING In the opinion of Stradling Yocca Carlson & Rauth, a Professional Corporation, Newport Beach, California, Bond Counsel, subject to certain qualifications described in
NEW ISSUE BOOK-ENTRY ONLY NO RATING In the opinion of Stradling Yocca Carlson & Rauth, a Professional Corporation, Newport Beach, California, Bond Counsel, subject to certain qualifications described in
$6,675,000 FOLSOM RANCH FINANCING AUTHORITY SPECIAL TAX REVENUE BONDS SERIES 2015A
 NEW ISSUE-BOOK-ENTRY ONLY NOT RATED In the opinion of Orrick, Herrington & Sutcliffe LLP, Bond Counsel to the Authority, based upon an analysis of existing laws, regulations, rulings and court decisions,
$4,830,000 CITY OF LINCOLN COMMUNITY FACILITIES DISTRICT NO (LAKESIDE) IMPROVEMENT AREA NO. 1 SPECIAL TAX BONDS, SERIES 2013
 IMPROVEMENT AREA NO. 1 SPECIAL TAX BONDS, SERIES 2013") NEW ISSUE BOOK-ENTRY ONLY NOT RATED In the opinion of Orrick, Herrington & Sutcliffe llp, Bond Counsel to the City, based upon an analysis of existing laws, regulations, rulings and court decisions and
NEW ISSUE BOOK-ENTRY ONLY NOT RATED In the opinion of Orrick, Herrington & Sutcliffe llp, Bond Counsel to the City, based upon an analysis of existing laws, regulations, rulings and court decisions and
$5,870,000 COMMUNITY FACILITIES DISTRICT NO OF THE LAKE ELSINORE UNIFIED SCHOOL DISTRICT SERIES 2013 SPECIAL TAX BONDS
 NEW ISSUE NOT RATED In the opinion of Bowie, Arneson, Wiles & Giannone, Newport Beach, California, Bond Counsel, subject, however, to certain qualifications described herein, under existing laws, regulations,
PRIVATE PLACEMENT MEMORANDUM
 PRIVATE PLACEMENT MEMORANDUM NEW ISSUE: Book-Entry Only In the opinion of Hodgson Russ LLP, Bond Counsel, based on existing statutes, regulations, rulings and court decisions: (1) interest on the Bonds
SECOND AMENDED RATE AND METHOD OF APPORTIONMENT OF SPECIAL TAXES FOR TUSTIN UNIFIED SCHOOL DISTRICT COMMUNITY FACILITIES DISTRICT NO
 SECOND AMENDED RATE AND METHOD OF APPORTIONMENT OF SPECIAL TAXES FOR TUSTIN UNIFIED SCHOOL DISTRICT COMMUNITY FACILITIES DISTRICT NO. 07-1 (ORCHARD HILLS) A Special Tax shall be levied and collected within
$25,220,000 Limited Obligation Bonds (City of Kannapolis, North Carolina), Series 2014
, Series 2014") NEW ISSUE BOOK-ENTRY ONLY Rating: Moody s: Aa3 S&P: A+ (See RATINGS herein) In the opinion of Parker Poe Adams & Bernstein LLP, Bond Counsel, under existing law, the portion of the Installment Payments
NEW ISSUE BOOK-ENTRY ONLY Rating: Moody s: Aa3 S&P: A+ (See RATINGS herein) In the opinion of Parker Poe Adams & Bernstein LLP, Bond Counsel, under existing law, the portion of the Installment Payments
ESCROW AGREEMENT. Relating to the advance crossover refunding of the outstanding
 ESCROW AGREEMENT Relating to the advance crossover refunding of the outstanding $11,998,678.35 aggregate denominational amount Piedmont Unified School District (Alameda County, California) General Obligation
CITY OF OCEAN SHORES, WASHINGTON ORDINANCE NO. 939
 CITY OF OCEAN SHORES, WASHINGTON ORDINANCE NO. 939 AN ORDINANCE OF THE CITY COUNCIL OF THE CITY OF OCEAN SHORES, WASHINGTON, PROVIDING FOR THE ISSUANCE OF LIMITED TAX GENERAL OBLIGATION REFUNDING BONDS
$13,060,000 CLARK COUNTY, NEVADA Special Improvement District No. 151 (Summerlin-Mesa) Local Improvement Refunding Bonds, Series 2015
 Local Improvement Refunding Bonds, Series 2015") NEW ISSUE (Book-Entry Only) NO RATING In the opinion of Sherman & Howard L.L.C., Las Vegas, Nevada, Bond Counsel, assuming continuous compliance with certain covenants described herein, interest on the
NEW ISSUE (Book-Entry Only) NO RATING In the opinion of Sherman & Howard L.L.C., Las Vegas, Nevada, Bond Counsel, assuming continuous compliance with certain covenants described herein, interest on the
INSTALLMENT PURCHASE AGREEMENT
 INSTALLMENT PURCHASE AGREEMENT by and between COUNTY SANITATION DISTRICT NO. 14 OF LOS ANGELES COUNTY and LOS ANGELES COUNTY SANITATION DISTRICTS FINANCING AUTHORITY Dated as of 1, 2015 TABLE OF CONTENTS
$20,030,000 CITY OF SACRAMENTO NATOMAS CENTRAL COMMUNITY FACILITIES DISTRICT NO SPECIAL TAX BONDS, SERIES 2016
 ISSUE BOOK-ENTRY-ONLY NO RATING In the opinion of Orrick, Herrington & Sutcliffe LLP, Bond Counsel to the City, based upon an analysis of existing laws, regulations, rulings and court decisions, and assuming,
$815,000 COUNTY OF SANTA CRUZ LIMITED OBLIGATION IMPROVEMENT BONDS ASSESSMENT DISTRICT NO (ORCHARD DRIVE SEWER EXTENSION PROJECT)
") NEW ISSUE BOOK-ENTRY NOT RATED (See CONCLUDING INFORMATION - No Rating on the Bonds; Secondary Market herein) In the opinion of Jones Hall, A Professional Law Corporation, San Francisco, California, Bond
NEW ISSUE BOOK-ENTRY NOT RATED (See CONCLUDING INFORMATION - No Rating on the Bonds; Secondary Market herein) In the opinion of Jones Hall, A Professional Law Corporation, San Francisco, California, Bond
VILLAGE OF HORSEHEADS CHEMUNG COUNTY, NEW YORK
 NOTICE OF SALE CHEMUNG COUNTY, NEW YORK $584,000 Bond Anticipation Notes, 2017 (Renewals) Notice is given that the Village of Horseheads, Chemung County, New York (the Village ) will receive electronic
Community Facilities District Report. Jurupa Unified School District Community Facilities District No. 13. September 14, 2015
 Community Facilities District Report Jurupa Unified School District Community Facilities District No. 13 September 14, 2015 Prepared For: Jurupa Unified School District 4850 Pedley Road Jurupa Valley,
George K. Baum & Company
 NEW ISSUE BANK QUALIFIED OFFERING CIRCULAR Unrated In the opinion of Bryan Cave LLP, Special Tax Counsel, under existing law and assuming continued compliance with certain requirements of the Internal
ORDINANCE NUMBER 1154
 ORDINANCE NUMBER 1154 AN ORDINANCE OF THE CITY COUNCIL OF THE CITY OF PERRIS ACTING AS THE LEGISLATIVE BODY OF COMMUNITY FACILITIES DISTRICT NO. 2005-1 (PERRIS VALLEY VISTAS) OF THE CITY OF PERRIS AUTHORIZING
2005 SPECIAL TAX BONDS 2005 SPECIAL TAX BONDS
 NEW ISSUE NOT RATED In the opinion of Best Best & Krieger LLP, San Diego, California, Bond Counsel, subject, however to certain qualiñcations described herein, under existing law, the interest on the 2005
FEDERAL NATIONAL MORTGAGE ASSOCIATION ( FANNIE MAE ) Issuer and Trustee TRUST AGREEMENT. Dated as of January 1, for
 Issuer and Trustee TRUST AGREEMENT. Dated as of January 1, for") FEDERAL NATIONAL MORTGAGE ASSOCIATION ( FANNIE MAE ) Issuer and Trustee TRUST AGREEMENT Dated as of January 1, 1999 for GUARANTEED REMIC PASS-THROUGH CERTIFICATES FANNIE MAE REMIC TRUST 1999-1 evidencing
FEDERAL NATIONAL MORTGAGE ASSOCIATION ( FANNIE MAE ) Issuer and Trustee TRUST AGREEMENT Dated as of January 1, 1999 for GUARANTEED REMIC PASS-THROUGH CERTIFICATES FANNIE MAE REMIC TRUST 1999-1 evidencing
CALIFORNIA MUNICIPAL FINANCE AUTHORITY
 CALIFORNIA MUNICIPAL FINANCE AUTHORITY POLICIES AND PROCEDURES FOR COMMUNITY FACILITIES DISTRICTS I. GENERAL. The purpose of these Policies and Procedures (the Policies ) is to provide guidance and conditions
NEW ISSUE - BOOK-ENTRY-ONLY NOT RATED LIMITED OFFERING
 NEW ISSUE - BOOK-ENTRY-ONLY NOT RATED LIMITED OFFERING In the opinion of Bond Counsel, assuming continuing compliance with certain tax covenants, interest on the Series 2004A Bonds is excluded from gross
Administration Report Fiscal Year 2016/2017. Hesperia Unified School District Community Facilities District No June 20, 2016.
 Administration Report Fiscal Year 2016/2017 Hesperia Unified School District Community Facilities District No. 2006-2 June 20, 2016 Prepared For: Hesperia Unified School District 15576 Main Street Hesperia,
ESCROW DEPOSIT AGREEMENT
 ESCROW DEPOSIT AGREEMENT THIS ESCROW DEPOSIT AGREEMENT is entered into as of February 19, 2014, between the North Ogden City, Utah (the Issuer ), and Wells Fargo Bank, N.A., as Escrow Agent (the Escrow
Harris Ranch Community Infrastructure District No. 1. Feasibility Report Special Assessment Bonds (Assessment Area One)
") Harris Ranch Community Infrastructure District No. 1 Feasibility Report Special Assessment Bonds (Assessment Area One) September 21, 2010 Submitted By: Mr. Doug Fowler Lenir, Ltd. 4940 East Mill Station
Harris Ranch Community Infrastructure District No. 1 Feasibility Report Special Assessment Bonds (Assessment Area One) September 21, 2010 Submitted By: Mr. Doug Fowler Lenir, Ltd. 4940 East Mill Station
ESCROW AGREEMENT (2008 CERTIFICATES)
") ESCROW AGREEMENT (2008 CERTIFICATES) Stradling Yocca Carlson & Rauth Draft of 9/1/16 THIS ESCROW AGREEMENT (2008 CERTIFICATES), dated as of 1, 2016 (the Agreement ), by and between the Yorba Linda Water
ESCROW AGREEMENT (2008 CERTIFICATES) Stradling Yocca Carlson & Rauth Draft of 9/1/16 THIS ESCROW AGREEMENT (2008 CERTIFICATES), dated as of 1, 2016 (the Agreement ), by and between the Yorba Linda Water
ESCROW AGREEMENT. Dated, Relating to
 CITY OF ANAHEIM, CALIFORNIA and U.S. BANK NATIONAL ASSOCIATION, Escrow Agent ESCROW AGREEMENT Dated, 2014 Relating to Certificates of Participation (1993 Land Acquisition Refinancing Project) Evidencing
CITY OF CALABASAS COMMUNITY FACILITIES DISTRICT NO SPECIAL TAX REFUNDING BONDS SERIES 2006 REFUNDING ESCROW AGREEMENT
 OH&S 8/28/17 Draft CITY OF CALABASAS COMMUNITY FACILITIES DISTRICT NO. 2001-1 SPECIAL TAX REFUNDING BONDS SERIES 2006 REFUNDING ESCROW AGREEMENT This REFUNDING ESCROW AGREEMENT (the Agreement ), made and
THE EVERGREEN STATE COLLEGE RESOLUTION NO
 THE EVERGREEN STATE COLLEGE RESOLUTION NO. 2006-01 A RESOLUTION OF THE BOARD OF TRUSTEES OF THE EVERGREEN STATE COLLEGE AUTHORIZING THE ISSUANCE AND SALE OF HOUSING SYSTEM REVENUE AND REFUNDING BONDS,
STANDARD & POOR S RATING: AA-
 THIS COVER PAGE CONTAINS CERTAIN INFORMATION FOR QUICK REFERENCE ONLY. IT IS NOT A SUMMARY OF THIS ISSUE. INVESTORS MUST READ THE ENTIRE OFFICIAL STATEMENT TO OBTAIN INFORMATION ESSENTIAL TO THE MAKING
ESCROW AGREEMENT (2003 CERTIFICATES) By and Between CITY OF FOUNTAIN VALLEY. and. MUFG UNION BANK, N.A., as Escrow Bank. Dated as of February 1, 2016
 By and Between CITY OF FOUNTAIN VALLEY. and. MUFG UNION BANK, N.A., as Escrow Bank. Dated as of February 1, 2016") Stradling Yocca Carlson & Rauth Draft of 12/29/15 ESCROW AGREEMENT (2003 CERTIFICATES) By and Between CITY OF FOUNTAIN VALLEY and MUFG UNION BANK, N.A., as Escrow Bank Dated as of February 1, 2016 Relating
Stradling Yocca Carlson & Rauth Draft of 12/29/15 ESCROW AGREEMENT (2003 CERTIFICATES) By and Between CITY OF FOUNTAIN VALLEY and MUFG UNION BANK, N.A., as Escrow Bank Dated as of February 1, 2016 Relating
ACQUISITION AGREEMENT
 Quint & Thimmig LLP ACQUISITION AGREEMENT by and between the CITY OF ALAMEDA, CALIFORNIA and CATELLUS ALAMEDA DEVELOPMENT, LLC dated as of 1, 2013 relating to: City of Alameda Community Facilities District
The Certificates are subject to optional, mandatory and extraordinary optional prepayment prior to their stated payment dates as described herein.
 NEW ISSUE BOOK-ENTRY ONLY NO RATING In the opinion of Gilmore & Bell, P.C., St. Louis, Missouri, Special Tax Counsel, under existing law and assuming continued compliance with certain requirements of the
SEE THE INSIDE COVER FOR CERTAIN ADDITIONAL INFORMATION RELATING TO THE SERIES 2002B LEASE AND THE SERIES 2002B CERTIFICATES.
 NEW ISSUE - BOOK ENTRY ONLY $115,350,000 CERTIFICATES OF PARTICIPATION, SERIES 2002B Evidencing Undivided Proportionate Interests of the Owners Thereof in Basic Lease Payments to be Made by THE SCHOOL
FANNIE MAE. Issuer and Trustee TRUST AGREEMENT. Dated as of August 1, for GUARANTEED REMIC PASS-THROUGH CERTIFICATES
 EXECUTION COPY FANNIE MAE Issuer and Trustee TRUST AGREEMENT Dated as of August 1, 2002 for GUARANTEED REMIC PASS-THROUGH CERTIFICATES FANNIE MAE REMIC TRUST 2002-W9 evidencing beneficial interests in
RESOLUTION NUMBER 3992
 RESOLUTION NUMBER 3992 A RESOLUTION OF THE CITY COUNCIL OF THE CITY OF PERRIS AUTHORIZING THE CHANGES TO THE SPECIAL TAXES WITHIN COMMUNITY FACILITIES DISTRICT NO. 2006-3 (ALDER) OF THE CITY OF PERRIS;
POWAY UNIFIED SCHOOL DISTRICT ADMINISTRATION REPORT FISCAL YEAR 2017/2018 IMPROVEMENT AREA NO. 1 OF COMMUNITY FACILITIES DISTRICT NO.
 POWAY UNIFIED SCHOOL DISTRICT ADMINISTRATION REPORT FISCAL YEAR 2017/2018 IMPROVEMENT AREA NO. 1 OF COMMUNITY FACILITIES DISTRICT NO. 2 JUNE 29, 2017 PREPARED FOR: Poway Unified School District Planning
TOWN OF NEW HARTFORD ONEIDA COUNTY, NEW YORK $325,000 Bond Anticipation Notes, 2018 (Renewals)
") NOTICE OF SALE ONEIDA COUNTY, NEW YORK $325,000 Bond Anticipation Notes, 2018 (Renewals) Notice is given that the Town of New Hartford, Oneida County, New York will receive electronic and facsimile bids,
NOTICE OF SALE ONEIDA COUNTY, NEW YORK $325,000 Bond Anticipation Notes, 2018 (Renewals) Notice is given that the Town of New Hartford, Oneida County, New York will receive electronic and facsimile bids,
NC General Statutes - Chapter 116 Article 21B 1
 Article 21B. The Centennial Campus, the Horace Williams Campus, and the Millenial Campuses Financing Act. 116-198.31. Purpose of Article. The purpose of this Article is to authorize the Board of Governors
ESCROW INSTRUCTIONS RECITALS
 HDW 6/8/15 Draft ESCROW INSTRUCTIONS These Escrow Instructions, dated as of July 1, 2015 (the Escrow Instructions ), are directed to WELLS FARGO BANK, NATIONAL ASSOCIATION, as escrow agent (the Escrow
RESOLUTION NUMBER 3970
 RESOLUTION NUMBER 3970 A RESOLUTION OF THE CITY COUNCIL OF THE CITY OF PERRIS, COUNTY OF RIVERSIDE, STATE OF CALIFORNIA, AUTHORIZING THE CHANGES TO THE FACILITIES AND SPECIAL TAXES WITHIN IMPROVEMENT AREA
ESCROW AGREEMENT RELATING TO THE DEFEASANCE OF A PORTION OF
 ESCROW AGREEMENT RELATING TO THE DEFEASANCE OF A PORTION OF $55,771,886.25 DESERT COMMUNITY COLLEGE DISTRICT (Riverside and Imperial Counties, California) 2005 General Obligation Refunding Bonds THIS ESCROW
The date of this Official Statement is June 18, 2013.
 NEW ISSUE BANK QUALIFIED BOOK ENTRY ONLY RATINGS: Standard & Poor s: AA In the opinion of Gilmore & Bell, P.C., Special Tax Counsel, under existing law and assuming continued compliance with certain requirements
Table of Contents. Sections. Tables. Appendices
 - Table of Contents Sections Section 1. Bond Profile 1 Section 2. Fund Information 2 Section 3. Special Tax Information 3 Section 4. Owner and Development Status Information 4 Section 5. Payment History
ESCROW AGREEMENT. between the COUNTY OF SAN JOAQUIN. and. U.S. BANK NATIONAL ASSOCIATION, as Escrow Agent. Dated as of December 1, 2017
 OHS DRAFT 11/10/2017 ESCROW AGREEMENT between the COUNTY OF SAN JOAQUIN and U.S. BANK NATIONAL ASSOCIATION, as Escrow Agent Dated as of December 1, 2017 Relating to the SAN JOAQUIN COUNTY PUBLIC FACILITIES
REEDY CREEK IMPROVEMENT DISTRICT (FLORIDA) (Located in Orange and Osceola Counties)
 (Located in Orange and Osceola Counties)") NEW ISSUE BOOK ENTRY ONLY RATINGS: Moody s: Aa3 Fitch: AA- S&P: A+ See RATINGS herein In the opinion of Greenberg Traurig, P.A., Bond Counsel, assuming continuing compliance with certain tax covenants,
NEW ISSUE BOOK ENTRY ONLY RATINGS: Moody s: Aa3 Fitch: AA- S&P: A+ See RATINGS herein In the opinion of Greenberg Traurig, P.A., Bond Counsel, assuming continuing compliance with certain tax covenants,
POWAY UNIFIED SCHOOL DISTRICT
 POWAY UNIFIED SCHOOL DISTRICT CONTINUING DISCLOSURE ANNUAL REPORT FISCAL YEAR ENDING JUNE 30, 2016 IMPROVEMENT AREA C OF COMMUNITY FACILITIES DISTRICT NO. 6 SPECIAL TAX REFUNDING BONDS, SERIES 2016 BASE
UBS FINANCIAL SERVICES INC.
 NEW ISSUE - BOOK-ENTRY ONLY RATINGS: See RATINGS herein In the opinion of Co-Special Tax Counsel, assuming continuing compliance with certain tax covenants and the accuracy of certain representations of
CITY OF EL CENTRO. Community Facilities District No (Legacy Ranch) $1,220,000 Special Tax Bonds, Series 2008
 $1,220,000 Special Tax Bonds, Series 2008") CITY OF EL CENTRO Community Facilities District No. 2007-1 (Legacy Ranch) $1,220,000 Special Tax Bonds, Series 2008 IMPERIAL COUNTY, CALIFORNIA DATED: October 8, 2008 CUSIP + : 282826 2014/2015 ANNUAL
CITY OF EL CENTRO Community Facilities District No. 2007-1 (Legacy Ranch) $1,220,000 Special Tax Bonds, Series 2008 IMPERIAL COUNTY, CALIFORNIA DATED: October 8, 2008 CUSIP + : 282826 2014/2015 ANNUAL
RESOLUTION NUMBER 3968
 RESOLUTION NUMBER 3968 A RESOLUTION OF THE CITY COUNCIL OF THE CITY OF PERRIS, COUNTY OF RIVERSIDE, STATE OF CALIFORNIA, AS THE LEGISLATIVE BODY OF COMMUNITY FACILITIES DISTRICT NO. 2001-1 (MAY FARMS)
RATE AND METHOD OF APPORTIONMENT FOR CASITAS MUNICIPAL WATER DISTRICT COMMUNITY FACILITIES DISTRICT NO (OJAI)
") RATE AND METHOD OF APPORTIONMENT FOR CASITAS MUNICIPAL WATER DISTRICT COMMUNITY FACILITIES DISTRICT NO. 2013-1 (OJAI) A Special Tax shall be levied on all Assessor s Parcels of Taxable Property in Casitas
RATE AND METHOD OF APPORTIONMENT FOR CASITAS MUNICIPAL WATER DISTRICT COMMUNITY FACILITIES DISTRICT NO. 2013-1 (OJAI) A Special Tax shall be levied on all Assessor s Parcels of Taxable Property in Casitas
ESCROW DEPOSIT AGREEMENT WIT N E SSE T H:
 ESCROW DEPOSIT AGREEMENT This ESCROW DEPOSIT AGREEMENT, dated as of March 1, 2015, by and between the LOUISIANA LOCAL GOVERNMENT ENVIRONMENTAL FACILITIES AND COMMUNITY DEVELOPMENT AUTHORITY, a political
BE IT RESOLVED BY THE SCHOOL BOARD OF BREVARD COUNTY, FLORIDA:
 A RESOLUTION AUTHORIZING THE ISSUANCE ON BEHALF OF THE SCHOOL BOARD OF BREVARD COUNTY, FLORIDA, OF NOT EXCEEDING $61,000,000 REFUNDING CERTIFICATES OF PARTICIPATION, SERIES 2017A, FOR THE PURPOSE OF LEASE-
NEW ISSUE BOOK-ENTRY-ONLY
 NEW ISSUE BOOK-ENTRY-ONLY NO RATING In the opinion of Stradling Yocca Carlson & Rauth, a Professional Corporation, Newport Beach, California, Bond Counsel, subject to certain qualifications described in
REPORT OF SPECIAL TAX LEVY FOR THE CITY OF LAKE ELSINORE. CITY OF LAKE ELSINORE CFD (Rosetta Canyon Public Improvements) Fiscal Year
 Fiscal Year") REPORT OF SPECIAL TAX LEVY FOR THE CITY OF LAKE ELSINORE CITY OF LAKE ELSINORE CFD 2004-3 (Rosetta Canyon Public Improvements) Fiscal Year 2006-07 Submitted to: City of Lake Elsinore Riverside County,
REPORT OF SPECIAL TAX LEVY FOR THE CITY OF LAKE ELSINORE CITY OF LAKE ELSINORE CFD 2004-3 (Rosetta Canyon Public Improvements) Fiscal Year 2006-07 Submitted to: City of Lake Elsinore Riverside County,
Exhibit E Meyers Nave Draft 2/12/14 ESCROW AGREEMENT. by and between the SUCCESSOR AGENCY TO THE REDEVELOPMENT AGENCY OF THE CITY OF PITTSBURG.
 Exhibit E Meyers Nave Draft 2/12/14 ESCROW AGREEMENT by and between the SUCCESSOR AGENCY TO THE REDEVELOPMENT AGENCY OF THE CITY OF PITTSBURG and THE BANK OF NEW YORK MELLON TRUST COMPANY, N.A. as Escrow
COMMERCIAL PROPERTY ASSESSED CLEAN ENERGY ( C-PACE ) AGREEMENT
 AGREEMENT") COMMERCIAL PROPERTY ASSESSED CLEAN ENERGY ( C-PACE ) AGREEMENT THIS AGREEMENT is made and entered into as of the day of, 2015, by and between [TOWN NAME], CONNECTICUT, a municipal corporation organized
COMMERCIAL PROPERTY ASSESSED CLEAN ENERGY ( C-PACE ) AGREEMENT THIS AGREEMENT is made and entered into as of the day of, 2015, by and between [TOWN NAME], CONNECTICUT, a municipal corporation organized
AMENDED AND RESTATED MEMORANDUM OF UNDERSTANDING
 AMENDED AND RESTATED MEMORANDUM OF UNDERSTANDING THIS AMENDED AND RESTATED MEMORANDUM OF UNDERSTANDING (this Memorandum ) is made as of this day of, 2011, by and between the COUNTY OF FAIRFAX, VIRGINIA
Agenda Page #2 Urban Orlando Community Development District Inframark, Infrastructure Management Services 210 North University Drive Suite 702, Coral
 Agenda Page #1 URBAN ORLANDO COMMUNITY DEVELOPMENT DISTRICT SEPTEMBER 19, 2018 AGENDA PACKAGE Agenda Page #2 Urban Orlando Community Development District Inframark, Infrastructure Management Services 210
RESOLUTION NO
 MIA 184152500v2 RESOLUTION NO. 15-028 A RESOLUTION OF THE SCHOOL BOARD OF OSCEOLA COUNTY, FLORIDA, AUTHORIZING EXECUTION OF AMENDED AND RESTATED SCHEDULE 1995A AND AMENDED AND RESTATED SCHEDULE 2004A TO
FEDERAL NATIONAL MORTGAGE ASSOCIATION ( FANNIE MAE ) Issuer and Trustee TRUST AGREEMENT. Dated as of July 1, for
 Issuer and Trustee TRUST AGREEMENT. Dated as of July 1, for") EXECUTION COPY FEDERAL NATIONAL MORTGAGE ASSOCIATION ( FANNIE MAE ) Issuer and Trustee TRUST AGREEMENT Dated as of July 1, 2005 for GUARANTEED REMIC PASS-THROUGH CERTIFICATES FANNIE MAE REMIC TRUST 2005-71
EXECUTION COPY FEDERAL NATIONAL MORTGAGE ASSOCIATION ( FANNIE MAE ) Issuer and Trustee TRUST AGREEMENT Dated as of July 1, 2005 for GUARANTEED REMIC PASS-THROUGH CERTIFICATES FANNIE MAE REMIC TRUST 2005-71
COMMERCIAL PROPERTY ASSESSED CLEAN ENERGY ( C-PACE ) AGREEMENT
 AGREEMENT") COMMERCIAL PROPERTY ASSESSED CLEAN ENERGY ( C-PACE ) AGREEMENT THIS AGREEMENT is made and entered into as of the day of, 2013, by and between [INSERT TOWN NAME], CONNECTICUT, a municipal corporation organized
COMMERCIAL PROPERTY ASSESSED CLEAN ENERGY ( C-PACE ) AGREEMENT THIS AGREEMENT is made and entered into as of the day of, 2013, by and between [INSERT TOWN NAME], CONNECTICUT, a municipal corporation organized
RESOLUTION NUMBER 4779
 RESOLUTION NUMBER 4779 RESOLUTION OF INTENTION OF THE CITY COUNCIL OF THE CITY OF PERRIS TO ESTABLISH COMMUNITY FACILITIES DISTRICT NO. 2014-1 (AVELINA) OF THE CITY OF PERRIS AND TO AUTHORIZE THE LEVY
ESCROW DEPOSIT AND TRUST AGREEMENT
 11030-23 JH:SRF:KD:brf AGENDA DRAFT 8/29/2016 ESCROW DEPOSIT AND TRUST AGREEMENT This ESCROW DEPOSIT AND TRUST AGREEMENT, dated as of October 1, 2016 (the Agreement ), is by and between the CITY OF ALBANY,
ESCROW AGREEMENT. Defeasance of 2018 and 2019 Maturities of 2005 Bonds. between SCHOOL DISTRICT NO. 414 (KIMBERLY), TWIN FALLS COUNTY, IDAHO.
, TWIN FALLS COUNTY, IDAHO.") ESCROW AGREEMENT Defeasance of 2018 and 2019 Maturities of 2005 Bonds between SCHOOL DISTRICT NO. 414 (KIMBERLY), TWIN FALLS COUNTY, IDAHO and U.S. BANK NATIONAL ASSOCIATION, as Escrow Agent Dated effective
ESCROW AGREEMENT Defeasance of 2018 and 2019 Maturities of 2005 Bonds between SCHOOL DISTRICT NO. 414 (KIMBERLY), TWIN FALLS COUNTY, IDAHO and U.S. BANK NATIONAL ASSOCIATION, as Escrow Agent Dated effective
DEVELOPMENT AGREEMENT
 DEVELOPMENT AGREEMENT This Agreement is entered into between the City of University Heights, Iowa (the City ) and Jeffrey L. Maxwell, (the Developer ) as of the day of, 2015 (the Commencement Date ). WHEREAS,
SPECIAL TAX AND BOND ACCOUNTABILITY REPORT
 SPECIAL TAX AND BOND ACCOUNTABILITY REPORT FOR IMPROVEMENT AREA A OF COMMUNITY FACILITIES DISTRICT NO. 10 OF THE POWAY UNIFIED SCHOOL DISTRICT November 14, 2003 SPECIAL TAX AND BOND ACCOUNTABILITY REPORT
ESCROW DEPOSIT AND TRUST AGREEMENT
 26085-06 JH:WJK:JAW 10/06/14 ESCROW DEPOSIT AND TRUST AGREEMENT by and between the SELMA UNIFIED SCHOOL DISTRICT and THE BANK OF NEW YORK MELLON TRUST COMPANY N.A., as Escrow Bank Dated, 2014 Relating