Signature Bank 7292 w devon chicago
|
|
|
- Hester Hopkins
- 5 years ago
- Views:
Transcription


1 Offering Memorandum Signature Bank 7292 w devon chicago 10-Year Net Bank Lease Sales Price $2,899,000 Avg Cap Rate of 6.52% John Roberson Dino Geroulis john.roberson@ axis-realty.com dino@axis-realty.com

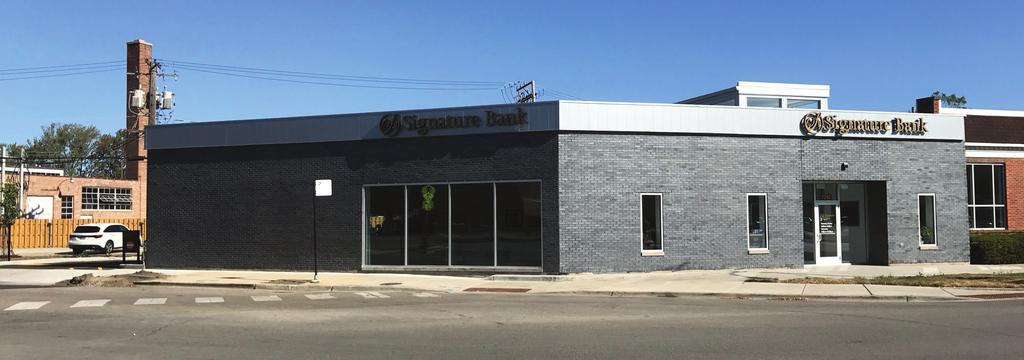
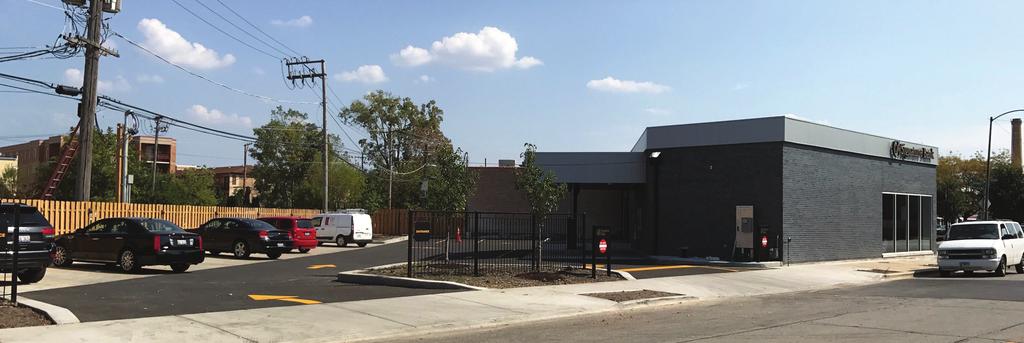
2 Site Photos
3 Lease Abstract & Deal Summary Deal Summary 1 Sale Price $2,899,000 2 Avg Cap Rate 6.52% 3 Building Size Approximately 4,000 sq.ft 4 Site Size Approximately 12,500 sq.ft Lease Abstract 1. Initial Lease Term 10 Years 2. Lease Commencement Ocotber 1, Size 4,000 sf building on an approximately 12,500 sf. site 4. Options Two 5-year options with 120 days notice 5. Minimum Rent Primary Term Years 1-5: $15,000 per month (Annual total: $180,000) Years 6-10:,500 per month (Annual total: $198,000) 6. Minimum Rent 1st Option Term Years 11-15: $18,150 per month (Annual total: $217,800) 7. Minimum Rent 2nd Option Term Years 16-20: $19,965 per month (Annual total: $239,580) 8. Real Estate Taxes Tenant pays 100% of taxes and protest costs via monthly estimates to Landlord Tenant may elect to self-perform and direct pay CAM/Tax expenses 9. Operating & Insurance Expenses Tenant pays 100% of expenses via monthly estimates to Landlord Tenant may elect to self-perform and direct pay CAM/Tax expenses 10. Landlord Responsiblities Landlord may maintain, subject to Tenant CAM reimbursements with 15% administration fee Tenant may elect to self-perform and direct pay CAM/Tax expenses Landlord maintains only capital structure, roof, ext wall at Landlord s expense NOTE: Tenant has elected to selfperform CAM/Tax 11. Lease Transfer Only to related entity or entity of equal financial strength, otherwise Landlord s written consent needed. 12. Holdover Minimum Rent 150% 13. Subordination Lease will subordinate to mortgage with executed SNDA 14. Estoppel Certificate Tenant to provide within 10 business days Axis Realty, Inc. makes no warranty or representation, express or implied, is made to the accuracy or completeness of the information contained herein, and same is submitted subject to errors, omissions, change of price, rental or other conditions, withdrawal without notice, and to any special listing conditions imposed by the property owner(s). As applicable, we make no representation as to the condition of the property (or properties) in question.
4 Site Plan +/-20,000 VPD on Devon Demographics 2017 Demographics 1 Mile 3 Mile 5 Mile Population: 26, , ,277 Median Household Income: $82,574 $73,237 $65,468 Median Home Value: $346,928 $311,908 $282,149
5 Market Chicago s Vacancy at 6.8% Net Absorption Positive 970,247 SF in the Quarter The Chicago retail market experienced a slight improvement in market conditions in the second quarter The vacancy rate went from 7% in the previous quarter to 6.8% in the current quarter. Net absorption was positive 970,247 square feet, and vacant sublease space increased by 35,445 square feet. Quoted rental rates increased from first quarter 2017 levels, ending at $15.78 per square foot per year. A total of 39 retail buildings with 643,025 square feet of retail space were delivered to the market in the quarter, with 2,303,946 square feet still under construction at the end of the quarter. Net Absorption Retail net absorption was moderate in Chicago second quarter 2017, with positive 970,247 square feet absorbed in the quarter. In first quarter 2017, net absorption was positive 1,338,831 square feet, while in fourth quarter 2016, absorption came in at positive 1,152,013 square feet. In third quarter 2016, positive 1,447,294 square feet was absorbed in the market. Tenants moving out of large blocks of space in 2017 include Ultra Foods, part of the Strack & Van Til supermarket chain owned by Central Grocers, moving out of 92,424 square feet after closing a location at The Landings shopping center in Lansing. This closure is one of nine closures across Illinois and Indiana occurring in the second quarter accounting for more than (397,000) square feet in negative absorption within the Chicago market. Additional tenants moving out of large blocks of space in 2017 include: Ashley Furniture HomeStore moving out of 61,612 square feet at Marketplace at Vernon Hills and relocating to another building within the center; Gordmans moving out of 50,079 square feet after filing for bankruptcy and closing a location at the Shops on Main in Schererville, Indiana; and Whole Foods Market moving out of 40,000 square feet at Rice Lake Square in Wheaton relocating to Danada Square East. Tenants moving into large blocks of space in 2017 include: At Home moving into 100,000 square feet at 101 W Lincoln Highway in the Broadway Center in Merrillville; Fletcher Jones Audi expanding into 95,032 square feet in their newly delivered building located at 1521 W North Avenue; Whole Foods Market relocating from 3300 N Ashland Avenue and moving into 75,000 square feet in the newly delivered building located at 3201 N Ashland Avenue; and Mariano s Fresh Market opening two new locations, moving into 73,317 square feet in the newly delivered building located at 10 E Golf Road in Des Plaines and moving into 69,246 square feet at Stratford Crossing in Bloomingdale. Vacancy Chicago s retail vacancy rate decreased in the second quarter 2017, ending the quarter at 6.8%. Over the past four quarters, the market has seen an overall decrease in the vacancy rate, with the rate going from 7.2% in the third quarter 2016, to 7.1% at the end of the fourth quarter 2016, 7% at the end of the first quarter 2017, to 6.8% in the current quarter. The amount of vacant sublease space in the Chicago market has trended up over the past four quarters. At the end of the third quarter 2016, there were 1,582,127 square feet of vacant sublease space. Currently, there are 1,720,988 square feet vacant in the market. Vacancy Rates by Building Type % Power Center Specialty Center General Retail Shopping Center Mall Total Market 14% 12% 10% 8% 6% 4% 2% 0% q q q q q q q q q q q q Source: CoStar Property
6 Market Largest Lease Signings The largest lease signings occurring in 2017 included: the 98,500-square-foot-lease signed by HOBO-Home Owners Bargain Outlet at 7600 Roosevelt Road in the Forest Park Plaza; the sale leaseback sighed for 89,188 square feet by Cermak Produce at 1250 N Lake Street in Aurora; the 50,000- square-foot-lease signed by Cinemas Entertainment at 3330 W Roosevelt Road in the Douglas Park Plaza; and the 50,000 square-foot-renewal signed by Ashley Furniture HomeStore at 2451 S Randall Road in Algonquin. Rental Rates Average quoted asking rental rates in the Chicago retail market are up over previous quarter levels, and up from their levels four quarters ago. Quoted rents ended the second quarter 2017 at $15.78 per square foot per year. That compares to $15.66 per square foot in the first quarter 2017, and $15.70 per square foot at the end of the third quarter This represents a 0.8% increase in rental rates in the current quarter, and a 0.51% increase from four quarters ago. Inventory & Construction During the second quarter 2017, 39 buildings totaling 643,025 square feet were completed in the Chicago retail market. Over the past four quarters, a total of 3,208,899 square feet of retail space has been built in Chicago. In addition to the current quarter, 44 buildings with 735,500 square feet were completed in first quarter 2017, 71 buildings totaling 855,405 square feet completed in fourth quarter 2016, and 974,969 square feet in 43 buildings completed in third quarter There were 2,303,946 square feet of retail space under construction at the end of the second quarter Some of the notable 2017 deliveries include: Kildeer Village Square, an approximately 200,000-square-foot shopping center located at Rand Road that delivered in second quarter 2017, and Fletcher Jones Audi, a 95,032-square-foot building Vacancy & Rent Past 8 Quarters Price in Dollars per Unit $15 Average Rental Rate Vacancy Rate q q q q 8.0% 7.8% 7.6% 7.4% 7.2% 7.0% 6.8% 6.6% 6.4% 6.2% Vacancy Rate Percentage that delivered in first quarter 2017 and is owner occupied, and the ARC (Athletic Recreations Center) building, an 80,000- square-foot facility that delivered in first quarter 2017 located at 8201 Janes Avenue in Woodridge. Total retail inventory in the Chicago market area amounted to 540,905,634 square feet in 42,255 buildings and 4,019 centers as of the end of the second quarter Shopping Center The Shopping Center market in Chicago currently consists of 3,876 projects with 161,276,183 square feet of retail space in 5,938 buildings. In this report the Shopping Center market is comprised of all Community Centers, Neighborhood Centers, and Strip Centers. After absorbing 442,731 square feet and delivering 156,710 square feet in the current quarter, the Shopping Center sector saw the vacancy rate go from 11.2% at the end of the first quarter 2017 to 11% this quarter. Over the past four quarters, the Shopping Center vacancy rate has gone from 11.6% at the end of the third quarter 2016, to 11.4% at the end of the fourth quarter 2016, to 11.2% at the end of the first quarter 2017, and finally to 11% at the end of the current quarter. Rental rates ended the second quarter 2017 at $14.54 per square foot, up from the $14.33 they were at the end of first quarter Rental rates have trended up over the past year, going from $14.48 per square foot a year ago to their current levels. Net absorption in the Shopping Center sector has totaled 1,537,165 square feet over the past four quarters. In addition to the positive 442,731 square feet absorbed this quarter, positive 455,979 square feet was absorbed in the first quarter 2017, positive 458,049 square feet was absorbed in the fourth quarter 2016, and positive 180,406 square feet was absorbed in the third quarter Power Centers The Power Center average vacancy rate was 7.6% in the second quarter With negative (235,652) square feet of net absorption and no new deliveries, the vacancy rate went from 7.1% at the end of last quarter to 7.6% at the end of the second quarter. In the first quarter 2017, Power Centers absorbed negative (3,462) square feet, delivered no new space, and the vacancy rate remained constant at 7.1% over the course of the quarter. Rental rates started the quarter at $15.50 per square foot and ended the quarter at $15.10 per square foot. A year ago, in second quarter 2016, the vacancy rate was 7%. Over the past four quarters, Power Centers have absorbed a cumulative (191,057) square feet of space and delivered cumulative 64,055 square feet of space. Vacant sublease space has gone from 253,660 square feet to 244,989 square Source: CoStar Property
7 Market feet over that time period, and rental rates have gone from $15.47 to $ At the end of the second quarter 2017, there were 9,600 square feet under construction in the Chicago market. The total stock of Power Center space in Chicago currently sits at 39,893,006 square feet in 88 centers comprised of 691 buildings. A total of 9,600 square feet of space was under construction at the end of the second quarter General Retail Properties The General Retail sector of the market, which includes all freestanding retail buildings, except those contained within a center, reported a vacancy rate of 4.8% at the end of second quarter There was a total of 14,332,123 square feet vacant at that time. The General Retail sector in Chicago currently has average rental rates of $17.67 per square foot per year. There are 1,779,620 square feet of space under construction in this sector, with 486,315 square feet having been completed in the second quarter. In all, there are a total of 35,330 buildings with 299,852,417 square feet of General Retail space in Chicago. Specialty Centers There are currently 13 Specialty Centers in the Chicago market, making up 3,083,320 square feet of retail space. In this report the Specialty Center market is comprised of Outlet Centers, Airport Retail and Theme/Festival Centers. Specialty Centers in the Chicago market have experienced negative (3,030) square feet of net absorption in The vacancy rate currently stands at 3.8%, with rental rates averaging $8.27 per square foot. Malls Malls recorded net absorption of positive 5,899 square feet in the second quarter This net absorption number, combined with no new space that was built in the quarter, caused the vacancy rate to remain constant at 4.1% at the end of the second quarter Rental rates went from $15.76 per square foot to $15.73 per square foot during that time. In this report the Mall market is comprised of 42 Lifestyle Centers, Regional Malls and Super Regional Malls. Sales Activity Tallying retail building sales of 15,000 square feet or larger, Chicago retail sales figures rose during the first quarter 2017 in terms of dollar volume compared to the fourth quarter of Absorption & Deliveries Past 8 Quarters Millions SF Source: CoStar Property Net Absorption In the first quarter, 60 retail transactions closed with a total volume of $726,024,111. The 60 buildings totaled 3,107,659 square feet and the average price per square foot equated to $ per square foot. That compares to 60 transactions totaling $721,845,730 in the fourth quarter The total square footage in the fourth quarter was 3,278,949 square feet for an average price per square foot of $ Total retail center sales activity in 2017 was up compared to In the first three months of 2017, the market saw 60 retail sales transactions with a total volume of $726,024,111. The price per square foot averaged $ In the same first three months of 2016, the market posted 58 transactions with a total volume of $351,207,044. The price per square foot averaged $ Cap rates have been lower in 2017, averaging 7.51% compared to the same period in 2016 when they averaged 7.92%. One of the largest transactions that has occurred within the last four quarters in the Chicago market is the sale of Blackhawk On Halsted in Chicago. This 224,204 square foot retail center sold for $130,000,000, or $ per square foot at a 5.50% cap rate. Reports compiled by: Brandi Moore and JB Sramek, CoStar Group Research Managers Deliveries q q q q
8 Chicago s Edison Park Demographics According to a 2016 analysis by the Chicago Metropolitan Agency for Planning, there were 11,208 people and 4,400 households in Edison Park. The racial makeup of the area was 87.3% White, 1.1% African American, 1.5% Asian, and 0.7% from other races. Hispanic or Latino residents of any race were 9.5% of the population. In the area, the population was spread out with 21.9% under the age of 19, 19.5% from 20 to 34, 23.7% from 35 to 49, 19.6% from 50 to 64, and 15.2% who were 65 years of age or older. The median age was 39 years. The median household income was $86,300 compared to a median income of $47,831 for Chicago at-large. The area had an Income distribution in which 8.2% of households earned less than $25,000 annually; 19.7% of households earned between $25,000 and $49,999; 14.7% of households earned between $50,000 and $74,999; 16.4% of households earned between $75,000 and $99,999; 16.6% of households earned between $100,000 and $149,999 and 24.4% of households earned more than $150,000. This is compared to a distribution of 28.8%, 22.8%, 16.1%, 10.7%, 11.3% and 10.3% for Chicago at large. Edison Park has the lowest violent crime rate of any Chicago neighborhood. Ranked as one of the best neighborhoods in Chicago, Edison Park also boasts a variety of restaurants and bars
9 Chicago s Edison Park History Neighborhood After World War I ended, Edison Park experienced its second major expansion. Blocks of bungalows joined four-squares and Dutch Colonials, filling in south of Touhy Avenue to Devon Avenue. Edison Park s four-room school (now Edison Park Field House) added mobile units, and in , Ebinger School was built to relieve the overcrowding. World War II also brought the Douglas Aircraft factory to the old Orchard Field, a relatively small airport near Higgins and Mannheim. Douglas would be building aircraft for the war and was hiring thousands of workers a week (and creating the base for the future O Hare International Airport). There was suddenly a demand for housing near the plant, which prompted construction of many blocks of housing along the Higgins corridor, in the southern ends of Edison Park and Park Ridge and the northern end of Oriole Park. By the end of the war, these areas had filled with blocks and blocks of new starter houses. Returning G.I.s were looking for places where they could start their own families Some couples lived in temporary public housing near Touhy Avenue. North of Touhy, more starter houses went up and school officials, anticipating large families of future children, built and soon expanded Stock School as a K-6th grade branch of Ebinger School. The combination of the various transit systems into the Chicago Transit Authority merged the streetcars, trolley buses, elevated trains and regular buses, and over the next 20 years a better network of public transportation finally emerged. The nearest elevated (rapid transit) line connections were at Logan Square on the Milwaukee bus or at Broadway and Berwyn, at the east end of a Foster-Northwest Highway connection. The construction of the Northwest Expressway (later Kennedy Expressway) was part of a larger network of expressway construction through the city. Although proposed for years as the Avondale Superhighway, it was rerouted away from the Avondale Avenue corridor at Bryn Mawr Avenue due to efforts of Northwest Side communities. That saved the cores of Norwood Park and Edison Park s residential neighborhoods from being chopped into shreds, because the final route went straight west instead of following the railroad (Avondale Avenue) corridor as it did further in the city. In the end, only a block s width of homes were destroyed to build the expressway, although Bryn Mawr and Higgins were both re-routed from their original intersection. A new Brook Park Field House along Harlem Avenue opened a decade later, replacing a tiny junior field house near Octavia and Estes. The Edison Park Field House, used for park activities after Ebinger School opened, has most recently focused its programming on arts programs. Public transportation opportunities expanded in 1970 with the opening of the Jefferson Park station, which became a hub for CTA and suburban buses, rapid transit and commuter trains. Thomas Edison School s neighborhood students were sent to Ebinger and Oriole Park schools. The Beard Classical School moved into the building in the early 1980s, and, now known as Edison Regional Gifted Center, is one of the top scoring schools in the state. Ebinger School has undergone several phases of renovation and recently had a campus park installed on the east end of its property. One tradition in the community since 1972 is the Edison Park Fest, an end-of-summer weekend sponsored by the Edison Park Chamber of Commerce, combining merchant sidewalk sales, entertainment, a parade, Taste of Chicago and arts and crafts. It is an opportunity to introduce visitors to the benefits which the community has to offer.

10 Tenant Overview

11 Tenant Overview
Miami-Dade County Retail Market Report 3Q Real Capital Partners Real Estate Services. *Data Source CoStar Miami-Dade County Retail Market Report
 Miami-Dade County Retail Market Report 3Q 216 Real Capital Partners Real Estate Services *Data Source CoStar Miami-Dade County Retail Market Report 3Q 216 Miami-Dade County Retail Market Report Overview
Miami-Dade County Retail Market Report 4Q Real Capital Partners Real Estate Services. *Data Source CoStar Miami-Dade County Retail Market Report
 Miami-Dade County Retail Market Report 4Q 216 Real Capital Partners Real Estate Services *Data Source CoStar 4Q 216 Miami-Dade County s Vacancy Decreases to 4.% Net Absorption Positive 1,155,8 SF in the
3 RD QUARTER 2016 RICHMOND RETAIL MARKET REPORT FORECAST 5.3% VACANCY 349,524 SF UNDER CONSTRUCTION (137,905) SF NET ABSORPTION
 SF NET ABSORPTION") 3 RD QUARTER 2016 RICHMOND RETAIL MARKET REPORT FORECAST All signs indicate a stabilized market that continues to support well-located new development. The majority of absorption in the 3rd quarter was
3 RD QUARTER 2016 RICHMOND RETAIL MARKET REPORT FORECAST All signs indicate a stabilized market that continues to support well-located new development. The majority of absorption in the 3rd quarter was
The CoStar Retail Report
 The CoStar Retail Report T H I R D Q U A R T E R 2 0 1 1 Kansas City Retail Market Kansas City Retail Market THIRD QUARTER 2011 KANSAS CITY Table of Contents Table of Contents....................................................................
3 RD QUARTER 2015 RICHMOND RETAIL MARKET REPORT FORECAST 5.7% VACANCY 509,220 SF UNDER CONSTRUCTION 370,165 SF NET ABSORPTION
 3 RD QUARTER 2015 RICHMOND RETAIL MARKET REPORT FORECAST As 2015 winds down, the vacancy rates are approaching an all time low. Retail inventory is down causing an increase in construction with national
The CoStar Retail Report
 The CoStar Retail Report Y E A R - E N D 2 0 1 1 YEAR-END 2011 KANSAS CITY Table of Contents Table of Contents.................................................................... A Methodology........................................................................
Miami-Dade County Office Market Report 4Q Real Capital Partners Real Estate Services. *Data Source CoStar Miami-Dade County Office Market Report
 Miami-Dade County Office Market Report 4Q 216 Real Capital Partners Real Estate Services *Data Source CoStar Miami-Dade County Office Market Report 4Q 216 Miami-Dade County Office Market Report Overview
CoStar Retail Statistics. Y e a r - E n d Milwaukee Retail Market
 CoStar Retail Statistics Y e a r - E n d 2 0 1 6 Year-End 2016 Milwaukee Table of Contents Table of Contents................................................................. A Methodology......................................................................
2Q 16. Long Island Market Report
 2Q 16 Long Island Market Report Long Island Office 2Q 216 Long Island 2Q16 Office Office Report The Long Island Office market ended the second quarter 216 with a vacancy rate of 7.5%. The vacancy rate
The CoStar Retail Report
 The CoStar Retail Report M I D - Y E A R 2 0 0 9 Southwest Florida Retail Market Southwest Florida Retail Market MID-YEAR 2009 SOUTHWEST FLORIDA Table of Contents Table of Contents....................................................................
3 RD QUARTER 2016 RICHMOND INDUSTRIAL MARKET REPORT
 3 RD QUARTER 2016 RICHMOND INDUSTRIAL MARKET REPORT FORECAST The Richmond Industrial market continued trending in the positive direction in the third quarter, with the absorption of over 320,000 square
Los Angeles Basin Retail Market Witnessed A Slight Increase In Vacancy Rates
 RETAIL GREATER LOS ANGELES BASIN MARKET REPORT Witnessed A Slight Increase In Vacancy Rates MARKET INDICATORS - VACANCY 6.2% NET ABSORPTION -551,200 CONSTRUCTION 1,946,000 RENTAL RATE $1.96 P NNN UNEMPLOYMENT
Chicago s industrial market thrives during the third quarter.
 CHICAGO INDUSTRIAL MARKET MONITOR THIRD QUARTER 2015 Chicago s industrial market thrives during the third quarter. Demand across the Chicago industrial market remains high sending absorption up and vacancy
1Q 17. Long Island Market Report
 1Q 17 Long Island Market Report Long Island Office 1Q 217 Long Island 1Q17 Office Office Report The Long Island Office market ended the first quarter 217 with a vacancy rate of 7.1%. The vacancy rate was
HISTORICAL VACANCY VS RENTS $1.75 2Q10 2Q11 2Q12 2Q13 2Q14
 www.colliers.com/greaterlosangeles RETAIL GREATER LOS ANGELES BASIN MARKET REPORT Vacancy Decreases and Net Absorption Increases From Previous Quarter MARKET INDICATORS - VACANCY 6. NET ABSORPTION 732,000
2Q 17. Long Island Market Report
 2Q 17 Long Island Market Report Long Island Office 2Q 217 Long Island 2Q17 Office Office Report The Long Island Office market ended the second quarter 217 with a vacancy rate of 7.2%. The vacancy rate
Los Angeles Basin Retail Market Continues To Witness Decreasing Vacancy Rates
 RETAIL GREATER LOS ANGELES BASIN MARKET REPORT Continues To Witness Decreasing Vacancy Rates MARKET INDICATORS - VACANCY 6.0% NET ABSORPTION 1,605,200 CONSTRUCTION 2,111,970 RENTAL RATE $2.03 P NNN UNEMPLOYMENT
3 RD QUARTER 2015 RICHMOND INDUSTRIAL MARKET REPORT
 3 RD QUARTER FORECAST As the U.S. economy continued to show positive economic growth through the third quarter, the Richmond, VA Industrial market saw demand for warehouse and flex properties increase
>> Greater Los Angeles Retail Continues to Witness Declining Vacancy
 Research & Forecast Report GREATER LOS ANGELES RETAIL Accelerating success. >> Greater Los Angeles Retail Continues to Witness Declining Vacancy Greater Los Angeles Retail Market The Los Angeles Basin
Chicago s industrial market thrives during the second quarter.
 Economic Overview CHICAGO INDUSTRIAL MARKET MONITOR SECOND QUARTER 2015 Chicago s industrial market thrives during the second quarter. Demand across the Chicago industrial market remains high sending absorption
The CoStar Retail Report. Y e a r - E n d San Diego Retail Market
 The CoStar Retail Report Y e a r - E n d 2 0 1 5 Year-End 2015 San Diego Table of Contents Table of Contents................................................................. A Methodology......................................................................
>> Greater Los Angeles Retail Continues to Witness Declining Vacancy
 Research & Forecast Report GREATER LOS ANGELES RETAIL Accelerating success. >> Greater Los Angeles Retail Continues to Witness Declining Vacancy Greater Los Angeles Retail Market The Los Angeles Basin
>> Greater Los Angeles Retail Starts 2016 On a Positive Note
 Research & Forecast Report GREATER LOS ANGELES RETAIL Accelerating success. >> Greater Los Angeles Retail Starts 2016 On a Positive Note Greater Los Angeles Retail Market The Los Angeles Basin retail market
>> Greater Los Angeles Retail Starts 2017 At A Slow Pace
 Research & Forecast Report GREATER LOS ANGELES RETAIL Q1 2017 Accelerating success. >> Greater Los Angeles Retail Starts 2017 At A Slow Pace Greater Los Angeles Retail Market The Los Angeles Basin retail
Los Angeles Basin Retail Market Continues To Witness Decreasing Vacancy Rates
 RETAIL GREATER LOS ANGELES BASIN MARKET REPORT Continues To Witness Decreasing Vacancy Rates MARKET INDICATORS - VACANCY 6. NET ABSORPTION 588,800 CONSTRUCTION 3,312,470 RENTAL RATE $2.04 P NNN UNEMPLOYMENT
>> Greater Los Angeles Retail Ends 2016 With Mixed Results
 Research & Forecast Report GREATER LOS ANGELES RETAIL Q4 2016 Accelerating success. >> Greater Los Angeles Retail Ends 2016 With Mixed Results Greater Los Angeles Retail Market The Los Angeles Basin retail
The CoStar Retail Report
 The CoStar Retail Report F I R S T Q U A R T E R 2 0 1 4 FIRST QUARTER 2014 COLORADO SPRINGS Table of Contents Table of Contents.................................................................... A Methodology........................................................................
The CoStar Office Report
 The CoStar Office Report Y E A R - E N D 2 0 0 8 YEAR-END 2008 PHOENIX Table of Contents Table of Contents.................................................................... A Methodology........................................................................
CoStar Office Statistics. Y e a r - E n d Portland Office Market
 CoStar Office Statistics Y e a r - E n d 2 0 1 7 Year-End 2017 Portland Table of Contents Table of Contents................................................................. A Methodology......................................................................
TRANSWESTERN OUTLOOK DC AT Q1O8
 TRANSWESTERN OUTLOOK DC AT Q1O8 Even With Soft Office Absorption, Vacancy Remains Low; Rents Continue to Edge Up The District of Columbia s office market experienced steady conditions during the 1st quarter
The CoStar Retail Report
 The CoStar Retail Report F I R S T Q U A R T E R 2 0 1 1 FIRST QUARTER 2011 BROWARD COUNTY Table of Contents Table of Contents.................................................................... A Methodology........................................................................
The CoStar Office Report
 The CoStar Office Report T H I R D Q U A R T E R 2 0 1 2 THIRD QUARTER 2012 PHOENIX Table of Contents Table of Contents.................................................................... A Methodology........................................................................
First Quarter 2017 Industrial Market Report. Chicago. Economic Overview
 Chicago Market Facts 5.3% Chicago s unemployment rate continued to trend downward. Recorded at 5.3% as of February 2017. 17 MSF The number of completed projects increased to 5.1 msf and projects currently
OFFICE MARKET ANALYSIS
 OFFICE MARKET ANALYSIS A. SYNKAI HARRISON Portland State University Nationally the office sector experienced its best performance in years according to the National Real Estate Investor as employment in
Presented By: Leo Liakatas Direct: (847)
") ASPEN THE SHOPS DENTAL at LIBERTY 2811 PLAZA N. VERMILLION 5765 NORTHWEST STREET, DANVILLE, HWY, CRYSTAL ILLINOIS, LAKE, IL 61832 60014 C O N F I D E N T I A L O F F E R I N G M E M O R A N D U M Presented
ASPEN THE SHOPS DENTAL at LIBERTY 2811 PLAZA N. VERMILLION 5765 NORTHWEST STREET, DANVILLE, HWY, CRYSTAL ILLINOIS, LAKE, IL 61832 60014 C O N F I D E N T I A L O F F E R I N G M E M O R A N D U M Presented
CoStar Retail Statistics. Y e a r - E n d Tucson Retail Market
 CoStar Retail Statistics Y e a r - E n d 2 0 1 6 Year-End 2016 Tucson Table of Contents Table of Contents................................................................. A Methodology......................................................................
CoStar Retail Statistics. Y e a r - E n d McAllen/Edinburg/Pharr Retail Market
 CoStar Retail Statistics Y e a r - E n d 2 0 1 7 McAllen/Edinburg/Pharr Retail Market McAllen/Edinburg/Pharr Retail Market Year-End 2017 McAllen/Edinburg/Pharr Table of Contents Table of Contents.................................................................
MARKET REPORT. Manhattan Office Sector Continues Recovery as Downtown Breaks Record MANHATTAN SNAPSHOT 4.2% 0.8PP 1.98MM SF MANHATTAN OFFICE
 3Q 2014 OFFICE MANHATTAN OFFICE MARKET REPORT MANHATTAN Leasing ACTIVITY Availability RATE ABSORPTION 4.2% 0.8PP Asking RENTS 2.3% Note: Compared to 2Q 2014 Statistics 1.98MM SF Manhattan Office Sector
Indianapolis MARKETBEAT. Office Q Economy. Market Overview INDIANAPOLIS OFFICE
 INDIANAPOLIS OFFICE Economic Indicators Market Indicators (Direct, All Classes) Direct Net Absorption/Direct Asking Rent 4-QTR TRAILING AVERAGE Direct Vacancy Q3 17 Q3 18 MSA Employment 1.05M 1.07M MSA
YEAR-END CHICAGO SUBURBS Office Market Report. Big Moves Create Negative Absorption Driving Vacancy Rates Higher. YTD Net Absorption
 CHICAGO SUBURBS Office Market Report Net Absorption (1,919,191) Availability 24.1% Big Moves Create Negative Absorption Driving s Higher MARKET CONDITIONS: The suburbs had several major real estate occurrences
CoStar Office Statistics. M i d - Y e a r Denver Office Market
 CoStar Office Statistics M i d - Y e a r 2 0 1 7 Mid-Year 2017 Denver Table of Contents Table of Contents................................................................. A Methodology......................................................................
Pittsburg Towne Center
 FOR SALE Pittsburg Towne Center 2931 Railroad Ave * PRICE REDUCED * Resurgent Growth Area $143/SF Below Replacement Cost Low or Modest Rents New Freeway Expansion to 8 Lanes New BART Station at Railroad
Upstate, SC 2Q17. Industrial Market Report. Q2 Industrial. Upstate Economy in 2Q17* Industrial Sector in 2Q17. Trends for 2Q17
 Upstate, SC 2Q17 Industrial Market Report The industrial market for the Upstate of South Carolina saw continued growth for the second quarter of 217. While there was a positive net absorption of 67,53
CoStar Retail Statistics. F i r s t Q u a r t e r Colorado Springs Retail Market
 CoStar Retail Statistics F i r s t Q u a r t e r 2 0 1 7 First Quarter 2017 Colorado Springs Table of Contents Table of Contents................................................................. A Methodology......................................................................
CoStar Office Statistics. Y e a r - E n d Denver Office Market
 CoStar Office Statistics Y e a r - E n d 2 0 1 6 Year-End 2016 Denver Table of Contents Table of Contents................................................................. A Methodology......................................................................
CoStar Retail Statistics. F i r s t Q u a r t e r Seattle/Puget Sound Retail Market
 CoStar Retail Statistics F i r s t Q u a r t e r 2 0 1 7 Seattle/Puget Sound Retail Market First Quarter 2017 Seattle/Puget Sound Table of Contents Table of Contents.................................................................
2017 FORT WAYNE, INDIANA OFFICE MARKET SURVEY
 2017 FORT WAYNE, INDIANA OFFICE MARKET SURVEY 2017 REVIEW 2018 FORECAST PREPARED WITH THE ASSISTANCE OF Overall, the market conditions have stabilized. The most significant development for the Fort Wayne
INDUSTRIAL MARKET ANALYSIS
 INDUSTRIAL MARKET ANALYSIS A. SYNKAI HARRISON Portland State University CoStar reports that speculative development in the industrial market in Portland is on the rise due to a lack of inventory. Many
CoStar Office Statistics. M i d - Y e a r Portland Office Market
 CoStar Office Statistics M i d - Y e a r 2 0 1 7 Mid-Year 2017 Portland Table of Contents Table of Contents................................................................. A Methodology......................................................................
Colliers International 6250 N. River Road Suite Rosemont, IL Phone Fax No warranty or representation is made
 Colliers International 6250 N. River Road Suite 11-100 Rosemont, IL 60018 Phone 847 698 8444 Fax 847 698 8445 O Hare Quarter in Review» The O'Hare submarket continues to set new vacancy records. Significant
INDUSTRIAL QUICK STATS SUMMARY & OUTLOOK MARKET TRENDS VACANCY & NET ABSORPTION ECONOMIC STATS
 PHOENIX, ARIZONA INDUSTRIAL THIRD QUARTER 217 QUICK STATS Direct Vacancy 8.7% Overall Vacancy 9.% Lease Rate NNN $.54 Gross Absorption Under Construction MARKET TRENDS Current Quarter 5,991,128 SF 4,751,494
MONTGOMERY TRACE CENTER EVA ST. MONTGOMERY, TX 77356
 FOR SALE $10,675,000 8.0 % CAP RATE A GROCERY A GROCERY ANCHORED ANCHORED NEIGHBORHOOD SHOPPING SHOPPING CENTER CENTER FOR MORE INFORMATION CONTACT: Jeff Tinsley Jeff Beard, CCIM 92% OCCUPOIED OCCUPIED
Q1-Q2 Asking Rate (Direct) $20.30
 $20.30") CHICAGO SUBURBS Office Market Report Net Absorption (123,983) Q1-Q2 Availability 24.4% and Availability s Mislead True Market Conditions MARKET CONDITIONS: At its core, Chicagoland s suburban office market
CHICAGO SUBURBS Office Market Report Net Absorption (123,983) Q1-Q2 Availability 24.4% and Availability s Mislead True Market Conditions MARKET CONDITIONS: At its core, Chicagoland s suburban office market
CoStar Industrial Statistics. Y e a r - E n d Brownsville/Harlingen Industrial Market
 CoStar Industrial Statistics Y e a r - E n d 2 0 1 7 Brownsville/Harlingen Industrial Market Brownsville/Harlingen Industrial Market Year-End 2017 Brownsville/Harlingen Table of Contents Table of Contents.................................................................
ECONOMIC CURRENTS. Vol. 3, Issue 1. THE SOUTH FLORIDA ECONOMIC QUARTERLY Introduction
 ECONOMIC CURRENTS THE SOUTH FLORIDA ECONOMIC QUARTERLY Introduction Economic Currents provides an overview of the South Florida regional economy. The report contains current employment, economic and real
CHICAGO CBD OFFICE INVESTMENT PROPERTIES GROUP
 CHICAGO CBD OFFICE INVESTMENT PROPERTIES GROUP SECOND QUARTER NEWSLETTER 216 HOT TOPICS Capital markets remain a focus with 14 assets either under contract or sold totaling $2.6 billion, which includes
Time for Retail to Take Stock
 Q1 2013 RETAIL LAS VEGAS NEVADA RESEARCH & FORECAST REPORT Time for Retail to Take Stock It is heartening to say, after five years of a bad economy, that the first quarter of 2013 s 119,649 square feet
Office Market Report OFFICE MARKET REPORT. Boston. The Stevens Group. Ten Post Office Square Boston MA
 OFFICE MARKET REPORT Office Market Report Boston The Stevens Group First Quarter 2017 The Stevens Group Ten Post Office Square Boston MA 02109 617-886-9300 Our Difference Is Your Advantage First Quarter
KEY TOWER SALE highlights start of 2017
 KEY TOWER SALE highlights start of 2017 Demand for office space in the Greater Cleveland office market remained strong as 2016 wound down and transitioned into the first quarter of 2017. After netting
US BANK. Table of Contents
 Table of Contents US BANK Financial Overview Financial Overview....4 Tenant Overview....5 Lease Abstract.6 Investment Overview Investment Overview.. 8 Drone Photos..9 Site Aerials......10-11 Market Aerials....12-14
OFFICE QUICK STATS SUMMARY & OUTLOOK MARKET TRENDS VACANCY & NET ABSORPTION ECONOMIC STATS
 LOS ANGELES SAN GABRIEL VALLEY OFFICE SECOND QUARTER 218 QUICK STATS Direct Vacancy 11.1% Overall Vacancy 11.4% Lease Rate FSG $2.32 Gross Absorption Under Construction MARKET TRENDS Current Quarter 345,68
Office Stays Positive
 Q2 2014 OFFICE LAS VEGAS NEVADA RESEARCH & FORECAST REPORT Office Stays Positive While it may not always be pretty, Southern Nevada s office market continues to improve. Net absorption increased in the
OFFICE QUICK STATS SUMMARY & OUTLOOK MARKET TRENDS VACANCY & NET ABSORPTION ECONOMIC STATS
 INLAND EMPIRE OFFICE THIRD QUARTER 217 QUICK STATS Direct Vacancy 11.4% Overall Vacancy 11.7% Lease Rate FSG $1.83 Gross Absorption Under Construction MARKET TRENDS Current Quarter 529,634 SF 45,24 SF
The CoStar Office Report. T h i r d Q u a r t e r Greensboro/Winston-Salem Office Market
 The CoStar Office Report T h i r d Q u a r t e r 2 0 1 4 Greensboro/Winston-Salem Office Market Third Quarter 2014 Greensboro/Winston-Salem Table of Contents Table of Contents.................................................................
Riverstone Marketplace II
 Riverstone Marketplace II VANCOUVER, WASHINGTON EXCELLENT SYNERGY WITH SEVERAL NATIONAL BRANDS INCLUDING NATURAL GROCERS, BANK OF AMERICA, AND PROVIDENCE MEDICAL PLAZA Overview Riverstone Marketplace
Second Quarter: Suburban Maryland s Uptick in Leasing has yet to be Realized in Absorption Numbers
 Q2 2013 OFFICE SUBURBAN MARYLAND SUBURBAN MARYLAND MARKET REPORT Second Quarter: Suburban Maryland s Uptick in has yet to be Realized in Numbers Updated May 2012 MARKET INDICATIONS Q2 2013 Q3 2013 (p)
The CoStar Retail Report. T h i r d Q u a r t e r Inland Empire Retail Market
 The CoStar Retail Report T h i r d Q u a r t e r 2 0 1 5 Third Quarter 2015 Inland Empire Table of Contents Table of Contents................................................................. A Methodology......................................................................
Miami-Dade County Office Market Report 1Q Real Capital Partners Real Estate Services
 -Dade County Office Report 1Q 216 Real Capital Partners Real Estate Services 1Q 216 -Dade County Office Report Overview -Dade County s Vacancy Increases to 1.4% Net Negative (11,64) SF in the Quarter The
NET LEASE INVESTMENT OFFERING. Chase Bank (Ground Lease 23 Years Remaining) 2101 Orchard Road, Montgomery, IL (Chicago MSA)
 2101 Orchard Road, Montgomery, IL (Chicago MSA)") Chase Bank (Ground Lease 23 Years Remaining) 2101 Orchard Road, Montgomery, IL 60538 (Chicago MSA) TABLE OF CONTENTS TABLE OF CONTENTS I. Executive Profile Executive Summary Investment Highlights Property
Chase Bank (Ground Lease 23 Years Remaining) 2101 Orchard Road, Montgomery, IL 60538 (Chicago MSA) TABLE OF CONTENTS TABLE OF CONTENTS I. Executive Profile Executive Summary Investment Highlights Property
The CoStar Industrial Report
 The CoStar Industrial Report M I D - Y E A R 2 0 1 0 Houston Industrial Market Houston Industrial Market MID-YEAR 2010 HOUSTON Table of Contents Table of Contents....................................................................
NNN Ground Lease Investment. Tenant Since Dynamic Corner Location. 54 Locations in IL, MO & TN
 EXECUTIVE SUMMARY OFFERING SUMMARY Sale Price: $995,000 Cap Rate: 8.08% Lot Size: 0.38 Acres Building Size: 1,012 Traffic Count: 30,200 Lease Type NNN Ground Lease Traffic Count (I-80/94) 137,500 NOI $80,454.36
Office Market Continues to Improve
 Research & Forecast Report LAS VEGAS OFFICE Q3 2016 Office Market Continues to Improve > > Southern Nevada s office market is improving at a steady rate > > Net absorption has been positive in twelve of
MCDONALD S CORPORATE GROUND LEASE Gladewater, Texas
 SUBJECT PROPERTY ACTUAL LOCATION ACTUAL PROPERTY Table of Contents Investment Summary Investment Overview Lease Abstract Aerial Photo Location Map Competition Maps Presented By: MATT MOAKE, CCIM 713.275.6715
The CoStar Retail Report. Y e a r - E n d Roanoke Retail Market
 The CoStar Retail Report Y e a r - E n d 2 0 1 5 Year-End 2015 Roanoke Table of Contents Table of Contents................................................................. A Methodology......................................................................
Leasing Sales Management Construction Development FOR MORE INFORMATION PLEASE CONTACT:
 FOR SALE 61 N. Buffalo Grove Rd 21-61 N. Buffalo Grove Rd, Buffalo Grove, IL 60089 PLEASE CALL: 847.870.8585 FOR MORE INFORMATION PLEASE CONTACT: Barry Millman bmillman@horizonrealtyservices.com George
CORNER RETAIL BUILDING FOR SALE
 CORNER RETAIL BUILDING FOR SALE 5900 N BROADWAY CHICAGO, IL 60660 Tim Rasmussen, CCIM Assistant Vice President 312.676.1875 trasmussen@svn.com SVN CHICAGO COMMERCIAL 940 WEST ADAMS STREET, SUITE 200, CHICAGO,
Indianapolis MARKETBEAT. Office Q Economy. Market Overview INDIANAPOLIS OFFICE
 INDIANAPOLIS OFFICE Economic Indicators Q2 17 Q2 18 MSA Employment 1.1M 1.1M MSA Unemployment 3.3% 3.0% U.S. Unemployment 4.3% 3. Market Indicators (Direct, All Classes) Q2 17 Q2 18 Total Market Vacancy
Washington DC Market Office Report
 Washington DC Market Office Report Market Overview The Office Market The Washington Office Market includes the District of Columbia and adjacent suburban submarkets in Maryland and Virginia. The Washington
Good Year, Poor Quarter
 Q4 2013 RETAIL LAS VEGAS NEVADA RESEARCH & FORECAST REPORT Good Year, Poor Quarter After nine quarters of positive net absorption, Southern Nevada s retail market fell into negative net absorption territory
INDUSTRIAL QUICK STATS SUMMARY & OUTLOOK MARKET TRENDS VACANCY & NET ABSORPTION ECONOMIC STATS
 ORANGE COUNTY INDUSTRIAL FOURTH QUARTER 217 QUICK STATS Direct Vacancy 2.3% Overall Vacancy 2.7% Lease Rate NNN $.91 Gross Absorption Under Construction MARKET TRENDS Current Quarter 4,283,991 SF 963,138
The CoStar Office Report
 The CoStar Office Report Y E A R - E N D 2 0 0 9 YEAR-END 2009 SALT LAKE CITY Table of Contents Table of Contents.................................................................... A Methodology........................................................................
ECONOMIC CURRENTS. Vol. 3, Issue 3 SOUTH FLORIDA ECONOMIC QUARTERLY. Introduction
 ECONOMIC CURRENTS THE Introduction SOUTH FLORIDA ECONOMIC QUARTERLY Economic Currents provides an overview of the South Florida regional economy. The report presents current employment, economic and real
Stronger Office Market Looking Into Future
 Research & Forecast Report Long Island OFFICE MARKET Q2 2015 Stronger Office Market Looking Into Future Rose Liu Research & Financial Analyst Long Island Takeaways Class A & B Long Island economic and
Net Lease Investment Sale ATI Physical Therapy 613 West Jefferson St. Shorewood, Illinois
 First In Realty Executives is pleased to offer for sale a 3,938 SF free-standing ATI Physical Therapy located in, a quaint Chicago suburb positioned approximately 40 minutes southwest of Downtown Chicago.
2015 FORT WAYNE, INDIANA RETAIL MARKET SURVEY
 215 FORT WAYNE, INDIANA RETAIL MARKET SURVEY REVIEW FORECAST PREPARED WITH THE ASSISTANCE OF The period of October 214 - June 215 was an active time for retail transactions in the Fort Wayne area; however,
INDUSTRIAL MARKET ANALYSIS
 INDUSTRIAL MARKET ANALYSIS A. SYNKAI HARRISON Portland State University The National Real Estate Investor recently reported that 2014 saw the return speculative development in the industrial market in
MARKET WATCH SOUTHERN CALIFORNIA & PHOENIX
 SOUTHERN CALIFORNIA & PHOENIX COMMERCIAL REAL ESTATE MARKET FOURTH QUARTER 217 MARKET WATCH SOUTHERN CALIFORNIA & PHOENIX 1.888.659.DAUM WWW.DAUMCOMMERCIAL.COM D/AQ Corp. # 1129558 DAUM TABLE OF CONTENTS
Suburban Boston Office MarketView
 Suburban Boston Office MarketView CBRE Global Research and Consulting U.S. UNEMPLOYMENT 6.7% MA UNEMPLOYMENT 7.1% OCCUPIED SF 92.9M AVAILABILITY 20.3% SUBLEASE SF 2.6M UNDER CONSTRUCTION 1.6M *Arrows indicate
Office Market Remained Steady in Q4
 Research & Forecast Report Long Island OFFICE MARKET Q4 2015 Office Market Remained Steady in Q4 Rose Liu Research & Financial Analyst Long Island Takeaways Class A & B Continuing the momentum, the Long
Nashville the #5 Market to Watch in 2019
 Research & Forecast Report NASHVILLE INDUSTRIAL 4 th Quarter Nashville the #5 Market to Watch in 2019 Industrial Market The industrial real estate sector is currently undergoing one of the greatest expansionary
The CoStar Office Report
 The CoStar Office Report M I D - Y E A R 2 0 1 1 MID-YEAR 2011 SAN FRANCISCO San Francisco s Vacancy Decreases to 13.2% Net Absorption Positive 809,306 SF in the Quarter The San Francisco Office market
Bakersfield 4Q18 Office Market Trends
 Bakersfield the higher cost of leasing in the submarket is unlikely to hinder demand as CRC s lease expirations create more available inventory within the University Centre Submarket. Mark J. Smith, SIOR
Hoffman Corners Retail Center II COUNTY ROAD E EAST, VADNAIS HEIGHTS MINNESOTA
 Hoffman Corners Retail Center II 1654-1658 COUNTY ROAD E EAST, VADNAIS HEIGHTS MINNESOTA Mike Brass Vice President Direct 952 837 3054 mike.brass@colliers.com Offering Overview THE OFFERING Colliers International
The CoStar Retail Report. Y e a r - E n d Denver Retail Market
 The CoStar Retail Report Y e a r - E n d 2 0 1 4 Year-End 2014 Denver Table of Contents Table of Contents................................................................. A Methodology......................................................................
Industrial Market Review
 Q3 2013 industrial Stockton San JoAquin County, California research & forecast Report Industrial Market Review Amazon s Completed Facility Helps Balance the Market The San Joaquin County industrial real
+48.6 million sf office inventory
 Research Market Report METROPOLITAN MILWAUKEE OFFICE 2018 Quarter 1 Research Wisconsin Introduction Following a strong second half of 2017, 2018 had a slow start. Despite an increase in vacancy and negative
Advance Auto Parts Building For Sale
 Advance Auto Parts Building For Sale 14307 1st Avenue South Burien WA 98168 Sale Price: $1,650,000 6.93% cap rate Exclusively Offered By: Rich Cannon 206.436.2345 rich@cannoncommercial.com Executive Summary
SHOPS OF BERRYHILL OFFERING MEMORANDUM
 OFFERING MEMORANDUM 1890 BERRYHILL RD, CORDOVA, TN 38016 EAST RETAIL SUBMARKET RETAIL SHOPPING CENTER 17,360 sf INVESTMENT OPPORTUNITY CHIMNEY ROCK BLVD BERRYHILL RD N For more information, please contact:
2016 FORT WAYNE, INDIANA OFFICE MARKET SURVEY
 2016 FORT WAYNE, INDIANA OFFICE MARKET SURVEY 2016 REVIEW 2017 FORECAST PREPARED WITH THE ASSISTANCE OF New construction, renovation and relocation in downtown was the big story for the Fort Wayne office
Manhattan New Dev. Market Report st Quarter mns.com
 Manhattan New Dev. Market Report 2013 1st Quarter TABLE OF CONTENTS Manhattan New Development Report 1Q13 TABLE OF CONTENTS 03 Introduction 04 Market Snapshot 09 Neighborhood Trends 09 Battery Park City