Visit our Publications and Open Data Catalogue to find our complete inventory of our freely available information products.
|
|
|
- Gervase Booker
- 5 years ago
- Views:
Transcription

1 Welcome to Mississauga Data This report and other related documents can be found at Mississauga Data is the official City of Mississauga website that contains urban planning related reports, newsletters, brochures and data. The Information Planning Research Unit manages statistical data including: population, demographics, census, development monitoring/activity, growth forecasts, housing, employment, office, land use, vacant employment lands, and the environment. Visit our Publications and Open Data Catalogue to find our complete inventory of our freely available information products. Working on a research project? Contact us below for the latest statistics. Phone: (905) ext eplanbuild.info@mississauga.ca RSS: Twitter: Website:

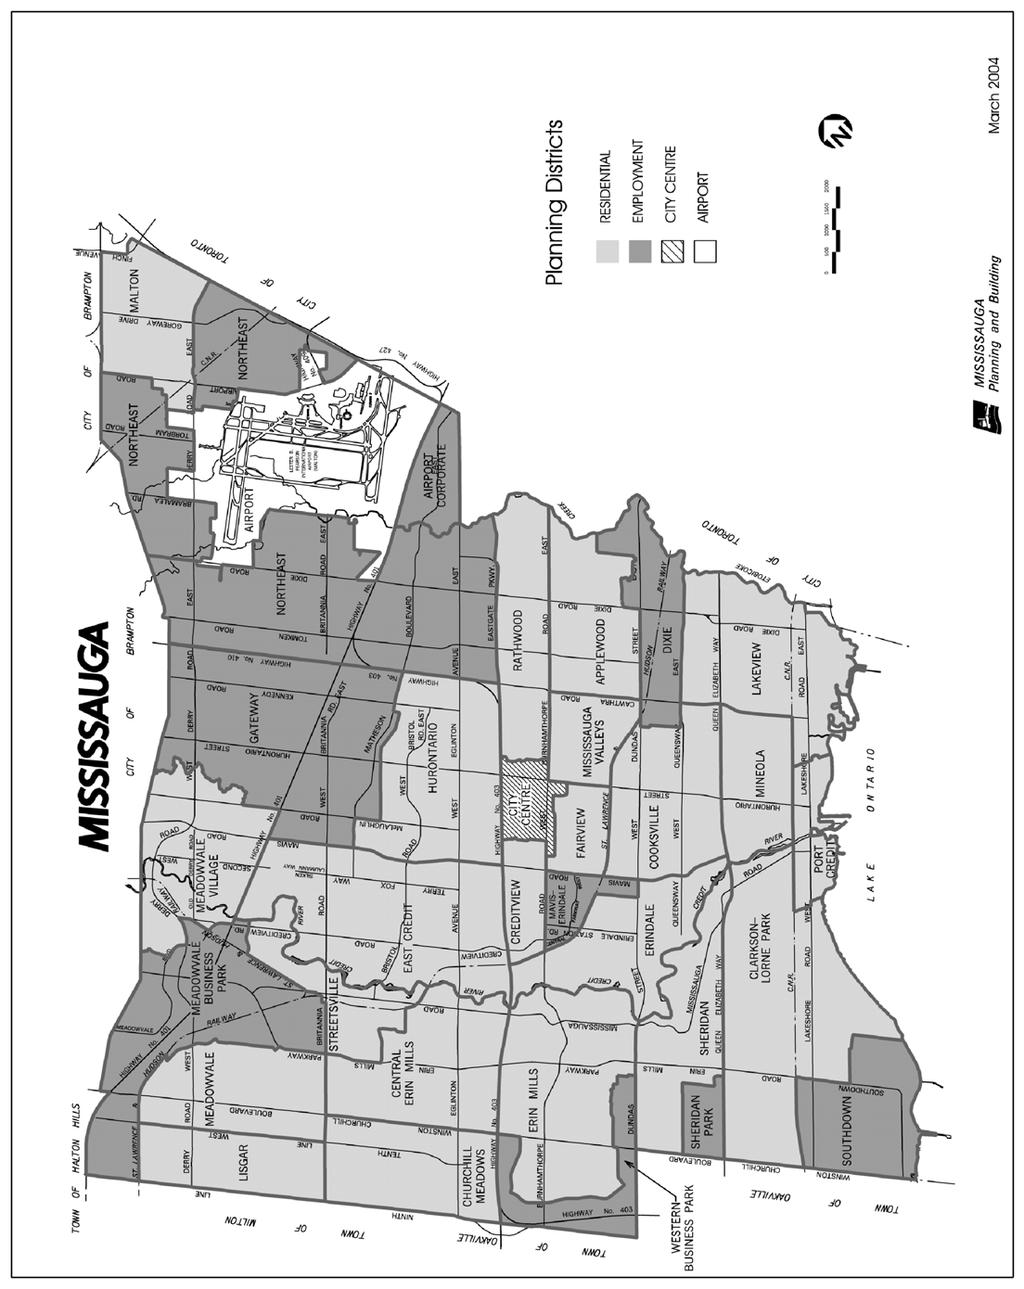
2 Planning and Building Department, City of Mississauga March 2004 This newsletter reports on building permits issued in 2003 for new residential and non-residential development. Permits issued for changes to existing non-residential development are also included. In addition, some comparisons of historical permit activity are provided. The total prescribed value in 2003 for building permits reported on in this newsletter is $1.455 billion. Other building permits not reported on (e.g., temporary structures, inground pools, sprinklers) account for $52 million in prescribed value, for a total prescribed value for all construction in 2003 of $1.507 billion. This is the seventh consecutive year the total prescribed value for building permits has exceeded the billion dollar mark for the City of Mississauga. RESIDENTIAL For new residential construction in 2003, data summaries are provided by type of residential unit including detached, semi-detached, townhouse and apartment. As well, a summary of new units by City Gate I and Ovation at City Centre, two of the apartments under construction in City Centre planning district is provided on page 3. (A map of Planning Districts is found on page 8). In 2003, building permits were issued for 5,707 residential units. Of these, 36% were for apartment units, 27% for detached units, 19% for semi-detached units and 18% for townhouse units. Residential Units by Type, Based on Building Permits Issued from 1987 to 2003 Units 10,000 9,000 8,000 7,000 6,000 5,000 4,000 3,000 2,000 1, ,774 8,777 6,664 4,288 2,214 5,625 2,614 4,119 3,446 4,367 4,681 3,035 5,274 4,905 6,131 6,131 5,983 5, Detached Semi-detached Townhouse Apartment Mississauga, Leading Today for Tomorrow
3 residential units for which building permits were issued have declined marginally (5%) from 5,983 units in 2002 to 5,707 units in This decline has been mirrored in every housing form but apartment units. The largest decline was in detached dwellings. Apartments represented the largest number of units for which residential building permits were issued. Residential units issued building permits in 2003 were concentrated in the central, western, and northern areas of the City. The highest number of new residential units were in City Centre (1,520 units), Churchill Meadows (1,074 units), and East Credit (805 units). units in these communities accounted for 60% of the total new residential units for which building permits have been issued in From 2000, Churchill Meadows had the highest number of new residential units, the result of residential expansion of this community. These units have consisted primarily of lower and middle density units including detached, semidetached and townhouse units. In 2003, residential development in City Centre has been in the form of apartment units in four high-rise projects. The type of residential development in 2003 represents a departure from previous years where detached units have been the largest type of unit developed. Development of new apartment units have not surpassed detached residential units since The form and pace of development reflects the maturing of the City of Mississauga, as green space for lower density forms is limited, and higher density sites are developed. Residential Units by Planning District, Based on Building Permits Issued in 2003 City Centre Churchill Meadows 1,074 1,520 East Credit Meadowvale Village Lisgar Hurontario Central Erin Mills Clarkson-Lorne Park Applewood Port Credit Erindale Cooksville Lakeview Malton Mineola Erin Mills Rathwood Sheridan Fairview Streetsville Detached Semi-detached Townhouse Apartment ,000 1,200 1,400 1,600 1,800 Units Page 2
4 Planning District Residential Units By Planning District, Based on Building Permits Issued in 2003 Single Detached Semidetached Townhouse Apartment Applewood Central Erin Mills Churchill Meadows ,074 City Centre ,520 1,520 Clarkson-Lorne Park Cooksville Creditview Dixie East Credit Erin Mills Erindale Fairview Hurontario Lakeview Lisgar Malton Meadowvale Meadowvale Village Mineola Mississauga Valleys Port Credit Rathwood Sheridan Streetsville City 1,520 1,092 1,055 2,040 5,707 % of 27% 19% 18% 36% 100% Prescribed Value for Residential Development (in thousands) $863,387 Prescribed Value for Other Residential Development (in thousands) (e.g., renovations, new garages and carports) Prescribed Value for all Residential Development (in thousands) (ie., new and other residential construction) $40,745 $904,132 Page 3
5 NON-RESIDENTIAL For non-residential construction, data summaries are provided by type of non-residential building including commercial, industrial and public. The commercial category includes retail and office development; the industrial category includes manufacturing, warehousing, logistics and multiunit industrial buildings; and the public category includes, among other buildings, schools, places of religious assembly and municipal facilities. Information on prescribed value and number of permits is provided by planning district for new development and for changes to existing development. In 2003, a total of 107 building permits were issued for new non-residential construction projects, with a total prescribed value of $360 million or 61% of non-residential construction. Of these new permits, 35% of the prescribed value was for public development, 34% was for industrial development, and 32% was for commercial development. The total prescribed value of permits issued for new non-residential buildings increased by 23%, or $67 million from 2002 to public buildings included a project which combined a school and library branch with a prescribed value of $29 million. In addition, a new secondary school, a new University of Toronto building and long term care facility each contributed over $15 million of prescribed value in These selected projects contributed 21% of the total new prescribed value in the year. Significant commercial development included a Bell Mobility office building, the second phase of the Bell Canada Campus, with a prescribed value of over $21 million. Other commercial development included a new Wal-Mart Store and Comfort Suites Hotel with prescribed values of $12 million and $10 million, respectively. The north-eastern employment districts of Gateway and Northeast continue to dominate new industrial development. The prescribed value for these two districts represented 82% of the total prescribed value for new industrial development in Development and Changes to Development Prescribed Value ($) for Non-Residential Development by Type of Building, Based on Building Permits Issued in 2003 Prescribed Value % of # of Permits Commercial $180,128,400 30% 694 Industrial $200,848,000 34% 435 Public $210,925,000 36% 107 $591,901, % 1,236 Building permits issued for changes to existing development include additions and alterations to existing buildings, revisions, mezzanines and other permits. Revision permits include any significant change to a building that has been issued a permit such as increasing the floor area, mechanical changes or revised floor layout. A mezzanine permit is defined as an intermediate floor assembly between the floor and ceiling of any room or storey, including an interior balcony. An other permit may include such changes as a fire alarm system, storage shed or magnetic lock system. One building permit may account for many changes to a property. For example a permit may be issued for interior alterations to a building and then additional plumbing changes may be issued under the same permit number. Each change would be recorded with a different prescribed value. Permits issued for changes to existing development in 2003 represented 39% of the total prescribed value for all non-residential permits issued during this year. The breakdown by type included 37% for public, 34% for industrial, and 29% for commercial. Changes to existing public development represented only 8% of the total building permits for 2003 while accounting for the largest share of the prescribed value for all changes to existing projects. In 2003, permits issued for changes to existing public development included expansions and alterations to Credit Valley Hospital of $57 million, Trillium Centre-Mississauga Hospital of $6 million and Huron Park Community Centre of $3 million. These three projects represented 29% of the total prescribed value for changes to existing in Page 4
6 Development Prescribed Value ($) by Type of Building, Based on Building Permits Issued from 1995 to , , , , , , , , ,000 0 $ (thousands) 768, , , , , , , , , Commercial Industrial Public Changes to Development Prescribed Value ($) by Type of Building, Based on Building Permits Issued from 1995 to ,000 $ (thousands) 250, , , , , , , , ,000 50,000 91, , , , Commercial Industrial Public Changes to existing industrial buildings included interior alterations to Black Hawk Plastics Automotive of $8 million, Lily Cup Incorporated of $7 million and CFM Majestic Vermont Casting of $4 million. In 2003, 83% of changes to existing industrial projects have been in the established employment districts of Northeast, Gateway and Meadowvale Business Park in the northern part of the City. Commercial development represented the largest proportion, 56%, of the changes to existing development permits. Of note are the interior alterations to Square One Shopping Centre for $4 million and to the Royal Bank Office complex in Meadowvale Business Park for $2 million. The prescribed value for changes to existing development had declined 30% from 2001 to 2002, but increased by $56 million or 32% from 2002 to Page 5
7 2003 Non-Residential Building Permits by Planning District Prescribed Value ($) and Number of Permits of Development and Changes to Development (value in thousands) Planning District Airport Corporate Commercial Industrial Public 0 4,480 (21) 4,480 (21) 0 2,102 2, ,582 (38) 6,582 (38) Applewood 0 2,074 2, ,187 2, ,261 4,261 Central Erin Mills 3,501 1,775 5, ,220 58,747 (11) 78,967 23,721 60,522 84,243 (40) Churchill Meadows 1, (19) 2, , ,532 16, (19) 17,795 (24) City Centre 0 11,801 (92) 11,801 (92) ,878 (99) 11,878 (99) Clarkson- Lorne Park 0 2, ,783 2,783 Cooksville 6, ,117 (23) ,581 6,581 6,515 7,183 (31) 13,698 (32) Creditview Dixie 1,685 3,809 (26) 5,494 (28) ,685 4,425 (40) 6110 (42) East Credit 7,589 (10) 3,155 (31) 10,744 (41) , ,262 9,850 3,688 (35) 13,537 (47) Erindale 1, , ,460 4,254 19,714 16,605 4,254 20,859 Erin Mills 14,461 3,029 17,490 (31) ,461 3,616 18,077 (37) Fairview 6,374 2,167 (18) 8, ,179 2,169 (19) 9,348 (24) Gateway 17,787 4,253 (50) 22,040 (56) 65,819 23,318 (73) 89,137 (89) ,606 27,736 (125) 111,342 (147) Hurontario 1,208 1,572 (25) 2,780 (26) , ,978 11,824 1,934 13,758 (30) Lakeview 0 4,638 4, , ,995 2,213 5,119 (35) 7,332 (37) Page 6
8 Planning District Lisgar 1,105 Commercial Industrial Public $ (#) 118 1, , ,223 Malton 0 1,327 1, ,224 3, ,551 4,551 Mavis-Erindale ,070 1, ,985 1,985 Meadowvale Residential 2,642 1,020 3,662 (26) ,642 1,070 (25) 3,712 (29) Meadowvale Business Pk 305 4,176 4,481 (34) 8,349 13,163 (53) 21,512 (56) 886 1,044 1,930 9,540 18,383 (87) 27,923 (92) Meadowvale Village 496 2,729 3, , ,646 43,127 2,965 (21) 46,092 (25) Mineola Mississauga Valleys ,030 1, ,139 1,139 Northeast 35,686 2,520 38,206 (30) 33,057 30,120 (147) 63,177 (156) 0 2,776 2,776 68,743 35,416 (178) 104,159 (190) Port Credit ,895 1, ,457 (24) 2,457 (24) Rathwood 0 1,107 1, ,501 2,758 18,259 15,501 3,865 19,366 (15) Sheridan Residential 0 1,187 1, ,241 1,241 Sheridan Park 1, , ,977 1,343 3,320 Southdown 7,486 2,111 (40) 9,597 (47) ,591 2,812 (53) 10,403 (61) Streetsville (10) 714 (10) Western Business Pk 1, ,972 12,460 6,298 (45) 18,758 (48) ,075 6,655 (53) 20,730 (57) 113,996 (58) 66,132 (636) 180,128 (694) 121,008 (34) 79,840 (401) 200,848 (435) 124,907 (15) 86,018 (92) 210,925 (107) 359,911 (107) 231,990 (1,129) 591,901 (1,236) Note: The type of building permits included are new building, addition to an existing building, alteration to an existing building, addition and alteration to an existing building, revisions, mezzanine, and other. s may not add due to rounding. Page 7
9
Mississauga Growth Forecast
 Mississauga Growth Forecast Housing 2008-2031 July 2010 The City of Mississauga growth forecast completed in 2008 provides population, housing and employment forecasts from the year 2008 to 2031. This
Visit our Publications and Open Data Catalogue to find our complete inventory of our freely available information products.
 Welcome to Mississauga Data This report and other related documents can be found at www.mississauga.ca/data. Mississauga Data is the official City of Mississauga website that contains urban planning related
Mississauga Growth Forecast
 Mississauga Growth Forecast Housing 2008-2031 July 2010 The City of Mississauga Growth Forecast provides population, housing and employment forecasts for the years 2008 to 2031. This forecast is based
Visit our Publications and Open Data Catalogue to find our complete inventory of our freely available information products.
 Welcome to Mississauga Data This report and other related documents can be found at www.mississauga.ca/data. Mississauga Data is the official City of Mississauga website that contains urban planning related
This profile contains information on building activity, employment lands, as well as both industrial and office markets.
 Market Conditions This profile contains information on building activity, employment lands, as well as both industrial and office markets. Mississauga Recognized for Economic Strategy The City of Mississauga
Edward R. Sajecki Commissioner of Planning and Building
 Corporate Report Clerk s Files Originator s Files CD.03.APP (Applewood) DATE: TO: FROM: SUBJECT: Chair and Members of Planning and Development Committee Meeting Date: May 29, 2006 Edward R. Sajecki Commissioner
2013 HIGHLIGHTS. 27.4% of the City s multi-residential units are located in Downtown Character Areas WANT MORE?
 Residential Directory 2013 2013 HIGHLIGHTS KEY FACTS 2013 Residential Directory includes only multi type residential units 112,604 residential units included in this directory 71,503 (63.5%) of units are
New Industrial & Commercial Building Permits Mississauga
 New Industrial & Commercial Building Permits Mississauga January December 2011 Date Owner/Applicant Occupant Type Location Employment Districts Value ($000s) Size (sq. ft.) Gateway 201103 Sarup Enterprises
Mississauga Residential Multiple Unit Directory
 Dec 2010 Mississauga Residential Multiple Unit Directory December 2010 Introduction The Mississauga Residential Multiple Unit Directory, December 2010, includes information on development that is built,
2011 Census Bulletin #4 Dwellings & Structure Type in Metro Vancouver
 2011 Census Bulletin #4 Dwellings & Structure Type in Metro Vancouver Regional Dwelling Count According to the 2011 Census figures recently released by Statistics Canada, there were 891,340 occupied private
Building Report - Detail June, 2018
 NEW DWELLING UNITS MONTH SINGLE SEMI ROW DWELLING APARTMENT SECOND UNIT OTHER JUN 12 2 0 0 18 2 SUB TOTAL 12 2 0 0 18 2 YTD TOTAL 100 22 110 2,179 104 8 Page #: 6 ROW DWELLINGS OWNER LOCATION BLDG NO UNIT
Table of Contents. Appendix...22
 Table Contents 1. Background 3 1.1 Purpose.3 1.2 Data Sources 3 1.3 Data Aggregation...4 1.4 Principles Methodology.. 5 2. Existing Population, Dwelling Units and Employment 6 2.1 Population.6 2.1.1 Distribution
SCHEDULE A TO BY-LAW NUMBER (Amended by By-law ) CLASSES OF PERMITS AND PERMIT FEES
 CLASSES OF PERMITS AND PERMIT FEES") SCHEDULE A TO BY-LAW NUMBER 2010-24 (Amended by By-law 2016-40) CLASSES OF PERMITS AND PERMIT FEES 1. Except where a minimum flat fee is indicated for the Occupancy Classification or Type of Construction,
SCHEDULE A TO BY-LAW NUMBER 2010-24 (Amended by By-law 2016-40) CLASSES OF PERMITS AND PERMIT FEES 1. Except where a minimum flat fee is indicated for the Occupancy Classification or Type of Construction,
Building Report - Detail July, 2018
 NEW DWELLING UNITS MONTH SINGLE SEMI ROW DWELLING APARTMENT SECOND UNIT OTHER JUL 18 0 0 1@ 404 21 2 SUB TOTAL 18 0 0 404 21 2 YTD TOTAL 118 22 110 2,583 125 10 Page #: 6 ROW DWELLINGS BLDG NO UNIT NO
AGENDA PLANNING & DEVELOPMENT COMMITTEE THE CORPORATION OF THE CITY OF MISSISSAUGA MONDAY, JUNE 26, 2006
 AGENDA PLANNING & DEVELOPMENT COMMITTEE THE CORPORATION OF THE CITY OF MISSISSAUGA MONDAY, JUNE 26, 2006 AFTERNOON SESSION 1:30 P.M. EVENING SESSION 7:00 P.M. COUNCIL CHAMBER, CIVIC CENTRE 300 CITY CENTRE
Focus on Mississauga 2012
 Focus on Mississauga 2012 Atlas of the Downtown, Major Nodes and Community Nodes South Common Community Node This page is intentionally left blank Focus on Mississauga 2012 Index Map...........pg ii Land
AUBURN BANKSTOWN BLACKTOWN HOLROYD PARRAMATTA THE HILLS. West Central District Demographic & Economic Characteristics
 AUBURN BANKSTOWN BLACKTOWN HOLROYD PARRAMATTA THE HILLS West Central District Demographic & Economic Characteristics Contents The West Central District 3 People 4 Population 4 Age Profile 6 Households
Existing Land Use. Typical densities for single-family detached residential development in Cumberland County: 1
 Existing Land Use A description of existing land use in Cumberland County is fundamental to understanding the character of the County and its development related issues. Economic factors, development trends,
JASPER PLACE NEIGHBOURHOOD HOUSING ASSESSMENT NOVEMBER West Jasper Place. Glenwood. Britannia Youngstown. Canora
 JASPER PLACE NEIGHBOURHOOD HOUSING ASSESSMENT NOVEMBER 2013 West Jasper Place Glenwood Britannia Youngstown Canora TABLE OF CONTENTS A: INTRODUCTION................................... 01 B: PHOTOGRAPHIC
The Southgate Economic Development Department provides economic development services for the Township of Southgate.
 4. Industrial Development 4.1 Industrial Development Assistance The Southgate Economic Development Department provides economic development services for the. The Economic Development Department: Provides
Statistics Canada Report July, 2012 City of Mississauga Planning and Building
 July, SECTION A - MAJOR CONSTRUCTION PROJECTS SUBTOTAL PERSCRIBED VALUE(s) : SUBTOTAL UNITS :,, BUILDING TYPE TYPE OF WORK VALUE(s) AREA(m) DESCRIPTION DI BLASIO DI BLASIO DIBLASIO CHURCHILL DUNDAS INC
QUEENSWAY HYDRO CORRIDOR LAND USE STUDY
 Exhibit 1 QUEENSWAY HYDRO CORRIDOR LAND USE STUDY November 2001 prepared by Planning and Building Department Table of Contents 1.0 INTRODUCTION...1 1.1 Background...1 1.2 Purpose...2 1.3 Study Method &
HIGHLIGHTS Scarborough Toronto
 HIGHLIGHTS Toronto Population 2011 Population By Age Group Ward Population 625,930 + 3.0% 2006-2011 35% 30% 25% Population Density 20% 15% 10% Households 3.33 thousand people per km 2 5% 0% 0-14 15-24
Amendment No. 41. City of Mississauga Planning Area
 Amendment No. 41 to Mississauga Official Plan for the City of Mississauga Planning Area Amendment No. 41 to Mississauga Official Plan for the City of Mississauga Planning Area The following text and Map
HIGHLIGHTS Ward Toronto
 HIGHLIGHTS Ward Toronto Population Ward Population 62,445 + 8.9 2006 2011 35 30 2011 Population By Age Group 25 39 yrs Median Age Population Density 20 15 39 yrs Median Age 4.55 thousand people per km
AGENDA PLANNING & DEVELOPMENT COMMITTEE THE CORPORATION OF THE CITY OF MISSISSAUGA MONDAY, MARCH 30, 2009
 AGENDA PLANNING & DEVELOPMENT COMMITTEE THE CORPORATION OF THE CITY OF MISSISSAUGA MONDAY, MARCH 30, 2009 AFTERNOON SESSION 1:30 P.M. EVENING SESSION 7:00 P.M. COUNCIL CHAMBER, 2 ND FLOOR - CIVIC CENTRE
Building Report - Detail May, 2018
 NEW DWELLING UNITS MONTH SINGLE SEMI ROW DWELLING APARTMENT SECOND UNIT OTHER MAY 23 6 0 1@ 600 21 0 1@ 468 1@ 678 SUB TOTAL 23 6 0 1746 21 0 YTD TOTAL 88 20 110 2,179 86 6 Page #: 6 ROW DWELLINGS UNIT
HIGHLIGHTS Etobicoke York Toronto
 HIGHLIGHTS Toronto Population Ward Population 620,175 + 3.3% 2006-2011 35% 30% 2011 Population By Age Group 25% Population Density 20% 15% 10% Households 3.31 thousand people per km 2 5% 0% 0-14 15-24
Cooksville HURONTARIO ST DUNDAS ST E KIRWIN AVE
 Cooksville The Offering The Land Services Group is pleased to offer for sale the Properties at 0, 00, 0, 0 Kirwin Avenue and 0 Littlejohn Lane (The Property or Site ). Situated in central Mississauga,
Land Use Survey Summer 2014
 Land Use Survey Summer 2014 North Ogden City, Utah Robert Scott, City Planner Travis Lund, Planning Intern Contents General Information... 1 Land Use Groups... 1 Urbanized Land Uses... 1 Residential...
BUILDING DIVISION SIMPLIFIED BUILDING PERMIT FEE SCHEDULE January 01st, 2019 to December 31st, 2019
 How to Calculate Permit Fees: To calculate the mit fee required at the time of application the following is used 1. Determine which Class of Work is applicable 2. Determine the Area of Work (i.e. project
Focus on Mississauga 2012
 Focus on Mississauga 2012 Atlas of the Downtown, Major Nodes and Community Nodes Sheridan Community Node This page is intentionally left blank Focus on Mississauga 2012 Index Map...........pg ii Land Area,
13 Major Nodes Introduction General
 13 Major Nodes 13.1 Introduction There are two Major Node Character Areas in Mississauga: Central Erin Mills; and Uptown. This section identifies the modifications to the General Land Use designations
1 De Jong Drive. Streetsville. Dan Cooper, Broker
 1 De Jong Drive Streetsville Dan Cooper, Broker Welcome to 1 De Jong Drive Fabulous location! Gorgeous, custom designed executive home rebuilt 17 years ago on the existing foundation on a desirable corner
Attachment 3. Guelph s Housing Statistical Profile
 Attachment 3 Guelph s Housing Statistical Profile Table of Contents 1. Population...1 1.1 Current Population (26)...1 1.2 Comparative Growth, Guelph and Ontario (21-26)...1 1.3 Total Household Growth (21
Chairman and Members of the Planning and Development Committee. Thomas S. Mokrzycki, Commissioner of Planning and Building
 CD.07.FUN DATE: TO: FROM: SUBJECT: Chairman and Members of the Planning and Development Committee Thomas S. Mokrzycki, Commissioner of Planning and Building Criteria for the Location of Funeral Homes (Undertaking
STAFF REPORT. January 25, North York Community Council. Director, Community Planning, North District
 STAFF REPORT January 25, 2005 To: From: Subject: Purpose: North York Community Council Director, Community Planning, North District Refusal Report OPA & Rezoning Application 04 194214 NNY 33 OZ Applicant:
Building Report - Detail August, 2016
 NEW DWELLING UNITS MONTH SINGLE SEMI ROW DWELLING APARTMENT SECOND UNIT OTHER AUG 9 4 0 0 6 0 SUB TOTAL 9 4 0 0 6 0 YTD TOTAL 105 27 118 344 85 18 Page #: 6 ROW DWELLINGS BLDG NO UNIT NO VALUE ( $1,000
APPENDIX C CHARACTERISTICS OF THE ENERGIZE PHOENIX CORRIDOR
 APPENDIX C CHARACTERISTICS OF THE ENERGIZE PHOENIX CORRIDOR BACKGROUND ON RESIDENTIAL AND COMMERCIAL BUILDINGS IN THE EP CORRIDOR The 10-mile EP corridor (Figure G1) is a highly diverse, mixed-use L-shaped
Statistics Canada Report June, 2018 City of Mississauga Planning and Building
 SECTION A - MAJOR CONSTRUCTION PROJECTS,, ONTARIO INC. SHOPPERS REALTY INC REGIONAL MUNICIPALITY OF PEEL BATTLEFORD RD KENNEDY RD EAST AVE HAMMOND RD WENDRON CRES PL M PT BLK, R PTS,, PT PARTS, CON EHS
SCHEDULE A. Permit fees shall be calculated based on the formula given below, unless otherwise specified in this schedule:
 SCHEDULE A CLASSES OF PERMITS AND PERMIT FEES 1. CALCULATION OF PERMIT FEES FOR CONSTRUCTION: (6) Permit fees shall be calculated based on the formula given below, unless otherwise specified in this schedule:
7. DISTRICT OF MUSKOKA HOUSING SUPPLY AND DEMAND
 7. DISTRICT OF MUSKOKA HOUSING SUPPLY AND DEMAND 7-1 7. DISTRICT OF MUSKOKA HOUSING SUPPLY AND DEMAND 7.1 Permanent Housing 7.1.1 Potential Urban Housing Supply by Stage of Development Table 7-1 summarizes
Document under Separate Cover Refer to LPS State of Housing
 Document under Separate Cover Refer to LPS5-17 216 State of Housing Contents Housing in Halton 1 Overview The Housing Continuum Halton s Housing Model 3 216 Income & Housing Costs 216 Indicator of Housing
create your space Manulife Corporate Park 6711, 6733, 6755 Mississauga Road, Mississauga, ON
 is a three-building, Class A office complex offering over 400,000 SF of office space. Situated on a 13.5-acre site, and prominently located at the southeast corner of Hwy 401 and Erin Mills Parkway, this
Table of Contents. Title Page # Title Page # List of Tables ii 6.7 Rental Market - Townhome and Apart ment Rents
 RESIDENTIAL MONITORING REPORT 2013 Table of Contents Title Page # Title Page # List of Tables ii 6.7 Rental Market - Townhome and Apart ment Rents 21 List of Figures iii 7.0 Other Housing Demands and Trends
Statistics Canada Report April, 2018 City of Mississauga Planning and Building
 April, SECTION A - MAJOR CONSTRUCTION PROJECTS BTOTAL PERSCRIBED VALUE(s) : BTOTAL UNITS : BTOTAL AREA :,, NAME OF OWNER NAME OF BUILDER LOCATION UNIT NO LEGAL DESCRIPTION BUILDING TYPE TYPE OF WORK VALUE(s)
Statistics Canada Report July, 2015 City of Mississauga Planning and Building
 SECTION A - MAJOR CONSTRUCTION PROJECTS,, FDN ONTARIO INC / RAINBOW ELECTRONICS INC PINNACLE INTERNATIONAL (GRAND-PARK) LAND LTD ONTARIO INC / RAINBOW ELECTRONICS INC PINNACLE GRAND PARK PLAZA TWO LTD
Housing Characteristics Hot Facts
 Housing Characteristics Hot Facts Introduction This edition of Hot Facts examines Richmond s housing stock using the 2016 and 2011 Census and 2011 National Household Survey information which collects information
THE CORPORATION OF THE CITY OF MISSISSAUGA PLANNING ACT PROCESSING FEES AND CHARGES BY-LAW
 THE CORPORATION OF THE CITY OF MISSISSAUGA PLANNING ACT PROCESSING FEES AND CHARGES BY-LAW 160-17 WHEREAS by-laws establishing a tariff of fees for the processing of applications made in respect of planning
Building Report - Detail May, 2015
 NEW DWELLING UNITS MONTH SINGLE SEMI ROW DWELLING APARTMENT BASEMENT OTHER MAY 17 4 1@ 4 0 2@ 7 0 4 SUB TOTAL 17 4 18 0 0 4 YTD TOTAL 56 12 18 133 1 30 Page #: 6 ROW DWELLINGS BLDG NO UNIT NO VALUE ( $1,000
THE CITY OF VAUGHAN BY-LAW BY-LAW NUMBER
 THE CITY OF VAUGHAN BY-LAW BY-LAW NUMBER 089-2018 A By-Law to impose Area Specific Development Charges Huntington Road Sanitary Sewer (Trade Valley to Rutherford). Whereas subsection 2(1) of the Development
Housing Characteristics
 CHAPTER 7 HOUSING The housing component of the comprehensive plan is intended to provide an analysis of housing conditions and need. This component contains a discussion of McCall s 1990 housing inventory
2016 ANNUAL BUILDING REPORT
 OFFICE OF THE CITY ENGINEER P.O. Box 1539 944 James Street Woodstock, ON N4S 0A7 Telephone: 519-539-1291 Fax: 519-421-3250 2016 ANNUAL BUILDING REPORT activity remained very strong in 2016 with a total
Permit fees shall be calculated based on the formula given below, unless otherwise specified in this schedule:
 CLASSES OF PERMITS AND PERMIT FEES 1. CALCULATION OF PERMIT FEES FOR CONSTRUCTION: (6) Permit fees shall be calculated based on the formula given below, unless otherwise specified in this schedule: Permit
Building Report - Detail June, 2012
 NEW DWELLING UNITS MONTH SINGLE SEMI ROW DWELLING APARTMENT BASEMENT OTHER JUN 28 0 1@ 9 0 1 2 SUB TOTAL 28 0 9 0 1 2 YTD TOTAL 103 2 9 1,009 3 9 Page #: 6 ROW DWELLINGS BLDG NO UNIT NO VALUE ( $1,000
FOR SALE: $500, I-25 W Frontage Road, Santa Fe, NM 87505
 LAND FOR SALE - R1 DEVELOPMENT OPPORTUNITY SALE PRICE: $500,000 PRICE PER ACRE: $31,949 LOT SIZE: 15.65 Acres ZONING: R-1 I-25 Frontage Rd CROSS STREETS: Between Cerillos Rd & 599 PROPERTY OVERVIEW Great
HOUSING IN OUR COMMUNITIES: THE NUMBERS
 HOUSING IN OUR COMMUNITIES: THE NUMBERS 3/6/2014 South Shore Housing Action Coalition (SSHAC) Prepared by Nancy Green Public Health Services, Bridgewater, NS TABLE OF CONTENTS HOUSING IN OUR COMMUNITIES...
Parkland Dedication By-Law User Guide
 Parkland Dedication By-Law User Guide City of Kingston Recreation & Leisure Services August 2017 Table of Contents Purpose of By-Law... 3 How are parkland dedication requirements satisfied?... 3 What is
Las Vegas Valley Executive Summary
 ARROYO MARKET SQUARE Las Vegas Valley Executive Summary Retail Market 4th Quarter 2013 THE DISTRICT AT GREEN VALLEY RANCH January 23, 2014 Re: Commercial Real Estate Survey: 4th Quarter, 2013 Dear Reader,
Lee Blvd & Waverley St Winnipeg, Manitoba
 Lee Blvd & Waverley St Winnipeg, Manitoba Executive Summary A city that mixes business with pleasure, creativity with capability, and opportunity with productivity, Winnipeg has been known as Canada s
Kitchener-Cambridge-Waterloo and Guelph CMAs
 H o u s i n g M a r k e t I n f o r m a t i o n Housing Now Kitchener-Cambridge-Waterloo and Guelph CMAs C a n a d a M o r t g a g e a n d H o u s i n g C o r p o r a t i o n Date Released: Kitchener-Cambridge-Waterloo
Statistics Canada Report December, 2014 City of Mississauga Planning and Building
 December, SECTION A - MAJOR CONSTRUCTION PROJECTS BTOTAL PERSCRIBED VALUE(s) : BTOTAL UNITS :,8, BUILDING TYPE TYPE OF WORK VALUE(s) AREA(m) DESCRIPTION 7 8 77 8 HOOPP REALTY INC / TRIOVEST REALTY ADVISORS
HOUSING IN NORTH PERTH. Evaluating Affordability. Prepared by: Kristin Sainsbury, County of Perth Economic Development
 HOUSING IN NORTH PERTH June 2012 Evaluating Affordability Prepared by: Kristin Sainsbury, County of Perth Economic Development E X E C U T I V E S U M M A RY In November 2011, the North Perth Economic
Toronto - Financial Core
 Toronto - Financial Core 50 Bay Street Operating Costs: $9.41 Realty Taxes: $8.73 Hydro: Included Total: $18.14 1400 11,695 $26.50 April 1, 2009 Perimeter offices, boardroom, open area, kitchen, high end
Chapter 2: Existing Land Use
 Chapter 2: Existing Land Use Existing Land Use An inventory of existing land use describes existing patterns of development. The inventory provides useful information to calculate the ultimate population
4.0. Residential. 4.1 Context
 4. 0Residential 4.1 Context In 1986, around the time of Burnaby s last Official Community Plan, the City had a population of 145,000 living in 58,300 residential units. By 1996, there were 179,000 people
Suburb Due Diligence Checklist
 Suburb Due Diligence Checklist Suburb: Local Council: Suburb Attributes Levels Supply & Demand Housing Types The 6 Key Factors To A Suburb Area Demographic frastructure & Convenience Historical & Future
Produced by. State of the Market Quarterly Market Research Report
 Produced by 4 State of the Market Quarterly Market Research Report Cover Design by Sponsored by Table of Contents - UDI State of the Market Quarterly Publication ( ) 4 Population.. 7 1.1 Metro Vancouver
Statistics Canada Report May, 2012 City of Mississauga Planning and Building
 May, SECTION A - MAJOR CONSTRUCTION PROJECTS SUBTOTAL PERSCRIBED VALUE(s) :,6 9,9 BUILDING TYPE TYPE OF WORK VALUE(s) AREA(m) DESCRIPTION 6 9 9 6 666 68 68 698 SHELL CANADA LTD A. DICARLO GENERAL CONTRACTING
Our Focus: Your Future 2007 YEAR END HOUSING MONITORING AND SUBDIVISION STATUS REPORTS
 Town of Fort Erie Community & Development Services Our Focus: Your Future Prepared for Council-in-Committee Report No. CDS-011-08 Agenda Date February 4,2008 File No. 350204/350308 Subject 2007 YEAR END
NO DEVELOPMENT COST CHARGES BYLAW A BYLAW OF THE CITY OF VICTORIA
 The purpose of this Bylaw is NO. 06-65 DEVELOPMENT COST CHARGES BYLAW A BYLAW OF THE CITY OF VICTORIA to update the Development Cost Charges Bylaw by repealing and replacing the City s Development Cost
Table of Contents. UDI State of the Market Quarterly Publication (Q4 2017).. 4 Population Economic Indicators Economic Indicators...
.. 4 Population Economic Indicators Economic Indicators...") -217 Table of Contents UDI State of the Market Quarterly Publication ( 217).. 4 Population... 8 1.1 Metro Vancouver Population 27 Present 1.2 Metro Vancouver Population Growth Rate (%yoy) 1.3 British Columbia
-217 Table of Contents UDI State of the Market Quarterly Publication ( 217).. 4 Population... 8 1.1 Metro Vancouver Population 27 Present 1.2 Metro Vancouver Population Growth Rate (%yoy) 1.3 British Columbia
Economic Forecast of the Construction Sector
 Economic Forecast of the Construction Sector March 2018 Economic Forecast of the Construction Sector Page 2/8 Introduction This economic forecast of the construction sector focuses on 2018 and 2019. The
Building Report - Detail July, 2017
 NEW DWELLING UNITS MONTH SINGLE SEMI ROW DWELLING APARTMENT SECOND UNIT OTHER JUL 25 2 0 1@ 16 16 3 SUB TOTAL 25 2 0 16 16 3 YTD TOTAL 117 54 0 358 100 4 Page #: 6 ROW DWELLINGS OWNER LOCATION BLDG NO
Statistics Canada Report February, 2014 City of Mississauga Planning and Building
 Statistics Canada Report February, 4 SECTION A - MAJOR CONSTRUCTION PROJECTS SUBTOTAL PERSCRIBED VALUE(s) : SUBTOTAL DWELLING UNITS : SUBTOTAL AREA :,4,4 PERMIT NO NAME OF OWNER NAME OF BUILDER LOCATION
Future Land Use Categories & Nodes December 23, Future Land Use Categories
 Future Land Use Categories & Nodes December 23, 2015 A note regarding nodes: Descriptions for nodes are located in the general recommendations handout. Node locations are set in part by the Auburn Interactive
Condominiums and townhomes in high demand across Metro Vancouver
 News Release FOR IMMEDIATE RELEASE: Condominiums and townhomes in high demand across Metro Vancouver VANCOUVER, BC May 2, Demand for condominiums and townhomes continues to drive the Metro Vancouver* housing
2013 Fredericton Housing Outlook Seminar Canada Mortgage and Housing Corporation
 2013 Fredericton Housing Outlook Seminar Canada Mortgage and Housing Corporation CLAUDE GAUTREAU, Senior Market Analyst, CMHC Housing market intelligence you can count on 2012 Highlights Fredericton CA
Statistics Canada Report May, 2011 City of Mississauga Planning and Building
 SECTION A - MAJOR CONSTRUCTION PROJECTS,, FDN FDN FDN AMACON DEVELOPMENT (CITY CENTRE) CORP PINNACLE INTERNATIONAL (GRAND-PARK) LAND REGION OF PEEL DUFFERIN-PEEL CATHOLIC DISTRICT SCHOOL BOARD ORLANDO
Homestretch: Office Market Set to Finish Strong
 Research & Forecast Report RENO OFFICE Q3 2016 Homestretch: Office Market Set to Finish Strong >> Vacancy drops significantly the largest drop quarter over quarter in 2016 >> Rental rates are not increasing
Building Report - Detail October, 2013
 NEW DWELLING UNITS MONTH SINGLE SEMI ROW DWELLING APARTMENT BASEMENT OTHER OCT 14 0 3@ 6 1@ 8 4@ 5 1@ 12 1@ 17 0 0 1 SUB TOTAL 14 0 75 0 0 1 YTD TOTAL 114 4 192 875 1 4 Page #: 6 ROW DWELLINGS BLDG NO
City of Kingston. Building Permit Fees Review Industry Consultation Meeting. May 2, 2017
 City of Kingston Building Permit Fees Review Industry Consultation Meeting May 2, 2017 Introduction City retained Watson & Associates to undertake a comprehensive review of building permit fees that: Conforms
Vacancy Edges Lower in Fourth Quarter
 Research & Forecast Report FAIRFIELD OFFICE Q4 Vacancy Edges Lower in Fourth Quarter > > Office Inventory: 5,067,112 > > Current Vacancy: 14.2% > > Net Absorption: 63,610 The vacancy rate for office space
Building Report - Detail June, 2010
 NEW DWELLING UNITS MONTH SINGLE SEMI ROW DWELLING APARTMENT BASEMENT OTHER JUN 11 0 1@ 4 4@ 1@ 2 @ 0 1 0 SUB TOTAL 11 0 0 1 0 YTD TOTAL 1 10 249 0 2 1 Page #: 6 ROW DWELLINGS BLDG NO UNIT NO VALUE ( $1,000
POPULATION FORECASTS
 POPULATION FORECASTS Between 2015 and 2045, the total population is projected to increase by 373,125 residents to reach 2.2 million. Some areas will see major increases, while other areas will see very
OFFERING MEMORANDUM LONG TERM INDUSTRIAL, OFFICE AND FLEX PORTFOLIO SALE LEASEBACK
 LONG TERM INDUSTRIAL, OFFICE AND FLEX PORTFOLIO SALE LEASEBACK Main Buiding 2917 Latoria Street, Franklin Park STREAM Capital Partners, LLC License No.: 481.012052 Lic: 475.017525 Lic: 475.152062 TABLE
TOP-TIER REAL ESTATE REPORT 2014 YEAR END REPORT
 TOP-TIER REAL ESTATE REPORT 2014 YEAR END REPORT TOP-TIER REAL ESTATE REPORT TABLE OF CONTENTS INTRODUCTION 3 NATIONAL SUMMARY 4 VANCOUVER MARKET SUMMARY 7 Overall Market 11 Condominiums 13 Attached Homes
1699 HWY 29 N Cantonment, FL LDMU/MDR Land
 For Sale 1699 HWY 29 N Cantonment, FL 98.09 LDMU/MDR Land 98.09 AC +/- Fastest Growing Area of Pensacola 2 Miles to International Paper - $90M reinvestment in Plant 12 miles to Navy Federal - Pensacola
SHAPING NINTH LINE GROWTH MANAGEMENT ANALYSIS FINAL REPORT. HEMSON C o n s u l t i n g L t d.
 SHAPING NINTH LINE GROWTH MANAGEMENT ANALYSIS FINAL REPORT HEMSON C o n s u l t i n g L t d. May 16, 2017 EXECUTIVE SUMMARY Hemson Consulting Ltd. has been engaged to provide supporting analysis and documentation
Statistics Canada Report December, 2016 City of Mississauga Planning and Building
 December, SECTION A - MAJOR CONSTRUCTION PROJECTS BTOTAL PERSCRIBED VALUE(s) : BTOTAL UNITS : BTOTAL AREA :,,, BUILDING TYPE TYPE OF WORK VALUE(s) AREA(m) DESCRIPTION FTR FTR AMACON DEVELOPMENT (CITY CENTRE)
Office Market Continues to Improve
 Research & Forecast Report LAS VEGAS OFFICE Q3 2016 Office Market Continues to Improve > > Southern Nevada s office market is improving at a steady rate > > Net absorption has been positive in twelve of
REAL TY MISSISSAUGA, FOR LEASE OR SALE. *Sales Representative **Broker
 REAL TY FOR LEASE OR SALE *Sales Representative **Broker MISSISSAUGA, ONTY REAL A BOLD NEW REALITY 2455 Meadowpine Boulevard an outstanding new office opportunity in Meadowvale. Up to 115,000 sf of space,
2018 RESIDENTIAL CAPACITY AND VACANT LAND ANALYSIS. Martin County Board of County Commissioners
 2018 RESIDENTIAL CAPACITY AND VACANT LAND ANALYSIS Martin County Board of County Commissioners Approved February 13, 2018 INTRODUCTION Objective 4.1D of the Martin County Comprehensive Growth Management
CHAPTER 2: HOUSING. 2.1 Introduction. 2.2 Existing Housing Characteristics
 CHAPTER 2: HOUSING 2.1 Introduction Housing Characteristics are related to the social and economic conditions of a community s residents and are an important element of a comprehensive plan. Information
Urbanisation, Internationalisation and Access to Housing In Iskandar Malaysia
 Urbanisation, Internationalisation and Access to Housing In Iskandar Malaysia Sr. Dr. Rahah Ismail Department of Valuation and Property Services, Malaysia rahah@jpph.gov.my rahah_ismail@yahoo.co.uk Introduction
7 N Main Street. 822 South 1 st Street E
 For Sale Baker Commercial Properties and Land 7 N Main Street 8203 US Highway 12 908 E Montana 912 E Montana 822 South 1 st Street E Baker, Montana 7 N Main Street 21,560 SF development lot 908 E Montana
P o p u l a t i o n, L a n d U s e, a n d Z o n i n g
 P o p u l a t i o n, L a n d U s e, a n d Z o n i n g The Town of Upper Marlboro is located only 15 miles southeast of the District of Columbia, in the central portion of Prince George s County in the
SCHEDULE A. Classes of Permits and Fees (Reference By-law No ) 1.) Calculation of Permit Fees (All fees are exempted from HST)
 1.) Calculation of Permit Fees (All fees are exempted from HST)") Building By-law # 2013-79 Page- 18 SCHEDULE A Classes of Permits and Fees (Reference By-law No. 2013-79) 1.) Calculation of Permit Fees (All fees are exempted from HST) (a) Permit fees shall be calculated
Building By-law # 2013-79 Page- 18 SCHEDULE A Classes of Permits and Fees (Reference By-law No. 2013-79) 1.) Calculation of Permit Fees (All fees are exempted from HST) (a) Permit fees shall be calculated
5219 Upper Middle Road, Burlington
 5219 Upper Middle Road, Burlington Resident Information Meeting May 23 rd, 2017 7:00pm Corpus Christi Secondary School 5150 Upper Middle Road, Burlington City File No. 520-05/17 Team Members Subject Lands
LAND USE. General Plan Update Working Paper January In this Working Paper. Page
 General Plan Update Working Paper January 2008 In this Working Paper Page Introduction... LU-1 Distribution of Existing Land Uses... LU-1 Current General Plan Designations... LU-5 Westover Field Airport