San Francisco HOUSING INVENTORY
|
|
|
- Cathleen White
- 5 years ago
- Views:
Transcription


1 2008 San Francisco HOUSING INVENTORY San Francisco Planning Department April 2009
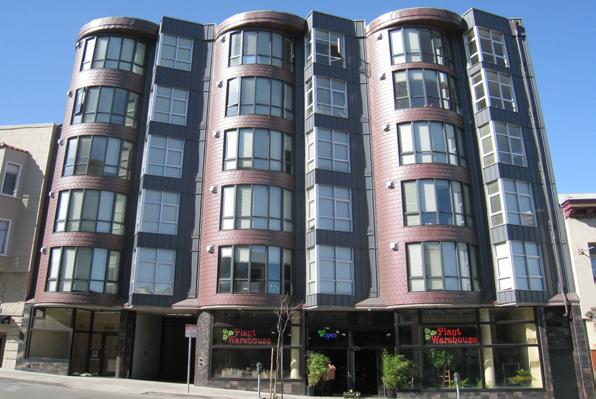
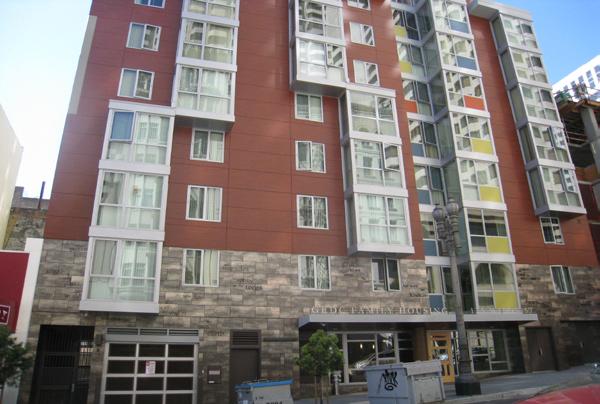
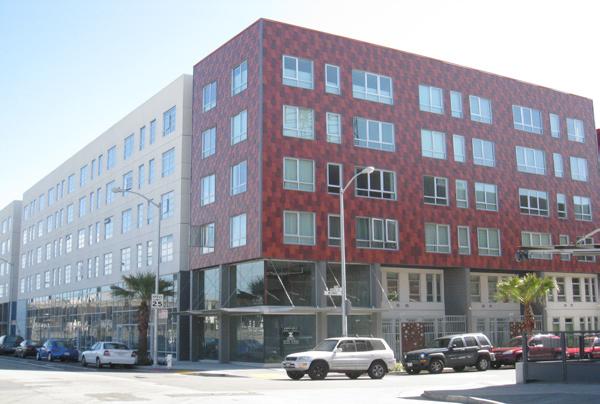
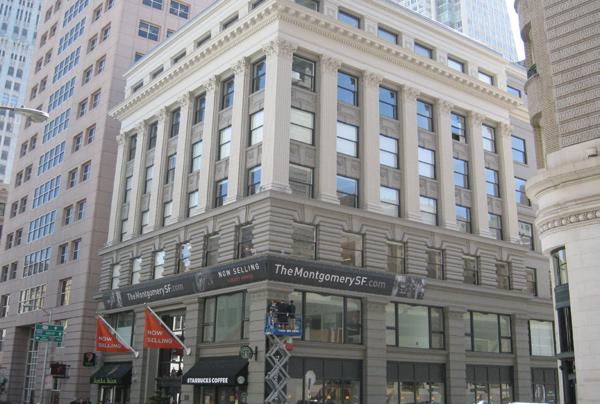
2 Seventh Street units including 170 off-site inclusionary affordable housing units; new construction Mason Street - 81 affordable family units; off-site inclusionary housing; new construction 3 The Montgomery, 74 Montgomery Street units, including 11 inclusionary affordable units; conversion of office building California Street - 40 units; new construction
3 San Francisco HOUSING INVENTORY 2008 San Francisco Planning Department April 2009
4
5 Table of Contents Introduction 1 Key Findings 2 Housing Production Process 2 Housing Stock 4 Housing Production Trends 5 Housing 5 Projects Approved and Under Review by Planning 5 Units Authorized for 9 Demolitions 10 Alterations and Conversions 10 Trends 12 Types of Buildings 12 by Zoning District 12 Condominiums Condominium Conversions 15 Residential Hotels 17 Affordable Housing 18 Standards and Definitions of Affordability 18 Affordable Housing 18 Inclusionary Housing 22 Affordability of Market Rate Housing 22 Affordable Housing Acquisition and Rehabilitation 23 Changes in Housing Stock by Planning District 24 Housing Stock by Planning District 26 Housing in the Bay Area 29 Appendices 31 Appendix A, List 1: Major Market Rate Housing Projects Completed, Appendix A, List 2: Major Affordable Housing Projects Completed, Appendix A, List 3: Major Housing Projects Entitled by Planning Department, Appendix A, List 4: Major Housing Projects Filed at Planning Department, Appendix A, List 5: Major Projects Authorized for by DBI, Appendix A, List 6: Major Affordable Projects in the Pipeline as of December 31, Appendix B. San Francisco Zoning Districts 43 Appendix C. Glossary 46
6 Tables Table 1. San Francisco Housing Stock by Building Type, Table 2. San Francisco Housing Trends, Table 3. Projects and Units Filed at Planning Department for Review by Year, Table 4. Units and Projects Authorized for by DBI by Building Type, Table 5. Units Demolished by Building Type, Table 6. Units Demolished by Zoning District, Table 7. Units Added or Eliminated Through Alteration Permits, Table 8. Units Lost Through Alterations and Demolitions, Table 9. Units Gained from by Building Type, Table 10. Units Gained from by Generalized Zoning, Table 11. Units Gained From by Zoning District, Table 12. Condominiums Recorded by DPW, Table 13. Condominiums Recorded by DPW by Building Type, Table 14. Condominium Conversions Recorded by DPW, Table 15. Condominium Conversions Recorded by DPW by Building Type, Table 16. Changes in Residential Hotel Stock, Table Rental Affordable Housing Guidelines 19 Table Homeownership Affordable Housing Guidelines 20 Table 19. Affordable Housing by Income Level, Table 20. Affordable by Housing Type, Table 21. Inclusionary Units, Table 22. Housing Price Trends, San Francisco Bay Area, Table 23. Units Rehabilitated, Table 24. Housing Units Completed and Demolished by Planning District, Table 25. San Francisco Housing Stock by Planning District, Table 26. Units Authorized for San Francisco and the Bay Area Counties, ii
7 Figures Figure 1. The Housing Production Process 3 Figure 2. San Francisco Housing Stock by Building Type, Figure Year Housing Production Trends, Figure 4. Units Authorized and Completed, Figure 5. Units Authorized and Gained from, Alterations, and Demolitions, Figure 6. Units Gained from by Building Type, Figure 7. of Affordable and Market Rate Units, Figure 8. Units Completed & Demolished by Planning District, Figure 9. San Francisco Housing Stock by Planning District, Figure 10. Bay Area Housing Trends, Maps Map 1. San Francisco Planning Districts 24 Map 2. San Francisco Bay Area Counties 29 iii
8
9 SAN FRANCISCO PLANNING DEPARTMENT Introduction The Housing Inventory is the Planning Department s annual survey of housing production trends in San Francisco. It has reported changes in the City s housing stock, including housing construction, demolition, and alterations, since This report is 39th in the series and presents housing production activity during By monitoring changes in San Francisco s housing stock, the Housing Inventory provides a basis for evaluating the housing production goals and policies of the Housing Element of the San Francisco General Plan. Housing policy implications that may arise from data in this report, however, are not discussed here. The Housing Inventory reports housing production, which begins when a building permit application for a project is filed with the City. The application is first reviewed by the Planning Department for compliance with the Planning Code, zoning, and other applicable policies. If the Planning Department approves the project, the Department of Building Inspection (DBI) reviews the application for compliance with the Building Code. If DBI approves the application, it issues a permit authorizing construction. The next step is for the project sponsor to begin construction on the project. Once construction has been completed and passed all required inspections, DBI issues a Certificate of Final Completion (CFC) for the project. The Housing Inventory also reports the annual net gain in housing units citywide and by planning district. Net gain is the number of newly constructed units with CFCs issued, adjusted for alterations which can add or subtract units and demolitions. Affordable housing, condominiums, and changes in the residential hotel stock are other areas of interest covered by the Housing Inventory. In addition, the report provides a regional perspective by examining housing construction activity and home prices for the nine-county Bay Area region. Finally, major projects completed, authorized, under review, or in the pipeline are listed in Appendix A. This report was prepared from information received from a number of different sources including the Department of Building Inspection, the Department of Public Works, and Planning Department records. The Mayor s Office of Housing, the San Francisco Housing Authority and the San Francisco Redevelopment Agency provided information on affordable housing projects. The Industry Research Board provided Bay Area building permit data. The California Association of Realtors and Zilpy.com provided housing costs. Project sponsors also contributed data. Copies of this report can be downloaded from the Publications & Reports link at the Planning Department s web site at A limited number of copies are available from the Planning Department, 1650 Mission Street, Suite 400, San Francisco, CA Copies may also be reviewed at the Government Information Center on the fifth floor of the San Francisco Main Library. Department Staff Contact for this report is Scott Dowdee, (415) , scott.dowdee@sfgov.org
10 San Francisco Housing Inventory 2008 Key Findings Housing Production housing production in 2008 totaled 3,340 units the highest level since This includes 3,019 units in new construction and 321 new units added through conversions of non-residential uses or expansion of existing structures. Some 77 units were lost through demolition, unit mergers, or removal of illegal units. This year saw a net addition of 3,263 units to the City s housing stock, a 27% increase over This is also 56% higher than the 10-year average and 107% higher than the 20-year average. As of 2008, there are 363,662 dwelling units in San Francisco: 31% are single-family homes, 33% are in buildings with two to nine units, and 36% are in buildings with 10 or more units. In 2008, 2,346 units were authorized for construction. This represents a 28% decrease from housing authorized for construction over the past five years continues to be overwhelmingly (83%) in buildings with 20 or more units. In 2008, this trend is repeated with 83% of authorized units slated for 20+ unit buildings. The Planning Department fully entitled 106 projects proposing a total of 2,418 units in In 2008, 1,897 new condominiums were recorded a 44% decrease over Some 81% of those units were in buildings with 20 units or more. Condominium conversions were at the highest level ever 845 or 8% more than converted in housing development in 2008 continued to be concentrated on the eastern side of the city, particularly in the South of Market planning district, where 46% of all units were built. The Downtown planning district ranked second, where 34% of new net units are located. Affordable Housing In 2008, 823 new affordable housing units were constructed almost 12% more than the previous year. This includes 379 inclusionary units and 59 secondary units added to existing structures. About 56% of the new affordable units were low-income rental units. The number of inclusionary affordable units (379) represents almost an 127% increase over Housing Production Process The Housing Inventory describes net changes in the housing stock and details units that have been certified complete, units that were authorized for construction, and units that are under review by the Planning Department. The housing production process begins with a project review by the Planning Department and ends with the issuance of a Certificate of Final Completion (CFC) by the Department of Building Inspection (DBI). Figure 1 outlines the main stages of the housing production process. 2
11 SAN FRANCISCO PLANNING DEPARTMENT FIGURE 1. The Housing Production Process Housing Units Under Planning/DBI Review Housing Units Authorized for Housing Units Under Housing Units Certified Complete Units Reviewed by Planning Department and DBI For most major projects, review by the Planning Department is the first step in the process. Proposals are reviewed by the Planning Department for compliance with the Planning Code, the General Plan, environmental requirements, and other regulations and policies. Generally, only major projects require special Planning Department approvals, such as a conditional use permit or variance. The number and type of projects undergoing Planning Department review are indicators of current building interest and production expectation within the next two to five years. Following Planning Department approval and entitlements, the Department of Building Inspection (DBI) reviews the project for compliance with the Building Code. Units Authorized for If DBI approves the project following its own review, it issues building permits authorizing construction. Projects with approved building permits generally start construction within 90 days from the date the permit is issued. Start of construction, however, may be delayed for up to a year. If the permit is not picked up or acted on within 90 days, the permit expires. The number of units authorized for construction is a key indicator of future housing construction. Units Certified Complete Projects are inspected by DBI at various stages throughout the construction process. However, inspectors only issue Certificates of Final Completions (CFCs) for projects that are deemed 100% complete. Units certified complete are an indicator of changes to the City s housing supply and include units gained or lost from new construction, alterations, and demolitions. For the purposes of this report, however, units that have received Temporary Certificates of Occupancy (TCOs) or Final Inspection Approval from the Department of Building Inspection are also considered and counted as completed units. Housing production is measured in terms of units rather than projects because the number of units in a project varies. Not all projects reviewed or approved are built. A project s building permit application may be withdrawn, disapproved, or revised; its permit may also expire if, for example, a project is not financed. Housing production is also affected by changes in market conditions and the economy. However, once building construction starts, a project is usually completed within one to two years, depending on the size of the project.

, moderate density buildings (two to nine units 33%), and higher")
12 San Francisco Housing Inventory 2008 Housing Stock The number of units in San Francisco s housing stock is derived by taking the total units from the 2000 Census and then adding the net unit changes following the April 2000 count. The net unit change is the sum of units completed from new construction and alterations minus units lost from demolition and alterations. Since the 2000 Census, there has been a net gain of 18,964 units. In 2008, 3,263 net units were added to the housing stock. This represents a 27% increase from the 2,567 units added in By the end of 2008, housing units in San Francisco totaled 363,662, with a near equal distribution between single family units (31%), moderate density buildings (two to nine units 33%), and higher density structures (10 or more units 36%). This distribution will likely change in the next few years as the trend has been moving towards increasingly larger buildings. As of December 2008, units in buildings with 20 or more units comprised 26% of the City s total housing. Of all units added since the 2000 Census, 80% have been in buildings with more than 20 units. Table 1 provides a profile of San Francisco s housing stock by building type from 2000 through Figure 2 illustrates San Francisco s housing stock by building type for TABLE 1. San Francisco Housing Stock by Building Type, Building Type Single Family 2 to 4 Units 5 to 9 Units 10 to 19 Units 20 + Units Total 2000 Census count, April ,125 80,168 38,940 34,996 79, ,698 Added April 2000 to , ,314 12,266 15, ,901 3,263 Total 111,263 81,470 39,849 36,444 94, ,662 Sources: U.S. Census Bureau; Planning Department FIGURE 2. San Francisco Housing Stock by Building Type, to 19 Units 10% 20+ Units 26% Single Family 31% 5 to 9 Units 11% 2 to 4 Units 22%
13 SAN FRANCISCO PLANNING DEPARTMENT Housing Production Trends Housing In 2008, housing production reached its highest level in 43 years. Both new construction unit totals (3,019) and net new unit totals (3,263) were at their highest levels since construction unit totals for ,019 also increased by 37% from construction in 2008 was 49% higher than the 10-year average of 2,024 units. Some 273 units were added to the housing stock. Conversions of non-residential uses resulted in 213 new units and 103 new units were added through expansion of existing structures. This represents a 39% drop from 2007 as a result of alterations. The number of demolitions in is at the lowest level since This number is 64% lower than the 81 units demolished in 2007 and 78% lower than the 10-year demolition average of 130 units. Forty-eight units were also lost due to mergers, removal of illegal units, or conversion of residential units to non-residential uses. In 2008, a net of 3,263 units were added to the housing stock, an increase of 27% over the previous year s total. This is also 56% above the 10-year average (2,085) and 107% above the 20-year average (1,577). These increases were the result of the large increase in new construction units coupled with a corresponding decrease in demolitions. In 2008, the Department of Building Inspection (DBI) authorized 2,346 units for construction according to building permit data. That number represents a 28% decrease from 2007 (3,281). Table 2, and Figures 3 and 4 show housing production trends over the past 20 years. The table and figures account for net new units gained which is the number of units newly constructed and adjusted for alterations, which can add or subtract units, and demolitions. Figure 5 illustrates fiveyear housing production activity from Some of the larger projects completed in 2008 include: 425 First Street (382 units); 300 Berry Street (268 units); 1160 Mission Street (198 units); 301 Main Street (239 units); 601 King Street (224 units); 355 Berry Street (194 units); 1 Polk Street (179 units); 730 Van Ness Avenue (130 units); 55 Page Street (127 units); 631 Folsom Street (120 units); 74 Montgomery Street (111 units); 990 Polk Street (110 affordable senior units); 230 Turk Street (109 affordable units); 810 Battery Street (87 affordable units); and 125 Mason Street (81 affordable units). A list of all market rate projects with 10 units or more completed in 2008 is included in Appendix A, List 1. Appendix A, List 2 includes all major affordable housing projects completed in Projects Approved and Under Review by Planning Depending on the type of project, there are various approvals by the Planning Department that a project needs to be fully entitled. Full entitlement of a project means that the project sponsor can proceed with the next step in the development process: securing approval and issuance of the building permit. In 2008, 145 projects with 7,761 units were filed at the Planning Department. This number is lower than the count in 2007 (10,281 units) by 25% but very close to the five-year average (7,806).
14 San Francisco Housing Inventory 2008 TABLE 2. San Francisco Housing Trends, Year Units Authorized for Units Completed from Units Demolished Units Gained or Lost from Alterations Net Change In Number of Units ,508 2, N/A 2, ,332 2, , , (60) 1, , (65) , (23) 1, (76) , , , ,360 1, , ,897 1, (1) 1, ,380 1, , ,478 2, , ,845 2, , ,318 1, , ,571 1, , ,332 1, , ,281 2, , ,346 3, ,263 Total 39,968 32,392 2,906 2,061 31,547 Source: Planning Department Note: Net Change equals Units Completed less Units Demolished plus Units Gained or (Lost) from Alterations.
15 SAN FRANCISCO PLANNING DEPARTMENT FIGURE Year Housing Production Trends, ,500 3,000 2,500 NUMBER OF UNITS 2,000 1,500 1, YEAR Units Completed from Units Demolished Net Change in Number of Units FIGURE 4. Units Authorized and Completed, ,000 5,000 NUMBER OF UNITS 4,000 3,000 2,000 1, YEAR Units Authorized for Units Completed from
16 San Francisco Housing Inventory 2008 FIGURE 5. Units Authorized and Gained from, Alterations, and Demolitions, ,000 5,000 Units Authorized for Units Completed from Units Demolished Units Gained or Lost from Alterations NUMBER OF UNITS 4,000 3,000 2,000 1, YEAR The Planning Department approved and fully entitled 106 projects in 2008; these projects propose a total of 2,418 units. As of December 31, 2008, the total number of units under review at the Planning Department was 18,357. Table 3 shows the number of housing projects filed with the Planning Department over the last five years. It is important to note that Planning may not approve all projects under review or may not approve projects at the unit levels requested. Project sponsors may also change or withdraw the project proposals. Some projects listed in Table 3 as undergoing Planning Department review may TABLE 3. Projects and Units Filed at Planning Department for Review by Year, Year Projects Filed Units Filed , , , , ,761 Total 1,279 39,090 Source: Planning Department 8
17 SAN FRANCISCO PLANNING DEPARTMENT have reached their approval stage, been authorized for construction, or may have been completed. Lastly, many of the housing projects under development by the San Francisco Redevelopment Agency (SFRA) do not show up in Table 3 because the SFRA is responsible for the review of those projects. Very large projects (over 100 units) filed in 2008 and under Planning Department review in 2008 include: Parkmerced redevelopment (5,675 net new units); 41 Tehama Street (350 units); 706 Mission Street (220 units); 1400 Mission Street (165 affordable units); and 950 Mason Street (160 units in a new Fairmont Hotel tower). Appendix A, List 3 records major projects (10 units or more) that received Planning entitlements in Appendix A, List 4 contains a list of the major projects (10 or more units) filed at the Planning Department for review during Units Authorized for In 2008, DBI authorized 2,346 units for construction, 28% lower than This is 26% lower than the 5-year average (3,170) but 17% higher than the 20-year average (1,998). Since units authorized for construction is one of the indicators of future housing construction, the number of new units completed is expected to increase at a somewhat lower rate over the next few years. There were 225 projects authorized in 2008 compared to 292 projects in In 2008, the average project size was 10.4 units, 29% lower than the average development size from (13.4). Table 4 summarizes the number of projects and units by building type authorized for construction by the Department of Building Inspection (DBI). Some of the major projects authorized for construction during the reporting year include: 1411 Market Street (719 units); 45 Lansing Street (224 units); 1 Hawthorne Street (135 units); 365 Fulton Street (120 units); and 5600 Third Street (116 affordable senior units). Appendix A, List 5 lists all projects with five or more units authorized for construction in TABLE 4. Units and Projects Authorized for by DBI by Building Type, Year Units by Building Type Single Family 2 Units 3 to 4 Units 5 to 19 Units 20+ Units Total Projects ,503 2, ,235 5, ,822 2, ,659 3, ,952 2, Total ,338 13,171 15,843 1,187 Source: Planning Department
18 San Francisco Housing Inventory 2008 Demolitions A total of 29 units were demolished in This is 64% lower than the 81 units demolished in 2007 and 79% lower than the five-year demolition average of 136 units. The 29 units demolished in 2008 represent the smallest number of demolitions since In 2008, 10 or 34% of the demolitions took place in the RH-2 district (up to two family units per lot). Table 5 shows the units demolished by building type from , and Table 6 shows the demolitions in 2008 by zoning district It should be noted that city policies require a minimum of one to one replacement of demolished housing.. The net gain of 273 units from alterations in 2008 is comprised of 321 units added and 48 units eliminated. Net units gained through alterations decreased 39% from the 451 units gained in The decrease is a result of a smaller number of units added and a larger number of units eliminated. Conversion projects completed in 2008 resulted in the addition of 213 new units. The conversions of office space or retail space into residential space were primarily in the Downtown or South of Market areas. Office conversions include 74 Montgomery Street (111 units); 1158 Sutter (14 units); and 843 Montgomery Street (13 units). Retail or other commercial conversions include 1 South Park Avenue (35 units); 420 Jessie Street (25 units); and 3401 Taraval Street (6 units). Alterations and Conversions The majority of building permits issued by DBI are for residential alterations. These alteration permits are for improvements within existing buildings or dwelling units. Some alterations expand the building envelope without increasing the number of units in the building. The Housing Inventory is primarily concerned with alterations which result in a net loss or gain in the total number of units in the housing stock. Dwelling units are gained by additions to existing housing structures, conversions to residential use, and legalization of illegal units. Dwelling units are lost by merging separate units into larger units, by conversion to commercial use, or by the removal of illegal units. Of the 48 units eliminated through alteration in 2008, 28 were lost due to mergers and another 19 to the removal of illegal units. This represents a 55% increase in units lost through alterations. Table 7 shows the number of units added or eliminated through alteration permits from 2004 to Table 8 profiles the type of alterations and demolitions that caused the loss of units during the same period. The net total of 77 units lost in 2008 due to demolition or alteration is 31% lower than that in 2007 when 112 total units were lost. 10
19 SAN FRANCISCO PLANNING DEPARTMENT TABLE 5. Units Demolished by Building Type, Year Buildings Units by Building Type Single 2 Units 3 to 4 Units 5+ Units Total Total Source: Planning Department TABLE 6. Units Demolished by Zoning District, 2008 Zoning District Buildings Single Family Units Multi-Family Total Percent of Total RH % RH % RM % NCT % C-3-R % C-3-G % Total % Source: Planning Department TABLE 7. Units Added or Eliminated Through Alteration Permits, Year Units Added Units Eliminated Net Change Total 1, ,223 Source: Planning Department 11
20 San Francisco Housing Inventory 2008 TABLE 8. Units Lost Through Alterations and Demolitions, Year Illegal Units Removed Units Merged into Larger Units Alterations Correction to official Records Units Converted Total Alterations Units Demolished Total Units Lost Total Source: Planning Department Trends construction is the primary engine behind changes to the housing stock. This section examines new construction units over the past five years by looking at the types of buildings and the zoning districts where they occurred. Types of Buildings of new housing units over the past five years continues to be overwhelmingly (85%) in buildings with 20 or more units. Increases were seen in new construction units completed in the 20 + Units category (41% more than that completed in 2007), the 10 to 19 Units grouping (66%), and the 3 to 9 Units grouping (40%). The share of new construction in high-density buildings (20 or more units) was 90% in 2008 up from five-year average of 85%. Single-family and two-unit buildings construction made up a small proportion (5%) of new construction in Table 9 shows new construction from 2004 through 2008 by building type. Figure 6 shows new construction by building type for by Zoning District Over a third of new units built in 2008 were in downtown zoning districts: Downtown Commercial districts ranked first with 21% of new units constructed and Downtown Residential districts ranked fourth with 13%. Residential- Commercial zoning districts, where 19% of new units were built, and Mission Bay, with 15%, ranked second and third, respectively. Traditional residential districts accounted for only 217 units or 7% of new housing production in Industrial districts saw a slightly higher number of new units built (225). Table 10 summarizes new construction in 2008 by generalized zoning districts. Table 11 lists the number of units constructed in various zoning districts in the City. A complete list of San Francisco s zoning districts is included in Appendix B. 12
21 SAN FRANCISCO PLANNING DEPARTMENT TABLE 9. Units Gained from by Building Type, Year Single Family 2 Units 3 to 9 Units 10 to 19 Units 20+ Units Total ,430 1, ,633 1, ,215 1, ,929 2, ,716 3,019 Total ,923 10,543 Share of, % 2% 5% 6% 85% 100% Source: Planning Department 10 to 19 Units 3.5% 3 to 9 Units 3.6% 20+ Units 90.0% 2 Units 1.4% Single Family 1.5% FIGURE 6. Units Gained from by Building Type, 2008 General Zoning Districts Units Percent of Total Residential, House and Mixed 217 7% Residential, Transit Oriented 3 0% Residential-Commercial % Downtown Residential % Neighborhood Commercial 241 8% Neighborhood Commercial Transit 146 5% South of Market Mixed Use 18 1% Eastern Neighborhoods Mixed Use 27 1% Commercial 112 4% Downtown Commercial % Industrial 225 7% Mission Bay Redevelopment % Total 3, % TABLE 10. Units Gained from by Generalized Zoning, 2008 Source: Planning Department 13
22 San Francisco Housing Inventory 2008 TABLE 11. Units Gained From by Zoning District, 2008 Zoning Districts Units Percent of Total RH % RH-1(D) 1 0% RH % RH % RM % RM % RTO-M 3 0% RC % DTR-RH % NC % NC % NCD-Outer Clement 9 0% NCD-Polk 40 1% NCT % NCT-Mission 14 0% RED 18 1% MUR 20 1% SPD 1 0% UMU 6 0% C % C-3-G % C-3-R 81 3% C-3-S 120 4% M % PDR-1-G 1 0% MB-RA % Total 3, % Source: Planning Department Condominiums All condominium developments, whether new construction or conversions, are recorded with the Department of Public Works s (DPW) Bureau of Street Use and Mapping (BSM). Annual condominium totals recorded by DPW do not directly correlate with annual units completed and counted as part of the Housing Inventory because DPW s records may be for projects not yet completed or from projects completed in a previous year. Large multi-unit developments also file for condominium subdivision when they are first built even though the units may initially be offered for rent. Condominium construction, like all real estate, is subject to market forces and varies from year to year. Condominium 2008 saw new condominium construction decrease by 44% (1,897) from the record number recorded in 2007 (3,395). The 1,897 new condominiums recorded represent a 44% decrease from Eighty-one percent of the condominiums recorded (1,545) were in buildings with 20 or more units, a 51% decrease over 2007 (3,136). Overall, the number of new condominiums in the 3-19 unit buildings (288) is a increase of 45% from the 2007 number. Table 12 shows construction of new condominiums recorded by DPW over the past 10 years and Table 13 shows new condominium construction by building type over the past five years.. 14
23 SAN FRANCISCO PLANNING DEPARTMENT TABLE 12. Condominiums Recorded by DPW, Year Units % Change from Previous Year % , % ,797 37% ,815 1% ,098 16% ,215-42% ,907 57% ,466 29% ,395 38% ,897-44% Total 18, Source: Department of Public Works, Bureau of Street Use and Mapping Condominium Conversions The San Francisco Subdivision Code regulates condominium conversions. Since 1983, conversions of units from rental to condominium have been limited to 200 units per year and to buildings with six or fewer units. More than 200 units may be recorded in a given year because units approved in a previous year may be recorded in a subsequent year. The 200-unit cap on conversions can also be bypassed for two-unit buildings with owners occupying both units. A record number of condominium conversions (845) were registered in 2008, the most since conversions have been allowed. This number is 8% higher than the number of conversions in 2007 and 79% higher than the ten year average of 473 units. Over 68% of units converted in 2008 occurred in two-unit buildings, representing an increase of 10% from Conversions of two-unit, owner-occupied buildings are not subject to the annual 200-unit limit on conversions. According to the Bureau of Street Use and Mapping, the upsurge in two-unit and three-unit building conversions can be attributed to an increase in staffing that cleared application backlogs. Eighty-nine percent of the condominium conversions in 2008 (756) were in buildings with two or three units, compared to 86% in Table 14 shows the number of conversions recorded by DPW from Table 15 shows condominium conversions by building type over the past five years. 15
24 San Francisco Housing Inventory 2008 TABLE 13. Condominiums Recorded by the DPW by Building Type, Year 2 Units 3 to 4 Units 5 to 9 Units 10 to 19 Units 20+ Units Total , ,677 1, ,945 2, ,136 3, ,545 1,897 Total ,208 10,880 Source: Department of Public Works, Bureau of Street Use and Mapping Year Units % Change from Previous Year % % % % % % % % % % Total 4, TABLE 14. Condominium Conversions Recorded by DPW, Source: Department of Public Works, Bureau of Street Use and Mapping TABLE 15. Condominium Conversions Recorded by DPW by Building Type, Building Type 2 Units 3 Units 4 Units 5 to 6 Units Total Total 1, ,965 Source: Department of Public Works, Bureau of Street Use and Mapping 16
25 SAN FRANCISCO PLANNING DEPARTMENT Residential Hotels Residential hotels in San Francisco are regulated by Administrative Code Chapter 41 the Residential Hotel Conversion and Demolition Ordinance (HCO), enacted in The Department of Building Inspection (DBI) Housing Inspection Services Division administers the HCO. This ordinance preserves the stock of residential hotels and regulates the conversion and demolition of residential hotel units. Table 16 reports the number of residential hotel buildings and units for both for-profit and nonprofit residential hotels from 2003 through Residential hotel numbers for 2008 are not available at this time, but will be reported in the 2009 report. As of 2007, 19,119 residential hotel rooms exist in San Francisco; 74% are residential rooms in for-profit residential hotels and 26% are residential in non-profit hotels. Residential rooms in non-profit residential hotels have been increasing in each of the past five years. In the last five years, non-profit residential hotel rooms increased 40%. In for-profit residential hotels, both residential rooms and tourist rooms in 2007 decreased 1% from The number of for-profit residential hotel buildings continued decreasing, as in the four previous years, from 422 buildings in 2006 to 419 buildings in TABLE 16. Changes in Residential Hotel Stock, Year For Profit Residential Hotels Non-Profit Residential Hotels Total Buildings Resid. Rooms Tourist Rooms Buildings Resid. Rooms Buildings Resid. Rooms ,878 3, , , ,767 3, , , ,106 3, , , ,385 3, , , ,233 3, , ,119 Source: Department of Building Inspection 17
26 San Francisco Housing Inventory 2008 Affordable Housing Standards and Definitions of Affordability Affordable housing by definition is housing that is either rented or owned at prices affordable to households with low to moderate incomes. The United States Department of Housing and Urban Development (HUD) determines the thresholds by household size for these incomes for the San Francisco HUD Metro FMR Area (HMFA). The HMFA includes San Francisco, Marin, and San Mateo counties. The standard definitions for housing affordability by income level are as follows: Extremely low income: Units affordable to households with incomes at or below 30% of the HUD median income for the San Francisco HFMA; Very low income: Units affordable to households with incomes at or below 50% of the HUD median income for the San Francisco HFMA; Lower income: Units affordable to households with incomes at or below 60% of the HUD median income for the San Francisco HFMA; Low income: Units affordable to households with incomes at or below 80% of the HUD median income for the San Francisco HFMA, Moderate income: Units affordable to households with incomes at or below 120% of the HUD median income for the San Francisco HFMA; and Market rate: Units at prevailing prices without any affordability requirements. Market rate units gen-erally exceed rental or ownership affordability levels, although some small market rate units may be priced at levels that are affordable to moderate income households. Housing affordability for units is calculated as follows: Affordable rental unit: A unit for which rent equals 30% of the income of a household with an income at or below 80% of the HUD median income for the San Francisco HFMA, utilities included; Affordable ownership unit: A unit for which the mortgage payments, PMI (principal mortgage insurance), property taxes, homeowners dues, and insurance equal 33% of the gross monthly income of a household earning between 80% and 120% of the San Francisco HFMA median income, assuming a 10% down payment and a 30-year 8% fixed rate loan. Inclusionary Affordable Housing Program units: These units are rental units for households earning up to 60% of the HUD median income, or ownership units for first-time home buyer households with incomes up to 100% of the HUD median income. Tables 17 and 18 show the incomes and prices for affordable rental and ownership units based on 2008 HUD income limits. Affordable Housing Some 823 affordable units were completed in 2008, representing 27% of the new housing constructed in Of these, 379 are inclusionary affordable units and 59 are secondary units. Very low-income units represent 30% of the new affordable units that were constructed in 2008; affordable homeownership units made up 44%. Figure 7 shows affordable housing construction compared to market-rate housing construction from 2004 to 2008 by year and as a total. 18
27 SAN FRANCISCO PLANNING DEPARTMENT TABLE Rental Affordable Housing Guidelines Income Levels Household Size Average Unit Size Maximum Annual Income Monthly Rent Extremely Low Income (30% of HUD Median Income) 1 Studio $19,800 $ Bedroom $22,650 $ Bedroom $25,450 $ Bedroom $28,300 $ Bedroom $30,550 $ Bedroom $32,800 $820 Very Low Income (50% of HUD Median Income) 1 Studio $33,000 $ Bedroom $37,750 $ Bedroom $42,450 $1, Bedroom $47,150 $1, Bedroom $50,950 $1, Bedroom $54,700 $1,368 Lower Income (60% of HUD Median Income) 1 Studio $39,600 $ Bedroom $45,250 $1, Bedroom $50,900 $1, Bedroom $56,600 $1, Bedroom $61,100 $1, Bedroom $65,650 $1,641 Low Income (80% of HUD Median Income) 1 Studio $52,800 $1, Bedroom $60,350 $1, Bedroom $67,900 $1, Bedroom $75,450 $1, Bedroom $81,500 $2, Bedroom $87,500 $2,188 Source: U.S. Department of Housing and Urban Development (HUD) Note: Incomes are based on the 2008 Area Median Income (AMI) limits for the San Francisco HUD Metro FMR Area (HMFA). Rents are calculated based on 30% of gross monthly income. (FMR = Fair Market Rents) 19
28 San Francisco Housing Inventory 2008 TABLE Homeownership Affordable Housing Guidelines Income Levels Household Size Average Unit Size Maximum Annual Income Monthly Housing Expense Maximum Purchase Price Low Income (80% of HUD Median Income) 1 Studio $52,800 $1,452 $133, Bedroom $60,350 $1,660 $154, Bedroom $67,900 $1,867 $176, Bedroom $75,450 $2,075 $197, Bedroom $81,500 $2,241 $213,070 Median Income (100% of HUD Median Income) 1 Studio $66,000 $1,815 $181, Bedroom $75,450 $2,075 $209, Bedroom $84,850 $2,333 $237, Bedroom $94,300 $2,593 $265, Bedroom $101,850 $2,801 $286,397 Moderate Income (120% of HUD Median Income) 1 Studio $79,200 $2,178 $228, Bedroom $90,550 $2,490 $263, Bedroom $101,800 $2,800 $298,109 Source: U.S. Department of Housing and Urban Development (HUD) 4 3 Bedroom $113,150 $3,112 $335, Bedroom $122,200 $3,361 $359,723 Note: Incomes are based on the 2008 Area Median Income (AMI) limits for the San Francisco HUD Metro FMR Area (HMFA). Monthly housing expenses are calculated based on 33% of gross monthly income. (FMR = Fair Market Rents). Maximum purchase price is the affordable price from San Francisco s Inclusionary Housing Program and incorporates monthly fees and taxes into sales price. Table 19 shows the production of affordable housing by levels of affordability and Table 20 shows new affordable housing by type. These numbers do not include affordable units that result from acquiring and rehabilitating residential buildings by nonprofit housing organizations. Those units are covered later in the report. The number of new affordable units (832) is 12% more than in 2007 (735). Almost 37% of the new affordable units in 2008 were units for homeowner units (302). A total of 59 secondary units were added to existing residential buildings in Secondary, or granny units, are typically affordable to households with moderate incomes. Major affordable housing projects completed in 2008 include: 990 Polk Street (110 units); 230 Turk Street (109 units); 810 Battery Street (81 units); 125 Mason Street (81 units); 4601 Third Street (50 units) and 684 Ellis Street (25 units). All major (10 or more units) new affordable housing projects completed in 2008 are detailed in Appendix A, List 2. On-site affordable inclusionary units are listed under major market rate projects. See next section for more details. Affordable housing projects under construction, or in pre-construction or preliminary planning with either the Mayor s Office of Housing or the San Francisco Redevelopment Agency are presented in Appendix A, List 6. 20
29 SAN FRANCISCO PLANNING DEPARTMENT FIGURE 7. of Affordable and Market Rate Units, NUMBER OF UNITS 12,000 10,000 8,000 6,000 4,000 Affordable Units Market Rate Units 2, Total TABLE 19. Affordable Housing by Income Level, Year Extremely Low (30% AMI) Very Low (50% AMI) Lower (60% AMI) Low (80% AMI) Moderate (120% AMI) Total Affordable Units Total Units % of All Units ,780 31% ,872 43% ,675 29% ,197 33% ,019 27% Total 714 1, ,396 10,543 32% Source: Mayor s Office of Housing, Redevelopment Agency, Planning Department TABLE 20. Affordable Housing by Housing Type, Year Family Senior Individual/ SRO Homeowner Percent of Total 28% 19% 16% 37% 100% Total Source: Planning Department, Mayor s Office of Housing, Redevelopment Agency Notes: Family units include projects with a majority of two or more bedroom units. Individual / SRO includes projects with a majority of studios or one bedroom, residential care facilities, shelters, and transitional housing. 21
30 San Francisco Housing Inventory 2008 Inclusionary Housing In 1992, the Planning Commission adopted guidelines for applying the City s Inclusionary Affordable Housing Policy. The policy required housing projects with 10 or more units that seek a conditional use (CU) permit or planned unit development (PUD) to set a minimum of 10% of their units as affordable units. In 2002, the Board of Supervisors expanded these guidelines by requiring all projects with 10 or more units set aside 10% of their units as affordable units to renters earning 60% or less of the area median income (AMI). In condominium developments, the ownership units would be available to people earning up to 100% of the AMI. If a housing project required a conditional use permit, then 12% of the units would need to be made available at the same levels of affordability. In August 2006, the inclusionary requirements were increased to 15% if units were constructed on-site, and to 20% if constructed off-site and is applicable to projects of five units or more. These increases will only apply to new projects. All projects in the pipeline at the time these changes were adopted will be exempt from these increases, except for projects that have not yet received Planning Department approval and those that will receive a rezoning that increases the amount of housing that can be constructed on their property. Table 21 shows inclusionary units completed from In 2008, more inclusionary units (379) were built than in any year since the inclusionary requirements have been in effect. The 379 units built in 2008 represent a 127% increase over the 2007 number (167) and a 81% increase over the five-year average of 209 units. Some 146 units resulted from the on-site requirement. Two projects completed in 2008 were the result of off-site compliance and accounted for 251 of the 2008 inclusionary units: 601 King Street (170 of 224 units satisfied the off-site inclusionary requirement for 301 Main Street) and 125 Mason Street (all 81 units for 301 Mission Street project that is expected to be completed in Appendix A, List 1 provides a complete list of projects with 10 or more units constructed in 2008 with details of new construction with inclusionary units for those projects that have them. Year Units Total 1,045 Affordability of Market Rate Housing TABLE 21. Inclusionary Units, Sources: Planning Department, Mayor s Office of Housing The San Francisco Bay Area remains one of the nation s most expensive housing markets, with housing prices remaining high. In 2008, rental prices in San Francisco decreased 3.6%: $2,650 from $2,750 for a 2-bedroom apartment. This decrease was the first drop in rents since In 2008, the median price for a two-bedroom home in San Francisco was about $603,570 or 9.1% less than 2007 ($664,060) the third year of decreasing prices. Overall median sales price in 2008, including all unit sizes and condominiums, was about $766,985. The 2008 median price for a two-bedroom home in the Bay Area region was set at $387,500, 34% lower than the price in A San Francisco family of three earning 120% of the HUD median income (the household in need of affordable housing with the most income available to spend on purchasing a home $298,109 from Table 18) would fall short by 22
31 SAN FRANCISCO PLANNING DEPARTMENT TABLE 22. Housing Price Trends, San Francisco Bay Area, Rental For Sale Year 2 Bedroom Apartment 2 Bedroom House San Francisco Bay Area San Francisco Bay Area 1999 $2,500 N/A $369,230 $284, $2,750 N/A $468,330 $355, $2,331 N/A $467,500 $384, $2,089 N/A $523,300 $427, $2,023 N/A $607,140 $455, $2,068 N/A $670,450 $536, $2,229 N/A $737,500 $621, $2,400 N/A $680,970 $635, $2,750 N/A $664,060 $642, $2,650 $1,810 $603,570 $387,500 Sources: Zilpy.com for Apartment rental prices. California Association of Realtors for home sale prices; Notes: Zilpy.com s Bay Area rents do not include Santa Clara County; the California Association of Realtors Bay Area data do not include Napa and Sonoma Counties. about $305,460 of being able to purchase a median-priced two-bedroom home ($603,570). A three-person household earning 80% of the median income (the household in need of affordable housing with the most income available to spend on rent) could pay a maximum rent of $1,697 or 64% of the median rent ($2,650), about the same level as in 2007 (63% of median rent). Table 22 gives rental and sales prices for 1999 through The high cost of housing prevents families earning less than the median income from being able to purchase or rent a median-priced home in San Francisco. Affordable Housing Acquisition and Rehabilitation Acquisition and rehabilitation involves nonprofit housing organizations purchasing existing residential buildings in order to rehabilitate units for low- and very low-income persons. Table 23 shows units that have been rehabilitated through funding by the Mayors Office of Housing (MOH) and the San Francisco Redevelopment Agency (SFRA). Often it is more economical to purchase and rehabilitate existing run-down units than to build new units. While many of these units are residential hotel (single room occupancy or SRO) units, acquisition and rehabilitation also includes homes for residential care providers, apartments for families, and conversions of commercial or industrial buildings for homeless persons and families. The Housing Inventory reports units in such projects as adding to the housing stock only when new units are created as a result of the rehabilitation. For example, if a 50-unit SRO is rehabilitated and at the end, the SRO still has 50 units, then for the purposes of this report, these units would not be counted as adding to the housing stock. In 2008, 270 existing units were rehabilitated. The major rehabilitation projects for 2008 were the Banneker Homes at Fulton Street (108 units) and Sixth Street (88 of 224 units). 23
San Francisco Planning Department April 2008
 2007 San Francisco HOUSING INVENTORY San Francisco Planning Department April 2008 1 2 3 4 1 Buena Vista Terrace, 1250 Haight St. - 40 affordable units, senior housing; conversion of historic church 2 Crescent
2017 SAN FRANCISCO HOUSING INVENTORY
 2017 SAN FRANCISCO HOUSING INVENTORY 2018 San Francisco Planning Department 1650 Mission Street, Suite 400 San Francisco, CA 94103-3114 www.sfplanning.org Front Cover: 588 Mission Bay Boulevard North (Five
2016 SAN FRANCISCO HOUSING INVENTORY
 2016 SAN FRANCISCO HOUSING INVENTORY 2017 San Francisco Planning Department 1650 Mission Street, Suite 400 San Francisco, CA 94103-3114 www.sfplanning.org Front Cover: 1239 Turk St (Willie B. Kennedy Apartments),
New condominium recorded 1,977 are down from 2013 (a decrease of 24%), however, condominium conversions are up by 98% to 730 units.
, however, condominium conversions are up by 98% to 730 units.") DATE: April 9, 2015 TO: Members, Planning Commission FROM: John Rahaim, Director of Planning RE: Transmittal of 2014 Housing Inventory STAFF CONTACT: Audrey Desmuke, 415.575.9136 The Planning Department
DATE: April 9, 2015 TO: Members, Planning Commission FROM: John Rahaim, Director of Planning RE: Transmittal of 2014 Housing Inventory STAFF CONTACT: Audrey Desmuke, 415.575.9136 The Planning Department
Affordable Housing Bonus Program. Public Questions and Answers - #2. January 26, 2016
 Affordable Housing Bonus Program Public Questions and Answers - #2 January 26, 2016 The following questions about the Affordable Housing Bonus Program were submitted by the public to the Planning Department
Briefing Book. State of the Housing Market Update San Francisco Mayor s Office of Housing and Community Development
 Briefing Book State of the Housing Market Update 2014 San Francisco Mayor s Office of Housing and Community Development August 2014 Table of Contents Project Background 2 Household Income Background and
Memo. DATE: 20 September 2018 City Planning Commission John Rahaim, Director of Planning RE: HOUSING BALANCE REPORT No. 7 1 July June 2018
 DATE: 20 September 2018 TO: FROM: City Planning Commission John Rahaim, Director of Planning RE: HOUSING BALANCE REPORT No. 7 1 July 2008 30 June 2018 STAFF CONTACT: Teresa Ojeda, 415 558 6251 SUMMARY
Executive Summary ADU Tracking Report
 Executive Summary ADU Tracking Report HEARING DATE: JUNE 7, 2018 Date: May 31, 2018 Project Name: Accessory Dwelling Unit ADU) Tracking and Monitoring Report Staff Contact: Marcelle Boudreaux - 415) 575-9140
Briefing Book. State of the Housing Market Update San Francisco Mayor s Office of Housing and Community Development.
 Briefing Book State of the Housing Market Update 2014 San Francisco Mayor s Office of Housing and Community Development August 2014 Table of Contents Project Background 2 Household Income Background and
Mission 2015 Interim Controls
 Mission 2015 Interim Controls July 9, 2015 This image cannot currently be displayed. This image cannot currently be displayed. This image cannot currently be displayed. Presentation Overview I. Background
P r e s e n t a t i o n B y : L i b b y S e i f e l, S e i f e l C o n s u l t i n g
 P r e s e n t a t i o n B y : L i b b y S e i f e l, S e i f e l C o n s u l t i n g ` Household Income Categories, 2014 AMI is often grouped into categories by federal programs in order to meet income
Guidelines for Implementation of the Inclusionary Housing Ordinance of the City of San José, Chapter 5.08 of the San José Municipal Code.
 Guidelines for Implementation of the Inclusionary Housing Ordinance of the City of San José, Chapter 5.08 of the San José Municipal Code. Interim Version Approved June 30, 2016 Revised July 16, 2018 This
DATE: TO: FROM: Honorable John Rahaim HOUSING RE: SUMMARY. series and. Balance. units and. 21,570 net. calculations. Memo
 DATE: TO: FROM: RE: May 2018 Honorable Members of the San Francisco Board of Supervisors John Rahaim Director of Planning HOUSING BALANCE REPORT No. 6 1 January 2008 31 December 2017 SUMMARY This report
/'J (Peter Noonan, Rent Stabilization and Housing, Manager)VW
VW") CITY COUNCIL CONSENT CALENDAR OCTOBER 17, 2016 SUBJECT: INITIATED BY: INFORMATION ON PROPERTIES REMOVED FROM THE RENTAL MARKET USING THE ELLIS ACT, SUBSEQUENT NEW CONSTRUCTION, AND AFFORDABLE HOUSING HUMAN
CITY COUNCIL CONSENT CALENDAR OCTOBER 17, 2016 SUBJECT: INITIATED BY: INFORMATION ON PROPERTIES REMOVED FROM THE RENTAL MARKET USING THE ELLIS ACT, SUBSEQUENT NEW CONSTRUCTION, AND AFFORDABLE HOUSING HUMAN
City and County of San Francisco
 City and County of San Francisco Controller s Office FY 2009-10 Development Impact Fee Report January 24, 2011 City and County of San Francisco FY 2009-10 Development Impact Fee Report January 24, 2011
DRAFT Inclusionary Housing Survey. Prepared for San Francisco s Technical Advisory Committee
 DRAFT Inclusionary Housing Survey Prepared for San Francisco s Technical Advisory Committee San Jose Background San Jose s current inclusionary housing ordinance passed in January of 2012 and replaced
GUIDELINES FOR COMPLYING WITH THE CITY OF SAN JOSE INCLUSIONARY HOUSING POLICY IN REDEVELOPMENT PROJECT AREAS. July 1, 2007
 GUIDELINES FOR COMPLYING WITH THE CITY OF SAN JOSE INCLUSIONARY HOUSING POLICY IN REDEVELOPMENT PROJECT AREAS July 1, 2007 Index I. Introduction II. Inclusionary Housing Compliance Plan III. Income Limits
SAN FRANCISCO CITYWIDE DEVELOPMENT IMPACT FEE REGISTER (Updated as of December 1, 2015, rates effective as of January 1, 2016)
") Introduction SAN FRANCISCO CITYWIDE DEVELOPMENT IMPACT FEE REGISTER (Updated as of December 1, 2015, rates effective as of January 1, 2016) An impact fee is a fee that is imposed by a local government
Introduction SAN FRANCISCO CITYWIDE DEVELOPMENT IMPACT FEE REGISTER (Updated as of December 1, 2015, rates effective as of January 1, 2016) An impact fee is a fee that is imposed by a local government
Draft for Public Review. The Market and Octavia Neighborhood Plan
 Draft for Public Review The Market and Octavia Neighborhood Plan San Francisco Planning Department As Part of the Better Neighborhoods Program December 00 . Housing People OBJECTIVE.1 MIXED-USE RESIDENTIAL
Below Market Rate (BMR) Housing Mitigation Program Procedural Manual
 Housing Mitigation Program Procedural Manual") Below Market Rate (BMR) Housing Mitigation Program Procedural Manual Amended and Adopted by City Council May 5, 2015 Resolution No. 15-037 City of Cupertino Housing Division Department of Community Development
Below Market Rate (BMR) Housing Mitigation Program Procedural Manual Amended and Adopted by City Council May 5, 2015 Resolution No. 15-037 City of Cupertino Housing Division Department of Community Development
SUPPLEMENTAL SUBJECT: WINCHESTER AND SANTANA ROW/VALLEY FAIR URBAN VILLAGE PLAN BASELINE AFFORDABLE HOUSING STOCK ANALYSIS
 COUNCIL AGENDA: 6/27/17 ITEM: 10.5 CITY OF fir is San Jose CAPITAL OF SILICON VALLEY TO: HONORABLE MAYOR AND CITY COUNCIL SUBJECT: SEE BELOW Memorandum FROM: Jacky Morales-Ferrand DATE: Approved Date (f,
2. 22,531 (net new housing) + 11,140 (units that have received approvals) = 33,671
 + 11,140 (units that have received approvals) = 33,671") March 31, 2016 San Francisco Planning Commission 1650 Mission Street, #400 San Francisco, CA 94103 Dear President Fong and Members of the Commission, We are pleased to publish the third installment of
March 31, 2016 San Francisco Planning Commission 1650 Mission Street, #400 San Francisco, CA 94103 Dear President Fong and Members of the Commission, We are pleased to publish the third installment of
4. HOUSEHOLD INCOME AND AFFORDABILITY
 4. HOUSEHOLD INCOME AND AFFORDABILITY The analysis of the Household and Affordability section relied primarily on data from the State Department of Housing and Community Development (HCD), California Tax
SUPPLEMENTAL MEMORANDUM AMENDMENTS TO SECTION 415 INCLUSIONARY AFFORDABLE HOUSING PROGRAM
 SUPPLEMENTAL MEMORANDUM AMENDMENTS TO SECTION INCLUSIONARY AFFORDABLE HOUSING PROGRAM ADOPTION HEARING DATE: APRIL, 0 Project Name: Inclusionary Affordable Housing Program (Sec ) Case Number: 0-000PCA
SAN FRANCISCO PLANNING DEPARTMENT
 QP SAN FRANCISCO PLANNING DEPARTMENT Addendum 2 to Environmental Impact Report 1650 Mission St. Francisco, CA 94103-2479 Reception: Addendum Date: July 14, 2015 415.558.6378 Case No.: 2015-005350ENV 415.558.6409
SAN FRANCISCO CITYWIDE DEVELOPMENT IMPACT FEE REGISTER (Updated as of December 1, 2017, rates effective as of January 1, 2018)
") SAN FRANCISCO CITYWIDE DEVELOPMENT IMPACT FEE REGISTER (Updated as of December 1, 2017, rates effective as of January 1, 2018) Introduction An impact fee is a fee that is imposed by a local government
SAN FRANCISCO CITYWIDE DEVELOPMENT IMPACT FEE REGISTER (Updated as of December 1, 2017, rates effective as of January 1, 2018) Introduction An impact fee is a fee that is imposed by a local government
The State of Renters & Their Homes
 FORECLOSURES FINDING #14 The number of pre-foreclosure notices issued to one- to four-unit properties and condominiums in 2015 fell from the previous year. Pre-foreclosure notices for one- to four-unit
Inclusionary Affordable Housing Program
 Inclusionary Affordable Housing Program Informational Summary of Legislative Amendments effective August 26, 2017 (BF No. 161351) effective November 26, 2017 (BF No. 170834) REVISED October 25, 2017 LEGISLATIVE
City Center Market-Rate Housing Study
 City Center Market-Rate Housing Study OVERVIEW The City of Bellingham, with the assistance of students from Western Washington University, conducted a study of market-rate rental housing during April and
Mayor s Office of Housing and Community Development. Housing Preferences and Lottery Procedures Manual
 Mayor s Office of Housing and Community Development Housing Preferences and Lottery Procedures Manual REVISED March 9, 2018 Table of Contents 1. Introduction... 4 2. Definitions... 5 3. Certificates of
Subsidized. Housing. in 2017
 FACT BRIEF DECEMBER 2018 NYCHA s State Outsized of Role In New Housing York New City s York s Poorest Households Subsidized Housing Public housing is a critical part of the affordable housing landscape
Contents Introductory Section... 3 Financial Section... 6 Required Information... 9
 1 Contents Introductory Section... 3 Housing Successor - Mayor s Office of Housing and Community Development... 3 Housing Assets Transferred... 4 Financial Section... 6 Housing Asset Fund Balance Sheet...
PORTLAND DEVELOPMENT COMMISSION Portland, Oregon. River District Housing Implementation Strategy Annual Report
 PORTLAND DEVELOPMENT COMMISSION Portland, Oregon DATE: August 8, 2001 TO: FROM: The Commissioners Donald F. Mazziotti REPORT NO.: 01-73 SUBJECT: River District Housing Implementation Strategy Annual Report
A RESOLUTION OF THE COUNCIL OF THE CITY OF SAN JOSE AMENDING RESOLUTION NO
 RESOLUTION NO. A RESOLUTION OF THE COUNCIL OF THE CITY OF SAN JOSE AMENDING RESOLUTION NO. 77218 TO ADD AN EXEMPTION TO CHANGE THE THRESHOLD SIZE OF RENTAL PROJECTS AND TO AMEND THE PROVISIONS EXEMPTING
Document under Separate Cover Refer to LPS State of Housing
 Document under Separate Cover Refer to LPS5-17 216 State of Housing Contents Housing in Halton 1 Overview The Housing Continuum Halton s Housing Model 3 216 Income & Housing Costs 216 Indicator of Housing
The Impact of Market Rate Vacancy Increases Eight-Year Report
 The Impact of Market Rate Vacancy Increases Eight-Year Report January 1, 1999 - December 31, 2006 Santa Monica Rent Control Board March 2007 TABLE OF CONTENTS Summary 1 Units Rented at Market Rates Rates
Low and Moderate Income Housing Asset Fund Housing Successor Report Year ended June 30, 2014
 Mayor s Office of Housing and Community Development City and County of San Francisco Low and Moderate Income Housing Asset Fund Housing Successor Report Year ended June 30, 2014 1 Contents Introductory
COMMUNITY DEVELOPMENT DEPARTMENT
 AGENDA ITEM I-1 COMMUNITY DEVELOPMENT DEPARTMENT Council Meeting Date: June 3, 2014 Agenda Item #: I-1 INFORMATIONAL ITEM: Update on Multi-City Affordable Housing Nexus Study and Impact Fee Feasibility
Metro Atlanta Rental Housing Affordability: How Hot is Too Hot for Low-Income Workers?
 Metro Atlanta Rental Housing Affordability: How Hot is Too Hot for Low-Income Workers? July 2018 Atlanta Regional Commission For more information, contact: cdegiulio@atlantaregional.org Metro Atlanta s
Wi n t e r 2008 In this issue: Housing Market Update Affordable Housing Update Special Focus: Tracking Subsidized Housing
 www.neighborhoodinfodc.org District of Columbia Housing Monitor Wi n t e r 2008 In this issue: Housing Market Update Affordable Housing Update Special Focus: Tracking Subsidized Housing In the Spotlight
PERCENTAGE OF INCLUSIONARY UNITS AND AFFORDABILITY LEVELS:
 Designation Priorities for the Inclusionary Affordable Housing Program ( Program ) Section 307 of the Planning Code mandates the Zoning Administrator to issue and adopt such rules, regulations and interpretations
Memo to the Planning Commission HEARING DATE: JUNE 21, 2012 Continued from the May 17, 2012 Hearing
 Memo to the Planning Commission HEARING DATE: JUNE 21, 2012 Continued from the May 17, 2012 Hearing Date: May 10, 2012 Case No.: 2011.0206T Project Name: Planning Code Amendments: Student Housing Initiated
APARTMENT MARKET SUPPLY AND DEMAND DATA. Prepared March 2012 PAGE 1
 APARTMENT MARKET SUPPLY AND DEMAND DATA Prepared March 2012 PAGE 1 SUMMARY OF MARKET CONDITIONS Inventory According to the 4 th quarter 2011 MFP report on the San Jose metro apartment market, the inventory
Execut. 10 May Memo. Date: Project Name: Staff Contact: On April Planning. Balance Period is. balances, Housing Balanc. Cumulative Housing
 Execut ive Summary Housing Balanc ce Report HEARING DATE: 24 May 2018 Date: Project Name: 10 May 2018 Housing Balance Report No. 6 Case Number: 2018004047CWP03 Staff Contact: Recommendation: Teresa Ojeda,
City of Oakland Programs, Policies and New Initiatives for Housing
 City of Oakland Programs, Policies and New Initiatives for Housing Land Use Policies General Plan Update In the late 1990s, the City revised its general plan land use and transportation element. This included
CHAPTER 7 HOUSING. Housing May
 CHAPTER 7 HOUSING Housing has been identified as an important or very important topic to be discussed within the master plan by 74% of the survey respondents in Shelburne and 65% of the respondents in
AB 346 (DALY) REDEVELOPMENT: HOUSING SUCCESSOR: LOW AND MODERATE INCOME HOUSING ASSET FUND JOINT AUTHOR ASSEMBLYMEMBER BROUGH
 REDEVELOPMENT: HOUSING SUCCESSOR: LOW AND MODERATE INCOME HOUSING ASSET FUND JOINT AUTHOR ASSEMBLYMEMBER BROUGH") AB 346 (DALY) REDEVELOPMENT: HOUSING SUCCESSOR: LOW AND MODERATE INCOME HOUSING ASSET FUND JOINT AUTHOR ASSEMBLYMEMBER BROUGH IN BRIEF Assembly Bill 346 would authorize a housing successor to use funds
AB 346 (DALY) REDEVELOPMENT: HOUSING SUCCESSOR: LOW AND MODERATE INCOME HOUSING ASSET FUND JOINT AUTHOR ASSEMBLYMEMBER BROUGH IN BRIEF Assembly Bill 346 would authorize a housing successor to use funds
The Impact of The Ellis Act. January 1, 2005 December 31, 2005
 The Impact of The Ellis Act January 1, 2005 December 31, 2005 Santa Monica Rent Control Board March 2006 IMPACT OF THE ELLIS ACT The Ellis Act allows landlords to go out of the rental business, evict tenants,
Chapter 14C - INCLUSIONARY HOUSING [42]
![Chapter 14C - INCLUSIONARY HOUSING [42]](/thumbs/82/86417632.jpg "Chapter 14C - INCLUSIONARY HOUSING [42]") Chapter 14C - INCLUSIONARY HOUSING [42] (42) Editor's note Ord. No. 91-49, 1, adopted Oct. 23, 1991, repealed former Ch. 14C which pertained to similar provisions and derived from Ord. No. 82-49, 1, adopted
Chapter 14C - INCLUSIONARY HOUSING [42] (42) Editor's note Ord. No. 91-49, 1, adopted Oct. 23, 1991, repealed former Ch. 14C which pertained to similar provisions and derived from Ord. No. 82-49, 1, adopted
ANNUAL ELEMENT PROGRESS REPORT Housing Element Implementation (CCR Title )
") page 1 of 18 Table A Annual Building Activity Report Summary - New Construction Very Low-, Low-, and Mixed-Income Multifamily Projects 1 2 Project Identifier (may be APN No., project name or address) Unit
page 1 of 18 Table A Annual Building Activity Report Summary - New Construction Very Low-, Low-, and Mixed-Income Multifamily Projects 1 2 Project Identifier (may be APN No., project name or address) Unit
Background and Purpose
 DRAFT MEMORANDUM To: From: Perkins+Will James Musbach and Rebecca Benassini Subject: Affordable Housing Need and Supply, Downtown Concord Specific Plan, addendum to Existing Conditions Report; EPS #121118
The Impact of Market Rate Vacancy Increases One Year Report
 The Impact of Market Rate Vacancy Increases One Year Report January 1, 1999- December 31, 1999 Santa Monica Rent Control Board TABLE OF CONTENTS Summary 2 Market Rent Increases 1/1/99-12/31/99 4 Rates
DRAFT REPORT. Residential Impact Fee Nexus Study. June prepared for: Foster City VWA. Vernazza Wolfe Associates, Inc.
 DRAFT REPORT Residential Impact Fee Nexus Study June 2015 prepared for: Foster City VWA Vernazza Wolfe Associates, Inc. Table of Contents I. EXECUTIVE SUMMARY... 4 Introduction... 4 Background... 4 Report
Auditing Affordable Housing Programs October 3, 2018
 Auditing Affordable Housing Programs October 3, 2018 Snehi Basnet and Amanda Sobrepeña CITY & COUNTY OF SAN FRANCISCO Office of the Controller Audits Division 1 2 Outline The housing crisis San Francisco
San Francisco Bay Area to Marin, San Francisco, and San Mateo Counties Housing and Economic Outlook
 San Francisco Bay Area to 2020 Marin, San Francisco, and San Mateo Counties Housing and Economic Outlook Economic Forecast Summary 2017 Presented by Pacific Union International, Inc. and John Burns Real
Contents. Figures: Tables:
 Housing Appendix Contents Grosvenor-Strathmore Housing Conditions... 2 Townhomes and Condominiums... 3 Cost Burdening... 3 Multifamily Homes... 3 Affordable al Housing Methodology... 6 Affordable Housing
Research Report #6-07 LEGISLATIVE REVENUE OFFICE.
 HOUSING AFFORDABILITY IN OREGON Research Report #6-07 LEGISLATIVE REVENUE OFFICE http://www.leg.state.or.us/comm/lro/home.htm STATE OF OREGON LEGISLATIVE REVENUE OFFICE H-197 State Capitol Building Salem,
THE CITY OF ALHAMBRA HOUSING SUCCESSOR AGENCY
 Distribution Date: 12/22/2015 HOUSING SUCCESSOR ANNUAL REPORT REGARDING THE LOW AND MODERATE INCOME HOUSING ASSET FUND FOR FISCAL YEAR 2014-2015 PURSUANT TO CALIFORNIA HEALTH AND SAFETY CODE SECTION 34176.1(f)
The Impact of Market Rate Vacancy Increases Eleven-Year Report
 The Impact of Market Rate Vacancy Increases Eleven-Year Report January 1, 1999 - December 31, 2009 Santa Monica Rent Control Board April 2010 TABLE OF CONTENTS Summary 1 Vacancy Decontrol s Effects on
San Francisco Bay Area to Napa County Housing and Economic Outlook
 San Francisco Bay Area to 019 Napa County Housing and Economic Outlook Bay Area Economic Forecast Summary Presented by Pacific Union International, Inc. and John Burns Real Estate Consulting, LLC On Nov.
San Francisco Bay Area to Santa Clara and San Benito Counties Housing and Economic Outlook
 San Francisco Bay Area to 2020 Santa Clara and San Benito Counties Housing and Economic Outlook Economic Forecast Summary 2017 Presented by Pacific Union International, Inc. and John Burns Real Estate
AFFORDABLE HOUSING SECTIONS 5.1 GENERAL GOALS
 AFFORDABLE HOUSING 5 5.1 GENERAL GOALS The section is hereby adopted consistent with the goals adopted by the Town Board as follows: A. At any point in time, a minimum of 12½% of the housing units in Davidson
2012QUARTER 1. San Francisco PIPELINE REPORT
 2012QUARTER 1 San Francisco PIPELINE REPORT San Francisco Planning Department April 2012 Cover Photo: Former Transbay Terminal Site. source: Aksel Olsen San Francisco PIPELINE REPORT Errata: Document was
Executive Summary. Condominium Conversion Subdivision HEARING DATE: APRIL 6, 2017 CONSENT CALENDAR
 Executive Summary Condominium Conversion Subdivision HEARING DATE: APRIL 6, 2017 CONSENT CALENDAR Date: March 30, 2017 Case No.: 2017-001263CND Project Address: 1900-1908 LEAVENWORTH STREET Zoning: RM-2
Agenda Re~oort PUBLIC HEARING: PROPOSED ADJUSTMENTS TO INCLUSIONARY IN-LIEU FEE RATES
 Agenda Re~oort August 27, 2018 TO: Honorable Mayor and City Council THROUGH: Finance Committee FROM: SUBJECT: William K. Huang, Director of Housing and Career Services PUBLIC HEARING: PROPOSED ADJUSTMENTS
PROFILE. Cultivate Hopkins Comprehensive Plan 8/21/18 DRAFT. Cultivate Hopkins Appendix B3: Housing 1
 APPENDIX B3: PROFILE HOUSING Cultivate Hopkins Comprehensive Plan 8/21/18 DRAFT Cultivate Hopkins Appendix B3: Housing 1 Existing Conditions This section describes existing conditions in housing stock
Housing Indicators in Tennessee
 Housing Indicators in l l l By Joe Speer, Megan Morgeson, Bettie Teasley and Ceagus Clark Introduction Looking at general housing-related indicators across the state of, substantial variation emerges but
SUBJECT Housing Policy Ordinances establishing Minimum Lease Terms and Relocation Assistance
 REPORT To the Honorable Mayor and City Council From the City Manager March 26, 2018 SUBJECT Housing Policy Ordinances establishing Minimum Lease Terms and Relocation Assistance RECOMMENDATION 1. Hold a
Impact Fee Nexus & Economic Feasibility Study
 Impact Fee Nexus & Economic Feasibility Study Stakeholder Working Group November 12, 2015 Urban Economics Oakland Impact Fee Stakeholder Working Group November 12, 2015 INTRODUCTIONS 1 Agenda Introductions
San Francisco Bay Area to Sonoma County Housing and Economic Outlook
 San Francisco Bay Area to 2020 Sonoma County Housing and Economic Outlook Economic Forecast Summary 2017 Presented by Pacific Union International, Inc. and John Burns Real Estate Consulting, LLC On Nov.
City of Exeter Housing Element
 E. Identification and Analysis of Developments At-Risk of Conversion Pursuant to Government Code Section 65583, subdivision (a), paragraph (8), this sub-section should include an analysis of existing assisted
I. Statement of Policy And Summary of Affordable Home Ownership Rules and Regulations
 AFFORDABLE HOME OWNERSHIP PROGRAM RULES AND PROCEDURES CITY OF WHITE PLAINS Initially Adopted June 7, 2004 Revision dated July 25 2005, adopted August 1, 2005 Revised incomes and housing costs effective
City of Exeter Housing Element
 D. Housing Stock Characteristics Government Code Section 65583(a) requires an analysis and documentation of household characteristics, including level of payment compared to ability to pay, housing characteristics,
Affordable Housing Bonus Program
 Affordable Housing Bonus Program Program Overview February 2016 www.sf-planning.org/ahbp Kearstin Dischinger, Menaka Mohan, & Paolo Ikezoe San Francisco Planning Department Welcome! Meeting Format Presentation
APPENDIX B DESCRIPTION OF MAJOR FEDERAL LOW-INCOME HOUSING ASSISTANCE PROGRAMS
 820 First Street NE, Suite 510 Washington, DC 20002 Tel: 202-408-1080 Fax: 202-408-1056 center@cbpp.org www.cbpp.org February 24, 2009 APPENDIX B DESCRIPTION OF MAJOR FEDERAL LOW-INCOME HOUSING ASSISTANCE
SJC Comprehensive Plan Update Housing Needs Assessment Briefing. County Council: October 16, 2017 Planning Commission: October 20, 2017
 SJC Comprehensive Plan Update 2036 Housing Needs Assessment Briefing County Council: October 16, 2017 Planning Commission: October 20, 2017 Overview GMA Housing Element Background Demographics Employment
COMMERCIAL CONDOMINIUM CONVERSION APPLICATION MATERIALS. Table of Contents
 Phone: (415) 554-5827 Fax: (415) 554-5324 www.sfdpw.org Subdivision.Mapping@sfdpw.org Edwin M. Lee, Mayor Mohammed Nuru, Director Bruce R. Storrs, City and County Surveyor Office of the City and County
Executive Summary Planning Code Text Change INFORMATIONAL HEARING DATE: MAY 17, 2018
 Executive Summary Planning Code Text Change INFORMATIONAL HEARING DATE: MAY 17, 2018 Date: May 10, 2018 Project Name: Mayor s Process Improvements Ordinance Case Number: 2018-004633PCA, [Board File No.
TOWN OF LOS GATOS BELOW MARKET PRICE HOUSING PROGRAM GUIDELINES
 TOWN OF LOS GATOS BELOW MARKET PRICE HOUSING PROGRAM GUIDELINES I. Purpose A. Purpose: The overall purpose of the Below Market Price (BMP) Housing Program is to provide the Town of Los Gatos with a supply
Housing Assistance in Minnesota
 Minnesota Housing Finance Agency Housing in Minnesota Program Assessment October 1, 2002 - September 30, 2003 Minnesota Housing Finance Agency Housing In Minnesota l\1innesotl Housing Finaru:e Agency Contentsoontents...
State of Rhode Island. National Housing Trust Fund Allocation Plan. July 29, 2016
 HTF Program: Method of Distribution State of Rhode Island National Housing Trust Fund Allocation Plan July 29, 2016 The Housing Trust Fund (HTF) is a new affordable housing production program that will
2015 New York City. Housing Security Profile and Affordable Housing Gap Analysis
 2015 New York City Housing Security Profile and Affordable Housing Gap Analysis 1 Contents: Housing Insecurity in New York City 3 A City of Renters. 6 Where the Housing Insecure Population Lives 16 Housing
Provide a diversity of housing types, responsive to household size, income and age needs.
 8 The City of San Mateo is a highly desirable place to live. Housing costs are comparably high. For these reasons, there is a strong and growing need for affordable housing. This chapter addresses the
ORDINANCE NO
 AN ORDINANCE OF THE CITY OF SANTA CRUZ AMENDING TITLE 24 OF THE MUNICIPAL CODE, THE ZONING ORDINANCE, PART 1, INCLUSIONARY HOUSING REQUIREMENTS INCLUDING SECTIONS 24.16.010 THROUGH 24.16.060 BE IT ORDAINED
Housing Study & Needs Assessment
 Housing Study & Needs Assessment Phase II Public Engagement Presentation #2 Winston-Salem, North Carolina January 25, 2018 MEETING OVERVIEW Welcome & Introductions Purpose & Goals Community Discussions
Rental Assistance Demonstration (RAD) 101: Public Housing Conversions. US Department of Housing & Urban Development May 14, 2018
 101: Public Housing Conversions. US Department of Housing & Urban Development May 14, 2018") Rental Assistance Demonstration (RAD) 101: Public Housing Conversions US Department of Housing & Urban Development May 14, 2018 BACKGROUND 2 Why RAD for Public Housing? RAD was designed to help address
Rental Assistance Demonstration (RAD) 101: Public Housing Conversions US Department of Housing & Urban Development May 14, 2018 BACKGROUND 2 Why RAD for Public Housing? RAD was designed to help address
Affordable Housing Gap and Economic Analysis
 Affordable Housing Gap and Economic Analysis Town of Chapel Hill April 4, 2017 DAVID PAUL ROSEN & ASSOCIATES D EVELOPMENT, FINANCE AND POLICY ADVISORS Town of Chapel Hill PREPARED FOR: Town of Chapel Hill
CITY OF SAN MATEO BELOW MARKET RATE (INCLUSIONARY) PROGRAM
 PROGRAM") CITY OF SAN MATEO BELOW MARKET RATE (INCLUSIONARY) PROGRAM I. INTENT It is the intent of this resolution to establish requirements for the designation of housing units for moderate, lower, and very low
CITY OF SAN MATEO BELOW MARKET RATE (INCLUSIONARY) PROGRAM I. INTENT It is the intent of this resolution to establish requirements for the designation of housing units for moderate, lower, and very low
Memo to the Planning Commission HEARING DATE: APRIL 21, 2016 Closed Session
 Memo to the Planning Commission HEARING DATE: APRIL 21, 2016 Closed Session BACKGROUND Date: April 21, 2016 Subject: IMPLEMENTATION OF THE STATE DENSITY BONUS LAW Staff Contact: Kate Conner (415) 575-6914
City of Piedmont COUNCIL AGENDA REPORT
 City of Piedmont COUNCIL AGENDA REPORT DATE: May 15, 2017 TO: FROM: SUBJECT: Mayor and Council Paul Benoit, City Administrator Consideration of the 2 nd Reading of Ordinance 731 N.S. - Amending Division
Executive Summary. Condominium Conversion Subdivision HEARING DATE: APRIL 10, 2014 CONSENT CALENDAR
 Executive Summary Condominium Conversion Subdivision HEARING DATE: APRIL 10, 2014 CONSENT CALENDAR Date: April 3, 2014 Case No.: 2014.0119Q Project Address: 1440 1450 FILBERT STREET Zoning: RM 3 (Residential
SUBJECT: APPROVAL OF DOWNTOWN HIGH-RISE RESIDENTIAL INCENTIVE FOR POST STREET TOWER AT 171 POST STREET
 COUNCIL AGENDA FILE ITEM 11/6/18 CITY OF San Jose CAPITAL OF SILICON VALLEY TO: HONORABLE MAYOR AND CITY COUNCIL SUBJECT: SEE BELOW Memorandum FROM: Kim Walesh DATE: October 9, 2018 Approved Date /o/f//a
EAST SOMA AREA PLAN MONITORING REPORT
 EAST SOMA AREA PLAN MONITORING REPORT FEBRUARY 2012 East SoMa Area Plan Monitoring Report 2006-2010 Table of Contents 1. INTRODUCTION 01 2. COMMERCIAL SPACE AND EMPLOYMENT 03 2.1 Commercial Space Inventory
January 1, 2013 thru March 31, 2013 Performance Report
 Grantee: Pinellas County, FL Grant: B-11-UN-12-0015 January 1, 2013 thru March 31, 2013 Performance Report 1 Grant Number: B-11-UN-12-0015 Grantee Name: Pinellas County, FL Grant Amount: $4,697,519.00
Barbara County Housing Element. Table 5.1 Proposed Draft Housing Element Goals, Policies and Programs
 Table 5.1 Proposed Draft Housing Element Goals, Policies and Programs Goal 1: Enhance the Diversity, Quantity, and Quality of the Housing Supply Policy 1.1: Promote new housing opportunities adjacent to
CENTRAL SOMA PLAN & IMPLEMENTATION STRATEGY
 http://centralsoma.sfplanning.org CENTRAL SOMA LAN & IMLEMENTATION STRATEGY lanning Commission - August, 0 LUSK ST CLARENCE L STANFORD ST ZOE ST RITCH ST MORRIS ST OAK GROVE ST MERLIN ST LAU LAU ST MABINI
ORDINANCE NO. AN ORDINANCE OF THE CITY COUNCIL OF THE CITY OF DALY CITY REPEALING AND REPLACING CHAPTER RE: INCLUSIONARY HOUSING
 ORDINANCE NO. AN ORDINANCE OF THE CITY COUNCIL OF THE CITY OF DALY CITY REPEALING AND REPLACING CHAPTER 17.47 RE: INCLUSIONARY HOUSING The City Council of the City of Daly City, DOES ORDAIN as follows:
American Canyon Affordable Housing Nexus Study: Background Report
 American Canyon Affordable Housing Nexus Study: Background Report City of American Canyon Final Report DAVID PAUL ROSE N & ASSOCI ATES D E V E L O P M E N T, F I N A N C E A N D P O L I C Y A D V I S O
PACE LAW SCHOOL LAND USE & SUSTAINABLE DEVELOPMENT CONFERENCE
 PACE LAW SCHOOL LAND USE & SUSTAINABLE DEVELOPMENT CONFERENCE PRESENTED BY: WILLIAM V. CUDDY, JR. December 8, 2016 Multifamily Residential Development as a driver and consequence of economic development
I. Amount Received Pursuant to Section : This section provides a total amount of funds received pursuant to Section (b)(3)(A).
(3)(A).") HOUSING SUCCESSOR ANNUAL REPORT REGARDING THE LOW AND MODERATE INCOME HOUSING ASSET FUND FOR FISCAL YEAR 2016-2017 PURSUANT TO CALIFORNIA HEALTH AND SAFETY CODE SECTION 34176.1(f) FOR THE TUSTIN HOUSING
HOUSING SUCCESSOR ANNUAL REPORT REGARDING THE LOW AND MODERATE INCOME HOUSING ASSET FUND FOR FISCAL YEAR 2016-2017 PURSUANT TO CALIFORNIA HEALTH AND SAFETY CODE SECTION 34176.1(f) FOR THE TUSTIN HOUSING