ARLA Survey of Residential Investment Landlords
|
|
|
- Heather Richards
- 5 years ago
- Views:
Transcription
1 Prepared for The Association of Residential Letting Agents & the ARLA Group of Buy to Let Mortgage Lenders ARLA Survey of Residential Investment Landlords March 2010 Prepared by O M Carey Jones 5 Henshaw Lane, Yeadon, Leeds, LS19 7RW March 2010
2 CONTENTS Page 1. INTRODUCTION & BACKGROUND 4 2. METHODOLOGY 5 3. RESULTS Where do you live? (Q.1) How old are you? (Q.2) For how many years have you been a residential landlord? (Q.3) How many rented residential properties do you currently have in your portfolio? (Q.4) In the next 12 months, do you expect to sell some or all of your let residential properties? (Q.5 & Q.6) How long ago did you first become a (Buy to Let) residential investment landlord? (Q.7) Where are your residential investment properties located? (Q.8) What proportion of the residential properties you have bought are of each type? (Q.9) What proportion of the residential properties you have bought fall into each age band? (Q.10) From original acquisition time, what do you expect to be the average life expectancy of your property investment, before you liquidate your property assets? (Q.11) Have you seen an increase in the number of tenants struggling to meet rental payments in the last 6 months? (Q.12) Are you aware/have you seen an increase of tenants haggling over rents in the last 6 months (Q.13) Do you feel renting is more popular than a year ago? (Q.14) Do you feel people s attitudes to renting have changed? (Q.15) 25 Page 2
3 3.15 Why did you first decide to invest in residential property? (Q.16) Do you think investor landlords are being tempted back to the market because of the minimal interest on savings rates? (Q.17) What percentage of a buy to let property do you normally borrow from a lender? (Q.18) What is the approximate overall loan to value ratio of your rented residential portfolio? (Q.19) Do you expect/anticipate that you will acquire further (Buy to Let) investment properties during the next 12 months? (Q.20) What proportion of the properties you let are Houses in Multiple Occupation? (Q.21) 33 Page 3
4 1. INTRODUCTION & BACKGROUND ARLA surveys residential landlords though its Internet website with a view to canvassing the opinions of residential landlords on a number of topics. During the first quarter of 2010, ARLA conducted the first survey of the year. This survey ran during the month of March Page 4
5 2. METHODOLOGY The method by which the data for this research was collected was through visitors to ARLA s web site taking the opportunity presented to complete an on-line questionnaire which included 21 questions. The questions were devised by ARLA and included questions which were aimed at getting a better understanding of the profile of residential landlords and also at understanding better their views and opinions. During the period when the questionnaire was available for completion, a total of 382 people went through the process of answering some or all of the questions. These responses were analysed by the software running the survey and tables of data were produced on which this report is based. Page 5
 More than four out of ten respondents to the survey (41%) were from the South East of England (including London) with more than one in seven (15%) being from London itself.")
6 3. RESULTS The following sections detail the results of the ARLA survey of residential landlords conducted during the first quarter of Where do you live? (Q.1) More than four out of ten respondents to the survey (41%) were from the South East of England (including London) with more than one in seven (15%) being from London itself. The Midlands (13%) was the region producing the next highest proportion of respondents. One in twenty five respondents (4%) were living outside the UK when they completed the questionnaire. Location Percent of Respondents (%) Sep 09 Dec 09 Mar 10 Central London Rest of London (within M25) South East (outside M25) South West Midlands North West North East Scotland Wales Northern Ireland Outside UK Base: All answering (352) (305) (353) Compared with the last quarter of 2009, the main differences in the composition of the sample by geographic region are that there were noticeably fewer respondents from Central London (4% compared with 6% three months ago), the South West (10% compared with 13%), the Midlands (13% compared with 15%) and the North East 8% compared with 10%) and noticeably more from the Rest of Page 6
7 London (12% compared with 10% three months ago), the South East (26% compared with 23%), the North West (12% compared with 9%) and Wales (4% compared with 2%). However, these changes are within the normal variations for this question. Page 7
 were aged between 36 and 45. Only around one in twelve respondents (8%) were aged 35 or under with one in twenty (5%) being over 65 on this occasion.")
8 3.2 How old are you? (Q.2) More than a third of respondents (34%) were aged between 46 and 55 with almost three out of ten (29%) being aged between 56 and 65. Almost another quarter (24%) were aged between 36 and 45. Only around one in twelve respondents (8%) were aged 35 or under with one in twenty (5%) being over 65 on this occasion. Age Group Percent of Respondents (%) Sep 09 Dec 09 Mar 10 Under to to to to Over Average (years) Base: All answering (365) (311) (361) Analysis of the results from this question reveals that the average age of respondents to the survey was 49.9 years, a figure which is down from 50.4 years three months ago but this change merely reverses the change seen then. Page 8
 Little more than one in twenty respondents (6%) had been residential landlords for one year or less whilst more than a quarter (27%) had been residential landlords for more than 10 years.")
9 3.3 For how many years have you been a residential landlord? (Q.3) Little more than one in twenty respondents (6%) had been residential landlords for one year or less whilst more than a quarter (27%) had been residential landlords for more than 10 years. However, the majority, amounting to two thirds (67%) had been residential landlords for between 2 and 10 years. Years as a Percent of Respondents (%) Landlord Sep 09 Dec 09 Mar 10 Less than one One or or to to to Over Average (years) Base: All answering (364) (305) (355) Simple analysis of these figures indicates that the average time for which respondents had been residential landlords was 9.4 years, a figure which is up from 9.0 years three months ago. Page 9
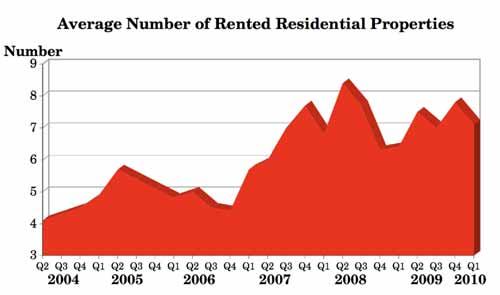
 Almost four out of ten respondents (39%) had only one or two properties in their portfolios with less than half as many (15%) having more than ten properties in theirs.")
10 3.4 How many rented residential properties do you currently have in your portfolio? (Q.4) Almost four out of ten respondents (39%) had only one or two properties in their portfolios with less than half as many (15%) having more than ten properties in theirs. Number of Percent of Respondents (%) Properties Sep 09 Dec 09 Mar 10 One Two to to to to Over Average (no. of properties) Base: All answering (363) (306) (356) Analysis of these results shows that the average size of respondents portfolios was 7.1 properties, down from an average of 7.8 properties three months ago but again this merely reverses the change seen then. As can be seen from the chart below, over the year to June 2005, the average number of properties in respondents portfolios rose by 40%, from 4.1 to 5.7 properties before falling back to 4.4 properties by the end of Throughout 2007, the average rose rapidly but two successive falls in the second half of 2008 took the figure to it s lowest level since the second quarter of The results from 2009 showed an increasing number of properties in respondents portfolios although the average number did fluctuate from quarter to quarter. Despite the quite substantial downturn seen this time, the trend over the last 18 months remains upward. Page 10
11 Page 11
 Nearly eight out of ten respondents to this survey (78%) said that they did NOT expect to sell any of their let residential properties in the next 12 months.")
12 3.5 In the next 12 months, do you expect to sell some or all of your let residential properties? If YES, why? (Q.5 & Q.6) Nearly eight out of ten respondents to this survey (78%) said that they did NOT expect to sell any of their let residential properties in the next 12 months. Nevertheless, a small minority of more than one in ten (11%) said they did have such expectations with the same proportion being unsure whether they would be selling any properties or not in the next 12 months. Response Percent of Respondents (%) Sep 09 Dec 09 Mar 10 Yes No Not sure Base: All answering (358) (304) (355) Compared with three months ago, the proportion saying they DO intend to sell some or all of their properties in the next 12 months has risen, as has the proportion saying they are not sure, whilst the proportion saying they do not has fallen to compensate for these increases. The following question (Q.6) asked of those who had said that they did expect to sell some or all of their let residential properties, why that was their intention. The only offered options were retiring or other reason and 6 respondents out of 40 gave retiring as the reason for selling let residential properties within the next 12 months with the rest saying there was some other reason. Compared with the survey in the fourth quarter of 2009, the proportion giving retiring as the reason doubled from 7% to 15%. Amongst the other reasons given the only one to be given by more than five respondents was: to raise capital/realise gain (13 mentions). Page 12
 More than six out of ten respondents to this survey (63%) had become residential landlords since the beginning of 2000 with more than four out of ten (45%) having done so since the beginning of")
13 3.6 How long ago did you first become a (Buy to Let) residential investment landlord? (Q.7) More than six out of ten respondents to this survey (63%) had become residential landlords since the beginning of 2000 with more than four out of ten (45%) having done so since the beginning of Nevertheless, nearly one in ten respondents (9%) had first become residential landlords earlier than 1990 and had therefore been landlords for 20 years or longer. When Became Percent of Respondents (%) a Landlord Sep 09 Dec 09 Mar 10 Prior to to to to onwards Base: All answering (358) (302) (351) Compared with three months ago, there has been little change with the main changes being that fewer respondents said they had become landlords between 1991 and 1996 (13% compared with 18%) and slightly more said they had done so in each of the other periods. Page 13
 More than half of respondents (51%) said that they had properties in the South East (including London) with nearly a quarter (23%) saying they had properties in London itself.")
14 3.7 Where are your residential investment properties located? (Q.8) More than half of respondents (51%) said that they had properties in the South East (including London) with nearly a quarter (23%) saying they had properties in London itself. Location Percent of Respondents (%) Sep 09 Dec 09 Mar 10 Central London Rest of London (inside M25) South East (outside M25) South West Midlands North East North West Scotland Wales Northern Ireland Base: All answering (355) (300) (351) Compared with three months ago, the main differences are that there were noticeably more respondents with properties in the Rest of London, the South East and Wales and noticeably fewer with properties in Central London, the South West, the Midlands and the North East. Comparing the distribution of properties with the distribution of respondents shows that, with the exception of Northern Ireland, a higher proportion of landlords said they had properties in every region. This suggests that landlords tend to own properties in more than one region. The extent to which the proportion of respondents with properties in a region exceeded the proportion of respondents living in that region was greatest, in proportional terms, for Central London, the North East and the Midlands. Page 14

15 Location Percent of Landlords & Properties Mar 10 (%) Landlords Properties Central London Rest of London (inside M25) South East (outside M25) South West Midlands North East North West Scotland Wales Northern Ireland Base: All answering (353) (351) Page 15
 Respondents to this survey were more likely to have bought properties in good condition than any of the other types listed with more than a third of respondents (35%) saying that more than three")
16 3.8 What proportion of the residential properties you have bought are of each type? (Q.9) Respondents to this survey were more likely to have bought properties in good condition than any of the other types listed with more than a third of respondents (35%) saying that more than three quarters of the properties they had bought were of this type. Proportion Percent of Respondents Mar 10 (%) of Properties Off New Refurb- In need Good Poor plan build ished of refurb. cond. cond. None Up to 25% % to 50% % to 75% Over 75% Base: All answering (330) Analysis of these responses confirms that the most popular type of property with landlords has been those in good condition with, on average, more than four out of ten properties bought (43%) being of that type. Next most popular have been properties in need of refurbishment (26%). Least likely to have been bought by landlords were properties which have been bought off plan or which have never been occupied and those which were new builds although there was little difference between these and those which were in poor condition or refurbished. Type of Average Percent of Properties (%) Property Jun 09 Sep 09 Dec 09 Mar 10 Off plan/never occupied New build Refurbished In need of refurbishment Good condition Poor condition Base: All answering (403) (328) (272) (330) Page 16
17 Compared with three months ago, there has been little change in the average proportions of each type of property. Page 17
 Respondents have tended to favour properties which are between 51 and 100 years old with more than two out of ten (22%) saying that more than three quarters of the properties they have bought")
18 3.9 What proportion of the residential properties you have bought fall into each age band? (Q.10) Respondents have tended to favour properties which are between 51 and 100 years old with more than two out of ten (22%) saying that more than three quarters of the properties they have bought have been in this age band. Least popular with landlords are properties over 150 years old with only 1% saying that more than three quarters of their purchases have been in that age band. Proportion Percent of Respondents Mar 10 (%) of Properties Off New 11 to 26 to 51 to 101 to Over plan (up to 10) None Up to 25% % to 50% % to 75% Over 75% Base: All answering (282) Analysis of these responses reveals that the most popular properties with landlords have been those which are between 51 and 100 years old (30%) with properties in the other age bands (apart from those at each extreme of the scale) being roughly equally popular (between 13% and 20%). Age of Average Percent of Properties (%) Property Jun 09 Sep 09 Dec 09 Mar 10 Off plan/never occupied New (up to 10 years old) to 25 years old to 50 years old to 100 years old to 150 years old More than 150 years old Base: All answering (360) (297) (249) (282) Page 18
19 Compared with the survey in the last quarter of 2009, the main changes are that properties which were between 26 and 50 years old and between 51 and 100 years old were more popular and those which were between 101 to 150 years old were less popular. Page 19
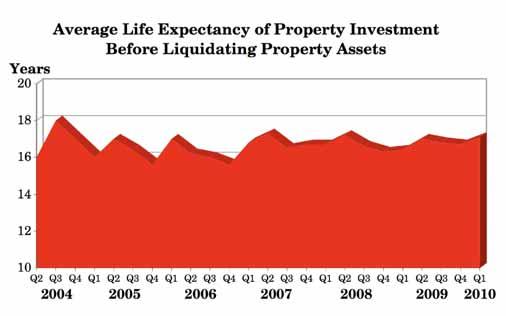
 Clearly the vast majority of residential landlords are in the business for the long term with nearly three quarters (73%) saying that the average life expectancy of their property investments is")
20 3.10 From original acquisition time, what do you expect to be the average life expectancy of your property investment before you liquidate your property assets? (Q.11) Clearly the vast majority of residential landlords are in the business for the long term with nearly three quarters (73%) saying that the average life expectancy of their property investments is more than 10 years. In fact, only one in twenty-five landlords (4%) see their investment as being for 5 years or less and only 1% see it as being very short term (i.e. for less than 2 years). Average Life Percent of Respondents (%) Expectancy Sep 09 Dec 09 Mar 10 Less than 2 years to 5 years to 10 years to 20 years Over 20 years Average (years) Base: All answering (349) (297) (342) Simple analysis of these results reveals that the average life expectancy of their property investments for all respondents is 17.1 years, a figure which is up a little from 16.7 years three months ago. As can be seen from the chart below, the average life expectancy of respondents property investments had been declining slowly until the beginning of 2007 when it increased before levelling off at between 16% and 17% where it has remained since mid 2007 although there does appear to have been a slight upward trend over the last 18 months. Page 20
21 Page 21
22 3.11 Have you seen an increase in the number of tenants struggling to meet rental payments in the last 6 months? (Q.12) Three out of ten respondents answering this question (30%) said they had seen an increase in the number of tenants struggling to meet rental payments in the last six months but more than six out of ten (64%) said they had not. Response Percent of Respondents (%) Sep 09 Dec 09 Mar 10 Yes No Not sure Base: All answering (348) (297) (342) Compared with three months ago, the proportion of respondents saying they had seen an increase in the number of tenants struggling to meet rental payments in the last six months was down from 35% to 30%, partially reversing the change seen then. Page 22
23 3.12 Are you aware/have you seen an increase of tenants haggling over rents in the last 6 months? (Q.13) Almost four out of ten respondents to this question (39%) said they were aware of or had seen an increase in tenants haggling over rents in the last six months but more than half (55%) said that they had not. Response Percent of Respondents (%) Sep 09 Dec 09 Mar 10 Yes No Not sure Base: All answering (347) (296) (340) Compared with the last survey three months ago, the proportion of respondents saying they were aware of or had seen an increase in tenants haggling over rents in the last six months was down for the second time in a row, this time from 43% to 39%. Page 23
 Nearly four out of ten respondents to this question (38%) said they felt renting was more popular now than a year ago but almost as many (37%) said there had been no change whilst only one in")
24 3.13 Do you feel renting is more popular than a year ago? (Q.14) Nearly four out of ten respondents to this question (38%) said they felt renting was more popular now than a year ago but almost as many (37%) said there had been no change whilst only one in twenty (5%) said they felt it was now less popular. Change Percent of Respondents (%) Dec 09 Mar 10 More popular Less popular No change Don't know Base: All answering (297) (341) Compared with three months ago, the proportion saying renting is now more popular than a year ago is up from 35% to 38% but so is the proportion saying they don t know whether it is or not (from 16% to 20%). Conversely, the proportion saying they feel renting is less popular than it was a year ago is down from 9% to 5% and the proportion saying there has been no change has fallen from 39% to 37%. Page 24
 Almost six out of ten respondents to this question (59%) said they felt that consumers were being forced to rent rather than buy but, interestingly, similar proportions said they felt that")
25 3.14 Do you feel people s attitudes to renting have changed? (Q.15) Almost six out of ten respondents to this question (59%) said they felt that consumers were being forced to rent rather than buy but, interestingly, similar proportions said they felt that consumers would rather buy a house than rent one (6%) or that consumers would rather rent a house than buy one (8%) with more than a quarter (27%) being unsure. Attitude Percent of Respondents (%) Dec 09 Mar 10 Rather buy than rent Rather rent than buy Forced to rent Don't know Base: All answering (297) (340) Compared with the last survey in the fourth quarter of 2009, the proportion saying consumers are being forced to rent has risen from 54% to 59% and the proportion saying they don t know has also risen with the result that fewer respondents said either that they thought consumers would rather buy than rent or vice-versa. Page 25
 Most respondents either said they had became residential landlords in order to create a nest egg for their long term future (50%) or that they had done so in order to achieve a combined yield")
26 3.15 Why did you first decide to invest in residential property? (Q.16) Most respondents either said they had became residential landlords in order to create a nest egg for their long term future (50%) or that they had done so in order to achieve a combined yield from rental income and capital appreciation (38%). Less than one in fifty respondents (1.8%) said they became landlords in order to make a short term capital gain over a period of less than 5 years but five times as many (9.4%) said they had done so in order to obtain a stream of rental income. Reason Percent of Respondents (%) Dec 09 Mar 10 Short term capital gain (less than 5 years) Rental income Combined yield from rental income & capital appreciation Create nest egg for long term future Base: All answering (296) (341) Compared with three months ago, there were considerably more respondents who said they had first decided to invest in residential property in order to create a nest egg for the long term future (up from 44% to 50%) and quite a lot fewer saying they had done so to achieve a combined yield from rental income and capital appreciation (down from 48% to 38%). Also, the proportion saying they had done so in order to obtain rental income increased quite sharply from 5.7% to 9.4%. Page 26
27 3.16 Do you think investor landlords are being tempted back to the market because of the minimal interest on savings rates? (Q.17) More than four out of ten respondents (43%) said that they thought investor landlords were being tempted back to the market because of the minimal interest on savings rates with less than a quarter (23%) disagreeing and more than a third (34%) being unsure whether they were or not. Response Percent of Respondents (%) Sep 09 Dec 09 Mar 10 Yes No Not sure Base: All answering (348) (294) (338) Compared with three months ago, there has been little change although more respondents (34% compared with 30%) said they were unsure and slightly fewer said they thought investor landlords either were or were not being tempted back to the market because of the minimal interest on savings rates. Page 27
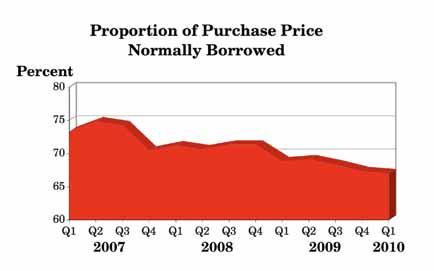
 More than six out of ten respondents (62%) said that they normally borrow between 71% and 90% of the purchase price of a buy to let property.")
28 3.17 What percentage of the purchase price of a buy to let property do you normally borrow from a lender? (Q.18) More than six out of ten respondents (62%) said that they normally borrow between 71% and 90% of the purchase price of a buy to let property. Nevertheless, a sizeable minority of one in six respondents (17%) said they normally borrow less than half of the purchase price. Analysis of these figures reveals that the average proportion of the purchase price of a buy to let acquisition is currently 67.0%. Percent of Percent of Respondents (%) Purchase Price Sep 09 Dec 09 Mar 10 Up to 50% % to 60% % to 70% % to 80% % to 90% Over 90% Average (%) Base: All answering (335) (291) (328) Compared with three months ago, the average proportion of the purchase price of a buy to let property which respondents normally borrow has changed very little, falling slightly from 67.3% to 67.0%. As can be seen from the chart below, over the last three years, the average proportion of a property s price which is usually borrowed by respondents rose initially and then fell at the end of 2007 before levelling out at between 70% and 72% throughout At the beginning of 2009, the average fell again and, despite an upturn nine months ago, the results from the last three quarters suggest that the average proportion being borrowed is still on a downward trend. Page 28
29 Page 29
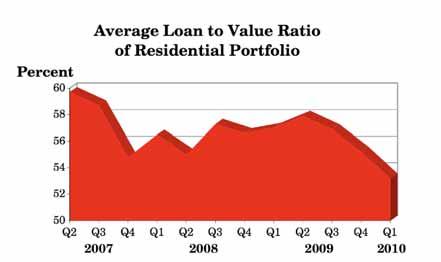
 The largest proportion of respondents, amounting to more than a third (36%) said that the approximate overall loan to value ratio of their rented residential portfolio was between 51% and 75%")
30 3.18 What is the approximate overall loan to value ratio of your rented residential portfolio? (Q.19) The largest proportion of respondents, amounting to more than a third (36%) said that the approximate overall loan to value ratio of their rented residential portfolio was between 51% and 75% with nearly another quarter (23%) saying it was between 76% and 90%. Analysis of these figures reveals that the average loan to value ratio of respondents portfolios is 53.2%. Loan to Value Percent of Respondents (%) Ratio Sep 09 Dec 09 Mar 10 Up to 10% % to 25% % to 50% % to 75% % to 90% Over 90% Average (%) Base: All answering (331) (289) (327) Compared with the last survey three months ago, the average loan to value ratio of respondents portfolios is down again, this time from 55.2% to 53.2%. As can be seen from the chart below, the average loan to value ratio of respondents property portfolios did tend to fluctuate between 55% and 60% during 2007 and However, the trend since the middle of 2009 has been for the average loan to value ratio to decline quite consistently and it has now fallen from 58% in the summer of last year to 53% now. Page 30
31 Page 31
 Three out of ten respondents (30%) said that they did expect to acquire further Buy to Let investment properties during the next 12 months but a higher proportion (51%) said that they did not.")
32 3.19 Do you expect/anticipate that you will acquire further (Buy to Let) investment properties during the next 12 months? (Q.20) Three out of ten respondents (30%) said that they did expect to acquire further Buy to Let investment properties during the next 12 months but a higher proportion (51%) said that they did not. In addition, two out of ten landlords (20%) were unsure whether or not they would acquire further properties in the next year. Response Percent of Respondents (%) Sep 09 Dec 09 Mar 10 Yes No Don't know Base: All answering (345) (294) (333) Compared with three months ago, the proportion saying they expect to acquire further buy to let property in the next 12 months has fallen from 32% to 30% whilst the proportion saying they will not has risen from 48% to 51%. As the chart below shows, having declined for a year between June 2004 and June 2005, the proportion of respondents expecting to acquire further BTL properties in the next 12 months rose for the next four quarters. The substantial downturn seen three and a half years ago returned the figure to its former level before it began slowly to increase again. However, for most of the last three years the proportion has been falling and nine months ago reached it s lowest level since these surveys began six years ago. The small upturn six months ago hinted at a change in the downward trend in the proportion of respondents expecting to acquire more buy to let property in the year ahead but that has been negated by two subsequent falls including the one seen this time which has taken the figure to another all time low. Page 32
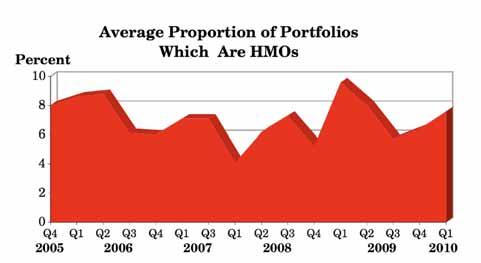
 Only a minority of respondents (17%) had any let properties which were Houses in Multiple Occupation (HMOs) although there were fourteen (4%) who said that all of their let properties were HMOs.")
33 3.20 What proportion of properties you let are Houses in Multiple Occupation (HMOs), i.e. houses occupied by 3 or more unrelated tenants? (Q.21) Only a minority of respondents (17%) had any let properties which were Houses in Multiple Occupation (HMOs) although there were fourteen (4%) who said that all of their let properties were HMOs. Simple analysis of these figures reveals that, for respondents to this survey, the average proportion of their properties which are HMOs is 7.6%. However, amongst those who have any such properties at all, the average proportion is much higher at 45%. Proportion Percent of Respondents (%) of Properties Sep 09 Dec 09 Mar 10 None % to 10% % to 25% % to 50% % to 75% % to 99% All Average (%) Base: All answering (346) (295) (338) Compared with the last survey, the overall average proportion of HMOs is up from 6.4% to 7.6% and the proportion for those with any at all is up from 39% to 45%. The chart below shows how the average proportion of properties which are HMOs has changed over the last two years and whilst the figure has fluctuated quite a lot, it appears, overall, to have increased a little over the last two years. Page 33
34 Page 34
ARLA Members Survey of the Private Rented Sector
 Prepared for The Association of Residential Letting Agents ARLA Members Survey of the Private Rented Sector Second Quarter 2014 Prepared by: O M Carey Jones 5 Henshaw Lane Yeadon Leeds LS19 7RW June, 2014
ARLA Members Survey of the Private Rented Sector
 Prepared for The Association of Residential Letting Agents & the ARLA Group of Buy to Let Mortgage Lenders ARLA Members Survey of the Private Rented Sector Fourth Quarter 2010 Prepared by: O M Carey Jones
Landlord Survey. Changes, trends and perspectives on the student rental market.
 Landlord Survey Changes, trends and perspectives on the student rental market. vember 2016 2 Landlord Survey Summary 3 Letting success 6 Forecast 7 Market confidence 9 Student tenants 11 Rental arrears
Landlords Report. Changes, trends and perspectives on the student rental market.
 Landlords Report Changes, trends and perspectives on the student rental market. Summer 2015 2 Landlords Report Executive Summary 3 Letting Success 5 Rent price & portfolio changes 9 Attitudes about the
TMW Rental Income Analysis Q4 2017
 TMW Rental Income Analysis Q4 2017 1 Gross Rental Income Analysis Q4 2017 - Methodology We asked landlords to self-select their annual gross rental income. This report outlines the results along with rental
LANDLORDS AND LENDERS ADAPT THEIR APPROACH
 John Heron Managing Director Mortgages, Paragon HIGHLIGHTS Landlords resize property portfolios Portfolio gearing falls to all-time low Specialist lenders take on growing role LANDLORDS AND LENDERS ADAPT
LANDLORDS CAUTIOUS AHEAD OF TAX CHANGES
 FEBRUARY 2017 Q4 2016 LANDLORDS CAUTIOUS AHEAD OF TAX CHANGES Despite turbulence in the Private Rented Sector (PRS) dating back to the Government s 2015 Summer Budget, Paragon Mortgages latest PRS Trends
The buy-to-let market
 The buy-to-let market 16.1 Introduction...1 Fig 1: Buy-to-let & first time buyer mortgages, UK 2000-2006...1 16.2 Buy-to-let investors...2 Table 1: Number of buy-to-let sales, Cambridge sub-region (estimates),
FACT INDEX Q INDEX SCORE Q
 The Financial Adviser Confidence Tracking () Index has been tracking financial adviser sentiment since 1995 based on the number of mortgages introduced to borrowers over the previous quarter. This figure
ASSOCIATION OF RESIDENTIAL LETTING AGENTS PRIVATE RENTED SECTOR REPORT
 ASSOCIATION OF RESIDENTIAL LETTING AGENTS PRIVATE RENTED SECTOR REPORT August 2015 For further information: Association of Residential Letting Agents Press Office 020 7566 9777 propertyprofessionals@lansons.com
Residential Planning & The NPPF
 Residential Planning & The NPPF Special Report May 2014 Prepared by Glenigan Established in 1973, Glenigan currently invests 3.1million and makes over a million research telephone calls per year to provide
RP Data - Nine Rewards Consumer housing market sentiment survey Released: Thursday 24 October, 2013
 National Media Release RP Data - Nine Rewards Consumer housing market sentiment survey Released: Thursday 24 October, 2013 Housing market confidence dips in October 1,045 Australian residents respond to
Asking Price Index Released 12/02/16 February 2016
 EMBARGOED UNTIL 12/02/16 HOME.CO UK ASKING PRICE INDEX February 2016 Released: 12/02/2016 1 of 6 Asking Price Index Released 12/02/16 February 2016 England Prices Take a Spring Leap Headlines England prices
LANDLORDS DOWNBEAT DESPITE STRONG RENTAL MARKET
 John Heron Managing Director Mortgages, Paragon HIGHLIGHTS Rental market fundamentals strong Fewer landlords optimistic about portfolio prospects Buying intentions at lowest level ever LANDLORDS DOWNBEAT
TMW Rental Income Analysis Q2 2017
 TMW Rental Income Analysis Q2 2017 1 Gross Rental Income Analysis Q2 2017 - Methodology We asked landlords to self-select their annual gross rental income. This report outlines the results along with rental
Complex Buy to Let Index Q2 2017
 Complex Buy to Let Index Q2 2017 This quarterly industry index tracks mortgage transaction data for Vanilla Buy to Let, Houses in Multiple Occupation (HMO), Multi-unit Freehold Blocks (MUFB) and Semi-Commercial
Contents SEPTEMBER 2009
 Contents Two Tier Market:...1 Overview & Commentary: The National Picture...2 Overview & Commentary: The Regional Picture...3 Overview & Commentary: Supply...3 Property Prices (National)...4 National Bedroom
UK OCCUPANCY SURVEY FOR SERVICED ACCOMMODATION JANUARY 2011
 Occupancy () UK OCCUPANCY SURVEY FOR SERVICED ACCOMMODATION Commissioned by the National Tourist Boards of England, Northern Ireland and Scotland and by Visit Wales (part of the Welsh Assembly Government)
Rental Index. September 2018 (Q3 18)
") Rental Index September 2018 (Q3 18) Contents National rental trends 3 Data from offices trading over 10 years 3 Data including new Belvoir offices 3 Summary for England 4 Summary for Scotland 5 Summary
Rental Index September 2018 (Q3 18) Contents National rental trends 3 Data from offices trading over 10 years 3 Data including new Belvoir offices 3 Summary for England 4 Summary for Scotland 5 Summary
Private Rented Sector Report
 Private Rented Sector Report March 2018 March 2018 PRS Report RENTAL SECTOR HOLDS STEADY IN MARCH Key Findings Demand from prospective tenants increased by eight per cent in March Supply of rental properties
Final 2011 Residential Property Owner Customer Survey
 TOP-LINE REPORT Final 2011 Residential Property Owner Customer Survey Prepared for: Prepared by: Malatest & Associates Ltd. CONTENTS SECTION 1: INTRODUCTION...3 1.1 Project Background... 3 1.2 Survey Objectives...
Asking Price Index Released 14/03/17 March 2017
 EMBARGOED UNTIL 14/03/17 HOME.CO UK ASKING PRICE INDEX March 2017 Released: 14/03/2017 1 of 6 Asking Price Index Released 14/03/17 March 2017 Demand Heads North as London Slumps Headlines A dose of spring
Cost of owning and running a home at highest level since 2008
 This is the annual Halifax review of the cost of owning and running a home. The review is compiled using a range of official statistics, including the ONS Family Spending Survey, DCLG and Halifax's own
Performance of the Private Rental Market in Northern Ireland
 Summary Research Report July - December Performance of the Private Rental Market in Northern Ireland Research Report July - December 1 Northern Ireland Rental Index: Issue No. 8 Disclaimer This report
ESDS 31 st October 2011 Professor Paddy Gray and Ursula Mc Anulty University of Ulster
 ESDS 31 st October 2011 Professor Paddy Gray and Ursula Mc Anulty University of Ulster Twentieth century largely a period of decline rent controls, growth of owner occupation and large scale redevelopment
Rental Index. December 2017 (Q4 17)
") Rental Index December 2017 (Q4 17) Contents National rental trends 3 Data from offices trading over nine years 3 Data including new Belvoir offices 3 Summary for England 4 Summary for Scotland 5 Summary
Rental Index December 2017 (Q4 17) Contents National rental trends 3 Data from offices trading over nine years 3 Data including new Belvoir offices 3 Summary for England 4 Summary for Scotland 5 Summary
RP Data - Nine Rewards Consumer housing market sentiment survey Released: Wednesday 26 February, 2014
 National Media Release RP Data - Nine Rewards Consumer housing market sentiment survey Released: Wednesday 26 February, 2014 Survey reveals - Australian s confident about housing market conditions The
The Profile for Residential Building Approvals by Type and Geography
 The Profile for Residential Building Approvals by Type and Geography Key Points: ABS Building Approvals for Australia peaked back in October 2015. As we have frequently highlighted, approvals have subsequently
ABERTAY HOUSING ASSOCIATION TENANT SATISFACTION SURVEY 2016
 ABERTAY HOUSING ASSOCIATION TENANT SATISFACTION SURVEY 2016 Survey Report Report to: Ian Thomson Chief Executive Report by: Veronica Gray Operations Manager July 2016 Contents A. Background B. Aims & Objectives
Profile of International Home Buyers in Florida
 Profile of International Home Buyers in Florida Research Division National Association of REALTORS 2009 Prepared for the Florida Association of REALTORS 2009 National Association of REALTORS Profile of
Single Family Sales Maine: Units
 Maine Home Connection 19 Commercial St Portland, Maine 04101 MaineHomeConnection.com Office: (207) 517-3100 Email: Info@MaineHomeConnection.com For the fourth consecutive year, Maine home sales set a new
A matter of choice? RSL rents and home ownership: a comparison of costs
 sector study 2 A matter of choice? RSL rents and home ownership: a comparison of costs Key findings and implications Registered social landlords (RSLs) across the country should monitor their rents in
September bounce in house price sentiment
 Knight Frank/Markit House Price Sentiment Index (HPSI) SEPTEMBER 2012 September bounce in house price sentiment Key headlines for September UK households perceive that the value of their home declined
CONSUMER CONFIDENCE AND REAL ESTATE MARKET PERFORMANCE GO HAND-IN-HAND
 CONSUMER CONFIDENCE AND REAL ESTATE MARKET PERFORMANCE GO HAND-IN-HAND The job market, mortgage interest rates and the migration balance are often considered to be the main determinants of real estate
PORTFOLIO VALUES PEAK
 John Heron Managing Director Mortgages, Paragon HIGHLIGHTS Average market value of property portfolio reaches 1.7 million Average portfolio now 6% higher than pre-crisis peak Landlords expect portfolio
Thames Gateway South Essex
 Thames Gateway South Essex Housing Market Trends Quarterly Report April 2010 House Prices, Affordability & Market Indicators Housing Market Trends Quarterly Report April 2010 Introduction This report monitors
Private Rented Sector Report
 Private Rented Sector Report July 2018 July 2018 PRS Report RENTAL DEMAND AT THE HIGHEST LEVEL THIS YEAR Key Findings Demand from prospective tenants increased in July, to the highest level this year so
Households expectations for house price growth reach new survey high
 Knight Frank/Markit House Price Sentiment Index (HPSI) October 2013 Households expectations for house price growth reach new survey high Key headlines for October Households perceptions of house price
New Hampshire Report. Prepared for: New Hampshire Association of REALTORS. Prepared by: NATIONAL ASSOCIATION OF REALTORS.
 New Hampshire Report Prepared for: New Hampshire Association of REALTORS Prepared by: Research Division January 2016 New Hampshire Report Table of Contents Introduction... 2 Highlights... 3 Methodology..8
Agricultural. Credit Conditions. Farmland Values and Farm Income Soar. Burgeoning farm profits accelerated District cropland and ranchland value gains
 SURVEY of TENTH DISTRICT Agricultural Credit Conditions S4 te hp tqeuma br te er r 22 1 FF ee dd ee rraall RReesseerrvvee BBa annk k o of f KKa an ns sa as s C Ci ti ty y Farmland Values and Farm Income
Charlotte Report. Prepared for: Greater Regional Charlotte Association of REALTORS. Prepared by: NATIONAL ASSOCIATION OF REALTORS.
 Charlotte Report Prepared for: Greater Regional Charlotte Association of REALTORS Prepared by: Research Division January 2016 Charlotte Report Table of Contents Introduction... 2 Highlights... 3 Methodology..8
MarketREVIEW INSIGHT TRENDS PERSPECTIVE. Adams County, PA 2nd Quarter 2015
 MarketREVIEW INSIGHT TRENDS PERSPECTIVE Adams County, PA 2nd Quarter 2015 RESEARCH & MAPPING TABLE OF CONTENTS RETAIL MARKET REVIEW Adams County Retail Vacancy Remains Low 3 Dear Reader, This report provides
Housing Market Affordability in Northern Ireland
 Housing Market Affordability in Northern Ireland A report commissioned by the Northern Ireland Housing Executive and Chartered Institute of Housing from Professor Steve Wilcox, University of York The Regional
ANNUAL HOUSE PRICE GROWTH RISES TO 4.5%
 ANNUAL HOUSE PRICE GROWTH RISES TO 4.5% 07/11/2017 +4.5% Annual change +0.3% Monthly change +2.3% Quarterly change 225,826 Average Price House prices in the last three months (August-October) were 2.3%
HomeLet Rental Index
 HomeLet Rental Index Key headlines Rents in the UK rose by 0.9% in October compared to the same month a year ago; the average monthly rent now stands at 909 a month Rents in London rose by 0. in October
HomeLet Rental Index
 HomeLet Rental Index Key headlines Rents in the UK rose by 2. in January compared to the same month a year ago; the average monthly rent now stands at 909 a month Rents in London increased by 2.3% in January
HomeLet Rental Index
 HomeLet Rental Index Key headlines Rents in the UK rose by1.3% in July compared to the same month a year ago; the average monthly rent now stands at 937 a month Rents in London increased by 3.3% in July
Appraiser Trends Study
 Appraiser Trends Study March 2017 National Association of REALTORS Research Department The National Association of REALTORS, The Voice for Real Estate, is America s largest trade association, representing
The use of greenfield and brownfield land in Greenbelt housing & commercial projects
 The use of greenfield and brownfield land in Greenbelt housing & commercial projects Including applications & approvals for full year 2017/18 PREPARED FOR: Campaign for the Protection of Rural England
Ludgvan Parish HOUSING NEED SURVEY. Report Date: 21 st January Version: 1.2 Document Status: Final Report
 Ludgvan Parish HOUSING NEED SURVEY Report Date: 21 st January 2019 Version: 1.2 Document Status: Author: Final Report Andrew Prendergast Rural Housing Enabler Affordable Housing Team, Cornwall Council
HomeLet Rental Index
 HomeLet Rental Index Key headlines Rents in the UK rose by 0.9% in March compared to the same month a year ago; the average monthly rent now stands at 912 a month Rents in London increased by 1.5% in March
HomeLet Rental Index
 HomeLet Rental Index Key headlines Rents in the UK rose by 1.5% in November compared to the same month a year ago; the average monthly rent now stands at 918 a month Rents in London increased by 4. in
Twentieth century trends in farmland values
 Twentieth century trends in farmland values Farmland values have exhibited unprecedented increases in recent years. Nationwide, the compound annual rate of increase in farmland prices has been on the order
HomeLet Rental Index
 HomeLet Rental Index Key headlines Rents in the UK rose by 1.7% in September compared to the same month a year ago; the average monthly rent now stands at 943 a month Rents in London increased by 3. in
HomeLet Rental Index
 HomeLet Rental Index Key headlines Rents in the UK rose by 2.1% in October compared to the same month a year ago; the average monthly rent now stands at 928 a month Rents in London increased by 4. in October
Released: June 7, 2010
 Released: June 7, 2010 Commentary 2 The Numbers That Drive Real Estate 3 Recent Government Action 9 Topics for Home Buyers, Sellers, and Owners 11 Brought to you by: KW Research Commentary The housing
2015 First Quarter Market Report
 2015 First Quarter Market Report CAAR Member Copy Expanded Edition Charlottesville Area First Quarter 2015 Highlights: Median sales price for the region was up 5.1% over Q1-2014, rising from $244,250 to
Netherlands office market
 August 212 Contents 1. Take-up of offices 2. Supply of offices State of Affairs Netherlands office market 3. Office rents 4. Office investments Colophon Composition Drs. R. L. Bak Data source NVM Data
HomeLet Rental Index
 HomeLet Rental Index HomeLet is the UK s largest supplier of tenant referencing to the lettings industry. The HomeLet Rental Index shows agreed rental prices, from over 3,000 letting agents each month,
Review of the Smoke and Carbon Monoxide Alarm (England) Regulations 2015 Response from ARLA Propertymark January 2018 Background
 Regulations 2015 Response from ARLA Propertymark January 2018 Background") Review of the Smoke and Carbon Monoxide Alarm (England) Regulations 2015 Response from ARLA Propertymark January 2018 Background 1. ARLA Propertymark is the UK s foremost professional and regulatory body
Review of the Smoke and Carbon Monoxide Alarm (England) Regulations 2015 Response from ARLA Propertymark January 2018 Background 1. ARLA Propertymark is the UK s foremost professional and regulatory body
EQUITY BOOST HELPS SECOND STEPPERS BRIDGE THE 120,000 GAP FOR NEXT HOME
 NOT FOR BROADCAST OR PUBLICATION BEFORE 00.01 HRS SATURDAY MARCH 4 TH 2017 EQUITY BOOST HELPS SECOND STEPPERS BRIDGE THE 120,000 GAP FOR NEXT HOME Increased equity on first home helps reduce second home
Rental Index Report. October Powered by MIAC. Statistics: UK. Key Feature: Growth in East Midlands, as Interest Rates Rise
 Rental Index Report October 2017 Powered by MIAC Statistics: UK Key Feature: Growth in East Midlands, as Interest Rates Rise Analysis: Rental Growth and Affordability in the UK Area Spotlight: Leicester,
Exploring Shared Ownership Markets outside London and the South East
 Exploring Shared Ownership Markets outside London and the South East Executive Summary (January 2019) Shared ownership homes are found in all English regions but are geographically concentrated in London
SECTOR REPORT HOUSING MARKET
 SECTOR REPORT HOUSING MARKET UPDATE NOVEMBER 2017 www.colliers.nl 28 DEMAND The number of residential property transactions remained virtually unchanged in the third quarter compared to last year. This
2018 Profile of Home Buyers and Sellers
 Massachusetts Report Prepared for: Massachusetts Association of REALTORS Prepared by: Research Division December 2018 Massachusetts Report Table of Contents Introduction... 2 Highlights... 4 Methodology...
Manhattan Rental Market Report November 2015 mns.com
 Manhattan Rental Market Report November 2015 TABLE OF CONTENTS 03 Introduction 04 A Quick Look 07 Mean Manhattan Rental Prices 11 Manhattan Price Trends 12 Neighborhood Price Trends 12 Battery Park City
UNITED KINGDOM OCCUPANCY SURVEY. Serviced Accommodation Summary Report March the research solution
 UNITED KINGDOM OCCUPANCY SURVEY Serviced Accommodation Summary Report March 2014 the research solution UK OCCUPANCY SURVEY This study has been commissioned by the National Boards of England, and Scotland
DETACHED MULTI-UNIT APPROVALS
 HIA New Home Sales DETACHED MULTI-UNIT APPROVALS SALES MULTI-UNIT DETACHED A monthly update on the sales of new homes December 217 TAX BURDEN TAKES TOLL ON New Home Sales during 217 Sales still post modest
Lack of supporting evidence It is not accepted that there is evidence to support the requirement of Sec 56 (2) Housing Act 2004
 Housing Act 2004") DASH Services Response to Nottingham City Council s consultation on proposed designation for additional licensing under Section 56 of the Housing Act 2004 Introduction DASH Services operates the DASH Landlord
DASH Services Response to Nottingham City Council s consultation on proposed designation for additional licensing under Section 56 of the Housing Act 2004 Introduction DASH Services operates the DASH Landlord
House prices fall in June, but households in most regions optimistic about price rises over next 12 months
 Knight Frank/Markit House Price Sentiment Index (HPSI) JUNE 2012 House prices fall in June, but households in most regions optimistic about price rises over next 12 months Key headlines for June UK households
MARKET AREA UPDATE Report as of: 1Q 2Q 3Q 4Q
 MARKET AREA UPDATE Report as of: 1Q 2Q 3Q 4Q Year: 2013 Market Area (City, State): Arlington, Virginia Provided by (Company / Companies): McEnearney Associates, Inc. Realtors What are the most significant
Volume Title: Well Worth Saving: How the New Deal Safeguarded Home Ownership
 This PDF is a selection from a published volume from the National Bureau of Economic Research Volume Title: Well Worth Saving: How the New Deal Safeguarded Home Ownership Volume Author/Editor: Price V.
17 th January 2014 RENT RISES SLOW BY HALF OVER COURSE OF 2013
 17 th January 2014 RENT RISES SLOW BY HALF OVER COURSE OF 2013 Rents rise 1.5% annually, down from 3.2% rise twelve months ago After a 1% monthly fall, average rent in England and Wales now stands at 745
CITI HABITATS. Manhattan Residential Sales Market Report
 Manhattan Residential Sales Market Report Contents 4/7 12/17 3 8 9 10 Market Wide 4 Sales / Days on Market 5 / Months of Supply 6 7 Market Share Resale Co-ops Resale Condos New Developments 11 Luxury Neighborhoods
Coachella Valley Median Detached Home Price Mar Mar 2018
 Median Price $450,000 Coachella Valley Median Detached Home Price Mar 2002 - Mar 2018 $392,000 $400,000 $366,285 $350,000 $300,000 $250,000 $200,000 $150,000 Media Detached Price 4% Growth Curve Summary
Research Report. The Housing Corporation and Communities and Local Government Panel Survey 7
 Cover Page Research Report The Housing Corporation and Communities and Local Government Panel Survey 7 Prepared for: The Housing Corporation and Communities and Local Government The Housing Corporation
Housing as an Investment Greater Toronto Area
 Housing as an Investment Greater Toronto Area Completed by: Will Dunning Inc. For: Trinity Diversified North America Limited February 2009 Housing as an Investment Greater Toronto Area Overview We are
The Corcoran Report 4Q16 MANHATTAN
 The Corcoran Report 4Q16 MANHATTAN Contents Fourth Quarter 2016 4/7 12/23 3 Overview 8 9 10 Market Wide 11 Luxury 24 2 Sales / Days on Market 3 Inventory / Months of Supply 4 5 Market Share Resale Co-ops
Has Brexit burst the British housing bubble?
 Dorling, D. (2016) Has Brexit burst the British housing bubble? New Statesman Magazine, October 21 st, http://www.newstatesman.com/politics/uk/2016/10/hasbrexit-burst-british-housing-bubble Has Brexit
High Level Summary of Statistics Housing and Regeneration
 High Level Summary of Statistics Housing and Regeneration Housing market... 2 Tenure... 2 New housing supply... 3 House prices... 5 Quality... 7 Dampness, condensation and the Scottish Housing Quality
nd Quarter Market Report
 2015 2 nd Quarter Market Report The voice of real estate in Central Virginia CAAR Member Copy Expanded Edition Charlottesville Area 2 nd Quarter 2015 Highlights: Closed sales in the Greater Charlottesville
HomeLet Rental Index
 HomeLet Rental Index Key headlines Rents in the UK rose by 2.5% in January compared to the same month a year ago; the average monthly rent now stands at 932 a month Rents in London increased by 3.7% in
Metropolitan Tract Performance Report for the Quarter Ended September 30, 2009
 VII. STANDING COMMITTEES F 4 B. Finance, Audit and Facilities Committee Metropolitan Tract Performance Report for the Quarter Ended September 30, 2009 Attachment Metropolitan Tract performance Report for
Housing market moving into a renewed up-cycle
 214 Housing market moving into a renewed up-cycle The growth in asking prices for property accelerated in the third quarter, up 3.1 per cent on the previous quarter, and 4.7 per cent on a year earlier
CML RESEARCH. The profile of UK private landlords. Kath Scanlon and Christine Whitehead LSE London. December 2016
 CML RESEARCH The profile of UK private landlords Kath Scanlon and Christine Whitehead LSE London December 2016 www.cml.org.uk ISBN 978-1-905257-16-4 Council of Mortgage Lenders 3 The Profile of UK private
REPORT - RIBA Student Destinations Survey 2014
 REPORT - RIBA Student Destinations Survey 2014 There needs to be a stronger and more direct link between the architectural profession and the study of it as a subject at university. It is a profession
UNITED KINGDOM OCCUPANCY SURVEY. Serviced Accommodation Annual Report May the research solution
 UNITED KINGDOM OCCUPANCY SURVEY Serviced Accommodation Annual Report 2016 May 2017 the research solution INTRODUCTION This report presents a summary of the main findings from the UK Occupancy Survey for
Washington Market Highlights: Fourth Quarter 2017
 Washington State s Housing Market 4th Quarter 2017 Washington Market Highlights: Fourth Quarter 2017 Existing home sales declined in the fourth quarter by 0.2 percent to a seasonally adjusted annual rate
Volume II Edition I Why This is a Once in a Lifetime Opportunity for Investors
 www.arizonaforcanadians.com Volume II Edition I Why This is a Once in a Lifetime Opportunity for Investors In This Edition How to make great investment returns in a soft market U.S. Financing for Canadians
Sherston Parish Housing Needs Survey Survey Report February 2012 Wiltshire Council County Hall, Bythesea Road, Trowbridge BA14 8JN
 Sherston Parish Housing Needs Survey Survey Report February 2012 Wiltshire Council County Hall, Bythesea Road, Trowbridge BA14 8JN Contents Page Parish summary 3 Introduction 3 Aim 4 Survey distribution
things to consider if you are selling your house
 things to consider if you are selling your house KEEPINGCURRENTMATTERS.COM WINTER 2012 EDITION PAGE TABLE OF CONTENTS 1 3 5 7 9 House Prices: Where They Will Be in the Spring Understanding the Impact OF
Rental Index. Key Findings. Analysis. Index by Bedroom. Powered by MIAC Results for November 2016
 Rental Index Powered by MIAC Results for November 2016 Key Findings Analysis Index by Bedroom 1 Key Findings - November 2016 Average Rents in London vs the Rest of the UK Overall Rents Rise Across the
Released: May 7, 2010
 Released: May 7, 2010 Commentary 2 The Numbers That Drive Real Estate 3 Recent Government Action 9 Topics for Home Buyers, Sellers, and Owners 11 Brought to you by: KW Research Commentary The economic
2018 Member Profile Charlotte Regional REALTOR Association Report
 Charlotte Regional REALTOR Association Report Prepared for: Charlotte Regional REALTOR Association Prepared by: Research Division August 2018 Charlotte Report Table of Contents Introduction... 2 Highlights...
Buy-to-Let Index England & Wales
 Buy-to-Let Index England & Wales Under embargo until 00:01 Friday 20 th November 2015 October 2015 Rental reprieve in October but property prices boost landlord returns October sees rents dip on a monthly
Data Note 1/2018 Private sector rents in UK cities: analysis of Zoopla rental listings data
 Data Note 1/2018 Private sector rents in UK cities: analysis of Zoopla rental listings data Mark Livingston, Nick Bailey and Christina Boididou UBDC April 2018 Introduction The private rental sector (PRS)
Brooklyn Rental Market Report October 2014 mns.com
 Brooklyn Rental Market Report October 2014 TABLE OF CONTENTS 03 Introduction 04 A Quick Look 05 Mean Brooklyn Rental Prices 10 Brooklyn Price Trends 11 Neighborhood Price Trends 11 Bay Ridge 12 Bedford-Stuyvesant
Buy-to-Let Index Scotland
 Buy-to-Let Index Scotland Under embargo until 00:01 Wednesday 24 th February 2016 January 2016 Scotland s tenants move back into the black Six-month low for late rent, with only 11.1% of January rent falling
Washington Market Highlights: Third Quarter 2018
 Washington State s Housing Market 3rd Quarter 2018 Washington Market Highlights: Third Quarter 2018 Existing home sales rose in the third quarter by 0.1 percent to a seasonally adjusted annual rate of
Information sheet A Data
 House prices: Statistics activity House prices change over time, but do so at different rates in different places. In this activity you will use statistical diagrams and measures to compare house prices