Boston Market Overview
|
|
|
- Wesley Bennett
- 5 years ago
- Views:
Transcription

1 Boston Market Overview

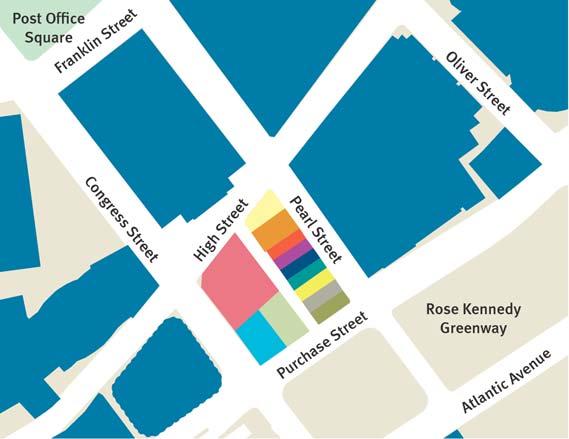
2 Boston Office Submarket Map Q3 Q3 Statistics Statistics North Station Market Size: 2.8 MSF Vacancy: 12.0% YTD Absorption: 76K Avg. Class A: $33.00 Overall Market Size: 67.3 MSF Vacancy: 11.7% YTD Absorption: 1,736K Avg. Class A: $43.30 Financial District Market Size: 33.8 MSF Vacancy: 11.2% YTD Absorption: 896K Avg. Class A: $43.74 South Station Back Bay Market Size: 12.6 MSF Vacancy: 10.1% YTD Absorption: 364K Avg. Class A: $44.30 Market Size: 1.5 MSF Vacancy: 12.3% YTD Absorption: 8K Avg. Class B: $21.86 Seaport District Market Size: 4.9 MSF Vacancy: 15.3% YTD Absorption: 271K Avg. Class A: $29.50

3 Where Is the Class A Market?


4 Tale of Two Cities Average Rent $70 Market Driver Small Tenant $65 $60 ABN-AMRO One International Pl. Spectrum Equity One International Pl. CC Growth One International Pl. J.M. Connors Jr. 200 Clarendon Street Martingale Asset Mgmt. 222 Berkeley Street $55 $50 UBS 1 Post Office Square Bingham McCutchen 1 Federal Street $45 Lahive & Cockfield 1 Post Office Square $40 $35 Shepherd Kaplan LLC 125 Summer Street Wellington Management 100 Federal Street DLA Piper 33 Arch Street Spaulding & Slye 1 Post Office Square $30 Q1 05 Q2 05 Q3 05 Q4 05 Q1 06 Q2 06

5 Asking Rates on the Rise Building Name Floor Old Asking Q New Asking* % Increase 600 Atlantic Avenue 26 $36.00 $ % 101 Federal Street 20 $38.00 $ % Prudential Tower 33 $45.00 $ % 1 Post Office Square 37 $49.00 $ % Asking lease rate trends in selected premium view suites As of 9/28/06
6 Renew vs. Relocate Who Wins?
7 Where Are The Rents Going?
 South Station Forecasting Future Rents Complete")
8 1,000, , ,672 1,449, , ,000 1,089, , ,143 1,024,000 1,023,309 1,600,000 1,400,000 1,200,000 1,000, , , , , Russia Wharf/Fan Pier (1) South Station Forecasting Future Rents Complete SF
9 1,000, ,000 1,600,000 1,400,000 1,200,000 1,000, , , , ,672 1,449, , ,000 1,089, , ,143 1,024,000 1,023, , Russia Wharf/Fan Pier (1) South Station Forecasting Future Rents Complete SF Fleet Scudder TRG Rental Rate 70% Foley Hoag & Nutter Holland & Knight Palmer & Dodge Average RR: $48.80 Average TI: $51.50 Average RR: $28.10 Average TI: $47.10 Rental Rate 40% $ % $ % $58.56
10 Where Is The Demand?
11 Large Tenants in the Market Months Prior to LED Company Address Commitment Date LED One Post Office Square 152,575 SF March 05 10/31/ Boylston Street 93,865 SF December 05 11/1/07 75 State Street 110,323 SF December 05 3/31/08 2 International Place 229,537 SF September 06 4/30/09
12 Financial Services Changing of the Guard Negative Absorption Positive Absorption 150,000 SF Expanding Outside of Boston 100,000 SF 150,000 SF Uncertain Futures, For Sale 140,000 SF
13 Law Firms
14 Who Will Be the First to Develop?


15 New Construction Permitted Sites Russia Wharf Russia Wharf Equity Office 500,000 SF of Office Space 31,000 SF Retail/ Restaurants Occupancy 2010 South Station Hines/Tufts 960,000 SF 680 Ft Tower 41 Stories Occupancy 2010 South Station


16 New Construction Permitted Sites Fallon Development Fan Pier Fallon/Mass Mutual 2.9 MSF 1.2 MSF Office Building 18 Stories Occupancy 2009 Boston Properties 888 Boylston Boston Properties 258,000 SF 31,000 Retail Space 11 Stories Occupancy 2010


17 New Construction Non-Permitted Sites Morgan Stanley Development Filene s at Downtown Crossing Congress/Purchase Street 133 Federal Street

18
19 Suburban Market Overview


20 Suburban Office Market Inventory 2006 Q3 Total Suburban Market: 80M s.f. 495/NORTH 10.5 M s.f. 29.7% Available 495/MASS PIKE 12.9 M s.f. 22.7% Available NORTHWEST 12.6 M s.f. 24.2% Available 128/MASS PIKE 18.8 M s.f. 13.7% Available NORTH 11.3 M s.f. 18.6% Available BOSTON 58.2 M s.f. 13.9% Available. CAMBRIDGE 15.9 M s.f. 11.4% Available 495/SOUTH 2.2 M s.f. 21.6% Available SOUTH 11.5 M s.f. 19.7% Available
21 Availability/Rents by Quarter ( ) Rent Bar = Average Class A (at Top) Average Class B (at Bottom) Boston Cambridge Suburbs 128/Mass Pike $60.00 $55.00 $50.00 $45.00 $40.00 $35.00 $30.00 $25.00 $20.00 $ % 30.0% 25.0% 20.0% 15.0% 10.0% 5.0% $ YTD YTD YTD YTD Rents (Top = A / Bottom = B ) % Available 0.0%

22 Path of Improvement in the Suburbs Class A Office 2006 Q3 Avail High 42.0% Current Avail 34.3% Rent Low $12.00 psf Current Rent $17.00 psf Avail High 40.9% Current Avail 32.1% Rent Low $16.84 psf Current Rent $23.00 psf Avail High 42.5% Current Avail 21.6% Rent Low $20.36 psf Current Rent $32.00 psf BURLINGTON LITTLETON CONCORD Avail High 39.2% Current Avail 23.4% Rent Low $20.02 psf Current Rent $31.00 psf Avail High 18.7% Current Avail 7.9% Rent Low $19.00 psf Current Rent $26.00 psf LEXINGTON WALTHAM Avail High 26.6% Current Avail 11.3% Rent Low $25.00 psf Current Rent $38.00 psf CAMBRIDGE Avail High 32.5% Current Avail 12.2% BOSTON MARLBOROUGH/ WESTBOROUGH FRAMINGHAM Rent Low $24.00 psf Current Rent $40.00 psf Avail High 20.8% Current Avail 12.6% Rent Low $40.00 psf Current Rent $60.00 psf Avail High 46.7% Current Avail 32.4% Rent Low $17.00 psf Current Rent $24.00 psf
23 Suburban Active Requirements By Target Market As Of 10/10/06 South 11% (23) North 9% (17) Northeast 3% (4) 495/North 20% (45) 495/South 12% (15) 495/Mass Pike 17% (35) 128/Mass Pike 12% (94) Northwest 16% (51) Required Square Feet: 9,907,850 s.f. Average Requirement Size: 34,887 s.f. Median Requirement Size: 15,000 s.f. Number of Requirements: 284
24 Suburban Active Requirements By Type As Of 10/12/06 New to Market 2% (18) Looking to Buy 2% (4) Additional Space 9% (21) Relocation w/contraction 12% (24) Relocation 56% (163) Relocation w/ Additional Space 19% (54) Required Square Feet: 9,907,850 s.f. Average Requirement Size: 34,887 s.f. Median Requirement Size: 15,000 s.f. Number of Requirements: 284
25 128 Mass Pike Proposed Developments How many projects are in the pipe line in Waltham today?

26 13 Proposed Developments 1 2 Lexington Technology Park 125 Spring Street, Patriot Way, Lexington Owner: Patriot Partners Proposed Square Feet: 631,600 Reservoir Woods Winter Street, Waltham Owner: Davis Marcus Partners Proposed Square Feet: 650, Wyman Street, Waltham Owner: Equity Office Properties Proposed Square Feet: 400,000 Waltham Office Center 470,486,504 Totten Pond Road, Waltham Owner: Boston Properties Proposed Square Feet Third Avenue, Waltham Owner: Boston Properties Proposed Square Feet: 230, Fourth Avenue, Waltham Owner: Boston Properties Proposed Square Feet: 204,000 Overlook Center 21 Hickory Drive, Waltham Owner: Neelon Properties Proposed Square Feet: 110, Polaroid, Waltham Owner: Related Companies Land Proposed Square Feet: 1.5 million Area: 106 Acres 201 Jones Road, Waltham Owner: Boston Properties Proposed Square Feet: 150, Boston Post Road, Weston Owner: Boston Properties Proposed Square Feet: 359, Green Street, Waltham Owner: Opus Development/Sam Park Proposed Square Feet: 524, Trapelo Road, Waltham Owner: Bulfinch Co. Proposed Square Feet: 61, Sylvan Road, Waltham Owner: Davis Marcus Partners Proposed Square Feet: 400,000 10

27 Suburban Market Trends Migration to secondary markets Class A rates are climbing Class B will benefit Large blocks virtually gone Lack of plug & play Average size requirement is growing Sublease space No longer a factor Speculative development has begun
Healthcare, Life Sciences and Technology Sectors Drive Q Leasing Activity
 MARKETVIEW Boston Suburban Office, Q4 2015 Healthcare, Life Sciences and Technology Sectors Drive Q4 2015 Leasing Activity Vacancy 17.3% Availability 19.9% Absorption 87,036 SF Sublease 2.5 MSF Under Construction
Suburban Boston Office MarketView
 Suburban Boston Office MarketView CBRE Global Research and Consulting U.S. UNEMPLOYMENT 6.7% MA UNEMPLOYMENT 7.1% OCCUPIED SF 92.9M AVAILABILITY 20.3% SUBLEASE SF 2.6M UNDER CONSTRUCTION 1.6M *Arrows indicate
ROUTE 128 & INTERSTATE 495 SUBURBAN OFFICE MARKET REPORT
 ROUTE 128 & INTERSTATE 495 SUBURBAN OFFICE MARKET REPORT THIRD QUARTER 2018 AMENITY RICH LOCATIONS & ASSETS STEAL DEMAND Greater Boston s suburban office and lab market encompasses over 125 million square
BOSTON OFFICE MARKET. Inside... THIRD QUARTER 2017 OFFICESTATUS. »»Boston CBD bounces back. »»Two large companies to move headquarters into Boston.
 BOSTON OFFICE MARKET THIRD QUARTER 2017 OFFICESTATUS BOSTON COMMON BOSTON Inside...»»Boston CBD bounces back.»»two large companies to move headquarters into Boston.»»Natixis Global Asset Management opens
Speculative construction and record breaking investment sales lead the way in Q2 2015
 MARKETVIEW Boston Downtown Office, Q2 2015 Speculative construction and record breaking investment sales lead the way in Q2 2015 Vacancy 7.5% Availability 13.9% Absorption 424,525 SF Sublease 0.75% Under
Greater Boston Industrial Finishes 2015 with a Bang
 MARKETVIEW Boston Suburban Industrial, Q4 2015 Greater Boston Industrial Finishes 2015 with a Bang Vacancy 9.8% Availability 13.4% Occupied Sq. Ft. 128.7 MSF Sublease 0.9 MSF Figure 1: Industrial Vacancy
Miami-Dade County Office Market Report 1Q Real Capital Partners Real Estate Services
 -Dade County Office Report 1Q 216 Real Capital Partners Real Estate Services 1Q 216 -Dade County Office Report Overview -Dade County s Vacancy Increases to 1.4% Net Negative (11,64) SF in the Quarter The
Greater Boston Office Q1 2017
 Q1 2017 Greater Boston GREATER BOSTON OFFICE Economic Indicators Q1 16 Q1 17 MA Employment 3.5M 3.6M MA Unemployment 4.3% 3.2% U.S. Unemployment 4.9% 4.7% Office Market Indicators Q1 16 Q1 17 Overall Vacancy
Greater Boston Office Q1 2018
 Q1 2018 Greater Boston GREATER BOSTON OFFICE Economic Indicators Q1 17 Q1 18 Boston MSA Employment 1.25M 1.26M Boston MSA Unemployment 3.2% 3.3% U.S. Unemployment 4.7% 4.1% Office Market Indicators Q1
Boston starts the year slowly, but has plenty in store
 Boston Downtown Office, Q1 2017 Boston starts the year slowly, but has plenty in store Vacancy 8.6% Availability 13.9% Quarterly Absorption (67,890) SF Sublease 1.3% Under Construction 1.8 MSF Figure 1:
Suburban Boston Office MarketView
 Suburban Boston Office MarketView CBRE Global Research and Consulting U.S. UNEMPLOYMENT 7.3% MA UNEMPLOYMENT 7.2% OCCUPIED SF 93.3M AVAILABILITY 20.5% SUBLEASE SF 2.9M UNDER CONSTRUCTION 1.1M *Arrows indicate
Greater Boston Office Q2 2017
 Greater Boston GREATER BOSTON OFFICE Economic Indicators Office Market Indicators Q2 16 Q2 17 MA Employment 3.5M 3.6M MA Unemployment 3.9% 3.8% U.S. Unemployment 4.9% 4.4% Q2 16 Q2 17 Overall Vacancy 9.9%
A Premium Office/R&D Asset Located in Waltham Boston s Premier Top Suburban Market. 101 First Avenue
 A Premium Office/R&D Asset Located in Waltham Boston s Premier Top Suburban Market EXECUTIVE SUMMARY HFF has been exclusively retained to market the fee simple interest in (the Asset or the Property ),
METRO BOSTON OFFICE MARKET REPORT
 METRO OFFICE MARKET REPORT FOURTH QUARTER 2018 303 CONGRESS STREET, MA 02210 617.457.3400 HUNNEMANRE.COM OFFICE MARKET OVERVIEW The Greater Boston office market ended the year with a bang as absorption
Office Snapshot Q1 2016
 MarketWatch Q1 2016 Greater Boston GREATER BOSTON OFFICE Economic Indicators Q1 15 Q1 16 MA Employment 3.40M 3.41M MA Unemployment 5.1% 4.5% U.S. Unemployment 5.6% 4.9% Office Market Indicators Overall
OFFICE MARKET OVERVIEW
 OFFICE MARKET OVERVIEW Second Half 16 BOSTON CONTENTS Executive Summary 2 Financial District 3 Back Bay 6 Wharf District 8 Seaport 9 Neighborhoods Office Market Statistics 11 IS THERE A BUBBLE COMING?
Another solid quarter for the industrial market as its reputation grows
 MARKETVIEW Boston Industrial, Q1 2017 Another solid quarter for the industrial market as its reputation grows Vacancy 7.7% Availability 10.7% Occupied Sq. Ft. 148.5 MSF Under Construction 300K SF * Arrows
Miami-Dade County Office Market Report 4Q Real Capital Partners Real Estate Services. *Data Source CoStar Miami-Dade County Office Market Report
 Miami-Dade County Office Market Report 4Q 216 Real Capital Partners Real Estate Services *Data Source CoStar Miami-Dade County Office Market Report 4Q 216 Miami-Dade County Office Market Report Overview
ROUTE 128 & INTERSTATE 495 SUBURBAN OFFICE MARKET REPORT
 ROUTE 128 & INTERSTATE 495 SUBURBAN OFFICE MARKET REPORT FOURTH QUARTER 2017 POSITIVE ANNUAL ABSORPTION ACROSS MAP Greater Boston s suburban office market encompasses over 107 million square feet and consists
ROUTE 128 & INTERSTATE 495 SUBURBAN OFFICE MARKET REPORT
 ROUTE 128 & INTERSTATE 495 SUBURBAN OFFICE MARKET REPORT SECOND QUARTER 2018 NEGATIVE ABSORPTION DOESN T TELL WHOLE STORY Greater Boston s suburban office and lab market encompasses over 125 million square
Suburban Boston Industrial MarketView
 Suburban Boston Industrial MarketView CBRE Global Research and Consulting U.S. UNEMPLOYMENT 7.6% MA UNEMPLOYMENT 7.0% OCCUPIED SF 122.5M AVAILABILITY 19.7% SUBLEASE SF 2.6M UNDER CONSTRUCTION 170K *Arrows
Greater Boston MARKETBEAT. Office Q3 2016
 GREATER BOSTON OFFICE Economic Indicators Q3 15 Q3 16 MA Employment 3.51M 3.58M MA Unemployment 4.8% 3.9% U.S. Unemployment 5.2% 4.9% Office Market Indicators Q3 15 Q3 16 Overall Vacancy 9.3% 9.7% Net
METRO BOSTON OFFICE MARKET REPORT
 METRO OFFICE MARKET REPORT THIRD QUARTER 218 33 CONGRESS STREET, MA 221 617.457.34 HUNNEMANRE.COM OFFICE MARKET OVERVIEW Greater Boston s office market recorded another quarter of solid growth as absorption
BOSTON OFFICE MARKET REPORT
 BOSTON OFFICE MARKET REPORT SECOND QUARTER 2018 NO SIGNS OF SUMMER SLOWDOWN Greater Boston's market showed no signs of weakening during the second quarter by recording strong growth from numerous industry
Boston Office MarketView
 Boston Office MarketView CBRE Global Research and Consulting U.S. UNEMPLOYMENT 6.7% MA UNEMPLOYMENT 6.3% OCCUPIED SQ. FT. 70.0M AVAILABILITY 15.9% SUBLEASE SQ. FT. 1.1% UNDER CONSTRUCTION 1.8M FIRMS CHOOSE
TAMI-sector resurgence drives improved quarterly leasing
 Midtown South Manhattan Office, Q3 217 TAMI-sector resurgence drives improved quarterly leasing Leasing Activity 1.14 MSF Net Absorption.9 MSF Availability Rate 1.8% Vacancy Rate 6.9% Average Asking Rent
BOSTON OFFICE MARKET REPORT
 BOSTON OFFICE MARKET REPORT FIRST QUARTER 2018 HIGH PROFILE DEALS WITH MORE TO COME As the calendar year turned and some speculated a strong conclusion to 2017 marked by major relocation announcements
METRO BOSTON Q OFFICE REPORT 11.7% (67,812) $ ,367, Congress Street Boston, MA
 $ ,367, Congress Street Boston, MA") METRO BOSTON Q2 218 OFFICE REPORT VACANCY Q2 ABSORPTION ASKING RENT UNDER CONSTRUCTION 11.7% (67,812) $33.14 3,367,21 33 Congress Street Boston, MA 221 617.457.34 www.naihunneman.com 1 Q2 218 OFFICE STATISTICS
METRO BOSTON Q2 218 OFFICE REPORT VACANCY Q2 ABSORPTION ASKING RENT UNDER CONSTRUCTION 11.7% (67,812) $33.14 3,367,21 33 Congress Street Boston, MA 221 617.457.34 www.naihunneman.com 1 Q2 218 OFFICE STATISTICS
ROUTE 128 & INTERSTATE 495 SUBURBAN OFFICE MARKET REPORT
 ROUTE 128 & INTERSTATE 495 SUBURBAN OFFICE MARKET REPORT THIRD QUARTER 2017 SUBURBS FINISH THE SUMMER STRONG Greater Boston s suburban office market encompasses over 108 million square feet and consists
>> Orange County Vacancy Continues to Decline
 Research & Forecast Report ORANGE COUNTY OFFICE Accelerating success. >> Orange County Continues to Decline Key Takeaways > The South County submarket led the Orange County market in overall net absorption
Miami-Dade County Retail Market Report 3Q Real Capital Partners Real Estate Services. *Data Source CoStar Miami-Dade County Retail Market Report
 Miami-Dade County Retail Market Report 3Q 216 Real Capital Partners Real Estate Services *Data Source CoStar Miami-Dade County Retail Market Report 3Q 216 Miami-Dade County Retail Market Report Overview
BOSTON OFFICE MARKET RESEARCH 3Q 2018 ABSORPTION HITS ITS HIGHEST MARK OF 2018 SO FAR CURRENT CONDITIONS MARKET ANALYSIS
 RESEARCH 3Q 2018 BOSTON OFFICE MARKET ABSORPTION HITS ITS HIGHEST MARK OF 2018 SO FAR The Greater Boston office market witnessed more balanced growth as the suburban submarkets recorded their first absorption
Cambridge Office & Lab market at tightest levels since early 2000 s.
 MARKETVIEW Cambridge Office/Lab, Q2 2015 Cambridge Office & Lab market at tightest levels since early 2000 s. Office Availability 8.4% Lab Availability 9.6% Occupied Sq. Ft. 22.1 MSF Under Construction
Has The Office Market Reached A Peak? Vacancy. Rental Rate. Net Absorption. Construction. *Projected $3.65 $3.50 $3.35 $3.20 $3.05 $2.90 $2.
 Research & Forecast Report OAKLAND METROPOLITAN AREA OFFICE Q1 Has The Office Market Reached A Peak? > > Vacancy remained low at 5. > > Net Absorption was positive 8,399 in the first quarter > > Gross
WESTSHORE OFFICE MARKET OVERVIEW PRESENTED BY: LARRY RICHEY
 MARKET PRESENTED BY: LARRY RICHEY YESTERDAY LOCATION, LOCATION, LOCATION Center of the Region WestShore Plaza 1967 Tampa International Airport 1971 I-275 with exits in all the right places International
ROUTE 128 & INTERSTATE 495 SUBURBAN OFFICE MARKET REPORT
 ROUTE 128 & INTERSTATE 495 SUBURBAN OFFICE MARKET REPORT FIRST QUARTER 2018 STRONG MOMENTUM TO START NEW YEAR Greater Boston s suburban office market encompasses over 107 million square feet and consists
Leasing strength concentrated in new assets
 MARKETVIEW Midtown Manhattan Office, Q4 216 Leasing strength concentrated in new assets Leasing Activity 4.25 MSF Net Absorption.62 MSF Availability Rate 11.8% Vacancy Rate 7.9% Average Asking Rent $8.18
Toronto Central strengthens its position as market with lowest office vacancy in North America
 MARKETVIEW Toronto Office MarketView, Q3 2016 Toronto Central strengthens its position as market with lowest office vacancy in North America GTA Vacancy Rate 9.1% GTA Asking Net Rental Rate $17.72 PSF
MARKETBEAT Columbus. Office Q1 2018
 COLUMBUS OFFICE Economic Indicators Q1 17 Q1 18 Unemployment 4.1% 3.8% Ohio Unemployment 5.1% 4.6% U.S. Unemployment 4.7% 4.1% Market Indicators (Overall, All Classes) Q1 17 Q1 18 Overall Vacancy 12.2%
BOSTON INDUSTRIAL MARKET
 BOSTON INDUSTRIAL MARKET FIRST QUARTER 217 INDSTATUS WAREHOUSE SPACE Inside... Manufacturing market posts largest absorption in more than a year Warehouse rents reach highest price since 24 Six consecutive
Strong Marketwide Leasing Activity Points To A Strong Finish for Tri-Cities
 OFFICE TRI-CITIES MARKET REPORT Strong Marketwide Leasing Activity Points To A Strong Finish for Tri-Cities MARKET OVERVIEW MARKET INDICATORS - VACANCY 14.9% NET ABSORPTION 254,6 CONSTRUCTION 113,8 RENTAL
Chicago CBD. 4.1% Chicago s unemployment rate continued to trend downward, standing at 4.1% as of May 2017.
 Second Quarter 2017 Office Market Report Chicago CBD Market Facts 4.1% Chicago s unemployment rate continued to trend downward, standing at 4.1% as of May 2017. 34,400 jobs The Chicago metro area added
FOURTH QUARTER 2013 LEASING ACTIVITY CONTINUES TO BE BETTER THAN EXPECTED MARYLAND OFFICE MARKET REPORT MARKET SUMMARY ABSORPTION
 Q4 2013 MARYLAND OFFICE MARYLAND OFFICE MARKET REPORT FOURTH QUARTER 2013 LEASING ACTIVITY CONTINUES TO BE BETTER THAN EXPECTED MARKET SUMMARY Updated April 2013 MARKET INDICATORS Q4 2013 Q1 2014* VACANCY
Leasing cools, but deal flow consistent
 MARKETVIEW Downtown Manhattan Office, Q3 216 Leasing cools, but deal flow consistent Leasing Activity.85 MSF Net Absorption (.12) MSF Availability Rate 11.7 Vacancy Rate 9.3 Average Asking Rent $57.5 PSF
Homestretch: Office Market Set to Finish Strong
 Research & Forecast Report RENO OFFICE Q3 2016 Homestretch: Office Market Set to Finish Strong >> Vacancy drops significantly the largest drop quarter over quarter in 2016 >> Rental rates are not increasing
Chicago s industrial market thrives during the third quarter.
 CHICAGO INDUSTRIAL MARKET MONITOR THIRD QUARTER 2015 Chicago s industrial market thrives during the third quarter. Demand across the Chicago industrial market remains high sending absorption up and vacancy
2018: The Year of Office Sales
 Research & Forecast Report RENO OFFICE Q4 2018 2018: The Year of Office Sales >> Multiple significant office sales over 10,000 square feet >> Large blocks of space returned to the market increasing vacancy
Market Research. OFFICE First Quarter 2010
 colliers international LAS VEGAS, NV Market Research OFFICE First Quarter 2010 Market Indicators Net Absorption Construction Rental Rate Q1-10 Q2-2010 Projected Clark County Economic Data Jan-10 Jan-09
GREATER BOSTON MARKET VIEWPOINT 1ST QUARTER Accelerating success.
 GREATER BOSTON MARKET VIEWPOINT 1ST QUARTER 2012 Accelerating success. MARKET VIEWPOINT Q1 2012 Boston Overview The measured recovery in the Boston office market carried into the first quarter, as net
Indianapolis MARKETBEAT. Office Q Economy. Market Overview INDIANAPOLIS OFFICE
 INDIANAPOLIS OFFICE Economic Indicators Market Indicators (Direct, All Classes) Direct Net Absorption/Direct Asking Rent 4-QTR TRAILING AVERAGE Direct Vacancy Q3 17 Q3 18 MSA Employment 1.05M 1.07M MSA
Miami-Dade County Retail Market Report 4Q Real Capital Partners Real Estate Services. *Data Source CoStar Miami-Dade County Retail Market Report
 Miami-Dade County Retail Market Report 4Q 216 Real Capital Partners Real Estate Services *Data Source CoStar 4Q 216 Miami-Dade County s Vacancy Decreases to 4.% Net Absorption Positive 1,155,8 SF in the
Quarterly Market Report
 HOUSTON OFFICE JANUARY 2018 EXECUTIVE SUMMARY Office Market Shows Signs of Improvement Houston s overall vacancy rate remained relatively unchanged at 20.7% in, a decrease of 10 basis points quarter-over-quarter,
BOSTON OFFICE MARKET REPORT
 BOSTON OFFICE MARKET REPORT FOURTH QUARTER 2018 BOSTON MARKET FINISHES YEAR ON STRONG NOTE With 2018 coming to a close, Greater Boston s office market capped off a strong year with another busy quarter,
Chicago s industrial market thrives during the second quarter.
 Economic Overview CHICAGO INDUSTRIAL MARKET MONITOR SECOND QUARTER 2015 Chicago s industrial market thrives during the second quarter. Demand across the Chicago industrial market remains high sending absorption
Bakersfield 4Q18 Office Market Trends
 Bakersfield the higher cost of leasing in the submarket is unlikely to hinder demand as CRC s lease expirations create more available inventory within the University Centre Submarket. Mark J. Smith, SIOR
Office Market Continues to Improve
 Research & Forecast Report LAS VEGAS OFFICE Q3 2016 Office Market Continues to Improve > > Southern Nevada s office market is improving at a steady rate > > Net absorption has been positive in twelve of
INDUSTRIAL QUICK STATS SUMMARY & OUTLOOK MARKET TRENDS VACANCY & NET ABSORPTION ECONOMIC STATS
 PHOENIX, ARIZONA INDUSTRIAL THIRD QUARTER 217 QUICK STATS Direct Vacancy 8.7% Overall Vacancy 9.% Lease Rate NNN $.54 Gross Absorption Under Construction MARKET TRENDS Current Quarter 5,991,128 SF 4,751,494
Indianapolis MARKETBEAT. Office Q Economy. Market Overview INDIANAPOLIS OFFICE
 INDIANAPOLIS OFFICE Economic Indicators Q2 17 Q2 18 MSA Employment 1.1M 1.1M MSA Unemployment 3.3% 3.0% U.S. Unemployment 4.3% 3. Market Indicators (Direct, All Classes) Q2 17 Q2 18 Total Market Vacancy
Office Market Report OFFICE MARKET REPORT. Boston. The Stevens Group. Ten Post Office Square Boston MA
 OFFICE MARKET REPORT Office Market Report Boston The Stevens Group First Quarter 2017 The Stevens Group Ten Post Office Square Boston MA 02109 617-886-9300 Our Difference Is Your Advantage First Quarter
Broward County Office Market Report Third Quarter 2018
 Broward County Office Market Remains Steady Amid Rising Rental Rates Due to Job Growth and New Development Strong economic fundamentals continue to fuel Broward County's office market due to consistent
Q PHOENIX OFFICE REPORT
 Q2 2018 PHOENIX OFFICE REPORT MARKET FUNDAMENTALS ANNUAL COMPARISON Q2 2018 Q2 2017 VACANCY 16.47% VACANCY 16.93% RENTAL RATES $25.43 RENTAL RATES $24.76 SF UNDER CONSTRUCTION 2.76 M SF UNDER CONSTRUCTION
Woolbright Development Research Retail Market Overview: Palm Beach
 Retail Market Overview: 2015 FIRST QUARTER Jacksonville The Retail Market Continues a Moderate Recovery; Average Occupancy Levels Stand Flat at 90%, and Average Base Rental Rates At Publix Anchored Centers
MARKETBEAT INDUSTRIAL SNAPSHOT
 9.1 4.9 7.3 4.5 7. 1.3 8.1 1.3 1.7.3 msf MARKETBEAT INDUSTRIAL SNAPSHOT LAS VEGAS, NV A Cushman & Wakefield Alliance Research Publication Q1 215 ECONOMIC OVERVIEW The U.S. economy continued to add jobs
Las Vegas Valley Executive Summary
 ARROYO MARKET SQUARE Las Vegas Valley Executive Summary Retail Market 4th Quarter 2013 THE DISTRICT AT GREEN VALLEY RANCH January 23, 2014 Re: Commercial Real Estate Survey: 4th Quarter, 2013 Dear Reader,
DISTRICT OF COLUMBIA IN THIS ISSUE OFFICE Q RESEARCH MARKET REPORT. State of the Economy. Leasing Activity. Development Pipeline.
 RESEARCH MARKET REPORT DISTRICT OF COLUMBIA OFFICE IN THIS ISSUE State of the Economy p.2 Leasing Activity p.3 Development Pipeline p.4 Market Outlook p.5 Market Breakdown p.6 DC Development: No Signs
The Office Market Feels The Heat in Q2
 Research & Forecast Report RENO OFFICE Q2 2017 The Office Market Feels The Heat in Q2 >>All major office submarkets have decreased vacancy and positive absorption this quarter >>The overall vacancy decreased
Gaining Traction Gradually in 2018
 Research & Forecast Report RENO OFFICE Q1 2018 Gaining Traction Gradually in 2018 >> Overall vacancy increased slightly to 12.3% >> Negative net absorption of 13,792 square feet >> Rental rates remained
Pharma leasing boosts market, net absorption soars
 MARKETVIEW New Jersey Office, Q3 218 Pharma leasing boosts market, net absorption soars Leasing Activity 1.77 MSF Net Absorption Availability Rate 997,93 SF Average Asking Lease Rate 2.5% $26.34 PSF *Arrows
Weighing Options NORTH I-680 CORRIDOR OFFICE Q % Research & Forecast Report. Market Indicators
 Research & Forecast Report NORTH I-680 CORRIDOR OFFICE Q4 2018 Weighing Options > > Office Inventory: 16,966,736 square feet > > Vacancy: 15 percent > > Net absorption: (35,823) square feet, year to date
The CoStar Office Report
 The CoStar Office Report Y E A R - E N D 2 0 0 9 YEAR-END 2009 SALT LAKE CITY Table of Contents Table of Contents.................................................................... A Methodology........................................................................
KEY TOWER SALE highlights start of 2017
 KEY TOWER SALE highlights start of 2017 Demand for office space in the Greater Cleveland office market remained strong as 2016 wound down and transitioned into the first quarter of 2017. After netting
FOURTH QUARTER 2013 MARIN COUNTY OFFICE SPACE
 FOURTH QUARTER 2013 MARIN COUNTY OFFICE SPACE MARIN OFFICE SANTA ROSA OFFICE 1101 Fifth Avenue, Suite 230 San, CA 94901 2455 Bennett Valley Road, C200, Santa Rosa, CA 95404 Tel: 415.526.7676 Fax 415.526.7679
Cambridge Office/Lab MarketView
 Cambridge Office/Lab MarketView CBRE Global Research and Consulting U.S. UNEMPLOYMENT 6.7% MA UNEMPLOYMENT 6.3% OCCUPIED SQ. FT. 19.4M OFFICE AVAIL. 10.0% LAB AVAIL. 18.4% UNDER CONSTRUCTION 1.8MSF *Arrows
CAMBRIDGE OFFICE & LAB MARKET REPORT
 CAMBRIDGE OFFICE & LAB MARKET REPORT FOURTH QUARTER 2017 GLOBAL OFFICE AND LAB DESTINATION As Greater Boston s gateway market, Cambridge is a hub for intellectual capital, innovative minds and technological
Orange County Office Market Continues to Tighten Causing Rental Rates to Increase
 OFFICE ORANGE COUNTY MARKET REPORT Continues to Tighten Causing Rental Rates to Increase MARKET OVERVIEW MARKET INDICATORS - VACANCY 12.6% NET ABSORPTION 688,800 CONSTRUCTION 497,387 RENTAL RATE $2.26
The Industrial Market Cooled Off in Q1
 Research & Forecast Report Long Island industrial MARKET Q1 2016 The Industrial Market Cooled Off in Q1 Rose Liu Director of Finance & Research Long Island Takeaways > > Long Island industrial market slowed
DENVER. Office Research Report. First Quarter Partnership. Performance.
 DENVER Office Research Report First Quarter 2018 Denver Market Facts 61,614 Jobs added in the last 12 months ending in February, a 4.1% increase in employment. 3.1% Unemployment in Denver, lower than the
Orange County Industrial Continues Positive Momentum
 INDUSTRIAL ORANGE COUNTY MARKET REPORT Orange County Industrial Continues Positive Momentum MARKET INDICATORS - VACANCY 2.9% AVAILABILTY 5.2% NET ABSORPTION 394,960 SF CONSTRUCTION 676,700 SF RENTAL RATE
OFFICE MARKET ANALYSIS
 OFFICE MARKET ANALYSIS GEOFF FALKENBERG Oregon Association of Realtors Fellow The Urban Land Institute ranked Portland 11th in the nation among Markets to Watch for real estate investment in 2014. Jones
The Market Is Energized By Increased Development In Hollywood
 OFFICE CENTRAL LOS ANGELES MARKET REPORT The Market Is Energized By Increased Development In Hollywood MARKET OVERVIEW MARKET INDICATORS - VACANCY 20.5% NET ABSORPTION 24,100 CONSTRUCTION 574,000 RENTAL
GREATER BOSTON MARKET VIEWPOINT 4 TH QUARTER 2016
 GREATER BOSTON MARKET VIEWPOINT 4 TH QUARTER 2016 BOSTON This has been a year of ups and downs in the Boston market. Vacancies moved up 2.3 percentage points to 11.3%, sublease vacancy increased by two-thirds
Orange County Office Market Continues to Tighten As Vacancy Decreases
 OFFICE ORANGE COUNTY MARKET REPORT Continues to Tighten As Decreases MARKET OVERVIEW MARKET INDICATORS - VACANCY 13.5% NET ABSORPTION 101,500 CONSTRUCTION 497,387 RENTAL RATE $2.21 P FSG UNEMPLOYMENT 4.2%
Market Research. Market Indicators
 colliers international LAS VEGAS, NV Market Research OFFICE Third Quarter 2009 Market Indicators Net Absorption Construction Rental Rate Q3-09 Q4-2009 Projected Clark County Economic Data Jul-09 Jul-08
2Q 16. Long Island Market Report
 2Q 16 Long Island Market Report Long Island Office 2Q 216 Long Island 2Q16 Office Office Report The Long Island Office market ended the second quarter 216 with a vacancy rate of 7.5%. The vacancy rate
MARKETBEAT Columbus. Office Q4 2018
 COLUMBUS OFFICE Economic Indicators Q4 17 Q4 18 Unemployment 4.0% 4.0% Ohio Unemployment 4.9% 4.6% U.S. Unemployment 4.1% 3.7% Market Indicators (Overall, All Classes) Q4 17 Q4 18 Overall Vacancy 14.3%
Americas Office Trends Report
 Americas Office Trends Report Summary The overall U.S. office market picked up the pace in the second quarter of 2016 despite continued global economic and financial market uncertainty. While the Brexit
The CoStar Office Report
 The CoStar Office Report Y E A R - E N D 2 0 0 8 YEAR-END 2008 PHOENIX Table of Contents Table of Contents.................................................................... A Methodology........................................................................
South Bay Experiences Slow and Steady Market Activity
 OFFICE SOUTH BAY MARKET REPORT South Bay Experiences Slow and Steady Market Activity MARKET OVERVIEW MARKET INDICATORS - VACANCY 21.4% NET ABSORPTION -68,500 CONSTRUCTION 210,000 RENTAL RATE $2.08 FSG
Office Stays Positive
 Q2 2014 OFFICE LAS VEGAS NEVADA RESEARCH & FORECAST REPORT Office Stays Positive While it may not always be pretty, Southern Nevada s office market continues to improve. Net absorption increased in the
Vacancy Inches Higher, Despite Continued Absorption
 Research & Forecast Report GREATER PHOENIX OFFICE 1Q 2017 Vacancy Inches Higher, Despite Continued Absorption Key Takeaways > > Improving conditions in the Greater Phoenix office market took a pause in
RALEIGH-DURHAM MULTIFAMILY Year End 2017
 Research Report -DURHAM MULTIFAMILY Year End 2017 Multifamily Growth Expected to Continue in 2018, Despite a Moderate Decrease in Permitting Totals Emily Bostic Research Analyst Raleigh-Durham Key Takeaways
2Q 17. Long Island Market Report
 2Q 17 Long Island Market Report Long Island Office 2Q 217 Long Island 2Q17 Office Office Report The Long Island Office market ended the second quarter 217 with a vacancy rate of 7.2%. The vacancy rate
Leasing focused on new construction; renewals up
 MARKETVIEW Midtown Manhattan Office, Q3 216 Leasing focused on new construction; renewals up Leasing Activity 3.96 MSF Net Absorption (.86) MSF Availability Rate 12.1 Vacancy Rate 7.9 Average Asking Rent
Major tenant contractions and impending corporate development set the stage for 2014 and beyond
 Q1 2014 OFFICE MINNEAPOLIS-ST. PAUL OFFICE MARKET REPORT Major tenant contractions and impending corporate development set the stage for 2014 and beyond SF Absorbed Percent Vacant MARKET INDICATORS Q1
Greater Toronto Area Industrial Market Report
 1 ST QUARTER 16 Greater Toronto Area Industrial Report Partnership. Performance. Overview The record-setting momentum felt through 15 in the Greater Toronto Area (GTA) industrial market showed signs of
>> Negative Net Absorption Despite Completions
 Research & Forecast Report MID-COUNTIES INDUSTRIAL Accelerating success. >> Negative Net Absorption Despite Completions Key Takeaways > This quarter, 542,000 square feet of industrial space finished construction,
YEAR-END CHICAGO SUBURBS Office Market Report. Big Moves Create Negative Absorption Driving Vacancy Rates Higher. YTD Net Absorption
 CHICAGO SUBURBS Office Market Report Net Absorption (1,919,191) Availability 24.1% Big Moves Create Negative Absorption Driving s Higher MARKET CONDITIONS: The suburbs had several major real estate occurrences
National Presence. Local Focus
 Metropolitan DC Market Overview 4Q 214 Overall Market Summary The Washington, DC Metropolitan commercial real estate market is comprised of approximately 41.9 million square feet of rentable office space
Hoffman Corners Retail Center II COUNTY ROAD E EAST, VADNAIS HEIGHTS MINNESOTA
 Hoffman Corners Retail Center II 1654-1658 COUNTY ROAD E EAST, VADNAIS HEIGHTS MINNESOTA Mike Brass Vice President Direct 952 837 3054 mike.brass@colliers.com Offering Overview THE OFFERING Colliers International
Research. Legal firms rightsizing leads to uptick in vacancy CLEVELAND 1Q16 OFFICE MARKET. Current Conditions
 Legal firms rightsizing leads to uptick in vacancy The Greater Cleveland office market started 2016 on a sour note, as the office sector gave back space for the first time in 12 months, ending the first