HOUSING OBSERVER Digest
|
|
|
- Brian Jennings
- 6 years ago
- Views:
Transcription

1 HOUSING OBSERVER 2015 Digest
2 CMHC provides funding for housing content on the Census of Canada and on Statistics Canada surveys. Statistics Canada information is used with the permission of Statistics Canada. Users are forbidden to copy and redisseminate data for commercial purposes, either in an original or modified form, without the express permission of and, where applicable, Statistics Canada. More information on Statistics Canada data can be obtained from its Regional Offices, its World Wide Web site at and its toll-free access number The information, analysis and opinions contained in this publication are based on data compiled from various sources. CMHC makes best efforts to ensure that the contents of this publication are reliable, but cannot guarantee that the information is accurate or complete. You should not rely solely on this publication for the purpose of making financial decisions. CMHC strongly advises that you do additional research and obtain financial advice specific to your individual situation in order to form your own judgments. You may not hold CMHC liable for the consequences of any decision or action that you take in reliance upon this publication All rights reserved. No portion of this publication may be reproduced, stored in a retrieval system or transmitted in any form or by any means, mechanical, electronic, photocopying, recording or otherwise without the prior written permission of. Without limiting the generality of the foregoing, no portion of this book may be translated from English into any other language without the prior written permission of Canada Mortgage and Housing Corporation. Produced by CMHC 2
3 Table of Contents 1 Condominiums Detailed Examination of Municipal Accessory Apartment Regulations D Printing and the Construction Industry Flexible Housing First Annual Estimate of Urban Households in Core Housing Need Based on Statistics Canada s New Canadian Income Survey Industrialized Housing HPPA now called the Housing Market Assessment (HMA) Report Housing Data Find What You Need Mortgage Arrears Record Covered Bond Issuance of $27.6 Billion in Other Articles: CMHC s Survey of Condominium Owners in Toronto and Vancouver The Housing Market Information Portal 2015 Mortgage Consumer Survey Interactive Chart: Average annual house prices Newcomers Homeownership Rates of Immigrants Rise Over Time House Price Analysis and Assessment April Update Save on property management costs recruit your tenants as volunteers An alternative water ready home what s the plan? Housing Markets Outlook Canada edition 2015 Rental Market Survey Housing Market Indicator Tables updated to include 2014 data Statistics Canada s Evolution of housing in Canada, 1957 to 2014 CMHC s 2015 First-Time Homebuyers Survey 3
4 Condominiums 4
5 1 What is a condominium? A condominium refers to a form of legal ownership. Buyers purchase private dwellings in condominium buildings called units, and each unit is registered in the buyer s name. The buyers of individual units share ownership of the common elements and assets of the building and community. Property owned under condominium tenure can be of any structure type. Condominiums can be: low-rise or high-rise residential buildings; townhouses or rowhouses; duplexes or triplexes; single-detached houses; or vacant land upon which owners may build. There are mixed-use condominiums that are partly residential and partly commercial buildings. Owning a condominium differs from owning a conventional home in a number of ways. Condominium owners have specific rights and responsibilities and are subject to rules that vary from project to project. To inform consumers and help them decide whether condominium ownership is right for them, we publish a range of information, including the Condominium Buyer s Guide. It includes information on: How condominium ownership differs from other forms of homeownership; How condominium corporations are run and rules that govern day-to-day condominium living; The pros and cons of condominium ownership; What to look for whether you re buying a new or a resale condominium as well as the costs you need to factor into your budget; Checklists, tips and FAQs; A glossary; and Provincial/Territorial fact sheets which provide information specific to each province and territory. 5
6 2 Condominiums by structure type In 2011, 90% of condominiums in Canada were low-rise or high-rise apartments, or row houses. Single-detached houses accounted for 4% of condominiums and other dwelling types for the remaining 6%. FIGURE 1 Condominiums come in various structure types Condominiums by structure type (%), Canada, Single-detached house High-rise apartment Low-rise apartment Row house Other dwelling Includes both owner-occupied and rented condominiums. Low-rise apartments are in buildings with fewer than five storeys. High-rise apartments are in buildings with five or more storeys. Other dwellings comprise duplexes, single-attached houses (a single dwelling attached to another building), semi-detached houses, and movable dwellings. Source: CMHC, adapted from Statistics Canada (National Household Survey) The distribution of structure types varied considerably across the country. In Quebec, low-rise apartments accounted for more than 60% of condominiums in every Census Metropolitan Area (CMA). In contrast, high-rise apartments made up more than two-thirds of condominiums in Toronto, the only CMA in which high-rises accounted for the majority of condominiums. Half of all high-rise condominiums in Canada were in Toronto. Row houses accounted for more than half the condominium stock in a number of Ontario CMAs. Single-detached condominiums were found in every CMA. 6
7 FIGURE 2 Distribution of structure types varies across the country Condominiums by structure type, CMAs, 2011 Victoria Vancouver Abbotsford-Mission Kelowna Edmonton Calgary Saskatoon Regina Winnipeg Thunder Bay Greater Sudbury/Grand Sudbury Barrie Windsor London Guelph Brantford Kitchener-Cambridge-Waterloo St. Catharines-Niagara Hamilton Toronto Oshawa Peterborough Kingston Ottawa Gatineau Montréal Trois-Rivières Sherbrooke Québec Saguenay Saint John Moncton Halifax St. John s Distribution of condominiums by structure type (%) Low-rise apartments High-rise apartments Row houses Single-detached houses Other dwellings Includes both owner-occupied and rented condominiums. Quebec and Ontario portions of Ottawa-Gatineau are shown separately. Low-rise apartments are in buildings with fewer than five storeys. High-rise apartments are in buildings with five or more storeys. Other dwellings comprise duplexes, single-attached houses (a single dwelling attached to another building), semi-detached houses, and movable dwellings. Source: CMHC, adapted from Statistics Canada (National Household Survey) 3 Condominium structure type by age In 2011, 68% of senior (aged 65 or older) households who owned and occupied condominiums lived in apartments, perhaps the easiest type of housing for occupants to maintain. Living space is usually confined to a single floor, and owners are typically not physically responsible for upkeep of any grounds. For people who have problems with eyesight, frailty, or balance, buildings with elevators have the added attraction of reducing the risk of falls on stairs. 7
8 Of all condominium owner-occupants, households with maintainers aged 75 or older are the age segment most likely to live in high-rise apartments, units in buildings of five floors or more that would typically have elevators. In 2011, high-rise units made up 40% of the condominiums in Canada owned and occupied by those 75 or older. Together, high-rise and low-rise apartments accounted for nearly three-quarters (72%) of the condominiums owned and occupied by this group. Per cent FIGURE 3 Senior households are the age group most likely to live in high-rise apartments Structure type choices of condominium owners by age group, Canada, Age of primary household maintainer High-rise apartments Low-rise apartments Row houses Single-detached houses Other dwellings Low-rise apartments are in buildings with fewer than five storeys. High-rise apartments are in buildings with five or more storeys. Other dwellings comprise duplexes, single-attached houses (a single dwelling attached to another building), semi-detached houses, and movable dwellings. Source: CMHC, adapted from Statistics Canada (National Household Survey) 4 Increasing number of condominiums From 1981 to 2011, the number of owner-occupied condominiums in Canada increased nearly seven-fold, and the total number of condominiums, both owneroccupied and rented, reached 1.6 million units. Growth in total stock The condominium stock comprises owner-occupied units and rented units. Many condominiums are purchased by investors who rented them out. In 2011, there were 461,000 such rentals in Canada, 29% of all occupied condominiums. The total number of occupied condominiums in Canada owned plus rented stood at 1,615,000. All told, nearly one out of eight occupied Canadian homes (12%) was a condominium. 8
9 Stock by geographical area Condominiums are found principally in large urban areas, where land costs tend to be high and multiple-unit buildings relatively common. CMAs are home to 68% of all households in Canada, but accounted for 90% of owner-occupied condominiums in Condominiums were underrepresented elsewhere: 7% in medium-sized centres (CAs) and 3% in small towns and rural areas, whereas these were home respectively to 14% and 18% of households in Canada. From 1996 to 2011, the number of owner-occupied condominiums grew by over 600,000 units nationally 28% of the total growth in owner-occupied dwellings. In many CMAs, including Vancouver (58%), Montréal (40%) and Saskatoon (40%), growth in the condominium stock represented upwards of 30% of the total increase in owner-occupied dwellings. FIGURE 4 Increase in condominium ownership highest in Vancouver, Montreal and Saskatoon Condominium share of growth in homeownership, Canada and CMAs, Canada All CMAs Vancouver Montréal Saskatoon Victoria Hamilton Regina Toronto Abbotsford-Mission Calgary Edmonton Québec Winnipeg Kelowna London Guelph St. Catharines-Niagara Ottawa Kitchener-Cambridge-Waterloo Windsor Gatineau Thunder Bay Halifax Brantford Trois-Rivières Saguenay Sherbrooke Kingston Oshawa St. John s Moncton Peterborough Barrie Saint John Greater Sudbury/Grand Sudbury Change in owner-occupied condominiums as a % of change in owner households Data from the 2011 National Household Survey may not be comparable to those from earlier censuses. Quebec and Ontario portions of Ottawa-Gatineau are shown separately. Source: CMHC, adapted from Statistics Canada (Census of Canada, National Household Survey) 9
10 Stock by usage Owner-occupied Condominiums are an increasingly popular housing choice in Canada, and have accounted for a large share of the growth of homeownership over the last three decades. From 1981 to 2011, the number of owner-occupied condominiums in Canada increased from about 171,000 to 1,154,000, more than nine times faster than other owner-occupied homes. Condominiums nearly quadrupled their share of the homeownership market from one in 30 (3%) owner-occupied dwellings in 1981 to one in eight (13%) in Rented In 2011, 11% of all rented homes in Canada were condominiums. If the strong expansion of the owneroccupied condominium stock in previous decades is any indication, the number of condominium rentals likely increased substantially as well. In many communities, condominiums are an important source of rental supply, albeit at the upper end of the market. In 2011, rented condominiums accounted for nearly a quarter of all rented homes in Calgary (25%) and Vancouver (24%). Condominium shares of the rental market were also higher than average in most CMAs in Western Canada, and in Toronto. Condominium rentals are relatively expensive, and condominium renters tend to be comparatively well-off. The median monthly shelter cost (rent plus any utilities paid separately) for condominium rentals in 2011 was $1,022, compared to $765 for other renters. Not surprisingly, households renting condominiums had considerably higher incomes than other renters a median of $42,795 versus $34,888. Thousands of units 1,800 1,600 1,400 1,200 1, FIGURE 5 Condominiums more likely to be owned than rented Occupied condominiums by tenure, Canada, ,615 All occupied condominiums 1 1 Includes 700 units of band housing. 1,154 Owner-occupied condominiums 461 Rented condominiums Source: CMHC, adapted from Statistics Canada (National Household Survey) 10
11 5 Owner-occupied by age Canadians of all ages are more likely today than in the past to live in condominiums. Condominium ownership rates rose in every age group between 1996 and 2001, between 2001 and 2006, and again between 2006 and The increased popularity of condominiums with all age groups accounted for more than three-quarters of condominium growth, the growth and aging of the population for less than one-quarter. Condominium owners as a % of all households FIGURE 6 Popularity of condominiums increased in all age groups Condominium ownership rates by age of primary household maintainer, 1 Canada, 1996, 2001, 2006, Age of primary household maintainer 1 A household maintainer is the person or one of the people in the household responsible for major household payments such as the rent or mortgage. Where more than one person in a household claims responsibility for such payments, the primary maintainer is the first person listed on the census form as a maintainer. Data from the 2011 National Household Survey may not be comparable to those from earlier censuses. Source: CMHC, adapted from Statistics Canada (Census of Canada, National Household Survey) Condominiums can offer features ease of maintenance, security, on-site amenities, and the potential for living close to public transit or within walking distance of work and centrally located attractions and services that appeal to a range of buyers, especially the young and the old. Seniors and young adults account for a disproportionate share of condominium owners. In 2011, 19% of condominium owners in Canada were under the age of 35, and 29% were seniors 65 or older, compared to 11% and 23%, respectively, of other homeowners. People aged 55 or older are much more likely than younger individuals to cite the desire for a smaller dwelling as a reason for moving. They are also more interested in living close to facilities and services. 11
12 6 Owner-occupied by household type The overrepresentation of young adults and seniors in the ranks of condominium owners is echoed in relatively small household sizes an average in 2011 of 1.9 persons for households in condominiums, compared to 2.8 for other owner-occupied dwellings. About 42% of households in owner-occupied condominiums were people who lived alone, compared to only 17% of households in other owner-occupied homes. Of the couples without children who owned and lived in condominiums, 62% were households with maintainers aged 55 or older. Nearly two-thirds (65%) of condominium owners who lived alone were women, who chose them for a variety of reasons such as low maintenance demands, safety and security features, and locations within walking distance of amenities. FIGURE 7 One-person households and couples without children own 71% of condominiums Distributions of condominium owners and other homeowners by household type (%), Canada, Inner ring: Condominium owners Outer ring: Other homeowners Couples without children Couples with children Lone-parent households One-person households Other households Other households comprise multi-family households and non-family households of two or more persons. Family households include at least one census family (a couple with or without children or a lone parent) and may include additional members who are not part of the census family. Source: CMHC, adapted from Statistics Canada (National Household Survey) From 1996 to 2011, one-person households and couples without children people less likely than families with children to need or want the large floor areas and backyards often associated with traditional suburban homes accounted for almost three-quarters (73%) of the growth in owner-occupied condominiums. During these years, as well as in previous decades, people living alone and couples without children were among the fastest-growing household types in Canada, their growth boosted by the aging of Canada s population. 12
13 7 Prices Given the strong growth in condominiums over the past quarter century and their popularity with young buyers, it would be surprising if affordability was not part of their appeal. For first-time buyers with limited savings, affordability is apt to be a deciding factor in housing choices. In 2011, condominium owners in Canada estimated that their homes would sell for a median price of $260,000, compared to $289,000 for other owner-occupied dwellings. In every CMA, the estimated selling price of condominiums was less than that of other owner-occupied units, with the difference in median prices exceeding $300,000 in Vancouver, $200,000 in Victoria and Abbotsford-Mission, and $100,000 in Ottawa (excluding Gatineau), Oshawa, Toronto, Barrie, Calgary, Edmonton, and Kelowna. FIGURE 8 Across Canada, condominiums are more affordable than non-condominiums Median estimated dwelling values 1 for condominiums and other owner-occupied dwellings, selected CMAs, 2011 Victoria Vancouver Abbotsford-Mission Kelowna Edmonton Calgary Saskatoon Regina Winnipeg Barrie Hamilton Toronto Oshawa Ottawa Gatineau Montréal Québec Halifax Thousands of dollars Non-condominium Condominium 1 Values estimated by homeowners if their dwellings were to be sold. Excludes farm households. Quebec and Ontario portions of Ottawa-Gatineau are shown separately. Source: Statistics Canada (National Household Survey) 13
14 8 Shelter costs Consistent with the comparatively low prices of condominiums, condominium buyers generally paid lower monthly shelter costs in 2011 than other home buyers. In a number of CMAs, households financing recent condominium purchases had median monthly shelter costs that were hundreds of dollars less than the costs faced by borrowers financing the recent purchases of other homes. Differences were generally larger in the West, especially in CMAs in British Columbia, where they amounted to $450 or more per month. These figures likely underestimate the cost advantage of condominiums since a portion of repair and maintenance spending, in the form of condominium fees, is included in shelter cost data collected for condominium owners, but not in the cost data for other homeowners. All things considered, shelter cost estimates confirm that condominiums represent a relatively less expensive homeownership option. FIGURE 9 Shelter costs are generally lower for condominiums than for other home types Median shelter costs 1 for condominium owners with mortgages and other owners 2 with mortgages, recently constructed units, 3 selected CMAs, 2011 Victoria Vancouver Abbotsford-Mission Kelowna Edmonton Calgary Saskatoon Regina Winnipeg Barrie Hamilton Toronto Oshawa Ottawa Gatineau Montréal Québec Halifax ,000 1,500 2,000 2,500 Median monthly shelter costs ($) Non-Condominium Condominium 1 Shelter costs include mortgage payments (principal and interest), property taxes, and condominium fees, along with payments for electricity, fuel, water and other municipal services. 2 Excludes farm households. 3 Recent construction refers to units built from January 1, 2006 to May 10, 2011 (Census Day). Quebec and Ontario portions of Ottawa-Gatineau are shown separately. Source: Statistics Canada (National Household Survey) 14
15 9 Mobility and condominium market growth The oldest baby boomers the large generation born in the two decades following World War II have turned 65. Further aging of baby boomers will likely contribute to continued growth in the numbers of one-person households and couples without children, the household types that account for the bulk of condominium residents. Earlier generations achieved their highest rates of condominium ownership during their senior years. If baby boomers follow the same pattern, many will buy condominiums as they age. FIGURE 10 Seniors less likely to move than other age groups Mobility by Age Group, Canada, % of population moving in previous 5 years Mobility data from the 2011 National Household Survey (NHS) and earlier Censuses are not strictly comparable. Census data include people living in non-institutional collective dwellings, such as rooming houses, motels, student residences, and residences for senior citizens, whereas NHS data include only the population living in private households. Source: CMHC, adapted from Statistics Canada (Census of Canada and National Household Survey) One factor that may ultimately restrain the growth of condominiums, however, is the desire of many aging households to remain in their current homes. Despite the increasing availability and popularity of condominiums, the rates at which different age groups move appear, if anything, to have dropped over the past two decades. In 2011, 18% of seniors had moved in the previous five years, compared to 22% in The fact that more than 80% of seniors do not move in any given five-year period suggests that many remain strongly attached to their homes. If baby boomers exhibit similar tendencies, the turnover of the housing stock as they age will be gradual. 15

16 10 Physical condition Reduced maintenance responsibilities are one potential attraction of condominiums; maintenance and repairs to common property elements are handled collectively, often through a property management company, and are typically paid for out of monthly fees or accumulated reserve funds. Comprehensive and up-to-date expert assessments of the state of repair of housing in Canada, including condominiums, are not available. The evidence that does exist is survey data based on the opinions of occupants, not formal inspections. In 2011, condominium owners (5%) were somewhat less likely than other homeowners (7%) to state that their homes (for condominium owners, this relates to their own units, not to the common property elements) were in need of major repairs. The lower perceived rate of disrepair for condominiums reflected their comparatively recent construction. When homes of similar age are compared, condominiums show slightly higher perceived rates of disrepair than other owner-occupied dwellings. In general, however, the perceived rate of disrepair for condominiums in 2011 was low and broadly comparable to that of other homes of similar age. FIGURE 11 Physical condition of condominiums similar to other owner-occupied homes Need for Major Repairs, Condominiumsand Other Owner-Occupied Dwellings, Canada, 2011 % of dwellings rated by occupants as needing major repairs Condominiums Other dwellings All occupied dwellings 1945 or before 1946 to to to to 2011 Source: CMHC, adapted from Statistics Canada (National Household Survey) Period of construction 16
17 Alternative text and data for figures Figure 1: Condominiums come in various structure types Condominiums by structure type (%), Canada, 2011 Structure type Per cent Single-detached house 4 Low-rise apartment 36 High-rise apartment 31 Row house 23 Other dwelling 6 Includes both owner-occupied and rented condominiums. Low-rise apartments are in buildings with fewer than five storeys. High-rise apartments are in buildings with five or more storeys. Other dwellings comprise duplexes, single-attached houses (a single dwelling attached to another building), semi-detached houses, and movable dwellings. Source: CMHC, adapted from Statistics Canada (National Household Survey) 17
18 Figure 2: Distribution of structure types varies across the country Condominiums by structure type, CMAs, 2011 Distribution of condominiums by structure type Geography Low-rise apartments (%) High-rise apartments (%) Row houses (%) Single-detached houses (%) Other dwellings (%) Victoria Vancouver Abbotsford-Mission Kelowna Edmonton Calgary Saskatoon Regina Winnipeg Thunder Bay Greater Sudbury/Grand Sudbury Barrie Windsor London Guelph Brantford Kitchener-Cambridge-Waterloo St. Catharines-Niagara Hamilton Toronto Oshawa Peterborough Kingston Ottawa Gatineau Montréal Trois-Rivières Sherbrooke Québec Saguenay Saint John Moncton Halifax St. John s Includes both owner-occupied and rented condominiums. Quebec and Ontario portions of Ottawa-Gatineau are shown separately. Low-rise apartments are in buildings with fewer than five storeys. High-rise apartments are in buildings with five or more storeys. Other dwellings comprise duplexes, single-attached houses (a single dwelling attached to another building), semi-detached houses, and movable dwellings. Source: CMHC, adapted from Statistics Canada (National Household Survey) 18
19 Figure 3: Senior households are the age group most likely to live in high-rise apartments Structure type choices of condominium owners by age group, Canada, 2011 Age group of primary household maintainer High-rise apartments (%) Low-rise apartments (%) Row houses (%) Single-detached houses (%) Other dwellings (%) Low-rise apartments are in buildings with fewer than five storeys. High-rise apartments are in buildings with five or more storeys. Other dwellings comprise duplexes, single-attached houses (a single dwelling attached to another building), semi-detached houses, and movable dwellings. Source: CMHC, adapted from Statistics Canada (National Household Survey) Figure 4: Increase in condominium ownership highest in Vancouver, Montreal and Saskatoon Condominium share of growth in homeownership, Canada and CMAs, Change in owner-occupied Geography condominiums as a % of change in owner households Canada 27.7 All-CMAs 31.6 Vancouver 58.2 Montréal 39.8 Saskatoon 39.6 Victoria 37.2 Hamilton 35.1 Regina 34.6 Toronto 33.8 Abbotsford-Mission 32.6 Calgary 31.2 Edmonton 30.3 Québec 30.0 Winnipeg 25.1 Kelowna 24.9 London 24.2 Guelph 21.3 St. Catharines-Niagara 19.0 Change in owner-occupied Geography condominiums as a % of change in owner households Ottawa 18.8 Kitchener-Cambridge-Waterloo 17.9 Windsor 16.1 Gatineau 14.6 Thunder Bay 13.6 Halifax 12.6 Brantford 12.6 Trois-Rivières 12.3 Saguenay 12.1 Sherbrooke 11.2 Kingston 10.2 Oshawa 9.0 St. John s 8.9 Moncton 8.5 Peterborough 8.0 Barrie 7.7 Saint John 6.3 Greater Sudbury/Grand Sudbury 1.9 Data from the 2011 National Household Survey may not be comparable to those from earlier censuses. Quebec and Ontario portions of Ottawa-Gatineau are shown separately. Source: CMHC, adapted from Statistics Canada (Census of Canada, National Household Survey) 19
20 Figure 5: Condominiums more likely to be owned than rented Occupied condominiums by tenure, Canada, 2011 Tenure 2011 (units) All occupied condominiums 1 1,615,485 Owner-occupied condominiums 1,153,585 Rented condominiums 461,215 1 Includes 700 units of band housing. Source: CMHC, adapted from Statistics Canada (National Household Survey) Figure 6: Popularity of condominiums increased in all age groups Condominium ownership rates by age of primary household maintainer, 1 Canada, 1996, 2001, 2006, 2011 Age group Condominium owners as a % of all households 1996 (%) 2001 (%) 2006 (%) 2011(%) A household maintainer is the person or one of the people in the household responsible for major household payments such as the rent or mortgage. Where more than one person in a household claims responsibility for such payments, the primary maintainer is the first person listed on the census form as a maintainer. Data from the 2011 National Household Survey may not be comparable to those from earlier censuses. Source: CMHC, adapted from Statistics Canada (Census of Canada, National Household Survey) 20
21 Figure 7: One-person households and couples without children own 71% of condominiums Distributions of condominium owners and other homeowners by household type (%), Canada, 2011 Household type Condominium owners (%) Other homeowners (%) Couples without children Couples with children Lone-parent households 9 8 One-person households Other households 5 5 Other households comprise multi-family households and non-family households of two or more persons. Family households include at least one census family (a couple with or without children or a lone parent) and may include additional members who are not part of the census family. Source: CMHC, adapted from Statistics Canada (National Household Survey) Figure 8: Across Canada, condominiums are more affordable than non-condominiums Median estimated dwelling values 1 for condominiums and other owner-occupied dwellings, selected CMAs, 2011 Geography Condominium ($) Non-Condominium ($) Victoria 348, ,928 Vancouver 375, ,781 Abbotsford-Mission 210, ,651 Kelowna 289, ,227 Edmonton 250, ,098 Calgary 286, ,199 Saskatoon 250, ,761 Regina 259, ,642 Winnipeg 190, ,165 Barrie 174, ,709 Hamilton 240, ,332 Toronto 295, ,427 Oshawa 180, ,263 Ottawa 229, ,357 Gatineau 165, ,602 Montréal 229, ,700 Québec 200, ,721 Halifax 200, ,864 1 Values estimated by homeowners if their dwellings were to be sold. Excludes farm households. Quebec and Ontario portions of Ottawa-Gatineau are shown separately. Source: Statistics Canada (National Household Survey) 21
22 Figure 9: Shelter costs are generally lower for condominiums than for other home types Median shelter costs 1 for condominium owners with mortgages and other owners 2 with mortgages, recently constructed units, 3 selected CMAs, 2011 Geography Condominium ($) Non-Condominium ($) Victoria 1,538 2,289 Vancouver 1,759 2,423 Abbotsford-Mission 1,243 2,202 Kelowna 1,603 2,100 Edmonton 1,554 2,058 Calgary 1,642 2,087 Saskatoon 1,498 1,902 Regina 1,446 1,967 Winnipeg 1,438 1,754 Barrie 1,537 1,898 Hamilton 1,504 1,967 Toronto 1,709 2,054 Oshawa 1,458 1,893 Ottawa 1,567 1,862 Gatineau 1,205 1,492 Montréal 1,228 1,593 Québec 1,131 1,417 Halifax 1,620 1,713 1 Shelter costs include mortgage payments (principal and interest), property taxes, and condominium fees, along with payments for electricity, fuel, water and other municipal services. 2 Excludes farm households. 3 Recent construction refers to units built from January 1, 2006 to May 10, 2011 (Census Day). Quebec and Ontario portions of Ottawa-Gatineau are shown separately. Source: Statistics Canada (National Household Survey) 22

23 Detailed Examination of Municipal Accessory Apartment Regulations Article 2 November
24 1 Introduction The purpose of this study was to 1) examine the characteristics and attributes of the municipal regulations of the 498 municipalities in Canada that allow accessory apartments and 2) to assess how likely these regulations are to enable or dissuade the creation of accessory apartments. In addition, this study collected data on the number of building permits issued for accessory apartments between 2011 and 2013, to assess the feasibility of using building permit data to determine the number of accessory apartments created in a three-year time frame. The focus was only on those units that were created legally through a development and/or building permit process. An accessory apartment is a self-contained dwelling that is accessory to the principal dwelling, and is located either within the primary dwelling or in an accessory building on the same lot as the primary dwelling. Accessory apartments have over 50 different names in the regulations examined, such as garden suite, coach house, basement suite, secondary suite or granny suite in English, and in French, pavilion jardin, logement supplémentaire, logement au sous-sol, or logement intergénérationnel. 2 Methodology Part 1 Analysis of Accessory Apartment Regulations The 2014 study Municipal Accessory Apartment Regulations in the 33 Census Metropolitan Areas and 114 Census Agglomerations in Canada collected information on 650 municipalities, of which 498 permit accessory apartments. Since the objective of this study was to further analyze the regulations that permitted accessory apartments, only the 498 municipalities where accessory apartments are permitted were considered. General provisions for accessory apartments were documented from each municipal by-law which indicated under what circumstances such suites were permitted. While each by-law is unique, the majority had at least a few of the following provisions: Requirement for a specific occupant Limit on the number of occupants Owner occupancy requirement for one of the units Time limitations/temporary use (particularly regarding garden suites) Discretionary or conditional use provisions 24
25 Requirements for special permits or agreements or specific Council approval Restriction by type of building, specific zone, or both Minimum parking requirements Architectural integration requirements Minimum or maximum size requirements. The following were used to categorize each of the identified provisions: (L) Likely to hinder the creation of accessory apartments (SWL) Somewhat likely to hinder the creation of accessory apartments (NL) (CC) Not likely to hinder the creation of accessory apartments; and Case-by-case assessment depends on the nature of the requirement and municipal context. Once each provision was categorized an overall classification of (1) enabling, (2) somewhat restrictive or (3) restrictive was made for the municipal by-law, based on a combination of the number of regulations and likelihood that the regulations would hinder the creation of accessory apartments. The three overall classifications are defined as follows: Enabling (E) Those by-laws that have either no restrictions or very few conditions that are not likely to pose a hindrance to accessory apartment creation. Somewhat Restrictive (SR) A combination of conditions that would be somewhat likely to be a hindrance to accessory apartment creation. Restrictive (R) Regulations with a combination of conditions that are likely to hinder the creation of accessory apartments. Part 2 Tracking the Number of Accessory Apartments Created To determine how many accessory apartments were created in each of the municipalities over a three-year period, information on the number of legal accessory apartments was collected by obtaining building permit records from municipal building departments. In some cases, the building permit information was available on municipal websites; however, it often did not include a separate category for accessory apartments and the municipality had to be contacted for clarification. 25
26 3 Findings The total number of municipalities studied in each province and territory and the percentage of those municipalities where the accessory apartment by-law was classified as restrictive, somewhat restrictive or enabling is shown in Figure 1. Of the 498 municipalities in Canada that permit accessory apartments, the study found the following results: 42% have enabling by-laws with no restrictions or few conditions that are likely to pose a hindrance to accessory apartment creation; 10% have somewhat restrictive regulations that included a combination of conditions that would be somewhat likely to be a hindrance to accessory apartment creation; and 46% to have restrictive regulations with a combination of conditions that are likely to hinder the creation of accessory apartments. FIGURE 1 Proportion of municipalities permitting accessory apartments with enabling, somewhat restrictive and restrictive regulations, by Province and Territory, 2014 CANADA Newfoundland and Labrador Prince Edward Island Nova Scotia New Brunswick Quebec Ontario Manitoba Saskatchewan Alberta British Columbia Northwest Territories Yukon Per cent Enabling regulations Somewhat restrictive regulations Restrictive regulations Uncategorized (Not enough information) 26
27 The majority of by-laws permitting accessory apartments are for units within the primary dwelling. However, a number of municipalities also permit accessory apartments in an accessory building such as a garden suite. In most cases where a municipality permits more than one type of accessory apartment, both types of accessory dwellings have similar provisions, and the municipality was given a single classification of restrictive, somewhat restrictive or enabling based on the regulation for a secondary suite in the primary dwelling. 4 Regional Analysis Among the provinces, British Columbia and Newfoundland and Labrador have the highest proportion of enabling regulations in Canada at 66% and 65% respectively. The majority (55%) of Québec municipal regulations were categorized as restrictive. This is mostly influenced by the fact that many of the regulations required that the accessory apartment be occupied by a specific occupant, usually someone related to the registered owner of the primary dwelling. While Ontario had a relatively high proportion of enabling regulations (49%), it also had 21% somewhat restrictive regulations and 29% restrictive. In all of Canada, Alberta had the lowest rate of enabling municipalities. This is because most municipalities in Alberta that permit accessory apartments allowed them on a conditional or discretionary basis, which may involve special approvals as well as additional time and costs without a guarantee that an accessory suite may be permitted. 5 Core Cities Analysis Core municipalities are usually urban areas with larger and denser populations and possibly higher demand for accessory apartments than rural areas or smaller municipalities. Canada has 147 such core municipalities of which 120 or 82% permit accessory apartments (95 in CAs and 25 in CMAs) according to the 2014 study. Out of the 25 CMA core municipalities, 7 were categorized as restrictive, 7 as somewhat restrictive, and 11 as enabling. Out of the 95 CA core municipalities, 44 were categorized as restrictive, 8 as somewhat restrictive, and 43 as enabling. 27
28 6 Number of Legal Accessory Apartments To determine how many legal accessory apartments may have been created in 2011, 2012 and 2013 in the 498 municipalities that permit them, municipalities were contacted to obtain the number of building permits issued for each year for such suites in their jurisdiction. Efforts were also made to collect information on permits obtained for suites in the primary dwelling or in an accessory building, as well as the number of those suites that were new construction or additions or modifications to an existing dwelling. A 70% response rate was obtained from all municipalities, although a number of municipalities who did respond stated they did not collect the specific details on the type of suite when issuing residential building permits. Some municipalities collect the total number of permits issued for accessory apartments but may not track whether the unit is in the primary or accessory building or whether they are additions to an existing dwelling or new construction. Where data were unavailable, a few officials provided estimates. Over the three year period , 15,421 accessory apartments were created based on the building permit information available. This includes units in new construction, units created as part of an existing home renovation and, in some cases legalization of a pre-existing illegal or non-conforming suite. It is very likely a much larger number of accessory apartments were created than accounted for; however, at this time, there is no easy way of tracking them through the building permit process. So although the data can be used to estimate the number and to some extent the types of dwellings in each municipality and province, when factoring in the response rate, the total should be viewed as an incomplete estimate. Figure 2 illustrates the types of units for which building permits were obtained for municipalities where this information was tracked. The majority (86%) of accessory apartments created were suites within the primary dwelling while the rest were units in an accessory building such as a garden suite. In addition, of the 11,243 accessory apartments for which data were available, about 58% of the units were in new home construction and 42% were renovations to existing homes. 28
29 FIGURE 2 Percentage of accessory apartments that are within or outside the primary residence and are new build or renovations, Canada, % 42% 86% 58% In primary residence Out of primary residence New Build Renovations 7 Implications for the Housing Industry and Policy Makers Changes in demographics, economics and community goals are leading to innovative ways of increasing the housing supply. A consistently low volume of construction of new purpose-built rental housing over the past two decades is resulting in low vacancy rates and rising rents in some jurisdictions across Canada. Alternative rental housing or the secondary rental market, which includes accessory apartments, is an important component of the rental housing sector. In particular, accessory apartments offer an affordable housing option. Regulations help to ensure personal safety and community integration, but the findings of this research show, that while there is great interest in increasing the availability of accessory apartments across the country, there are also significant concerns over community and neighbourhood impacts in many jurisdictions. As demand for affordable housing options such as accessory apartments continues to grow, regulatory approaches may need to be examined to ensure that they are not creating unintended or unnecessary barriers. Better data on the creation of accessory apartments could contribute to a better understanding of the volume and type of suites being created, which in turn may help to guide local dialogues on accessory apartments. 29

30 The Housing Observer Online offers a variety of information on different topics: Housing Markets Housing Finance Housing Data Housing Needs Housing Demographic Affordable Housing Seniors Housing Housing Policy Visit to get the latest information CMHC Project Managers: Janet Kreda, Senior Researcher; Kathleen Ireton, Researcher Housing Needs Research Consultant: Muniscope 30
31 Alternative text and data for figures Figure 1: Proportion of municipalities permitting accessory apartments with enabling, somewhat restrictive and restrictive regulations, by Province and Territory, 2014 Jurisdiction Enabling Regulations (%) Somewhat Restrictive Regulations (%) Restrictive Regulations (%) Uncategorized (not enough information) (%) CANADA Newfoundland and Labrador Prince Edward Island Nova Scotia New Brunswick Quebec Ontario Manitoba Saskatchewan Alberta British Columbia Northwest Territories Yukon Figure 2: Percentage of accessory apartments that are within or outside the primary residence and are new build or renovations, Canada, Accessory Apartment Percentage (%) In primary residence 86 Out of primary residence 14 New build 58 Renovations 42 31

32 Credit: Olivier Middendorp via Hollandse Hoogte 3D Printing and the Construction Industry 32
33 1 What is 3D Printing? 3D printing, also referred to as additive printing or additive manufacturing, is a revolutionary production technique capable of creating solid objects from a digital file uploaded to a 3D printer. The printer reads the file and lays down successive layers of materials, such as plastics, resins, concrete, sand or metals, until the entire object is created. 2 3D Printing in the Construction Industry In the construction industry, 3D printers are used to create 3D models, prototypes or small, non-structural building components such as landscaping bricks or decorative elements. 1 Researchers are experimenting with different types of 3D printers and a range of raw materials and fabrication techniques to advance the technology and expand the range of potential applications to include structural building components and even whole buildings. Current research includes experimentation with: a variety of raw materials including recycled plastic, bioplastics, concrete and a synthetic stone-like material created from a combination of sand and chemicals; advanced 3D printers capable of extruding multiple materials; 2 a variety of fabrication methods (e.g., printing wall components in sections which can be snapped together on site; printing structural scaffolding which can be filled in with construction materials on site to create full-sized walls 3 ); fabrication of reinforced concrete beams; 4 and direct printing on-site or in factories
 project currently being printed in Amsterdam.")
34 3 3D Printed Residential Buildings Research projects are underway to create residential buildings from 3D printed modular components. One example is Canal House (DUS Architects) project currently being printed in Amsterdam. Building blocks 3D Print Canal House, credit: DUS architects The 3D Canal House is a 3-year research and development project to create a 13 room demonstration house. The project team built a 3D printer, called a KamerMaker or room maker, which was installed inside a large, upended shipping container. The printer creates wall components from a bioplastic mix of plastic fibres and 80% plant oil. Wall components are then interlocked together and filled with bio-concrete to provide structural strength. See more at: 34
 3D printer, called the Big Delta was unveiled in Italy by the World s Advanced Saving Project (WASP).")
35 Architects, engineers and researchers are also exploring the potential of creating complete buildings from 3D printers. In September 2015, a 12 meter (40 foot) 3D printer, called the Big Delta was unveiled in Italy by the World s Advanced Saving Project (WASP). 5 The printer is designed to produce a complete shelter using local materials, such as mud, clay and natural fibres and could potentially be used to create housing in disaster areas or areas where a large supply of emergency housing is needed. 6 Berok Khoshnevis, from the University of Southern California, has developed a 3D fabrication process called contour crafting which he believes offers the potential to automate the construction of a complete house including electrical, plumbing, drywall and insulation (see He envisions widespread use of light-weight contour crafting 3D printers to print houses by 2020 and high rises by Credit: Berok Khoshnevis, University of Southern California
36 4 Potential Implications of 3D Printing for the Home Building Industry Although still in its early days, 3D printing could offer the following benefits: Onsite or factory applications. Printed products only use as much material as needed to form them. This means fewer resources are required and less waste is generated. Reduced transportation costs if products are printed on-site (although the cost of transporting the printer can be expensive due to the size of printers currently needed for construction). Potential to create more efficient and interesting designs as 3D printing can achieve shapes that conventional techniques cannot. Lower labour costs. Reduced cost of customized design (with 3D printing, it costs the same to create one item as to produce thousands.) Reduced health and safety risks if 3D printing can be used to produce assemblies that would otherwise need special equipment and precautions to be taken. Current challenges to be overcome include: More expensive than conventional construction due to high cost of 3D printer and lack of familiarity in the industry with 3D printing technologies and applications. Currently, a limited number of materials have been used, although experimentation is underway with printers capable of using multiple materials to produce more complex assemblies. 3D printers can be large and, therefore, difficult and costly to place on site. 3D printing incurs more up-front costs to create the digital model that will result in safe, cost-effective products. Printers are currently slow compared to conventional construction, although they can be operated 24 hours a day, seven days a week. The potential of a disruptive impact on the type of skills and labour needed to design and build homes. 36
37 5 The Future of 3D Printing in Residential Construction There is a wide range of views about where the technology could be headed. Although 3D printing is still in its early days in all industries, the potential benefits seem to be driving the technology forward. Some suggest 3D printers will be used mainly to print building components and panels either in factories or on site, while others envision 3D printing as a transformative technology that could revolutionize the construction industry. 37

38 Flexible Housing 38
39 1 What is Flexible Housing? The concept of flexible housing has its roots in the innovative Grow Home developed in 1990 by Avi Friedman and Witold Rybczynski at Montreal s McGill University School of Architecture. Designed to be affordable, the Grow Home incorporated flexible and adaptable living spaces within a small footprint. Building on this concept, in 1995 (CMHC) created FlexHousing as part of the universal/inclusive design movement. The objectives of universal housing are the following: Allow people to occupy their homes for longer periods of time; Create housing that meets a wide range of needs; and Improve the convenience of a home for its occupants. 2 How the Flexible Design Concept Works Flexible housing is achieved through planning, design, and construction or renovation. Forethought and careful consideration of possible future needs are required at the design stage to permit maximum flexibility, at the least cost, in the living spaces over time. 3 Everyone Benefits from a Flexible Home A flexible home is an ideal choice for everyone as needs change over time in response to personal circumstances such as aging, changing health conditions, and household composition and income changes. In addition to being well-suited to meet the needs of an aging population and people with disabilities and other special needs, flexible housing is also a good choice for multi-generational living or for households which will need a future home office, or an independent suite for a family member, caregiver, or tenant. Additionally, as well-designed flexible housing is better prepared to adapt to a broad range of needs, it can appeal to a wider range of buyers on eventual resale. 39
40 4 Flexible Housing is an Affordable Option Although flexible housing may initially cost slightly more than a conventional house, it can offer significant savings compared to the costs of demolition and renovation at a future date. The incremental costs of flexible housing features can be less than the cost of relocating when all related expenses, such as packing, moving, new furnishings and appliances, commissions and various fees are factored in. For more information read, Sustainable Housing and Communities Flexible Housing 40

41 First Annual Estimate of Urban Households in Core Housing Need Based on Statistics Canada s New Canadian Income Survey 41
42 First Annual Estimate of Urban Households in Core Housing Need Based on Statistics Canada s New Canadian Income Survey In the 2012 base year, Statistics Canada replaced the Survey of Labour and Income Dynamics (SLID) with the Canadian Income Survey. According to estimates of urban core housing need based on data from the Canadian Income Survey, 1.4 million urban households, or 13.5% of all Canadian households living in urban areas, were in core housing need in This proportion is virtually the same as in 2012, considering the statistical accuracy of the estimate based on this survey. In 2012 and 2013, Ontario remained the province with the highest proportion of urban households in core housing need. In 2013, about half of urban households in core housing need, that is, 739,197 households, were living in Ontario. Ontario and British Columbia were the only two provinces whose proportion of urban households in core housing need was higher than the national average in New Brunswick and Alberta, for their part, were the provinces with the smallest percentage of urban households in core housing need in

43 In 2013, 13.5% of Canadian Households Living in Urban Areas Were in Core Housing Need Source: CMHC (housing indicators and data based on the 2012 and 2013 Canadian Income Survey and the 2011 National Household Survey) Canada 12.8% 13.2% 13.5% Ontario 14.0% 16.6% 16.6% British Columbia 15.7% 16.2% 16.1% Prince Edward Island 9.0% 9.9% 12.9% Nova Scotia 12.8% 14.1% 12.5% Manitoba 10.0% 10.4% 11.8% Saskatchewan 12.0% 12.5% 11.6% Newfoundland and Labrador 12.0% 12.5% 10.3% Québec 11.3% 8.9% 9.8% Alberta 10.4% 7.8% 8.9% New Brunswick 9.8% 8.7% 8.4% 43
44 Industrialized Housing 44

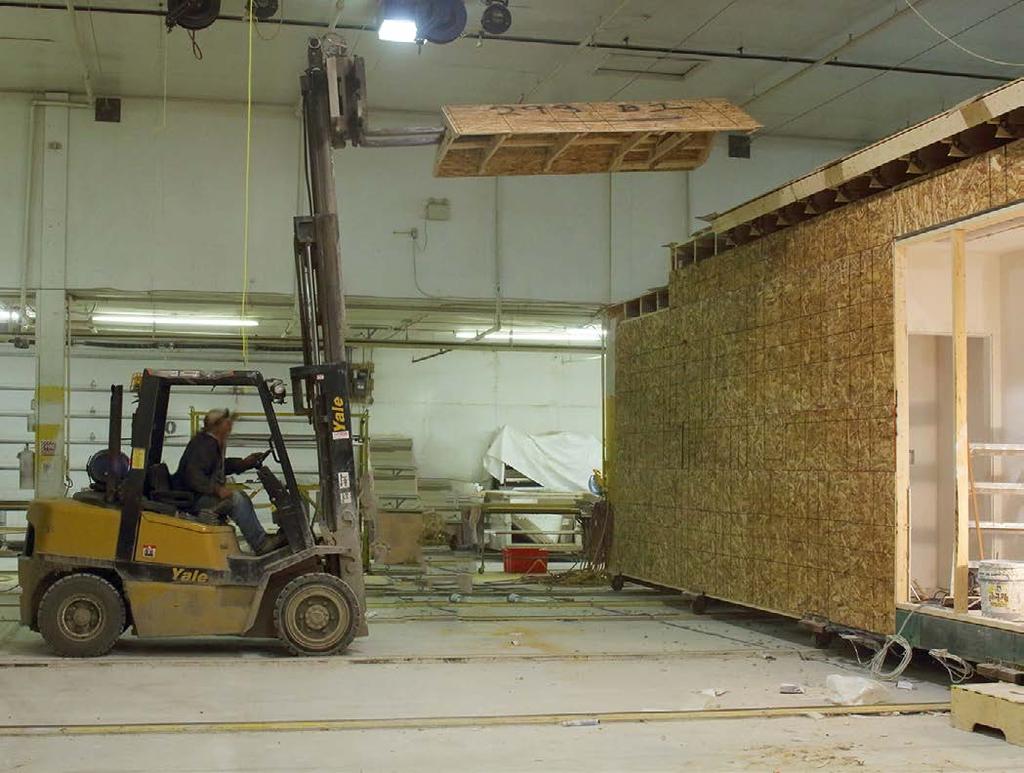
45 Industrialized Housing The modern era of factory-built housing began during the Second World War. Homes were built in a way that would take as little material away from the war effort as possible. These days, the most common forms of factory-built housing are referred to as manufactured and modular homes. Manufactured homes These complete factory-built houses are delivered to their final destinations and placed onto wood or concrete-block piers (to create a crawl-space) or on full-depth basement foundations. Cabinets, flooring, appliances and electrical and plumbing systems are installed and ready to be connected to municipal utilities networks. Homes are built in compliance with a series of standards and are certified before leaving the factory. 45
46 Annual Factory-built, single-detached starts Share of all single-detached starts , % , % , % , % , % , % , % , % , % , % , % Modular homes Factory-built modules are transported and assembled onsite and typically placed on full-depth basement foundations. Modular houses are subject to the same codes as site-built homes as it involves on-site construction processes. Prefabrication In other housing processes, prefabricated panels are often used for walls, floors, and roof assemblies. Manufacturers have developed approaches to interlock the panels together so that the joints are air tight. With panelized construction, the outer walls can go up in as little as one day leaving a weather tight home for the trades to work in focussing on interior completion. Engineered wood products perform better than traditional cut lumber. They are less susceptible to warping, shrinking, and twisting, and they reduce the impact of residential construction on our forests. Other housing components that are commonly prefabricated include window assemblies, door assemblies, cabinets kitchen and bathroom pods 46
47 Distribution Producers of manufactured homes sell through retailers or dealers whereas modular housing producers increasingly sell through on-site builders, often with the producer and the builder sharing the credits in the promotion of the project. Strengths Shorter on-site construction time Precision construction and quality control Potential for improved energy efficiency Reduced waste generation and improved reuse-recycling possibilities Easy to disassemble and reconfigure Labour cost advantages and bulk buying power In-house design and development Challenges Larger capital/high fixed costs vs. site-built houses Transportation freight costs and restrictions For a more in-depth discussion see Sustainable Housing and Communities Industrialized Housing from the 2013 Canadian Housing Observer. 47
.")
48 HPAA Now Called the Housing Market Assessment (HMA) Report This quarterly release of the Housing Market Assessment (HMA) provides updated results regarding evidence of problematic housing market conditions in 15 Census Metropolitan Areas (CMAs). 48
49 Overvaluation Most Commonly Detected Problematic Condition This quarterly release of the Housing Market Assessment (HMA) provides updated results regarding evidence of problematic housing market conditions in 15 Census Metropolitan Areas (CMAs). The HMA points to strong overall evidence of problematic conditions in Toronto, Winnipeg, Saskatoon and Regina. In Toronto, it reflects a combination of price acceleration and overvaluation, while in Winnipeg, Saskatoon, and Regina it reflects detection of overvaluation and overbuilding. The most prevalent issue detected in 11 of the 15 centres covered by the HMA is overvaluation. The evidence of overvaluation has increased since the previous assessment in Toronto, Vancouver, Montréal, Edmonton, and Saskatoon as price levels are not fully supported by economic and demographic factors. Problematic overvaluation conditions in local housing markets could be resolved by moderation in house prices and/or improving economic conditions. See the full report: Housing Market Assessment: Canada Edition 49

50 Housing Data Find What You Need You may have noticed that the Observer format has changed and that the online data can now be found under Housing Market Information. Whether you are an occasional or heavy user, data is useful to validate your housing strategies and decisions with numeric evidence. 50
51 Consider Some Possible Uses of Housing Data Do you require demographic information to complete your municipal or housing development strategy? You may need average incomes, average sales or rents, or number of households in core housing need? Are you completing a needs and demand analysis for a funding proposal? Need information at your fingertips? You may wish to include average incomes, average rents, gender-based data, and the number of households in core housing need. When you meet with your board or association you can have data to back up your ideas. It can help you to understand your community composition. How many are seniors? How much do they spend on housing? How much do they earn; and, how many are in core housing need? You can tailor your outreach to vulnerable groups specific to your area. Perhaps lone-parent women in your location are more likely to be in core housing need. Data can assist you with forecasting and preparing for possible change. Will the population find a large number of seniors in the upcoming years requiring a certain type of housing or related services in your area? Data gives those reviewing funding proposals a clearer picture as to why you are requesting financial assistance. Examples of possible proposal topics could be as follows: the creation of a new affordable housing project, an upgrade to existing housing that may be in need of renovations or accessibility modifications, a conversion to housing from a non-residential use, the housing needs of victims of family violence, or rent subsidies for individuals and families in need. 51
52 To Access Housing Data, Visit: Data Tables Excel spreadsheets with timeline information, Housing in Canada Online (HiCO) an application that allows you to manipulate data for your own research purposes, Housing Market Information Portal a tool for custom research, Interactive Local Data Tables A range of housing information for over 160 municipalities to assist you with making informed decisions. If your town is not listed in the local data tables, you can make a request. Learn More about How to Use Our Data Tools with these Quick Start Videos: Housing in Canada Online (HiCO) (Video) The Housing Market Information Portal (Video) 52

53 Mortgage Arrears 53

54 Mortgage Arrears Nudged Downward Again in 2014 Mortgage arrears in Canada, defined as the percentage of residential mortgages that are delinquent for three months or more, fell slightly again on an annual average basis in 2014, to 0.29%, from 0.31% in However, this may be poised to change, as there was a marginal increase in the arrears rate in 2015 Q1. Regionally, arrears rates were much higher in the Atlantic provinces (0.59%) and Saskatchewan (0.40%); while the lowest arrears rate was observed in Ontario (0.17%) in 2015 Q1. 1 In comparison, the average arrears rate for prime fixed-rate mortgages in the United States (the most comparable mortgages to the overall Canadian mortgage market), was 1.01% in 2015 Q1. 2 While mortgage arrears in the U.S. have recovered significantly from their peak during the financial crisis, they have not yet reached pre-crisis levels, when they were similar to mortgage arrears rates in Canada. While the Canadian arrears rate is useful for observing overall trends, it has limitations, since it is an average of all residential mortgages from 10 financial institutions. 3 From a public policy perspective, it would be useful to have more detailed data from all lenders, to better understand differences in arrears rates between types of mortgage lenders (e.g. big vs. small) and types of mortgages (e.g. insured vs. uninsured; prime vs. non-prime). For example, data from the United States indicates differences in arrears by loan types: 8.53% for sub-prime loans, compared to 1.12% for prime-fixed rate loans in For more on Canadian and U.S. mortgage arrears, see the data table Canadian and U.S. Residential Mortgage Arrears 1 Canadian Bankers Association. 2 U.S. Mortgage Bankers Association. 3 These 10 financial institutions are estimated to currently account for approximately three-quarters of outstanding mortgage credit in Canada. 54
55 Canada: all residential mortgages (%) Canada: average (%) U.S.: prime fixed-rate mortgages (%) U.S.: average since (%) Q Sources: Canadian Bankers Association and U.S. Mortgage Bankers Association 55

56 Record Covered Bond Issuance of $27.6 Billion in
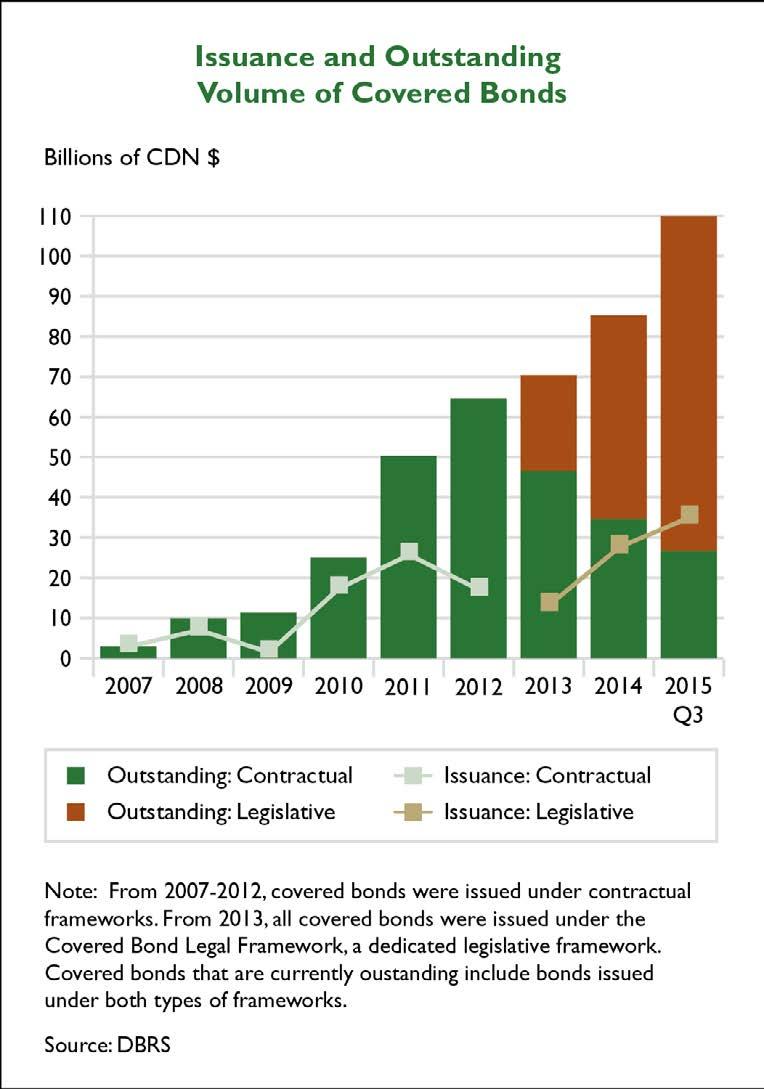
57 Record Covered Bond Issuance of $27.6 Billion in 2014 Covered bonds are debt obligations generally issued by large, regulated financial institutions and secured by a segregated pool of assets, with residential mortgages the most common asset type. After their introduction in Canada in 2007, there was rapid growth in the issuance of covered bonds. Issuance peaked at $25.7 billion in 2011, under the contractual framework that governed covered bonds from 2007 to 2012 (see grey line (Issuance: Contractual) in chart). Effective 2013, the Government of Canada established a dedicated legal framework for the future issuance of covered bonds. The Covered Bond Legal Framework has made the Canadian covered bonds market more robust, by improving investor certainty in regards to their asset, and by diversifying the investor pool, as some international investors who invest in covered bonds can only purchase those that are issued under a legislative framework. With the switch to the legislative framework there was an adjustment period for issuers. Issuance of covered bonds under the legislative framework began in mid-2013 (see light brown line (Issuance: Legislative) in chart), and surged to $27.6 billion in Issuance reached record high in 2015, with $35.0 billion issued since January. As of 2015 Q3, the total value of covered bonds outstanding stood at $109.6 billion, 76% of which is now under the legislative framework. (see brown bar (Outstanding: Legislative) in chart). Covered bonds provide a diversified funding source for lenders. Covered bonds issued under the legislative framework represent a private source of mortgage funding, as taxpayer-backed insured mortgages are prohibited as collateral assets in cover pools. The term lengths of covered bonds are mostly five-year, but have included seven-year and three-year terms. In the last two years, issuance of covered bonds has been predominately in Euros and U.S. Dollars, with a few issues also in Australian Dollars and British Pounds. Issuing bonds denominated in foreign currencies allows issuers to appeal to more foreign investors and hence achieve greater market depth in foreign markets. 57
58 58
59 Year Issuance and Outstanding Volume of Covered Bonds Issuance Contractual Billions of CDN ($) Issuance Legislative Outstanding Contractual Outstanding Legislative Total Q Note: From , covered bonds were issued under contractual frameworks. From 2013, all covered bonds were issued under the Covered Bond Legal Framework, a dedicated legislative framework. Covered bonds that are currently outstanding include bonds issued under both types of frameworks. Source: DBRS For more on mortgage funding sources in Canada, see the Housing Finance chapter of the 2014 Canadian Housing Observer More data on the covered bond market can be found in the data table Covered Bonds (xls) 59
60 LIST OF TABLES 1 Housing Market Indicators, Canada, Residential Building Permits, Canada, Provinces and Metropolitan Areas, (units) Residential Building Permits, Canada, Provinces and Metropolitan Areas, ($) (thousands) Total Housing Starts, Canada, Provinces and Metropolitan Areas, Total Residential Sales, Canada, Provinces and Metropolitan Areas, (units) Average Residential Price, Canada, Provinces and Metropolitan Areas, (dollars) Teranet - National Bank Composite House Price Index TM (2005 = 100) Occupied Housing Stock by Structure Type and Tenure, Canada, 2001, 2006 and 2011 (dwelling units) Dwelling Condition by Tenure and Period of Construction, Canada, Ownership Rate, Canada, Provinces, Territories and Metropolitan Ares, (per cent) Rental Vacancy Rate, Canada, Provinces and Metropolitan Areas, (per cent) Average Rent for Two-Bedroom Apartments, Canada, Provinces and Metropolitan Areas, (dollars) Seniors Rental Housing, Canada, Provinces and Metropolitan Areas, Secondary Rental Market, Selected Metropolitan Areas, Households by Age of Maintainer and Tenure, Canada, Households by Type and Tenure, Canada,

61 LIST OF TABLES 17 Housing Profile of One-person and Lone-parent Households by Gender, Canada, Household Growth Summary, Canada, Provinces, Territories and Census Metropolitan Areas, 2006 and Households in Core Housing Need, Canada, Provinces, Territories and Metropolitan Areas, Characteristics of Households in Core Housing Need, Canada, Real Median After-Tax Household Income, Canada, Provinces and Selected Metropolitan Areas, (2013 constant dollars) Home Equity and Net Worth by Tenure and Age Group, Canada, 1999, 2005 and 2012 (2012 constant dollars) Home Equity and Net Worth by Tenure, Canada and Provinces, 2012 (2012 constant dollars) Residential Mortgage Credit Outstanding, by Financial Institution Type, 2014 Q Q CMHC Mortgage Loan Insurance Highlights, 2014 Q Q Private Mortgage Securitization, 2014 Q Q Covered Bond Market, 2014 Q Q CMHC National Housing Act Mortgage-Backed Securities (NHA MBS) Program, 2014 Q Q CMHC Canada Mortgage Bonds (CMB) Program, 2014 Q Q Canada Mortgage Bonds (CMB) 5-Year Constant Maturity Spread over the Government of Canada Curve, (basis points) Canadian and U.S. Annual Residential Mortgage Arrears and Foreclosure Rates, 2014 Q Q
62 Table 1 Housing Market Indicators, Canada, Construction Starts, total 225, , , , , , , , , ,329 Single-detached 120, , ,917 93,202 75,659 92,554 82,392 83,657 76,893 75,515 Multiple 105, , , ,854 73,422 97, , , , ,814 Semi-detached 13,477 14,358 14,432 12,651 11,114 13,006 12,570 14,285 12,544 13,407 Row 22,134 20,963 23,281 20,868 13,908 19,857 19,447 20,976 19,993 21,448 Apartment 69,407 70,761 71,713 84,335 48,400 64,513 79,541 95,909 78,493 78,959 Starts by intended market 1, total 193, , , , , , , , , ,843 Homeownership - freehold 114, , ,730 94,871 78,617 97,085 91,250 93,521 82,778 82,985 Rental 17,210 18,518 18,605 18,265 16,237 19,735 20,721 21,990 24,267 25,308 Homeownership - condominium 60,251 61,817 61,595 73,574 34,382 48,506 61,605 77,693 62,794 62,869 Other (co-op and unknown) 2, , Completions, total 211, , , , , , , , , ,428 Residential Building Permits 4 238, , , , , , , , , ,448 Residential Building Permits($) (thousands) 4 34,526 36,613 40,735 35,568 29,253 37,720 38,530 42,229 41,936 44,413 Available Supply Newly completed and unabsorbed homes 2 10,115 12,230 11,632 15,340 13,791 15,048 15,600 17,388 17,636 16,991 Single- and semi-detached 5,029 5,786 6,292 8,566 5,515 5,810 6,121 6,657 7,080 6,797 Row and apartment 5,086 6,444 5,340 6,774 8,276 9,238 9,479 10,731 10,556 10,194 Rental vacancy rate (%) Rental availability rate (%) Vacancy Rate (Standard Spaces) in Seniors Rental 7 NA NA NA NA Housing Costs New Housing Price Index (% change) Teranet - National Bank House Price Index (% change) Consumer Price Index (% change) Construction Materials Cost Index (% change) Construction Wage Rate Index (% change) Owned accommodation costs (% change) Rental accommodation costs (% change) Average rent ($) 3 Bachelor One-bedroom Two-bedroom bedroom Demand Influences Population on July 1 (thousands) 4 32,242 32,571 32,888 33,246 33,629 34,005 34,343 34,751 35,155 35,544 Labour force participation rate (%) Employment (% change) Unemployment rate (%) Real disposable income (% change) NA 1-year mortgage rate (%) year mortgage rate (%) year mortgage rate (%) Net migration 5 203, , , , , , , , , ,097 Housing in GDP ($ millions) 4 Rent imputed to owners 103, , , , , , , , , ,079 Rent paid by tenants 36,203 37,943 40,115 42,287 44,239 46,048 47,964 50,170 52,495 54,854 Total housing-related spending in GDP 5 238, , , , , , , , , ,250 Total consumption-related spending (including repairs) 148, , , , , , , , , ,594 Total residential investment 89,359 98, , ,247 99, , , , , ,656 New construction (including acquisition costs) 43,322 47,082 51,101 50,970 39,782 48,428 49,862 57,289 56,459 57,129 Alterations and improvements 30,271 33,692 37,567 39,182 41,034 42,821 43,847 45,822 47,058 50,494 Transfer costs 15,766 17,386 20,201 17,095 18,850 19,991 22,331 22,612 23,486 26,033 1 Housing units in centres 10, Homeowner and Condominium housing units in centres 50,000+ for which construction has been completed but which have not been sold. 3 In privately initiated apartment structures with at least 3 units 4 Statistics Canada (CANSIM) 5 CMHC, adapted from Statistics Canada (CANSIM) 6 Teranet National Bank House Price Index TM 7 CMHC Seniors Housing Survey. Standard space: A space where the resident does not receive high-level care (that is, the resident receivesless than 1.5 hours of care per day) or is not required to pay an extra amount to receive high-level care. Regional terms for this type of space may vary across the country. Source: CMHC (Starts and Completions Survey, Market Absorption Survey, Rental Market Survey, Seniors Housing Survey); Bank of Canada (mortgage rates); Statistics Canada (CANSIM and custom tabulation of construction materials cost index); Teranet National Bank House Price Index TM For additional data, please refer to the CMHC website: 62
63 Table 2 Residential Building Permits, Canada, Provinces and Metropolitan Areas, (units) Canada 233, , , , , , , , , ,759 Provinces Newfoundland and Labrador 2,065 2,525 3,200 3,013 3,165 3,355 3,473 2,907 2,393 1,774 Prince Edward Island , Nova Scotia 5,854 5,150 4,216 4,370 5,054 5,070 5,197 3,954 3,739 4,128 New Brunswick 4,089 4,182 4,375 3,939 3,997 3,527 3,771 3,150 2,752 1,961 Quebec 49,109 51,786 52,469 45,340 53,579 53,890 51,262 42,493 41,300 38,485 Ontario 72,418 73,271 70,031 57,653 68,703 65,374 69,884 70,133 68,800 73,438 Manitoba 5,636 6,058 5,912 4,504 6,064 6,084 7,340 7,306 7,350 5,809 Saskatchewan 3,341 5,332 5,890 4,401 5,958 6,701 8,643 8,732 7,452 5,491 Alberta 50,514 47,277 27,779 22,235 26,292 28,590 33,807 39,892 41,737 38,831 British Columbia 38,835 40,932 30,110 18,607 28,984 25,745 27,214 28,046 28,709 36,798 Metropolitan Areas St. John s 1,419 1,731 2,019 1,973 1,895 2,034 1,979 1,749 1, Halifax 3,316 2,841 1,923 2,199 2,803 3,054 3,001 2,048 2,161 2,723 Moncton 1,437 1,493 1,274 1,060 1,384 1,322 1,368 1, Saint John Saguenay , ,013 1, Québec 4,864 6,114 5,877 6,595 7,324 5,950 6,958 4,910 5,357 5,472 Sherbrooke 1,669 1,333 1,729 1,762 1,709 1,762 1,748 1,677 1,361 1,476 Trois-Rivières 1,034 1,248 1,115 1,120 1,768 1,161 1, , Montréal 24,392 24,695 24,452 19,278 22,905 26,003 22,722 19,411 19,565 18,391 Gatineau 3,330 3,374 2,980 2,585 3,162 3,092 2,958 1,959 2,153 1,767 Ottawa 5,222 6,956 7,102 6,732 7,094 6,488 6,628 5,468 7,281 4,679 Kingston Peterborough Oshawa 2,924 2,235 2,059 1,104 1,949 2,160 1,692 1,736 1,829 2,729 Toronto 34,438 35,627 33,318 28,269 32,982 32,709 38,002 39,481 34,252 38,945 Hamilton 3,300 3,283 3,595 2,100 3,456 3,137 3,205 2,561 2,647 3,232 St. Catharines - Niagara 1,451 1,183 1, ,252 1,250 1,362 1,492 1,599 1,875 Kitchener-Cambridge-Waterloo 2,994 2,837 2,743 2,790 3,952 3,396 2,280 2,431 3,728 3,578 Brantford Guelph 922 1, , ,176 1,124 1,479 London 4,073 2,901 3,133 1,981 2,322 1,615 2,243 2,317 2,442 1,863 Windsor 1, ,159 Barrie 1,309 1,262 1, , Greater Sudbury/Grand Sudbury , Thunder Bay Winnipeg 3,729 3,849 3,457 2,370 3,898 3,909 4,616 4,470 5,428 4,197 Regina 1,104 1,185 1,459 1,190 1,121 1,926 2,865 3,085 2,218 1,598 Saskatoon 1,502 2,624 2,181 1,856 3,079 3,181 3,760 3,713 3,529 2,772 Calgary 18,784 15,225 8,365 7,529 8,682 11,605 12,819 17,159 16,014 15,414 Edmonton 14,550 15,016 7,299 7,789 10,166 10,410 12,783 14,211 16,684 17,109 Kelowna 2,238 2,951 1, , ,094 1,196 Abbotsford-Mission 1,210 1,107 1, ,145 Vancouver 21,095 22,803 14,781 10,028 17,814 17,384 18,645 19,982 18,830 25,267 Victoria 2,624 2,947 2,141 1,599 1,973 1,660 2,076 1,539 1,781 2,672 Source: Statistic Canada (CANSIM) For additional data, please refer to the CMHC website: 63
64 Table 3 Residential Building Permits, Canada, Provinces and Metropolitan Areas, ($) (thousands) Canada 36,613 40,735 35,568 29,253 37,720 38,530 42,229 41,936 44,413 46,323 Provinces Newfoundland and Labrador Prince Edward Island Nova Scotia New Brunswick Quebec 6,423 7,015 7,259 6,503 8,022 8,275 8,126 6,920 6,573 6,202 Ontario 12,802 14,003 12,823 10,801 13,641 14,040 15,334 15,153 16,794 18,697 Manitoba ,221 1,274 1,311 1,080 Saskatchewan ,000 1,279 1,677 1,639 1,429 1,034 Alberta 7,714 8,557 5,689 4,990 6,193 6,525 7,753 9,228 10,111 9,155 British Columbia 6,931 7,823 6,034 3,754 5,859 5,371 5,955 5,961 6,585 8,640 Metropolitan Areas St. John s Halifax Moncton Saint John Saguenay Québec Sherbrooke Trois-Rivières Montréal 3,454 3,577 3,635 3,060 3,809 4,224 3,934 3,403 3,226 3,100 Gatineau Ottawa 782 1,047 1, , ,114 1,626 1,125 Kingston Peterborough Oshawa Toronto 6,523 7,449 6,426 5,553 6,921 7,601 8,893 8,375 8,756 10,477 Hamilton St. Catharines - Niagara Kitchener-Cambridge-Waterloo Brantford Guelph London Windsor Barrie Greater Sudbury/Grand Sudbury Thunder Bay Winnipeg Regina Saskatoon Calgary 2,797 2,978 1,777 1,679 2,005 2,501 3,040 4,021 4,239 4,087 Edmonton 2,353 2,646 1,601 1,987 2,630 2,524 2,970 3,370 3,917 3,628 Kelowna Abbotsford-Mission Vancouver 3,903 4,352 2,938 2,056 3,605 3,608 4,190 4,273 4,385 6,064 Victoria Source: Statistic Canada (CANSIM) For additional data, please refer to the CMHC website: 64
65 Table 4 Total Housing Starts, Canada, Provinces and Metropolitan Areas, (units) Canada 227, , , , , , , , , ,535 Provinces Newfoundland and Labrador 2,234 2,649 3,261 3,057 3,606 3,488 3,885 2,862 2,119 1,697 Prince Edward Island Nova Scotia 4,896 4,750 3,982 3,438 4,309 4,644 4,522 3,919 3,056 3,825 New Brunswick 4,085 4,242 4,274 3,521 4,101 3,452 3,299 2,843 2,276 1,995 Quebec 47,877 48,553 47,901 43,403 51,363 48,387 47,367 37,758 38,810 37,926 Ontario 73,417 68,123 75,076 50,370 60,433 67,821 76,742 61,085 59,134 70,156 Manitoba 5,028 5,738 5,537 4,174 5,888 6,083 7,242 7,465 6,220 5,501 Saskatchewan 3,715 6,007 6,828 3,866 5,907 7,031 9,968 8,290 8,257 5,149 Alberta 48,962 48,336 29,164 20,298 27,088 25,704 33,396 36,011 40,590 37,282 British Columbia 36,443 39,195 34,321 16,077 26,479 26,400 27,465 27,054 28,356 31,446 Metropolitan Areas St. John s 1,275 1,480 1,863 1,703 1,816 1,923 2,153 1,734 1, Halifax 2,511 2,489 2,096 1,733 2,390 2,954 2,754 2,439 1,757 2,599 Moncton 1,416 1,425 1, ,400 1,194 1, Saint John Saguenay , Québec 5,176 5,284 5,457 5,513 6,652 5,445 6,416 4,680 4,449 5,442 Sherbrooke 1,305 1,318 1,627 1,580 1,656 1,575 1,741 1,496 1,128 1,367 Trois-Rivières 1,017 1,197 1,148 1,027 1,691 1,114 1, Montréal 22,813 23,233 21,927 19,251 22,001 22,719 20,591 15,632 18,672 18,744 Gatineau 2,933 2,788 3,304 3,116 2,687 2,420 2,759 1,924 1,903 1,584 Ottawa 5,875 6,506 6,998 5,814 6,446 5,794 6,026 6,560 5,762 4,972 Kingston Peterborough Oshawa 2,995 2,389 1, ,888 1,859 1,803 1,384 1,671 2,587 Toronto 37,080 33,293 42,212 25,949 29,195 39,745 48,105 33,547 28,929 42,287 Hamilton 3,043 3,004 3,529 1,860 3,562 2,462 2,969 2,709 2,832 2,054 St. Catharines - Niagara 1,294 1,149 1, ,086 1,110 1,137 1,223 1,479 1,737 Kitchener-Cambridge-Waterloo 2,599 2,740 2,634 2,298 2,815 2,954 2,900 1,840 4,450 3,212 Brantford Guelph , , ,064 1,141 London 3,674 3,141 2,385 2,168 2,079 1,748 2,240 2,163 1,983 2,104 Windsor 1, ,010 Barrie 1, , ,148 1,016 Greater Sudbury/Grand Sudbury Thunder Bay Winnipeg 2,777 3,371 3,009 2,033 3,244 3,331 4,065 4,705 4,248 4,400 Regina 986 1,398 1, ,347 1,694 3,093 3,122 2,223 1,597 Saskatoon 1,496 2,380 2,319 1,428 2,381 2,994 3,753 2,980 3,531 2,293 Calgary 17,046 13,505 11,438 6,318 9,262 9,292 12,841 12,584 17,131 13,033 Edmonton 14,970 14,888 6,615 6,317 9,959 9,332 12,837 14,689 13,872 17,050 Kelowna 2,692 2,805 2, ,013 1,311 1,280 Abbotsford-Mission 1,207 1,088 1, Vancouver 18,705 20,736 19,591 8,339 15,217 17,867 19,027 18,696 19,212 20,863 Victoria 2,739 2,579 1,905 1,034 2,118 1,642 1,700 1,685 1,315 2,008 Source: CMHC (Starts and Completions Survey) For additional data, please refer to the CMHC website: 65
66 Table 5 Total Residential Sales, Canada, Provinces and Metropolitan Areas, (units) Canada 482, , , , , , , , , ,410 Provinces Newfoundland and Labrador 3,537 4,471 4,695 4,416 4,236 4,480 4,650 4,303 4,100 4,251 Prince Edward Island 1,492 1,769 1,413 1,404 1,487 1,521 1,614 1,425 1,380 1,665 Nova Scotia 10,567 11,722 10,694 9,917 9,967 10,257 10,429 9,147 8,940 9,190 New Brunswick 7,125 8,161 7,555 7,003 6,702 6,599 6,403 6,282 6,273 6,682 Quebec 71,619 80,647 76,751 79,104 80,025 77,164 77,373 71,194 70,625 74,172 Ontario 194, , , , , , , , , ,560 Manitoba 13,018 13,900 13,432 13,058 13,115 13,882 13,911 13,735 13,782 14,021 Saskatchewan 9,531 12,540 10,538 11,095 10,872 13,131 13,867 13,535 13,863 12,374 Alberta 73,970 70,954 56,045 57,543 49,723 53,756 60,369 66,080 71,773 56,477 British Columbia 96, ,805 68,923 85,028 74,640 76,721 67,637 72,936 84, ,517 Metropolitan Areas St. John s 3,537 4,471 4,695 4,416 4,236 4,480 4,650 4,303 4,100 4,251 Halifax 6,267 7,042 6,242 5,897 5,782 5,989 6,081 5,045 4,750 4,829 Moncton 2,561 2,849 2,663 2,386 2,402 2,467 2,259 2,194 2,279 2,407 Saint John 1,852 2,253 2,166 1,986 1,751 1,572 1,610 1,588 1,591 1,679 Saguenay 1,645 1,651 1,537 1,502 1,514 1,404 1,450 1,185 1,144 1,116 Québec 7,538 8,002 7,873 7,994 7,100 7,241 7,219 6,273 6,469 6,623 Sherbrooke 1,892 2,011 1,855 1,890 1,838 1,882 1,784 1,665 1,650 1,660 Trois-Rivières 1,021 1,046 1,021 1, , ,117 1,079 Montréal 39,141 43,666 40,439 41,750 42,298 40,354 40,086 36,489 35,728 37,918 Gatineau 4,339 4,647 4,229 4,379 4,285 3,913 3,864 3,544 3,335 3,530 Ottawa 14,003 14,739 13,908 14,923 14,586 14,551 14,497 14,049 14,094 14,842 Kingston 3,517 3,725 3,473 3,377 3,209 3,179 3,321 3,165 2,982 3,166 Peterborough 2,714 2,880 2,506 2,458 2,537 2,507 2,553 2,539 2,578 3,006 Oshawa 9,354 10,217 8,797 9,328 9,479 9,604 10,288 10,019 10,343 11,368 Toronto 84,842 95,164 76,387 89,255 88,214 91,760 88,157 88,946 93, ,846 Hamilton 13,059 13,866 12,110 12,680 12,934 13,932 13,035 13,471 14,324 15,907 St. Catharines - Niagara 6,410 6,668 5,896 5,808 6,024 5,798 5,554 5,483 5,875 6,746 Kitchener-Cambridge-Waterloo 5,746 6,490 5,809 5,851 5,777 5,610 5,601 5,690 5,845 6,108 Brantford 2,139 2,305 2,097 1,884 2,086 1,971 1,983 2,094 2,075 2,384 Guelph 2,317 2,498 2,357 2,477 2,409 2,544 2,476 2,683 2,886 2,977 London 9,234 9,686 8,620 8,314 8,389 8,272 8,272 8,113 8,751 9,618 Windsor 5,047 4,987 4,546 4,661 4,893 4,946 5,082 5,341 5,332 6,322 Barrie 4,397 5,017 4,058 4,326 4,105 4,228 4,576 4,648 4,795 5,244 Greater Sudbury/Grand Sudbury 2,762 2,754 2,396 1,977 2,244 2,507 2,478 2,308 2,156 2,300 Thunder Bay 1,750 1,902 1,973 2,041 2,146 2,076 2,056 2,053 2,264 2,302 Winnipeg 11,594 12,319 11,854 11,509 11,572 12,297 12,094 12,088 12,147 12,267 Regina 2,953 3,957 3,338 3,704 3,581 3,899 3,952 3,692 3,726 3,426 Saskatoon 3,430 4,446 3,540 3,834 3,574 5,183 5,398 5,543 5,996 5,215 Calgary 33,027 32,176 23,136 24,880 20,996 22,466 26,634 29,954 33,615 23,994 Edmonton 21,984 20,427 17,369 19,139 16,403 16,963 17,641 19,552 19,857 18,227 Kelowna NA NA NA NA NA NA NA NA NA NA Abbotsford-Mission NA NA NA NA NA NA NA NA NA NA Vancouver 36,479 38,978 25,149 36,257 31,144 32,936 25,445 28,985 33,693 43,145 Victoria 7,500 8,403 6,171 7,660 6,169 5,773 5,460 5,691 6,371 7,868 CREA (MLS ) provides data for Canada, provinces excludes Québec, and CMAs outside Québec. The geographic definitions used by CREA differ from those used by Statistics Canada. The Centris provides data for Québec and CMAs inside Québec. Source: CREA (MLS ), Centris Statistics The Centris system contains all the listings of Québec real estate brokers. For additional data, please refer to the CMHC website: 66
67 Table 6 Average Residential Price, Canada, Provinces and Metropolitan Areas, (dollars) Canada 276, , , , , , , , , ,877 Provinces Newfoundland and Labrador 139, , , , , , , , , ,579 Prince Edward Island 125, , , , , , , , , ,533 Nova Scotia 167, , , , , , , , , ,688 New Brunswick 126, , , , , , , , , ,400 Quebec 191, , , , , , , , , ,302 Ontario 277, , , , , , , , , ,194 Manitoba 150, , , , , , , , , ,375 Saskatchewan 132, , , , , , , , , ,983 Alberta 286, , , , , , , , , ,138 British Columbia 390, , , , , , , , , ,627 Metropolitan Areas St. John s 139, , , , , , , , , ,579 Halifax 201, , , , , , , , , ,679 Moncton 128, , , , , , , , , ,601 Saint John 128, , , , , , , , , ,572 Saguenay 114, , , , , , , , , ,557 Québec 161, , , , , , , , , ,569 Sherbrooke 166, , , , , , , , , ,014 Trois-Rivières 115, , , , , , , , , ,349 Montréal 231, , , , , , , , , ,487 Gatineau 172, , , , , , , , , ,264 Ottawa 257, , , , , , , , , ,477 Kingston 212, , , , , , , , , ,375 Peterborough 213, , , , , , , , , ,847 Oshawa 258, , , , , , , , , ,842 Toronto 352, , , , , , , , , ,046 Hamilton 248, , , , , , , , , ,493 St. Catharines - Niagara 194, , , , , , , , , ,425 Kitchener-Cambridge-Waterloo 237, , , , , , , , , ,269 Brantford 198, , , , , , , , , ,059 Guelph 245, , , , , , , , , ,573 London 190, , , , , , , , , ,370 Windsor 164, , , , , , , , , ,664 Barrie 244, , , , , , , , , ,203 Greater Sudbury/Grand Sudbury 150, , , , , , , , , ,303 Thunder Bay 122, , , , , , , , , ,922 Winnipeg 154, , , , , , , , , ,270 Regina 131, , , , , , , , , ,609 Saskatoon 160, , , , , , , , , ,727 Calgary 346, , , , , , , , , ,814 Edmonton 250, , , , , , , , , ,536 Kelowna NA NA NA NA NA NA NA NA NA NA Abbotsford-Mission NA NA NA NA NA NA NA NA NA NA Vancouver 509, , , , , , , , , ,801 Victoria 427, , , , , , , , , ,616 CREA (MLS ) provides data for Canada, provinces excludes Québec, and CMAs outside Québec. The geographic definitions used by CREA differ from those used by Statistics Canada. The Centris provides data for Québec and CMAs inside Québec. The Centris system contains all the listings of Québec real estate brokers. NA = Not available Source: CREA (MLS ), Centris Statistics 67
68 Table 7 Teranet - National Bank National Composite House Price Index (June 2005 = 100) Canada Halifax Québec Montréal Ottawa - Gatineau Toronto Hamilton Winnipeg Calgary Edmonton Vancouver Victoria Teranet and National Bank of Canada, all rights reserved. Data as of December of each year. For additional data, please refer to the CMHC website: 68
69 Table 8 Occupied Housing Stock by Structure Type and Tenure, Canada, 2001, 2006 and 2011 (dwelling units) Owned Rented Band Total Owned Rented Band Total Owned Rented Band Total Total 7,610,390 3,907,170 45,415 11,562,975 8,509,780 3,878,500 49,180 12,437,470 9,185,845 4,078,230 55,180 13,319,250 Singledetached 5,972, ,950 41,135 6,635,065 6,329, ,550 43,210 6,879,965 6,732, ,090 47,900 7,327,785 house Semidetached 395, , , , ,385 1, , , ,215 1, ,015 house Row house 340, , , , ,335 1, , , ,870 2, ,795 Apartment detached 154, , , , , , , , ,150 duplex Apartment building that has five or 213, , ,049, , , ,112, , , ,234,715 more storeys Apartment building that has fewer than five 386,165 1,696, ,083, ,850 1,779, ,288, ,760 1,839, ,391,160 storeys Other singleattached 16,850 24, ,845 18,865 18, ,735 15,350 16, ,845 house Movable dwelling 130,470 24,165 1, , ,085 23,385 2, , ,705 25,640 2, ,795 The sum of individual categories may not always add up to the total as a result of rounding. Source: Statistics Canada (Census of Canada) for 1996, 2001 and Statistics Canada (National Household Survey) for For additional data, please refer to the CMHC website: 69
70 Table 9 Dwelling Condition by Tenure and Period of Construction, Canada, 2011 Tenure and Period of Construction Total Occupied Dwellings In Need of Regular Maintenance Only Dwelling Condition In Need of Minor Repairs In Need of Major Repairs Number Per Cent Number Per Cent Number Per Cent Total 13,319,250 9,026, ,310, , or before 1,516, , , , ,756,965 1,009, , , ,757,155 1,094, , , ,395,555 1,528, , , ,112,115 1,452, , , , , , , , , , , ,031, , , , ,042, , , , Owned 9,185,845 6,288, ,309, , or before 1,016, , , , ,130, , , , , , , , ,592,000 1,002, , , ,467,910 1,002, , , , , , , , , , , , , , , , , , , Rented 4,078,225 2,724, , , or before 499, , , , , , , , , , , , , , , , , , , , , , , , , , , , , , , , , , , , Band 55,180 14, , , or before , , , , , ,295 2, , , ,465 1, , , ,145 1, , , ,200 2, , , ,445 4, , , The sum of individual categories may not always add up to the total as a result of rounding. Source: Statistics Canada (National Household Survey) For additional data, please refer to the CMHC website: 70
71 Table 10 Ownership Rates, Canada, Provinces, Territories and Metropolitan Areas, (per cent) Canada Provinces and Territories Newfoundland and Labrador Prince Edward Island Nova Scotia New Brunswick Quebec Ontario Manitoba Saskatchewan Alberta British Columbia Yukon Northwest Territories Nunavut 2 NA NA NA NA NA NA Metropolitan Areas St. John s Halifax Moncton Saint John Saguenay Québec Sherbrooke Trois-Rivières Montréal Gatineau Ottawa Kingston Peterborough Oshawa Toronto Hamilton St. Catharines - Niagara Kitchener-Cambridge-Waterloo Brantford Guelph London Windsor Barrie Greater Sudbury/Grand Sudbury Thunder Bay Winnipeg Regina Saskatoon Calgary Edmonton Kelowna Abbotsford-Mission Vancouver Victoria Ownership rates are computed as owners divided by total of all tenure types. Census Metropolitan Area data for are based on 1986 CMA boundaries. All other data for Census Metropolitan Areas have not been adjusted for boundary changes. 2 In 1996 and prior years, the Northwest Territories included Nunavut. Source: CMHC, adapted from Statistics Canada (Census of Canada and National Household Survey) 71
72 Table 11 Rental Vacancy Rate, Canada, Provinces and Metropolitan Areas, (per cent) Canada Provinces Newfoundland and Labrador Prince Edward Island Nova Scotia New Brunswick Quebec Ontario Manitoba Saskatchewan Alberta British Columbia Metropolitan Area St. John s Halifax Moncton Saint John Saguenay Québec Sherbrooke Trois-Rivières Montréal Gatineau Ottawa Kingston Peterborough Oshawa Toronto Hamilton St. Catharines - Niagara Kitchener-Cambridge-Waterloo Brantford Guelph London Windsor Barrie Greater Sudbury/Grand Sudbury Thunder Bay Winnipeg Regina Saskatoon Calgary Edmonton Kelowna Abbotsford-Mission Vancouver Victoria Average of Metropolitan Areas In privately initiated apartment structures with at least three rental units 2 Prior to 2002, Kingston and Abbotsford are not included in the average of metropolitan areas. Prior to 2007, Moncton, Peterborough, Brantford, Guelph, Barrie, and Kelowna are not included in the average of metropolitan areas. Source: CMHC (Rental Market Survey) For additional data, please refer to the CMHC website: 72
73 Table 12 Average Rent for Two-Bedroom Apartments, Canada, Provinces and Metropolitan Areas, (dollars) Canada Provinces Newfoundland and Labrador Prince Edward Island Nova Scotia New Brunswick Quebec Ontario ,002 1,033 1,059 1,086 1,121 Manitoba ,012 Saskatchewan ,048 1,051 Alberta 866 1,008 1,074 1,042 1,034 1,042 1,083 1,157 1,238 1,251 British Columbia ,001 1,019 1,050 1,073 1,087 1,112 1,155 Metropolitan Areas St. John s Halifax ,005 1,048 Moncton Saint John Saguenay Québec Sherbrooke Trois-Rivières Montréal Gatineau Ottawa ,028 1,048 1,086 1,115 1,132 1,132 1,174 Kingston ,005 1,054 1,070 1,096 Peterborough Oshawa ,010 1,035 Toronto 1,067 1,061 1,095 1,096 1,123 1,149 1,183 1,213 1,251 1,288 Hamilton ,034 St. Catharines - Niagara Kitchener-Cambridge-Waterloo Brantford Guelph ,027 London Windsor Barrie ,001 1,037 1,048 1,118 1,167 Greater Sudbury/Grand Sudbury Thunder Bay Winnipeg ,016 1,045 Regina ,018 1,079 1,097 Saskatoon ,002 1,041 1,091 1,087 Calgary 960 1,089 1,148 1,099 1,069 1,084 1,150 1,224 1,322 1,332 Edmonton ,034 1,015 1,015 1,034 1,071 1,141 1,227 1,259 Kelowna ,002 Abbotsford-Mission Vancouver 1,045 1,084 1,124 1,169 1,195 1,237 1,261 1,281 1,311 1,368 Victoria ,001 1,024 1,045 1,059 1,068 1,095 1,128 1 In privately initiated apartment structures with at least three rental units 2 Only includes provincial data Source: CMHC (Rental Market Survey) For additional data, please refer to the CMHC website: 73
74 Table 13 Seniors Rental Housing 1 Canada, Provinces and Metropolitan Areas, Average Rent for Standard 2 Standard Spaces 2 Vacancy Rate of Standard Bachelor/Private Rooms with Spaces 2 (%) Meals included in Rent ($) Canada 3 167, , , , ,969 1,995 2,043 2,107 Provinces Newfoundland and Labrador 1,028 1, ** ** 2,105 ** Prince Edward Island ** 2,608 2,386 2,782 ** Nova Scotia 1,165 1,322 1,410 1, ,368 2,559 2,707 2,796 New Brunswick 1,243 1,540 2, ** 2,240 1,883 2,395 ** Quebec 90,722 87,679 90,038 89, ,405 1,453 1,497 1,521 Ontario 43,061 44,899 41,358 40, ,744 2,789 2,776 2,815 Manitoba 3,215 3,598 3,545 3, ,730 1,779 1,815 2,165 Saskatchewan 3,782 4,345 3,806 4, ,260 2,337 2,536 2,526 Alberta 6,824 6,765 6,891 7, ,211 2,351 2,329 2,515 British Columbia 15,369 15,610 16,609 16, ,991 2,045 2,021 2,035 Metropolitan Areas St. John s ** ** 2,308 ** Halifax ,433 2,571 2,666 2,798 Moncton ** ** 2,523 ** Saint John ** ** 3.6 ** ** ** 2,188 ** Saguenay 2,337 2,341 2,125 2, ,150 1,172 1,246 1,244 Québec 11,338 10,828 10,637 11, ,552 1,549 1,692 1,675 Sherbrooke 3,592 3,659 3,672 3, ,197 1,283 1,308 1,367 Trois-Rivières 3,090 3,419 3,865 3, ,311 1,305 1,575 1,596 Montréal 37,961 35,688 36,897 36, ,585 1,668 1,650 1,677 Gatineau 2,843 2,432 2,852 2, ,671 1,840 1,770 1,818 Ottawa 5,441 5,433 4,080 5, ,991 2,991 3,017 3,134 Kingston ,910 2,851 2,985 2,992 Peterborough ,943 2,840 2,895 2,704 Oshawa 1,285 1,221 1,258 1, ,928 2,958 2,972 3,246 Toronto 11,102 12,213 11,818 10, ,173 3,266 3,206 3,198 Hamilton 2,732 2,813 2,519 2, ,794 2,927 2,862 2,859 St. Catharines - Niagara 1,759 1,986 1,294 1, ,494 2,575 2,262 2,402 Kitchener-Cambridge-Waterloo 2,046 1,884 2,006 2, ,797 2,871 2,979 3,021 Brantford ,495 2,581 2,639 2,689 Guelph ,981 2,700 2,981 2,933 London 1,896 1,886 1,838 1, ,815 2,846 2,839 2,861 Windsor 1,403 1,409 1,121 1, ,442 2,516 2,492 2,588 Barrie ,682 2,688 2,746 2,697 Greater Sudbury/Grand Sudbury ,290 2,448 2,420 ** Thunder Bay ** ** ** ** ** ** ** ** Winnipeg 2,939 3,269 3,134 3, ,643 1,606 1,627 2,052 Regina 903 1, , ,796 2,781 3,105 3,091 Saskatoon 1,400 1,560 1,307 1, ,389 2,329 2,636 2,600 Calgary 2,664 2,720 2,617 2, ,435 2,622 2,789 2,860 Edmonton 2,481 2,237 2,506 2, ,109 2,189 1,855 2,311 Kelowna 1,473 1,535 1,532 1, ,754 1,727 1,792 1,832 Abbotsford-Mission ** ** ** ** Vancouver 5,735 5,770 6,434 6, ,228 2,410 2,270 2,250 Victoria 2,295 2,197 2,238 1, ,184 2,171 2,146 2,201 1 The Seniors' Housing Survey targets only residences that have at least one unit that is not subsidized, have been in operation for at least one year, have at least 10 rental units (in Quebec, Ontario and the Prairies) or 5 rental units (in the Atlantic provinces and B.C.), offer an on-site meal plan, do not mandate high levels of health care (defined as 1.5 hours or more of care per day) to all of its residents (nursing homes and long-term care homes are examples of residences that were not included in the survey), offer rental units; life lease units and owner-occupied units are excluded from this survey, and have at least 50 per cent of its residents who are 65 years of age or older. 2 Standard space: A space where the resident does not receive high-level care (that is, the resident receivesless than 1.5 hours of care per day) or is not required to pay an extra amount to receive high-level care. Regional terms for this type of space may vary across the country. 3 Only includes provincial data. ** Data suppressed to protect confidentiality or data not statistically reliable Source: CMHC (Seniors' Housing Survey) For additional data, please refer to the CMHC website: 74
75 Table 14 Secondary Rental Market 1, Selected Metropolitan Areas Rented Condominium Apartments Units Metropolitan Areas St. John s N/A N/A N/A N/A N/A N/A N/A N/A Halifax N/A N/A N/A N/A N/A N/A N/A N/A Québec 18,526 19,092 20,326 21,718 23,466 25,642 28,294 30,715 Montréal 88,488 93, , , , , , ,389 Ottawa 19,669 20,999 21,860 24,206 26,134 26,216 27,844 29,598 Toronto 217, , , , , , , ,364 Barrie N/A N/A N/A N/A N/A N/A N/A N/A Winnipeg N/A N/A N/A N/A 13,289 13,863 14,345 15,241 Regina N/A 2,590 2,662 2,904 3,863 5,231 5,616 6,404 Saskatoon N/A 7,260 7,413 8,169 8,318 8,772 9,417 9,897 Calgary 30,109 33,055 36,824 40,473 42,361 47,156 49,204 52,981 Edmonton 28,104 32,698 34,797 39,413 41,183 40,597 42,452 44,352 Kelowna N/A N/A N/A N/A N/A N/A N/A N/A Abbotsford-Mission N/A N/A N/A N/A N/A N/A N/A N/A Vancouver 140, , , , , , , ,824 Victoria N/A 19,017 20,486 21,582 21,928 22,319 22,760 23,126 Vacancy Rate (%) St. John s N/A N/A N/A N/A N/A N/A N/A N/A Halifax N/A N/A N/A N/A N/A N/A N/A N/A Québec Montréal Ottawa Toronto Barrie N/A N/A N/A N/A N/A N/A N/A N/A Winnipeg N/A N/A N/A N/A Regina N/A Saskatoon N/A Calgary Edmonton Kelowna N/A N/A N/A N/A N/A N/A N/A N/A Abbotsford-Mission N/A N/A N/A N/A N/A N/A N/A N/A Vancouver Victoria N/A Average Rent ($) St. John s N/A N/A N/A N/A N/A N/A N/A N/A Halifax N/A N/A N/A N/A N/A N/A N/A N/A Québec ,038 Montréal 1,054 1,043 1,040 1,125 1, ,124 1,146 Ottawa 1,102 1,093 1,135 1,182 1,247 1,258 1,400 1,421 Toronto 1,443 1,483 1,399 1,497 1,508 1,526 1,672 1,709 Barrie N/A N/A N/A N/A N/A N/A N/A N/A Winnipeg N/A N/A N/A N/A ** 1,134 1,265 1,077 Regina N/A N/A N/A N/A N/A N/A N/A N/A Saskatoon N/A N/A N/A N/A N/A N/A N/A N/A Calgary 1,158 1,244 1,256 1,355 1,378 1,288 1,356 1,415 Edmonton 953 1,028 1,056 1,001 1,084 1,186 1,146 1,158 Kelowna N/A N/A N/A N/A N/A N/A N/A N/A Abbotsford-Mission N/A N/A N/A N/A N/A N/A N/A N/A Vancouver 1,290 1,334 1,308 1,460 1,474 1,499 1,521 1,540 Victoria N/A 1,049 1,152 ** 1,190 1,296 1,245 1,289 75
76 Table 14 Secondary Rental Market 1, Selected Metropolitan Areas (continued) Other Secondary Rental Market Units (excluding Condominiums) Estimated Households Metropolitan Areas St. John s 13,896 12,687 12,896 14,617 17,682 17,836 17,984 18,138 Halifax 15,321 14,108 15,739 13,514 14,506 14,702 14,900 15,096 Québec 28,906 30,336 28,462 21,198 21,816 21,483 21,147 20,814 Montréal 187, , , , , , , ,831 Ottawa 36,465 35,433 34,118 33,998 36,756 35,557 34,359 33,160 Toronto 134, , , , , , , ,432 Barrie 5,977 6,714 6,168 6,136 7,510 7,518 7,529 7,537 Winnipeg N/A N/A N/A N/A 22,344 22,517 22,685 23,077 Regina N/A 8,622 7,795 9,891 9,870 10,235 10,595 10,977 Saskatoon N/A 11,766 11,076 13,124 12,567 21,615 30,660 31,766 Calgary 49,052 47,764 47,893 53,312 59,798 62,103 64,405 66,607 Edmonton 43,856 46,310 47,713 47,073 52,211 54,050 55,887 58,015 Kelowna 8,167 7,634 8,063 8,719 9,115 9,177 9,243 9,305 Abbotsford-Mission 7,909 7,161 7,285 8,322 8,210 8,279 8,347 8,416 Vancouver 97, ,050 95,328 99, , , , ,623 Victoria N/A 17,949 18,292 19,471 20,033 20,311 20,589 20,867 Average Rent ($) Metropolitan Areas St. John s Halifax ,033 Québec Montréal Ottawa 957 1,009 1,063 1,072 1,141 1,168 1,201 1,259 Toronto 1,021 1,109 1,130 1,201 1,289 1,347 1,384 1,420 Barrie 981 1,041 1,046 1,081 1,143 1,152 1,173 1,184 Winnipeg N/A N/A N/A N/A ,026 Regina N/A 764 ** 832 1,001 1,000 1,026 1,243 Saskatoon N/A ,009 Calgary 1,045 1,125 1,155 1,141 1,216 1,232 1,340 1,449 Edmonton 925 1,078 1,049 1,106 ** 1,263 1,281 1,326 Kelowna 962 1,092 1,086 1,106 1,145 1,180 1,366 1,279 Abbotsford-Mission ,088 1,013 1,035 Vancouver 984 1,069 1,101 1,149 1,256 1,311 1,230 1,312 Victoria N/A 1,029 1,081 1,037 1,170 1,150 1,165 1,180 ** Data suppressed to protect confidentiality or data not statistically reliable N/A: Not applicable Source: CMHC Secondary Rental Market 76
77 Table 15 Households by Age of Maintainer and Tenure, Canada, Total Households , , , , , , , , , ,262,315 1,678,965 2,036,370 2,124,040 2,219,995 2,045,210 1,792,025 1,782,270 1,912, ,250,530 1,339,425 1,589,410 1,971,475 2,363,020 2,630,170 2,747,615 2,591,890 2,388, ,172,285 1,305,650 1,370,800 1,412,515 1,666,415 2,102,365 2,509,625 2,829,775 3,023, ,825 1,079,005 1,215,890 1,327,005 1,379,945 1,434,725 1,659,775 2,130,820 2,560, , , ,740 1,021,305 1,168,255 1,280,605 1,324,885 1,387,285 1,620, , , , , , ,510 1,081,880 1,258,805 1,354,635 Total 6,034,505 7,166,095 8,281,535 8,991,670 10,018,265 10,820,050 11,562,975 12,437,470 13,319,250 Owners , , ,180 88,815 64,625 61,670 70,990 96, , , ,895 1,064,390 1,029,220 1,043, , , ,485 1,002, , ,750 1,142,890 1,374,245 1,606,665 1,741,120 1,844,450 1,797,405 1,651, , ,265 1,037,395 1,062,030 1,246,970 1,555,580 1,868,280 2,135,865 2,259, , , , ,245 1,041,660 1,093,570 1,276,610 1,654,860 1,973, , , , , , , ,030 1,056,105 1,233, , , , , , , , , ,290 Total 3,636,925 4,431,230 5,141,935 5,580,875 6,273,030 6,877,780 7,610,390 8,509,780 9,185,845 Renters , , , , , , , , , , , ,985 1,083,920 1,168,780 1,098, , , , , , , , , , , , , , , , , , , , , , , , , , , , , , , , , , , , , , , , , , , , , , , , ,150 Total 2,397,580 2,734,860 3,139,595 3,368,485 3,718,525 3,905,145 3,907,170 3,878,500 4,078,230 Avg. Household Size Total household counts for include households on-reserve (1986) or in band housing (1991, 1996, 2001, 2006, 2011) and are therefore larger than the sum of owners and renters. The sum of individual categories may not always add up to the total as a result of rounding. Source: Statistics Canada (Census of Canada) for 1971, 1976, 1981, 1986, 1991, 1996, 2001 and Statistics Canada (National Household Survey) for
78 Table 16 Households by Type and Tenure, Canada, Total Households All household types 6,034,505 7,166,095 8,281,535 8,991,670 10,018,265 10,820,050 11,562,975 12,437,470 13,319,250 Family households 4,928,130 5,633,945 6,231,485 6,634,995 7,235,230 7,685,470 8,155,560 8,651,330 9,110,430 One-family households 4,807,010 5,542,295 6,140,330 6,537,880 7,118,660 7,540,625 7,951,960 8,421,050 8,849,655 Couples with children 3,028,315 3,266,655 3,523,205 3,604,045 3,729,800 3,853,800 3,857,620 3,902,390 3,952,105 Couples without children 1,354,970 1,759,510 1,948,700 2,130,935 2,485,115 2,608,435 2,910,180 3,242,530 3,547,075 Lone parents 423, , , , ,745 1,078,385 1,184,165 1,276,130 1,350,485 Multiple-family households 121,120 91,655 91,160 97, , , , , ,775 Non-family households 1,106,375 1,532,150 2,050,045 2,356,675 2,783,035 3,134,580 3,407,415 3,786,130 4,208,820 One person only 810,395 1,205,340 1,681,130 1,934,710 2,297,060 2,622,180 2,976,880 3,327,045 3,662,800 Two or more persons 295, , , , , , , , ,015 Owners All household types 3,636,925 4,431,230 5,141,935 5,580,875 6,273,030 6,877,780 7,610,385 8,509,780 9,185,845 Family households 3,220,840 3,918,915 4,465,250 4,755,765 5,240,405 5,626,670 6,145,835 6,737,530 7,144,225 One-family households 3,124,275 3,842,355 4,390,265 4,677,435 5,145,490 5,511,500 5,985,695 6,550,125 6,930,885 Couples with children 2,095,895 2,488,795 2,807,650 2,868,915 2,975,720 3,083,980 3,148,020 3,268,070 3,302,090 Couples without children 820,960 1,106,650 1,267,930 1,445,650 1,765,205 1,954,540 2,239,700 2,581,035 2,867,825 Lone parents 207, , , , , , , , ,975 Multiple-family households 96,560 76,560 74,985 78,330 94, , , , ,335 Non-family households 416, , , ,110 1,032,630 1,251,110 1,464,555 1,772,240 2,041,625 One person only 299, , , , ,310 1,050,520 1,307,170 1,590,125 1,815,135 Two or more persons 116, , , , , , , , ,490 Renters All household types 2,397,580 2,734,860 3,139,595 3,368,485 3,718,525 3,905,145 3,907,170 3,878,500 4,078,230 Family households 1,707,290 1,715,035 1,766,240 1,845,340 1,972,740 2,028,420 1,972,310 1,874,090 1,921,895 One-family households 1,682,735 1,699,940 1,750,065 1,828,435 1,952,400 2,000,890 1,933,895 1,837,590 1,881,985 Couples with children 932, , , , , , , , ,650 Couples without children 534, , , , , , , , ,075 Lone parents 216, , , , , , , , ,260 Multiple-family households 24,555 15,095 16,170 16,900 20,340 27,530 38,415 36,500 39,905 Non-family households 690,290 1,019,825 1,373,355 1,523,145 1,745,785 1,876,725 1,934,860 2,004,410 2,156,330 One person only 510, ,865 1,141,935 1,260,065 1,445,450 1,566,635 1,662,845 1,728,725 1,838,675 Two or more persons 179, , , , , , , , ,655 Total household counts for include households in on-reserve (1986) or band housing (1991, 1996, 2001, 2006, 2011) and are therefore larger than the sum of owners and renters. Because of changes to the definition of census family, household-type data for 2001, 2006 and 2011 except for one-person households is not strictly comparable to data from earlier censuses. The sum of individual categories may not always add up to the total as a result of rounding. Source: Statistics Canada (Census of Canada) for 1971, 1976, 1981, 1986, 1991, 1996, 2001 and Statistics Canada (National Household Survey) for
79 Table 17 Housing Profile of One-person and Lone-parent Households by Gender, Canada, 2011 Total households 1 All private households One-person households 79 Lone-parent households Total Female Male Total Female Male Number of households 13,319,255 3,662,800 1,994,855 1,667,950 1,350,485 1,073, ,635 Average household income before taxes in 2010 ($) 79,102 40,054 36,447 44,369 57,875 53,822 73,606 Average household income after taxes in 2010 ($) 66,149 33,702 31,345 36,521 50,973 48,176 61,830 Average monthly shelter costs ($) 2 1, ,015 1,002 1,068 Single-detached houses 7,327,785 1,184, , , , , ,290 Semi-detached houses 662, ,725 82,470 54,250 98,345 82,075 16,275 Row houses 799, , ,855 70, , ,170 20,365 Duplex apartments 688, , ,065 99,165 86,670 68,560 18,115 Apartments in buildings that have fewer than five storeys 2,391,160 1,230, , , , ,960 43,790 Apartments in buildings that have five or more storeys 1,234, , , , ,730 97,255 14,470 Other dwellings 3 215,640 74,340 33,765 40,575 21,755 16,425 5,330 Part of a condominium 1,615, , , , , ,280 25,210 Owner households Number of households 9,185,850 1,815,135 1,012, , , , ,065 Average household income before taxes in 2010 ($) 94,049 49,208 44,323 55,367 70,991 67,050 83,343 Average household income after taxes in 2010 ($) 77,731 40,543 37,318 44,609 61,237 58,731 69,089 Average monthly shelter costs ($) 2 1, ,133 1,130 1,142 Single-detached houses 6,732,800 1,039, , , , , ,335 Semi-detached houses 504,225 95,470 60,665 34,810 61,770 50,460 11,310 Row houses 520, ,635 88,335 44,300 70,560 59,905 10,655 Duplex apartments 347,440 71,805 39,095 32,710 35,670 26,865 8,800 Apartments in buildings that have fewer than five storeys 550, , ,020 93,935 43,850 35,460 8,395 Apartments in buildings that have five or more storeys 358, , ,410 64,475 24,160 20,560 3,600 Other dwellings 3 171,055 55,495 25,955 29,540 15,525 11,565 3,960 Part of a condominium 1,153, , , ,610 99,285 83,720 15,565 Homeowners with mortgages 4 5,297, , , , , , ,055 Homeowners without mortgages 4 3,755, , , , , ,485 61,730 Renter households Number of households 4,078,230 1,838, , , , ,660 89,600 Average household income before taxes in 2010 ($) 45,969 31,127 28,363 34,274 41,198 38,653 55,018 Average household income after taxes in 2010 ($) 40,432 27,029 25,214 29,098 37,916 36,064 47,972 Average monthly shelter costs ($) Single-detached houses 547, ,620 60,555 77,065 96,695 78,375 18,315 Semi-detached houses 156,215 40,870 21,635 19,235 36,210 31,320 4,890 Row houses 276,870 61,790 36,185 25,605 82,495 72,870 9,620 Duplex apartments 340, ,285 69,910 66,375 50,920 41,615 9,300 Apartments in buildings that have fewer than five storeys 1,839, , , , , ,390 35,370 Apartments in buildings that have five or more storeys 875, , , ,110 87,575 76,705 10,870 Other dwellings 3 42,045 18,330 7,630 10,705 5,615 4,385 1,230 Part of a condominium 461, ,125 98,580 91,545 56,000 46,410 9,595 Living in subsidized housing 560, , , , , ,460 9,760 1 Where band housing is present, total household counts are larger than the sum of owner and renter households. 2 The National Household Survey does not collect shelter costs for households living in band housing or for farm operators. For renters, shelter costs include rent and any payments for electricity, fuel, water and other municipal services. For owners, shelter costs include mortgage payments (principal and interest), property taxes, and any condominium fees, along with payments for electricity, fuel, water and other municipal services. 3 Other dwellings comprise other single-attached houses, mobile homes, and other movable dwellings. 4 Mortgage data exclude farm operators. Source: Statistics Canada (National Household Survey) For additional data, please refer to the CMHC website:
80 Table 18 Household Growth Summary Canada, Provinces, Territories and Census Metropolitan Areas, Growth (per cent) Avg. Annual Growth Canada 12,435,520 13,320, ,019 Provinces and Territories Newfoundland and Labrador 197, , ,319 Prince Edward Island 53,084 56, Nova Scotia 376, , ,690 New Brunswick 295, , ,627 Quebec 3,188,713 3,395, ,326 Ontario 4,554,251 4,887, ,651 Manitoba 448, , ,474 Saskatchewan 387, , ,497 Alberta 1,256,192 1,390, ,817 British Columbia 1,642,715 1,764, ,384 Yukon 12,615 14, Northwest Territories 14,224 14, Nunavut 7,855 8, Census Metropolitan Areas St. John s 70,663 78, ,659 Halifax 155, , ,003 Moncton 51,593 58, ,340 Saint John 49,107 52, Saguenay 66,251 69, Québec 318, , ,578 Sherbrooke 84,605 91, ,299 Trois-Rivières 65,153 70, Montréal 1,525,625 1,613, ,527 Ottawa-Gatineau 450, , ,661 Kingston 61,978 65, Peterborough 46,667 48, Oshawa 119, , ,134 Toronto 1,801,071 1,989, ,727 Hamilton 266, , ,162 St. Catharines-Niagara 156, , Kitchener-Cambridge-Waterloo 169, , ,486 Brantford 47,847 52, Guelph 51,116 54, London 184, , ,022 Windsor 125, , Barrie 63,877 68, Greater Sudbury / Grand Sudbury 65,076 67, Thunder Bay 51,426 52, Winnipeg 281, , ,914 Regina 80,323 85, ,082 Saskatoon 95, , ,796 Calgary 415, , ,682 Edmonton 405, , ,095 Kelowna 66,925 74, ,603 Abbotsford-Mission 55,948 59, Vancouver 817, , ,861 Victoria 145, , ,588 Data for 2006 are based on 2011 Census Metropolitan Area boundaries. Between 2006 and 2011, CMA boundaries changed in Saguenay, Québec, Sherbrooke, Trois-Rivières, Montréal, Ottawa-Gatineau, and Guelph. Data are census-based estimates of dwellings occupied by usual residents, which were released by Statistics Canada on February 8, Source: CMHC, adapted from Statistics Canada (Census of Canada) 80
81 Table 19 Households in Core Housing Need, Canada, Provinces, Territories and Metropolitan Areas, Number of Households in Core Housing Need Incidence of Core Housing Need GNR (#) (%) (%) Canada 1,567,180 1,485,340 1,494,395 1,552, Provinces and Territories Newfoundland and Labrador 26,310 26,605 27,305 22, Prince Edward Island 6,060 6,200 6,435 4, Nova Scotia 48,105 51,590 43,760 46, New Brunswick 34,735 29,990 29,360 29, Quebec 426, , , , Ontario 594, , , , Manitoba 55,015 45,390 46,915 43, Saskatchewan 39,685 37,160 40,835 47, Alberta 100, , , , British Columbia 228, , , , Yukon 1,970 1,615 1,880 1, Northwest Territories 1 4,665 2,085 2,390 2, Nunavut 1 NA 2,740 2,870 3,355 NA Census Metropolitan Areas 2 1,063,310 1,033,380 1,093,025 1,146, St. John s 8,640 8,375 9,255 9, Halifax 20,100 22,390 20,200 20, Moncton 4 5,400 4,850 5,370 5, Saint John 6,405 5,185 4,580 5, Saguenay 7,410 6,615 5,090 3, Québec 39,970 34,590 28,695 28, Sherbrooke 9,240 7,560 7,580 8, Trois - Rivières 8,765 7,260 7,645 5, Montréal 238, , , , Ottawa - Gatineau (Total) 54,925 54,535 52,350 50, Gatineau 12,735 10,910 11,585 12, Ottawa 42,195 43,625 40,760 38, Kingston 3 8,035 8,290 7,545 7, Peterborough 4 5,740 5,045 6,160 6, Oshawa 11,775 12,025 13,310 13, Toronto 269, , , , Hamilton 33,590 32,985 33,090 30, St. Catharines-Niagara 19,760 18,510 18,425 17, Kitchener-Cambridge-Waterloo 18,160 17,155 16,845 17, Brantford 4 5,990 5,155 5,250 6, Guelph 4 5,060 4,560 5,540 5, London 23,075 21,640 22,625 23, Windsor 13,940 14,390 15,285 13, Barrie 4 6,420 7,145 8,290 9, Greater Sudbury/Grand Sudbury 8,970 7,410 6,315 6, Thunder Bay 6,215 5,640 5,415 5, Winnipeg 38,025 28,085 28,375 28, Regina 8,645 7,420 7,435 9, Saskatoon 10,645 8,985 8,515 12, Calgary 32,300 38,305 36,135 44, Edmonton 33,285 36,730 41,220 48, Kelowna 4 7,290 6,325 6,615 8, Abbotsford-Mission 3 6,215 5,505 6,795 7, Vancouver 122, , , , Victoria 19,170 17,055 16,900 20, In 1999, Nunavut was established as a territory distinct from the Northwest Territories (N.W.T.). As a result, beginning with the 2001 Census, data for Nunavut are presented exclusive of N.W.T. 2 A Census Metropolitan Area (CMA) is an area consisting of one or more adjacent municipalities situated around a major urban core and which has a population of at least 100,000. The CMA total represents all the CMAs in Canada at the time of each census. Note that it is adjusted neither for changes in CMA boundaries nor for changes in the number of CMAs between census years. 3 Kingston and Abbotsford-Mission were not CMAs in 1996 and therefore their data are not included in the CMA total for these years. 4 Moncton, Peterborough, Brantford, Guelph, Barrie and Kelowna were not CMAs in 1996 and 2001 and therefore their data are not included in the CMA total for these years. These data, from the Census of Canada and the National Household Survey, apply to all non-farm, non-band, non-reserve private households reporting positive incomes and shelter cost-to-income ratios less than 100%. Income data collected by the Census of Canada refer to the calendar year preceding the census, while shelter cost data give expenses for the current year. Shelter-cost-to-income ratios are computed directly from these data, that is, by comparing current shelter costs to incomes from the previous year. Acceptable housing is defined as adequate and suitable shelter that can be obtained without spending 30% or more of before-tax household income. Adequate shelter is housing that is not in need of major repair. Suitable shelter is housing that is not crowded, meaning that it has sufficient bedrooms for the size and make-up of the occupying household. The subset of households classified as living in unacceptable housing and unable to access acceptable housing is considered to be in core housing need. The Global Non-response Rate (GNR) is included for each geography. Statistics Canada uses the GNR as an indicator of data quality. For more information on the GNR, see Statistics Canada s National Household Survey User Guide. Source: CMHC (Census-based and NHS-based housing indicators and data) For additional data, please refer to the CMHC website: 81
82 Table 20 Characteristics of Households in Core Housing Need, Canada, 2011 Number of Households in Core Housing Need All Households Renters Owners Incidence of Core Housing Need Number of Households in Core Housing Need Incidence of Core Housing Need Number of Households in Core Housing Need Incidence of Core Housing Need (#) (%) (#) (%) (#) (%) All Households 1,552, , , Components: Below Affordability Standard Only 1,137, , , Below Suitability Standard Only 68, , , Below Adequacy Standard Only 80, , , Below Multiple Housing Standards 266, , , Household Type Senior-led 394, , , Family 87, , , Non-Family 306, , , Individuals Living Alone 300, , , Female 229, , , Male 71, , , Non-Senior-led 1,157, , , Family 685, , , Couples with Children 257, , , Couples without Children 113, , , Lone Parent Families 299, , , Female 262, , , Male 37, , , Non-Family 471, , , Individuals Living Alone 417, , , Female 201, , , Male 216, , , Individuals Sharing with Others 54, , , Aboriginal Status Non-Aboriginal Household 1,456, , , Aboriginal Household 95, , , Status Indian 42, , , Non-Status Indian 22, , , Métis 37, , , Inuit 6, , Period of Immigration Non-immigrant 1,041, , , Immigrant 486, , , Prior to , , , to , , , to , , , to , , , to , , , These data, from the National Household Survey (NHS), apply to all non-farm, non-band, non-reserve private households reporting positive incomes and shelter-cost-to-income ratios less than 100%. Income data collected by the NHS refer to the calendar year preceding the survey, while shelter cost data give expenses for the current year. Shelter-cost-to-income ratios are computed directly from these data, that is, by comparing current shelter costs to incomes from the previous year. Acceptable housing is defined as adequate and suitable shelter that can be obtained without spending 30% or more of before-tax household income. Adequate shelter is housing that is not in need of major repair. Suitable shelter is housing that is not crowded, meaning that it has sufficient bedrooms for the size and make-up of the occupying household. The subset of households classified as living in unacceptable housing and unable to access acceptable housing is considered to be in core housing need. Source: CMHC (NHS-based housing indicators and data) For additional data, please refer to the CMHC website: All estimates, being derived from data provided by the 1 in 3 sample of households that receive the NHS questionnaire, are subject to sampling error and non-response bias. Global non-response rate: 26.1%. 82
83 Table 21 Real Median After-Tax Household Income, Canada, Provinces and Selected Metropolitan Areas, (2013 constant dollars) Canada 58,200 a 58,000 a Provinces Newfoundland and Labrador 53,500 b 57,600 b Prince Edward Island 53,200 b 53,000 b Nova Scotia 51,600 a 52,000 a New Brunswick 49,500 a 50,000 a Quebec 50,700 a 49,900 a Ontario 61,000 a 59,700 a Manitoba 54,300 a 56,200 a Saskatchewan 62,000 b 62,900 b Alberta 79,300 a 79,100 a British Columbia 56,600 b 58,500 a Metropolitan Area St John s 65,400 c 67,000 b Halifax 57,000 b 58,500 b Saint John 54,600 c 58,400 c Saguenay 50,600 c 51,900 c Québec 54,600 c 59,200 c Sherbrooke 41,500 c 43,300 c Trois-Rivières 42,500 c 44,900 c Montréal 52,000 b 50,300 b Ottawa - Gatineau 70,900 c 70,700 c Kingston 55,000 c 57,700 c Oshawa 75,500 b 64,800 b Toronto 64,300 b 61,700 b Hamilton 61,800 c 59,900 c St. Catharines-Niagara 54,900 c 53,700 c Kitchener-Cambridge-Waterloo 59,200 c 70,900 c London 47,500 c 57,500 c Windsor 51,600 c 51,600 d Greater Sudbury/Grand Sudbury 55,700 c 56,300 c Thunder Bay 60,100 c 61,500 c Winnipeg 55,600 b 55,900 b Regina 69,100 c 72,600 c Saskatoon 63,800 c 68,400 c Calgary 86,600 c 85,800 b Edmonton 81,000 c 79,600 c Abbotsford-Mission 58,900 c 57,900 c Vancouver 59,600 b 60,500 c Victoria 55,100 c 59,600 c All data are rounded to the nearest $100. Data quality indicators are based on the coefficient of variation (CV) and number of observations: a - Excellent (CV between 0% and 2%); b - Very good (CV between 2% and 4%); c - Good (CV between 4% and 8%); d - Acceptable (CV between 8% and 16%); e - Use with caution (CV greater than or equal to 16%); f - Too unreliable to be published. Source: Statistics Canada (Canadian Income Survey) For additional data, please refer to the CMHC website: 83
84 Table 22 Home Equity and Net Worth by Tenure and Age Group, Canada 1999, 2005 and 2012 (2012 constant dollars) Renters 1 Owned with a Mortgage Owned without a Mortgage All Owners All Households Age Group 2 Median Average Median Average Median Average Median Average Median Average Equity in Principal Residence All ages , , , , , ,000 93, , ,000 * 110,000 * NA NA 87,000* 148, ,000* ,000 98, , ,000 80, , , ,000 * 99, , ,000 80, , , , , , , , ,000 70, , , , , , , , , , , , , , , , , , , , , , , , , , years or over , , , , , , , , All ages , , , , , ,000 66, , NA NA NA NA NA NA 0 NA ,000 80,000 NA 287,000 60, , , ,000 85, ,000* 278,000 60, , , , , , , , ,000 61, , , , , , , ,000 99, , , , , , , , , , , , , , , ,000 91, , years or over ,000* 160, , , , , , , All ages ,000 94, , , , ,000 42,000 89, ,000 * 79,000 * 183,000 * 321,000 * 98, ,000 * 0 29,000* ,000 60, , ,000 46,000 76, , ,000 61, , ,000 47,000 84, , ,000 89, , ,000 79, ,000 37,000 73, , , , , , ,000 77, , , , , , , , , , , , , , , ,000 59, , years or over , , , , , ,000 92, ,000 84
85 Table 22 Home Equity and Net Worth by Tenure and Age Group, Canada 1999, 2005 and 2012 (2012 constant dollars) (continued) Renters 1 Owned with a Mortgage Owned without a Mortgage All Owners All Households Age Group 2 Median Average Median Average Median Average Median Average Median Average Net Worth All ages 14, , , , ,000 1,145, , , , , ,000* 24,000* 120,000* 202,000* NA NA 170,000* 362,000* 8,000* 83,000* ,000 36, , , , , , ,000 65, , ,000 33, , , , , , ,000 43, , ,000* 80, , , , , , , , , ,000* 134, , , ,000 1,375, , , , , NA 282,000* 561, , ,000 1,330, ,000 1,091, , , ,000* 157, , , ,000 1,297, , , , , years or over 48,000* 190, , , , , , , , , All ages 16,000 79, , , , , , , , , NA 20,000* 71,000* NA NA NA NA 453,000* NA 79,000* ,000* 27, , , ,000* 445, , ,000 49, , ,000* 25, , , ,000* 487, , ,000 34, , ,000* 39, , , , , , , , , ,000* NA 312, , , , , , , , NA 171,000* 497, , ,000 1,005, , , , , ,000* 96,000* 297, , , , , , , , years or over 46,000* 168, , , , , , , , , All ages 16,000 80, , , , , , , , , NA 12,000* NA 210,000* 344,000* 659,000* 179,000* 378,000* 8,000 74,000* ,000 49,000* 111, , , , , ,000 50, , NA 12,000* NA 210,000* 344,000* 659,000* 179,000* 378,000* 8,000 74,000* ,000 74, , , , , , , , , ,000 99, , , , , , , , , ,000* 105, , , , , , , , , ,000 87, , , , , , , , , years or over 49, , , , , , , , , ,000 All dollar figures are rounded to the nearest $1, Includes households occupying their homes rent free. 2 Age of the highest income earner in the household. Where owners and renters are both present, refers to the owner with the highest income. 3 Home equity is the value of the principal residence less any outstanding mortgages. 4 Includes the value of employer pension plan benefits. Net worth is the difference between a household s assets and its liabilities. NA - Not available. Suppressed by Statistics Canada due to unreliability of the estimate or to meet the confidentiality requirements of the Statistics Act. * Use with caution. Source: Statistics Canada (Survey of Financial Security) For additional data, please refer to the CMHC website: 85
86 Table 23 Home Equity and Net Worth by Tenure, Canada and Provinces, 2012 (2012 constant dollars) Renters 1 Owned with a Mortgage Owned without a Mortgage All Owners All Households Province Median Average Median Average Median Average Median Average Median Average Home Equity 2 Newfoundland and Labrador , , , , , ,000 75, ,000 Prince Edward Island ,000 81, , ,000 80, ,000 50,000* 73,000 Nova Scotia ,000 91, , , , ,000 58,000 96,000 New Brunswick ,000 75, , ,000 92, ,000 65,000 83,000 Québec , , , , , ,000 59, ,000 Ontario , , , , , , , ,000 Manitoba , , , , , ,000 80, ,000 Saskatchewan , , , , , , , ,000 Alberta , , , , , , , ,000 British Columbia , , , , , , , ,000 Canada , , , , , ,000 93, ,000 Equity in Other Real Estate 3 Newfoundland and Labrador 0 NA 0 24,000* 0 46,000* 0 35,000* 0 27,000* Prince Edward Island 0 NA 0 20,000* 0 43,000* 0 31,000* 0 24,000* Nova Scotia 0 NA 0 25,000* 0 46,000* 0 36, ,000 New Brunswick 0 NA 0 NA 0 24,000* 0 23,000* 0 18,000* Québec 0 12,000* 0 40,000* 0 58, , ,000 Ontario 0 14,000* 0 38, ,000* 0 68, ,000 Manitoba 0 NA 0 30,000* 0 49,000* 0 39, ,000* Saskatchewan 0 NA 0 35,000* 0 96,000* 0 68,000* 0 55,000* Alberta 0 16,000* 0 NA 0 140,000* 0 108,000* 0 80,000* British Columbia 0 23,000* 0 128,000* 0 117, ,000* 0 89,000 Canada 0 15, , , , ,000 Household Net Worth 4 Newfoundland and Labrador NA NA 227, , , , , , , ,000 Prince Edward Island NA NA 217,000* 370,000* 263,000* 449, , , ,000* 305,000 Nova Scotia NA 98,000* 264, , , , , , , ,000 New Brunswick NA 73,000* 178, , , , , , , ,000 Québec 20, ,000* 338, , ,000 1,000, , , , ,000 Ontario 9,000* 119,000* 321, , ,000 1,246, , , , ,000 Manitoba NA 155,000* 279, , , , , , , ,000 Saskatchewan NA 137,000* 293, , ,000 1,103, , , , ,000 Alberta 15,000 82,000* 356, , ,000 1,335, , , , ,000 British Columbia 21,000* 139, , , ,000 1,343, ,000 1,055, , ,000 Canada 14, , , , ,000 1,145, , , , ,000 All dollar figures are rounded to the nearest $1, Includes households occupying their homes rent free. 2 Home equity is the value of the principal residence less any outstanding mortgages. 3 Includes cottages, second homes and vacation homes, timeshares, rental properties, commercial properties, and other holdings. 4 Includes the value of employer pension plan benefits. Net worth is the difference between a household s assets and its liabilities. NA - Not available. Suppressed by Statistics Canada due to unreliability of the estimate or to meet the confidentiality requirements of the Statistics Act. * Use with caution. Source: Statistics Canada (Survey of Financial Security) For additional data, please refer to the CMHC website: 86
87 Table 24 Residential Mortgage Credit Outstanding, By Financial Institution Type, 2014 Q Q Q Q Q Q Q Q4 Residential Mortgages Outstanding ($ billions) (period-end) 1, , , , , ,361.7 Chartered banks ,011.3 Trust and mortgage loan companies Life insurance companies Non-depository credit intermediaries and other financial institutions Credit unions and caisses populaires Pension funds National Housing Act mortgage-backed securities (NHA MBS) Special purpose corporations (securitization) 3, Components may not add up to totals due to rounding. 1 Includes bank mortgage subsidiaries. 2 Excludes bank mortgage subsidiaries. 3 From 2011 onwards, excludes securitized loans that are consolidated on the banks balance sheets as loans. 4 Private residential mortgage securitization. Source: Statistics Canada (CANSIM) For additional data, please refer to the CMHC website: 87
88 Table 25 CMHC Mortgage Loan Insurance Highlights, 2014 Q Q Q Q Q Q Q3 Overview 1 CMHC insurance-in-force outstanding ($ billions) (period-end) Annual / Quarterly number of insured units 2, 5 83,113 82,556 50,230 82,878 80,364 Annual / Quarterly CMHC insurance volumes ($ billions) 3, Homeowner Loans by Interest Rate Type (%) 4, 5 Fixed Non-fixed Credit Profile Distribution of CMHC homeowner insurance-in-force by LTV ratio, based on updated property value (%) 4 Share with LTV 80% or under Share with LTV 80.01% to 90% Share with LTV 90.01% to 95% Share with LTV 95.01% and over Average LTV ratio of CMHC-insured homeowner mortgages (%) Average CMHC-insured loan amount per household ($) 7 138, , , , ,556 Distribution of insurance-in-force by average outstanding loan amount (%) 7 $200,000 or under Over $200,000 to $300, Over $300,000 to $400, Over $400,000 to $600, Over $600,000 to $850, Over $850,000 to $1,000, Over $1,000, Distribution of approved homeowner loans by credit score at origination (%) 8, 9 No score Under and over , 10 Distribution of CMHC borrower insurance-in-force by average GDS ratio at origination (%) 30% or under Over 30% to 35% Over 35% to 39% Over 39% Average GDS ratio Performance CMHC insured mortgages arrears rate (%) 7, Components may not add up to totals due to rounding. 1 For homeowner high-ratio and low-ratio, low-ratio portfolio and multi-unit residential (5+ units) loans. 2 From 2006 on, the series were revised to refer to mortgages for which CMHC received a premium (including portfolio insurance for low-ratio loans), rather than approved applications. 3 Data is based on the loans for which premiums were received in a given year. 4 For homeowner high-ratio and low-ratio loans. 5 Quarterly values are reported only for the 3-month period. 6 Includes: variable, capped variable, adjustable, buydown, and indexed rates. 7 For homeowner high-ratio and low-ratio, and multi-unit residential loans. 8 Canadian credit scores generally range from 300 to From 2014 on, the values are reported for high-ratio and low-ratio transactional homeowner loans, rather than high-ratio homeowner loans only. 10 Gross debt-service ratio is defined as the the annual payments on principal, interest, property taxes and heat (PITH) + 50% of condominium fee (if applicable) / borrower s gross annual income (including up to 50% of subject property s gross rental income, if applicable). 11 Number of all loans that are 90 days or more past due as a per cent of the total number of outstanding insured loans. Source: CMHC For additional data, please refer to the CMHC website: 88
89 Table 26 Private Mortgage Securitization 1, 2014 Q Q Q Q Q Q Q Q4 Total Canadian Private Mortgage Securitization Outstanding ($ billions) (period-end) Mortgage Assets as Share of the Total Canadian Private Securitization (%) (period-end) Breakdown of the Mortgage Assets by Type ($ billions) (periodend) Home Equity Line of Credit (HELOC) Conventional Mortgage Insured Mortgage Non-Conventional Mortgage This table reports Canadian private residential mortgage securitization transactions rated by DBRS, including asset-backed securities (ABS) and asset-backed commercial paper (ABCP), but excluding floating-rate structured notes (FRSN). 2 This credit facility is secured by residential real estate. 3 Uninsured residential mortgages with a loan-to-value (LTV) ratio equal or less than 80% at origination and underwritten by financial institutions to a prime credit borrower for property purchase, with full documentation, scheduled monthly amortizing payments and generally maximum gross debt-service ratio of 32% and total debt-service ratio of 40%. 4 Residential mortgages insured by mortgage insurers with insurance premiums paid by either the borrower or the lender. The insurers must be rated at least AA (low) by DBRS to be eligible as securitization counterparty. 5 Uninsured residential mortgages with a LTV ratio greater than 80%, limited underwriting documentation, lower than monthly amortizing payments and/or less credit worthy borrowers. - = 0 Source: CMHC, adapted from DBRS Monthly Canadian ABS Report and Monthly Canadian ABCP Report For additional data, please refer to the CMHC website: 89
90 Table 27 Covered Bonds Market 1, 2014 Q Q Q Q Q Q Q Q4 Total Annual / Quarterly Covered Bond Issuance (C$ billions) Issuance per Issuer (C$ billions) Bank of Montreal (BMO) Bank of Nova Scotia (BNS) Caisse centrale Desjardins du Québec (CCDQ) Canadian Imperial Bank of Commerce (CIBC) National Bank of Canada (NBC) Royal Bank of Canada (RBC) Toronto-Dominion Bank (TD) Issuance by Currency (billions in currency indicated) Canadian Dollar (CAD) Australian Dollar (AUD) British Pound (GBP) Euro (EUR) Swiss Franc (CHF) United States Dollar (USD) Issuance by Term (C$ billions) 2-year year year year year year year year year Total Covered Bonds Outstanding (C$ billions) (period-end) Contractual Covered Bonds Outstanding (C$ billions) Legislative Covered Bonds Outstanding (C$ billions) Outstanding per Issuer (C$ billions) Bank of Montreal (BMO) Bank of Nova Scotia (BNS) Caisse centrale Desjardins du Québec (CCDQ) Canadian Imperial Bank of Commerce (CIBC) National Bank of Canada (NBC) Royal Bank of Canada (RBC) Toronto-Dominion Bank (TD) Outstanding by Currency (billions in currency indicated) Canadian Dollar (CAD) Australian Dollar (AUD) British Pound (GBP) Euro (EUR) Swiss Franc (CHF) United States Dollar (USD) Outstanding by Term (C$ billions) 2-year year year year year year year year year Components may not add up to totals due to rounding. 1 Denominated in Canadian dollars (except where indicated) based on the exchange rates posted in issuers covered bond investor reports at time of issuance. 2 There were no covered bonds issued in Canada prior to Prior to 2013, all covered bond issuance was contractual. Since 2013, all issuance is under a legislative framework. 4 As of 2013 Q3, outstanding legislative covered bonds include covered bonds, backed by uninsured mortgages in their collateral pools, that were issued prior to the Covered Bond Legal Framework but were subsequently authorized to be registered under the new framework. - = 0 Source: CMHC, adapted from DBRS Monthly Canadian Covered Bond Report For additional data, please refer to the CMHC website: 90
91 Table 28 CMHC National Housing Act Mortgage-Backed Securities (NHA MBS) Program 1, 2014 Q Q Q Q Q Q Q Q4 Total Annual / Quarterly NHA MBS Issuance ($ billions) Total NHA MBS Outstanding ($ billions) (period-end) Total NHA MBS includes NHA MBS purchased by the Canada Housing Trust under the Canada Mortgage Bonds (CMB) program, market NHA MBS sold to capital market investors or held by the issuers, and NHA MBS purchased under the Insured Mortgage Purchase Program (IMPP) (from ). Source: CMHC For additional data, please refer to the CMHC website: 91
92 Table 29 CMHC Canada Mortgage Bonds (CMB) Program, 2014 Q Q Q Q Q Q Q Q4 Annual / Quarterly CMB Issuance by Term ($ billions) 3-yr Fixed yr Floating Rate Note yr Fixed yr Fixed Total Annual / Quarterly CMB Issuance ($ billions) CMB Outstanding by Term ($ billions) (period-end) 3-yr Fixed yr Floating Rate Note yr Fixed yr Fixed Total CMB Outstanding ($ billions) (period-end) Components may not add up to totals due to rounding. - = 0 Source: CMHC For additional data, please refer to the CMHC website: Canada Mortgage Bonds (CMB) 5-Year Constant Maturity Spread over the Government of Canada Curve 1, (basis points) Table 30 January February March April May June July August September October November December Annual Average NA NA NA NA NA The constant maturity spread represents the exact term indicated and is calculated by an interpolation using CMB market spreads to Government of Canada yields. 2 From 2003 to 2011 inclusively, the data presented are a monthly average of daily data. 3 Starting in 2012, the data presented are a monthly average of weekly data. NA = Not available Source: CMHC 92
93 Table 31 Canadian and U.S. Residential Mortgage Arrears and Foreclosure Rates 1, 2014 Q Q Q Q Q Q Q Q4 Canadian mortgage arrears rate for all loans (%) U.S. prime fixed-rate mortgage arrears rate (%) U.S. mortgage arrears rates by type of loan (%) 4 All mortgages Prime mortgages Prime fixed-rate mortgages Subprime mortgages Veterans Administration (VA) insured mortgages Federal Housing Administration (FHA) insured mortgages U.S. foreclosure and seriously deliquent rates for all loans (%) Foreclosures started during the quarter Seriously delinquent mortgages All Canadian and U.S. mortgage arrears and foreclosure rates are non-seasonally adjusted, and calculated based on the total number of loans serviced instead of their dollar value. 2 The Canadian mortgage arrears rate is based on loans with installments past due by 90 days or more. The data is derived from ten major Canadian banks including BMO, CIBC, HSBC, National Bank, RBC, Scotia, TD Canada Trust, Canadian Western, Manulife (as of April 2004) and Laurentian (as of October 2010). 3 U.S. prime fixed-rate mortgages are the most comparable to the overall Canadian mortgage market. 4 The U.S. arrears rates are based on one-to-four unit residential properties loans with installments past due by 90 days or more. The data is derived from approximately 120 U.S. mortgage lenders, including mortgage banks, commercial banks, thrifts, savings and loan associations, subservicers and life insurance companies. 5 Includes all residential loan types, i.e. prime, subprime, Veterans Administration (VA) insured and Federal Housing Administration (FHA) insured residential mortgages. 6 Prime mortgages include prime fixed-rate mortgages (FRM) and prime adjustable-rate mortgages (ARM), and subprime mortgages include subprime FRM and subprime ARM. The prime and subprime criteria used in the U.S. Mortgage Bankers Association (MBA) s National Delinquency Survey (NDS) is based on survey participants reporting of what they consider to be their prime and subprime servicing portfolios, since internal servicing guidelines vary. 7 Includes all first mortgages secured by one-to-four unit residential properties and insured by either the Veteran s Administration (VA) or the Federal Housing Administration (FHA). 8 Mortgages for which foreclosure proceedings started during the current quarter. Includes in lieu foreclosures and mortgages assigned directly to FHA, VA or other insurers, or investors. 9 The seriously delinquent rate is the percentage of all loans with installments past due by 90 days or more or in the process of foreclosure. Note that the mortgage holder can usually initiate foreclosure at a time specified in the mortgage documents, therefore the process of foreclosure can be rapid or lengthy and varies from state to state. Source: Canadian Bankers Association (CBA) and the U.S. Mortgage Bankers Association (MBA) For additional data, please refer to the CMHC website: 93


94 Aging in Place Accessible and adaptable housing enables people of all ages and abilities to stay in their community as long as possible. Aging in Place The ability to live in the same home or community safely, independently, and comfortably, as you age. Universal Design Thanks to universal design, buildings, spaces and other components will be used by all people to the greatest extent possible, without the need for later adaptations. Accessibility Accessible housing refers to a home built or renovated to enable independent living Visit our website at cmhc.ca/accessibleandadaptablehomes 94
RESEARCH HIGHLIGHT FINDINGS
 RESEARCH HIGHLIGHT 011 Census/National Household Survey Housing Series: Issue 11 The Rental Market in Canada: Estimated Size and Composition April 016 Socio-economic Series INTRODUCTION There are many
Core Housing Need. Data from the 2006 Census. Presentation to the NHRC Working Group on Housing Data
 Core Housing Need Data from the 2006 Census Presentation to the NHRC Working Group on Housing Data Roger Lewis Policy and Research Division Canada Mortgage and Housing Corporation May 5, 2009 Introduction
RESEARCH HIGHLIGHT Census/National Housing Survey Housing Condition Series Issue 4: The Private Housing Stock,
 RESEARCH HIGHLIGHT 2011 Census/National Housing Survey Housing Condition Series Issue 4: The Private Housing Stock, 2006-2011 November 2015 Socio-economic Series 1. INTRODUCTION Using data from the Census
HOUSING MARKET INSIGHT Canada
 Housing Market Information HOUSING MARKET INSIGHT Canada Canada Mortgage and Housing Corpor ation Date Released: September 2016 Purpose-built rental apartment units in the lowest-rent quintile are older
canadian housing at a glance
 Canadian Housing Observer IMMIGR ATION IS STRONGLY LINKED TO POPULATION GROWTH POPULATION GROWTH IS A MAJOR DRIVER OF HOUSEHOLD GROWTH Natural increase and net migration (thousands) Average yearly growth
The Canadian Real Estate Association News Release
 The Canadian Real Estate Association News Release Canadian home sales push higher in February Ottawa, ON, March 15, 2016 According to statistics 1 released today by The Canadian Real Estate Association
News Release. Canadian home sales ease back in September Ottawa, ON, October 15, The Canadian Real Estate Association
 The Canadian Real Estate Association News Release Canadian home sales ease back in September Ottawa, ON, October 15, 2014 According to statistics 1 released today by The Canadian Real Estate Association
The Canadian Real Estate Association News Release
 The Canadian Real Estate Association News Release Canadian home sales rebound in January Ottawa, ON, February 16, 2016 According to statistics 1 released today by The Canadian Real Estate Association (CREA),
The Canadian Real Estate Association News Release
 The Canadian Real Estate Association News Release Canadian home sales edge down from December to January Ottawa, ON, February 15, 2017 According to statistics 1 released today by The Canadian Real Estate
ental Market report Vacancy Rate Up Slightly Vacancy Rate Edges Higher in 2004 Charlottetown CA CHARLOTTETOWN Canada Mortgage and Housing Corporation
 4.8% r ental Market report Vacancy Rate Up Slightly CHARLOTTETOWN Canada Mortgage and Housing Corporation Volume 6 Edition 1 October 2004 www.cmhc.ca Vacancy Rate Edges Higher in 2004 The vacancy rate
The Canadian Real Estate Association News Release
 The Canadian Real Estate Association News Release Canadian home sales drop again in June Ottawa, ON, July 17, 2017 According to statistics 1 released today by The Canadian Real Estate Association (CREA),
The Canadian Real Estate Association News Release
 The Canadian Real Estate Association News Release Canadian home sales improve slightly in March Ottawa, ON, April 13, 2018 Statistics 1 released today by The Canadian Real Estate Association (CREA) show
The Canadian Real Estate Association News Release
 The Canadian Real Estate Association News Release Canadian home sales edge up in September Ottawa, ON, October 14, 2016 According to statistics 1 released today by The Canadian Real Estate Association
The Canadian Real Estate Association News Release
 The Canadian Real Estate Association News Release Canadian home sales fall further in February Ottawa, ON, March 15, 2018 Statistics 1 released today by The Canadian Real Estate Association (CREA) show
News Release. Canadian home sales edge up in February Ottawa, ON, March 13, The Canadian Real Estate Association
 The Canadian Real Estate Association News Release Canadian home sales edge up in February Ottawa, ON, March 13, 2015 According to statistics 1 released today by The Canadian Real Estate Association (CREA),
The Canadian Real Estate Association News Release
 The Canadian Real Estate Association News Release Canadian home sales surge in December Ottawa, ON, January 15, 2018 Statistics 1 released today by The Canadian Real Estate Association (CREA), show national
The Canadian Real Estate Association News Release
 The Canadian Real Estate Association News Release Canadian home sales at five-year low in May Ottawa, ON, June 15, 2018 Statistics 1 released today by The Canadian Real Estate Association (CREA) show national
The Canadian Real Estate Association News Release
 The Canadian Real Estate Association News Release Canadian home sales fall in April Ottawa, ON, May 15, 2018 Statistics 1 released today by The Canadian Real Estate Association (CREA) show national home
The Canadian Real Estate Association News Release
 The Canadian Real Estate Association News Release Canadian home sales activity softens further in November Ottawa, ON, December 17, 2018 Statistics 1 released today by the Canadian Real Estate Association
The Canadian Real Estate Association News Release
 The Canadian Real Estate Association News Release Canadian home sales activity strengthens in July Ottawa, ON, August 15, 2018 Statistics 1 released today by The Canadian Real Estate Association (CREA)
The Canadian Real Estate Association News Release
 The Canadian Real Estate Association News Release Canadian home sales activity edges lower in September Ottawa, ON, October 15, 2018 Statistics 1 released today by The Canadian Real Estate Association
2006 Census Housing Series: Issue 9 Inuit Households in Canada
 December 2010 Socio-economic Series 10-019 2006 Census Series: Issue 9 Inuit in Canada introduction This Research Highlight examines the housing conditions of Inuit 1 in Canada using data from the 2006
News Release. Canadian home sales little changed in November Ottawa, ON, December 16, The Canadian Real Estate Association
 The Canadian Real Estate Association News Release Canadian home sales little d in November Ottawa, ON, December 16, 2013 According to statistics 1 released today by The Canadian Real Estate Association
News Release. Canadian home sales fall back in October Ottawa, ON, November 15, The Canadian Real Estate Association
 The Canadian Real Estate Association News Release Canadian home sales fall back in October Ottawa, ON, November 15, 2013 According to statistics 1 released today by The Canadian Real Estate Association
06 3.3% % % 0.8%
 H o u s i n g M a r k e t I n f o r m a t i o n RENTAL MARKET REPORT C a n a d a M o r t g a g e a n d H o u s i n g C o r p o r a t i o n Date Released: Fall 2012 Victoria Highlights The apartment vacancy
The Canadian Real Estate Association News Release
 The Canadian Real Estate Association News Release Canadian home sales fall further in July Ottawa, ON, August 15, 2017 According to statistics 1 released today by The Canadian Real Estate Association (CREA),
The Canadian Real Estate Association News Release
 The Canadian Real Estate Association News Release Canadian home sales activity eases in October Ottawa, ON, November 15, 2018 Statistics 1 released today by the Canadian Real Estate Association (CREA)
News Release. Canadian home sales moderate further in January Ottawa, ON, February 14, The Canadian Real Estate Association
 Canadian home sales moderate further in January Ottawa, ON, February 14, 2014 According to statistics 1 released today by The Canadian Real Estate Association (CREA), national home sales activity posted
The Canadian Real Estate Association News Release
 The Canadian Real Estate Association News Release Canadian home sales drop in January Ottawa, ON, February 15, 2018 Statistics 1 released today by The Canadian Real Estate Association (CREA) show national
The Canadian Real Estate Association News Release
 The Canadian Real Estate Association News Release Canadian home sales post solid gain in November Ottawa, ON, December 14, 2017 According to statistics 1 released today by The Canadian Real Estate Association
Core Housing Need. Concept, Implementation, and Availability. Roger Lewis Housing Research Division Canada Mortgage and Housing Corporation
 Core Housing Need Concept, Implementation, and Availability December 2, 2014 Roger Lewis Housing Research Division Canada Mortgage and Housing Corporation Presentation to 2014 OMSSA Policy and Research
ental market report CMHC s Fall survey of rental hous Average vacancy rate in ³ N regina 2002 IN THIS Regina slips from 2001 level ISSUE
 r ental market report Canada Mortgage and Housing Corporation Average vacancy rate in IN THIS Regina slips from 2001 level ISSUE Average vacancy rate slips... 1 CMHC s Fall survey of rental hous ing found
ental Market report Apartment vacancy rate almost unchanged in 2004 St.Catharines-Niagara Vacancy rate falls in larger centers IN THIS ISSUE
 r ental Market report St.Catharines-Niagara Canada Mortgage and Housing Corporation Apartment vacancy rate almost unchanged in 2004 The vacancy rate in the St. Catharines-Niagara Census Metropolitan (CMA)
Hamilton CMA apartment vacancy rate rises in 2002
 HamiltonCMA Canada Mortgage and Housing Corporation apartment vacancy rate rises in 2002 In 2002, the private apartment vacancy rate in the Hamilton Census Metropolitan (CMA) rose to 1.6 percent from 1.3
R esearch Highlights LEVIES, FEES, CHARGES AND TAXES ON NEW HOUSING (2002) Introduction. Municipal Levies, Fees and Charges
 Introduction. Municipal Levies, Fees and Charges") R esearch Highlights December 2002 Socio-economic Series 115 LEVIES, FEES, CHARGES AND TAXES ON NEW HOUSING (2002) Introduction Government-imposed costs on new housing can be substantial. They have a direct
R esearch Highlights December 2002 Socio-economic Series 115 LEVIES, FEES, CHARGES AND TAXES ON NEW HOUSING (2002) Introduction Government-imposed costs on new housing can be substantial. They have a direct
Hamilton CMA apartment vacancy rate edges down in 2001
 HamiltonCMA Canada Mortgage and Housing Corporation apartment vacancy rate edges down in 2001 In 2001, the private apartment vacancy rate in the Hamilton Census Metropolitan (CMA) edged down to 1.3 percent
Kitchener CMA. Vacancy rate edges higher Rental Submarkets Canada Mortgage and Housing Corporation IN THIS ISSUE
 Canada Mortgage and Housing Corporation Vacancy rate edges higher In, the (census metropolitan area) rental market eased slightly as the private apartment vacancy rate edged higher to percent, up from
Fact Sheet Housing Affordability Crisis in Ontario
 Fact Sheet Housing Affordability Crisis in Ontario Residents in communities across Ontario are facing unaffordable rents. As shown in Figure 1, rents have increased steadily across Ontario for the past
Rental Market Report Calgary CMA
 76 G HWAY 772 Housing Market Information Rental Market Report Canada Mortgage and Housing Corporation Release Date: 2007 Highlights Apartment vacancy rate in the rose one percentage point, from 0.5 per
are making the jump to home ownership, keeping vacancy rates low. Rental housing starts have lagged behind growth in demand,
 Kelowna Highlights Canada Mortgage and Housing Corporation www.cmhc.ca Vacancy Rate Dips To Twelve Year Low October 24 Survey The Kelowna rental market has remained tight. The vacancy rate fell to only.%
The Canadian Real Estate Association News Release
 The Canadian Real Estate Association News Release Canadian home sales edge down from December to January Ottawa, ON, February 15, 2017 According to statistics 1 released today by The Canadian Real Estate
The Canadian Real Estate Association News Release
 According to statistics 1 released today by The Canadian Real Estate Association (CREA), national home sales posted their third monthly increase and broke all previous monthly records. Highlights: The
Spring Market trends
 2016 Spring Market trends Report NATIONAL SUMMARY Vancouver and Toronto continued to see significant price appreciation in the first quarter of the year. Greater Vancouver s average residential sale price
However, the results are less impressive for freehold housing 1. In this segment, a decrease of 51 per cent was observed, as construction got
 Residential construction still strong in Trois-Rivières According to the latest statistics released by Canada Mortgage and Housing Corporation (CMHC), the Trois-Rivières census metropolitan area (CMA)
2.2 % ** 2.2 % 2.1 % 1.5 % RENTAL MARKET REPORT St. Catharines-Niagara CMA $802 $634. Date Released: The overall vacancy rate *...
 Housing Market Information RENTAL MARKET REPORT Canada Mortgage and Housing Corpor ation Date Released: 2016 The overall vacancy rate *... DECREASED to 2.2 % Below CMA Similar to CMA Above CMA!(!( St.
Rental Market report. British Columbia Highlights* Highlights. Housing market intelligence you can count on
 H o u s i n g M a r k e t I n f o r m a t i o n Rental Market report Highlights* C a n a d a M o r t g a g e a n d H o u s i n g C o r p o r a t i o n Date Released: Spring 2011 Figure 1 Figure 2 Vancouver
Vacancy Rate Edges Back Down
 Survey - Kelowna Canada Mortgage and Housing Corporation Vacancy Rate Edges Back Down Highlights The Kelowna area vacancy rate edged back down in. The vacancy rate fell to % from 1.8% last year. Fewer
Kelowna Vacancy Rate Edges Up
 Survey - Kelowna Canada Mortgage and Housing Corporation Kelowna Vacancy Rate Edges Up Highlights The Kelowna area saw vacancy rates edge back up in. The vacancy rate rose to 1.8 per cent by October from
2011 Census Bulletin #4 Dwellings & Structure Type in Metro Vancouver
 2011 Census Bulletin #4 Dwellings & Structure Type in Metro Vancouver Regional Dwelling Count According to the 2011 Census figures recently released by Statistics Canada, there were 891,340 occupied private
Social Indicators and Trends 2014
 Social Indicators and Trends 214 Healthy City for All Targets By 215: end street homelessness. By 221 enable: 2,9 new supportive housing units; 5, new social housing units (including 1, units of Single
YOUR LINK TO THE HOUSING MARKET
 H ousing now Gatineau YOUR LINK TO THE HOUSING MARKET www.cmhc.ca Very active third quarter for residential construction Canada Mortgage and Housing Corporation VOLUME 7, EDITION 3 Third Quarter 2 0 0
The Canadian Real Estate Association News Release
 The Canadian Real Estate Association News Release Canadian home sales push higher in February Ottawa, ON, March 15, 2016 According to statistics 1 released today by The Canadian Real Estate Association
St.Catharines-Niagara
 Vacancy Rate Edges up in 2002 The rental market vacancy rate in the St.Catharines-Niagara Census Metropolitan Area rose from 1.9 per cent to 2.4 per cent in October 2002. This number nevertheless masks
ental MARKET Report Metro Victoria 2001 SURVEY Highlights at a Glance Apartment Rental Market Sees Few Vacancies 2001 Metro Victoria Vacancy Rates
 R SURVEY Highlights at a Glance Metropolitan vacancy rates for apartments dropped to.% in October from.% one year earlier Survey results show stronger rental demand in with a slowly recovering B.C. and
1.0 % 0.7 % 0.7 % 0.0 % 1,072. RENTAL MARKET REPORT Victoria CMA $850 $988. Date Released: The overall vacancy rate *...
 HOUSING MARKET INFORMATION RENTAL MARKET REPORT C A N A D A M O R T G A G E A N D H O U S I N G C O R P O R A T I O N Date Released: 2017 The overall vacancy rate *... INCREASED to 0.7 % Below CMA Similar
2015 Spring Market trends report
 2015 Spring Market trends Report National Summary Low inventory in Vancouver and Toronto continue to drive prices as buyers find themselves in competition over the low supply of single-family homes. The
RENTAL MARKET REPORT. Manitoba Highlights* Highlights. Housing market intelligence you can count on
 H o u s i n g M a r k e t I n f o r m a t i o n RENTAL MARKET REPORT Highlights* C a n a d a M o r t g a g e a n d H o u s i n g C o r p o r a t i o n Date Released: Spring 2012 Figure 1 Winnipeg CMA Brandon
Housing Market Outlook Trois-Rivières CMA
 H o u s i n g M a r k e t I n f o r m a t i o n Housing Market Outlook C a n a d a M o r t g a g e a n d H o u s i n g C o r p o r a t i o n Date Released: Fall 2011 Activity to remain strong in 2011 and
2015 Housing Report. kelowna.ca. April Water Street Kelowna, BC V1Y 1J4 TEL FAX
 2015 Housing Report April 2016 1435 Water Street Kelowna, BC V1Y 1J4 TEL 250 469-8610 FAX 250 862-3349 ask@kelowna.ca kelowna.ca TABLE OF CONTENTS Introduction... 1 Housing Starts... 1 Ownership Housing
Powell River. Courtenay. Port Alberni Parksville. Vancouver Nanaimo. Duncan. Avg. Rent
 Housing Market Information RENTAL MARKET REPORT Highlights 1 Canada Mortgage and Housing Corpor ation Date Released: 2016 The overall vacancy rate *... INCREASED to 1.3 % The average rent is *... $ 1,099
June 12, 2014 Housing Data: Statistics and Trends
 June 12, 214 Housing Data: Statistics and Trends This presentation was provided to the Mayor s Housing Commission on June 12, 214 and provided to Council on June 23, 214 along with a report summarizing
CREA Updates Resale Housing Forecast Ottawa, ON, September 15, 2015
 CREA Updates Resale Housing Ottawa, ON, September 15, 2015 The Canadian Real Estate Association (CREA) has updated its forecast for home sales activity via the Multiple Listing Service (MLS ) Systems of
Attachment 3. Guelph s Housing Statistical Profile
 Attachment 3 Guelph s Housing Statistical Profile Table of Contents 1. Population...1 1.1 Current Population (26)...1 1.2 Comparative Growth, Guelph and Ontario (21-26)...1 1.3 Total Household Growth (21
Housing Bulletin Monthly Report
 December 21 1 Housing Bulletin Monthly Report Alberta Housing Starts Fall in November 21 Canada Housing Starts 25 2 15 1 5 8 NOV 8 DEC 8 Preliminary Housing Starts in Alberta* and Canada* November 28 to
Rental Market report. British Columbia Highlights* Highlights. Housing market intelligence you can count on
 H o u s i n g M a r k e t I n f o r m a t i o n Rental Market report Highlights* C a n a d a M o r t g a g e a n d H o u s i n g C o r p o r a t i o n Date Released: Spring 2012 Figure 1 Figure 2 Vancouver
INDEXING THE GST NEW HOUSING REBATE: THE MOST URGENT ISSUE FOR THE FEDERAL BUDGET
 INDEXING THE GST NEW HOUSING REBATE: THE MOST URGENT ISSUE FOR THE FEDERAL BUDGET Canadian Home Builders Association Pre-Budget Submission August 2008 Summary The most urgent issue for the Canadian Home
GOVERNMENT. Case Study Ville de Trois Rivières streamlines property assessment
 GOVERNMENT Case Study Ville de Trois Rivières streamlines property assessment GIS-generated parcel basemap provides powerful visualization & analysis capabilities With a population of just over 130,000,
RENTAL MARKET REPORT. Manitoba Highlights* Highlight Box. Housing market intelligence you can count on
 H o u s i n g M a r k e t I n f o r m a t i o n RENTAL MARKET REPORT Manitoba Highlights* C a n a d a M o r t g a g e a n d H o u s i n g C o r p o r a t i o n Date Released: Spring 2011 Figure 1 Winnipeg
HOUSING NOW Canada. Highlights SUBSCRIBE NOW! Table of Contents. Housing market intelligence you can count on
 Housing Market Information HOUSING NOW Canada Date Released: April 2015 Highlights Housing starts were trending 1 at 179,016 units in March compared to 180,236 in February. The stand-alone monthly SAAR
Table of Contents. Title Page # Title Page # List of Tables ii 6.7 Rental Market - Townhome and Apart ment Rents
 RESIDENTIAL MONITORING REPORT 2013 Table of Contents Title Page # Title Page # List of Tables ii 6.7 Rental Market - Townhome and Apart ment Rents 21 List of Figures iii 7.0 Other Housing Demands and Trends
CREA Updates and Extends Resale Housing Market Forecast Ottawa, ON, March 15, 2017
 CREA Updates and Extends Resale Housing Market Ottawa, ON, March 15, 2017 The Canadian Real Estate Association (CREA) has updated its forecast for home sales activity via the Multiple Listing Service (MLS
Housing Bulletin Monthly Report
 January 21 1 Housing Bulletin Monthly Report Most new homes built in second half of 29 25, 2, 15, 1, 5, Dec 7 Jan 8 Feb 8 mar 8 apr 8 Alberta s 29 housing starts increased 72.8 per cent over 28, suggesting
HOUSING IN OUR COMMUNITIES: THE NUMBERS
 HOUSING IN OUR COMMUNITIES: THE NUMBERS 3/6/2014 South Shore Housing Action Coalition (SSHAC) Prepared by Nancy Green Public Health Services, Bridgewater, NS TABLE OF CONTENTS HOUSING IN OUR COMMUNITIES...
Rental Housing Strategy Study # 1
 Rental Housing Strategy Study # 1 Submitted to: City of Vancouver by: Will Dunning Inc November 2009 Table of Contents Table of Contents... 1 Part 1 Summary and Conclusions... 2 Introduction... 2 Housing
HOUSING MARKET OUTLOOK Calgary CMA
 H o u s i n g M a r k e t I n f o r m a t i o n HOUSING MARKET OUTLOOK Calgary CMA C a n a d a M o r t g a g e a n d H o u s i n g C o r p o r a t i o n Date Released: Fall 2011 NEW HOME MARKET Total housing
HOUSING MARKET OUTLOOK REPORT
 2015 HOUSING MARKET OUTLOOK REPORT CANADIAN OVERVIEW Most regions posted modest gains in average residential sale price, despite increased inventory in many of Canada s housing markets. Residential property
A New Beginning: A National Non-Reserve Aboriginal Housing Strategy
 14 A New Beginning: A National Non-Reserve Aboriginal Housing Strategy Steve Pomeroy, on behalf of The National Aboriginal Housing Association/ Association Nationale d Habitation Autochtone (NAHA/ANHA)
Trends in Housing Occupancy
 This bulletin is one in a series of background bulletins to the Official Plan Review. It provides an analysis of changes in household composition and housing occupancy between 1996 and 2006. A copy of
êéëé~êåü=üáöüäáöüí Code Requirements and Costs of Incorporating Accessory Apartments in Houses
 êéëé~êåü=üáöüäáöüí May 2009 Technical Series 09-102 Code Requirements and Costs of Incorporating Accessory Apartments in Houses áåíêççìåíáçå Canada Mortgage and Housing Corporation commissioned a study
Kitchener-Cambridge-Waterloo and Guelph CMAs
 H o u s i n g M a r k e t I n f o r m a t i o n Housing Now Kitchener-Cambridge-Waterloo and Guelph CMAs C a n a d a M o r t g a g e a n d H o u s i n g C o r p o r a t i o n Date Released: Kitchener-Cambridge-Waterloo
WHERE WILL WE LIVE? ONTARIO S AFFORDABLE RENTAL HOUSING CRISIS
 WHERE WILL WE LIVE? ONTARIO S AFFORDABLE RENTAL HOUSING CRISIS 48% of Ontario renters make less than $40,000 a year. Nearly half of Ontario renters pay unaffordable rental housing costs. 46% of all renters
HOUSING MARKET OUTLOOK
 HOUSING MARKET INFORMATION HOUSING MARKET OUTLOOK Kitchener-Cambridge-Waterloo CMAs C A N A D A M O R T G A G E A N D H O U S I N G C O R P O R A T I O N Date Released: Fall 2017 Figure 1 5,000 4,000 3,000
Edmonton Rental Market Overview
 Edmonton Rental Market Overview Brent Weimer, Principal, Market Analysis May 9, 2017 Economic and Demographic Highlights 2 Edmonton CMA Employment Growth Full-time jobs lower year-over-year yr/yr employment
THAT Council receives for information the Report from the Planner II dated April 25, 2016 with respect to the annual Housing Report update.
 Report to Council Date: April 25, 2016 File: 1200-40 To: From: Subject: City Manager Laura Bentley, Planner II, Policy & Planning Annual Housing Report Update Recommendation: THAT Council receives for
HOUSING MARKET OUTLOOK St. John s CMA
 H o u s i n g M a r k e t I n f o r m a t i o n HOUSING MARKET OUTLOOK St. John s CMA C a n a d a M o r t g a g e a n d H o u s i n g C o r p o r a t i o n Date Released: Fall 2014 Highlights New home
HOUSING TRENDS AND AFFORDABILITY
 HOUSING TRENDS AND AFFORDABILITY August 12 RBC Housing Affordability Measures - Canada 86 88 9 92 94 96 98 2 4 6 8 1 12 RBC Affordability Measure - bungalow of household income taken up by ownership costs
Housing Bulletin Monthly Report
 February 211 1 Housing Bulletin Monthly Report Alberta s preliminary housing starts declined in January 211 Canada Housing Starts 25, 2, 15, 1, 5, DEC 8 JAN 9 Preliminary Housing Starts in Alberta* and
Impact of the Housing Market on the Economy and the Challenges Surrounding Access to Homeownership
 Impact of the Housing Market on the Economy and the Challenges Surrounding Access to Homeownership February 1, 2017 The impact of the housing market on the economy and the challenges surrounding access
Document under Separate Cover Refer to LPS State of Housing
 Document under Separate Cover Refer to LPS5-17 216 State of Housing Contents Housing in Halton 1 Overview The Housing Continuum Halton s Housing Model 3 216 Income & Housing Costs 216 Indicator of Housing
Myth Busting: The Truth About Multifamily Renters
 Myth Busting: The Truth About Multifamily Renters Multifamily Economics and Market Research With more and more Millennials entering the workforce and forming households, as well as foreclosed homeowners
Economic Impacts of MLS Home Sales and Purchases in Canada and the Provinces
 Economic Impacts of MLS Home Sales and Purchases in Canada and the Provinces 2006 2008 FINAL REPORT April 24, 2009 Economic Impacts of MLS Home Sales and Purchases in Canada and the Provinces 2006-2008
RBC-Pembina Home Location Study. Understanding where Greater Toronto Area residents prefer to live
 RBC-Pembina Home Location Study Understanding where Greater Toronto Area residents prefer to live RBC-Pembina Home Location Study: Understanding where Greater Toronto Area residents prefer to live July
Northern Ontario. New Home Market. Sudbury CMA Housing Starts. Single Family Construction Finishes Slightly Ahead of 2002 in Sudbury and Thunder Bay
 Northern Ontario New Home Market Single Family Construction Finishes Slightly Ahead of 22 in Sudbury and Thunder Bay Sixteen single-detached starts in December in Thunder Bay CMA lifted the total number
Winnipeg and Manitoba Housing Data
 Winnipeg and Manitoba Housing Data Compiled by Josh Brandon Researcher, Housing and Community Development Canadian Centre for Policy Alternatives- Manitoba January 17, 2014 Core Housing Need... 2 Renting
Sherbrooke CMA. Highlights. Date Released: Fourth Quarter Highlights. Table of Contents. Housing market intelligence you can count on
 H o u s i n g M a r k e t I n f o r m a t i o n Housing Now Sherbrooke CMA C a n a d a M o r t g a g e a n d H o u s i n g C o r p o r a t i o n Table of Contents Date Released: Fourth Quarter 1 Highlights
Economic Impact of Commercial Multi-Unit Residential Property Transactions in Toronto, Calgary and Vancouver,
 Economic Impact of Commercial Multi-Unit Residential Property Transactions in Toronto, Calgary and Vancouver, 2006-2008 SEPTEMBER 2009 Economic Impact of Commercial Multi-Unit Residential Property Transactions
Ontario Rental Market Study:
 Ontario Rental Market Study: Renovation Investment and the Role of Vacancy Decontrol October 2017 Prepared for the Federation of Rental-housing Providers of Ontario by URBANATION Inc. Page 1 of 11 TABLE
Housing Bulletin Monthly Report
 October 21 1 Housing Bulletin Monthly Report Housing Starts show Slight improvement in September CANADA Housing Starts 2, 15, 1, 5, Sep 8 Oct 8 Nov 8 Dec 8 Preliminary Housing Starts in Alberta and Canada
A Tale of Two Canadas
 Centre for Urban and Community Studies Research Bulletin #2 August 2001 A Tale of Two Canadas Homeowners Getting Richer, Renters Getting Poorer Income and Wealth Trends in Toronto, Montreal and Vancouver,
Overriding Preference for Ground- Related Housing by GTA Millennials and Other Recent and Prospective Buyers
 Overriding Preference for Ground- Related Housing by GTA Millennials and Other Recent and Prospective Buyers September 26, 2017 Overriding Preference for Ground-Related Housing by GTA Millennials and Other