METRO NJ REAL ESTATE MARKET REPORT
|
|
|
- Kerry Harrison
- 6 years ago
- Views:
Transcription

1 1H 2013 HOBOKEN AND DOWNTOWN JERSEY CITY
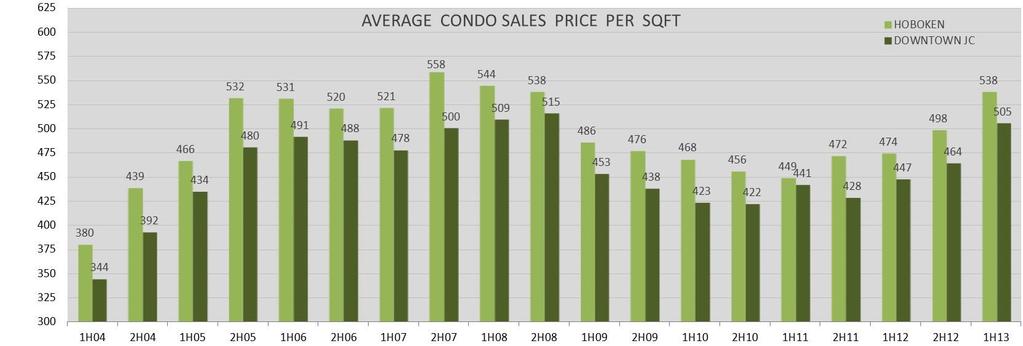
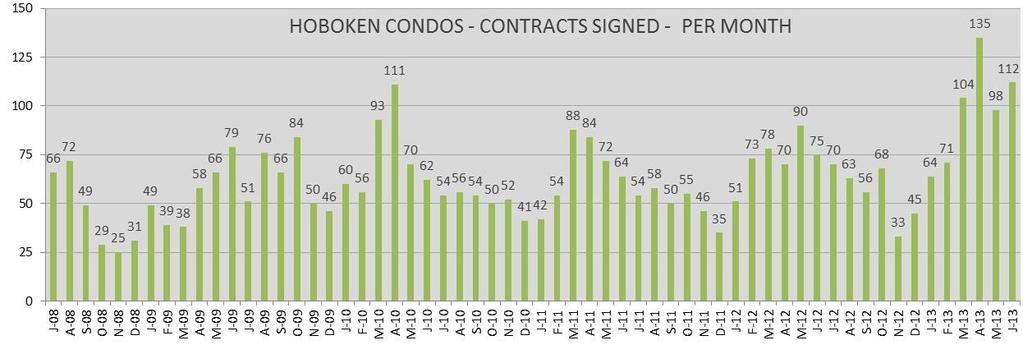
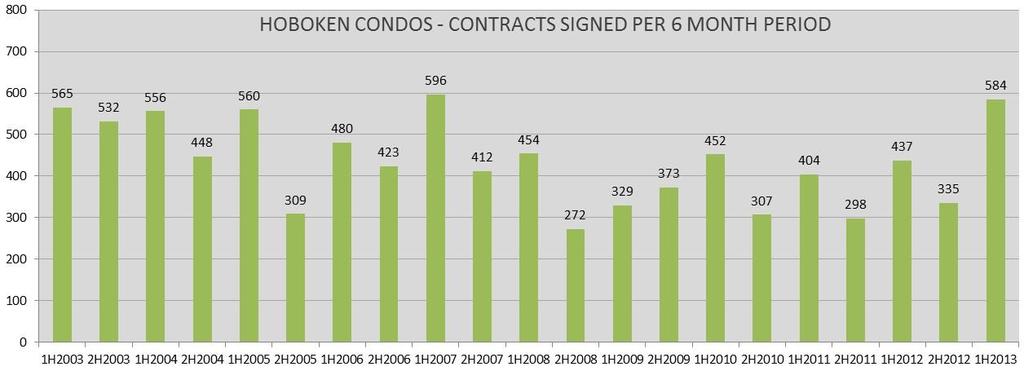
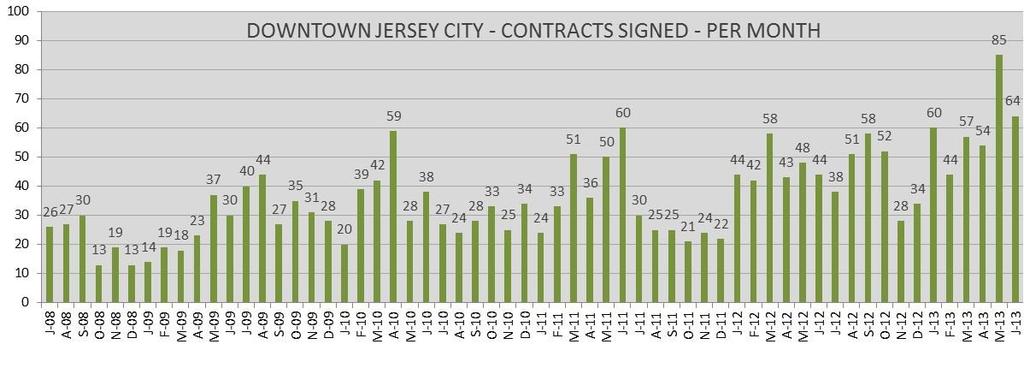
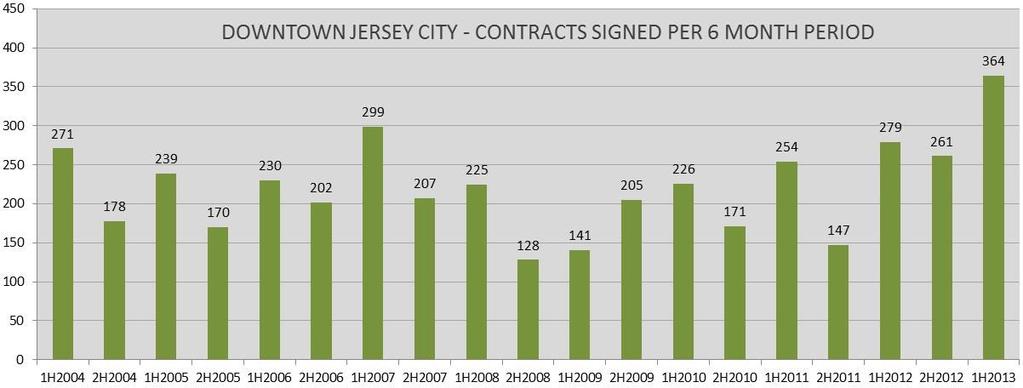
2 MARKET RECAP In our last market report, we predicted prices to continue rising in 2013, however over the last 6 months the real estate market has exceeded our expectations in both valuation and activity. The market prices were driven up by extremely low inventory combined with rock bottom interest rates, and activity increased due to a sustained economic recovery and widespread positive news about the housing market rebound. With the apartment rental market holding steady at prices that have risen 20% in the past couple years, tenants looked to the advantages of home ownership and found a fiercely competitive bidding environment for the most desirable homes. Of the 430 condos closed in Hoboken during the first half of 2013, an astonishing 47% sold at or above the asking price, narrowing the average discount from asking to under 1%. Downtown Jersey City experienced a similar market with 39% of condos selling at or over asking. Townhomes also traded very well resulting in average prices moving up almost 15% in Hoboken since 2012 and several Hoboken properties sold well above the $2M mark. Downtown Jersey City townhomes also saw a high demand pushing prices up 25% from 2012 but sales were restrained from a lack of supply resulting in the total sales volume moving down 30%. In spite of interest rates moving up over the past month, rates are still considered to be near historic lows and we have seen the increase as a motivating factor for potential buyers to act now or pay a higher rate in the future. With a shortage of new construction condominium developments coming online in the near future in Hoboken and Downtown Jersey City, we foresee property values continuing to rise throughout the remainder of HOBOKEN Average Condo Sales Price: $567,285- UP 10.9% Average Condo Price/SF: UP 13.4% Average Days on Market: DOWN 41.7% Condos Under Contract within Period: UP 34.1% Condo Sales Volume: $244M - UP 37.9% Avg Condo Discount from Last Ask: -0.7% - DOWN 76.2 Avg Townhome Sales Price: $1,307,560 - UP 15.8% POSITIVE MARKET INDICATORS (compared to 1H2012) DOWNTOWN JERSEY CITY Average Condo Sales Price: $525,109 - UP 13.7% Average Condo Price/SF: UP 13.0% Average Days on Market: DOWN 44.6% Condos Under Contract within Period: UP 30.5% Condo Sales Volume: $149MM - UP 67.3% Avg Condo Discount from Last Ask: -1.3% - DOWN 55.0% Avg Townhome Sales Price: $872,687M - UP 24.7% 2

3 TOTAL SALES VOLUME BY PROPERTY TYPE Property Type 1H2013 2H2012 % Change 1H2012 % Change Hoboken Condos $243,932,495 $209,487, % $176,952, % Hoboken Townhomes $37,919,232 $39,390, % $32,751, % Downtown JC Condos $149,131,012 $118,021, % $89,131, % Downtown JC Townhomes $20,944,498 $34,185, % $23,791, % Total Sales Volume $451,927,237 $401,084, % $322,626, % 3


4 CONDO MARKET REGIONAL COMPARISON 1st Half 2013 Downtown JC Hoboken Brooklyn* Manhattan Average Sales Price $525,109 $567,285 $1,079,147 $1,798,159 Average Price / SqFt * Brooklyn Heights - Carroll Gardens - Cobble Hill - Columbia Street Waterfront - Dumbo - Red Hook 4
5 HOBOKEN CONDO MARKET SUMMARY 1H2013 2H2012 % Change 1H2012 % Change Average Sales Price $567,285 $525, % $511, % Average Price / SqFt % % Total Value of Condos Sold $243,932,495 $209,487, % $176,952, % Average DOM of Sold Condos % % Inventory (months) % % On Market at Period End % % Listed within Period % % Under Contract within Period % % Closed within Period % % AVG % Discount from Original Asking -1.0% -3.2% -67.7% -4.3% -76.1% AVG % Discount from Last Asking -0.7% -2.1% -67.0% -2.8% -76.2% 5
6 DOWNTOWN JERSEY CITY CONDO MARKET SUMMARY 1H2013 2H2012 % Change 1H2012 % Change Average Sales Price $525,109 $489, % $461, % Average Price / SqFt % % Total Value of Condos Sold $149,131,012 $118,021, % $89,131, % Average DOM of Sold Condos % % Inventory (months) % % On Market at Period End % % Listed within Period % % Under Contract within Period % % Closed within Period % % AVG % Discount from Original Asking -1.6% -3.6% -55.3% -4.0% -59.5% AVG % Discount from Last Asking -1.3% -2.6% -50.6% -2.8% -55.0% 6


7 Millions METRO NJ REAL ESTATE MARKET REPORT $325 $300 $275 $259 TOTAL CONDO SALES VOLUME (MILLIONS) $267 HOBOKEN DOWNTOWN JC $250 $244 $225 $200 $208 $209 $197 $206 $225 $215 $206 $194 $201 $210 $209 $175 $168 $169 $177 $150 $153 $149 $125 $100 $75 $50 $56 $71 $66 $89 $75 $75 $97 $118 $108 $87 $118 $48 $76 $84 $76 $80 $81 $89 $118 $25 $0 1H04 2H04 1H05 2H05 1H06 2H06 1H07 2H07 1H08 2H08 1H09 2H09 1H10 2H10 1H11 2H11 1H12 2H12 1H13 7
8 8
9 9
10 10

11 11
12 HOBOKEN TOWNHOME SALES SUMMARY 1H2013 2H2012 % Change 1H2012 % Change Average Sales Price $1,307,560 $1,193, % $1,129, % 1 Family Average Sales Price $1,435,684 $1,132, % $1,253, % 2 Family Average Sales Price $1,000,154 $1,487, % $755, % 3 Family Average Sales Price $1,320,000 $1,040, % $930, % Average % Discount From Asking -1.1% -4.0% -72.9% -3.4% -67.7% # Closed % % Average Closed per Month % % Average Days on Market % % 1 Family Total Sales Volume $27,278,000 $18,125, % $25,075, % 2 Family Total Sales Volume $8,001,232 $11,903, % $3,022, % 3 Family Total Sales Volume $2,640,000 $9,361, % $4,653, % Grand Total Sales Volume $37,919,232 $39,390, % $32,751, % 12
13 TYPE ADDRESS LOT SIZE METRO NJ REAL ESTATE MARKET REPORT SINGLE FAMILY HOBOKEN TOWNHOMES - CLOSED TOTAL BEDs DAYS ON MARKET CLOSING DATE ASKING PRICE SOLD PRICE One Family 13 WILLOW TERRACE 12.5 x /19/2013 $499,000 $525, % % FROM ASKING One Family 310 PARK AVE 16 x /31/2013 $725,000 $600, % One Family 724 PARK AVE 12.5 x /13/2013 $675,000 $660, % One Family 1109 GARDEN ST x /13/2013 $675,000 $675, % One Family 522 JEFFERSON ST 35 x /1/2013 $999,000 $999, % One Family 1035 PARK AVE 21.5 x /6/2013 $1,199,000 $1,080, % One Family TH ST 15 x /14/2013 $1,200,000 $1,150, % One Family 218 7TH ST 15.5 x /24/2013 $1,249,000 $1,235, % One Family 1249 BLOOMFIELD ST x /3/2013 $1,300,000 $1,300, % One Family 1134 BLOOMFIELD ST x /25/2013 $1,399,000 $1,380, % One Family 1225 BLOOMFIELD ST 15 x /25/2013 $1,550,000 $1,580, % One Family TH ST 16 x /25/2013 $1,600,000 $1,600, % One Family 1108 GARDEN ST 19 x /24/2013 $1,625,000 $1,685, % One Family 1238 GARDEN ST x /21/2013 $1,699,000 $1,750, % One Family 1108 BLOOMFIELD ST 16 x /31/2013 $1,800,000 $1,860, % One Family 1230 GARDEN ST x /14/2013 $2,299,000 $2,299, % One Family 631 GARDEN ST 20 x /10/2013 $2,300,000 $2,300, % One Family 731 BLOOMFIELD ST 20 x /27/2013 $2,100,000 $2,300, % One Family 1130 GARDEN ST x /29/2013 $2,395,000 $2,300, % AVERAGE $1,436,211 $1,435, % TOTAL VALUE $27,278,000 13
14 TYPE ADDRESS LOT SIZE TWO FAMILY HOBOKEN TOWNHOMES - CLOSED TOTAL BEDs DAYS ON MARKET CLOSING DATE ASKING PRICE SOLD PRICE % FROM ASKING Two Family 312 PARK AVE 16 x /31/2013 $725,000 $600, % Two Family 258 8TH ST 17 x /14/2013 $585,000 $650, % Two Family 515 BLOOMFIELD ST x /10/2013 $899,900 $935, % Two Family 106 4TH ST x 50 IRR /21/2013 $999,999 $975, % Two Family 930 WILLOW AVE 13 x /28/2013 $989,000 $990, % Two Family 612 GARDEN ST x /30/2013 $949,000 $995, % Two Family TH ST 30 x /8/2013 $1,250,000 $1,130, % Two Family 1232 BLOOMFIELD ST 15 x /25/2013 $1,650,000 $1,726, % AVERAGE $1,005,987 $1,000, % TOTAL VALUE $8,001,232 TYPE ADDRESS LOT SIZE THREE FAMILY HOBOKEN TOWNHOMES - CLOSED TOTAL BEDs DAYS ON MARKET CLOSING DATE ASKING PRICE SOLD PRICE Three Family 618 GARDEN ST 18 x 100 IRR /28/2013 $1,250,000 $1,185, % Three Family 1018 BLOOMFIELD ST 20 x /7/2013 $1,590,000 $1,455, % % FROM ASKING AVERAGE $1,420,000 $1,320, % TOTAL VALUE $2,640,000 14
15 DOWNTOWN JERSEY CITY TOWNHOME SALES SUMMARY 1H2013 2H2012 % Change 1H2012 % Change Average Sales Price $872,687 $743, % $699, % 1 Family Average Sales Price $842,437 $639, % $616, % 2 Family Average Sales Price $877,111 $801, % $747, % 3 Family Average Sales Price $901,571 $793, % $742, % Average % Discount From Asking -4.4% -5.3% -17.3% -5.1% -14.4% # Closed % % Average Closed per Month % % Average Days on Market % % 1 Family Total Sales Volume $6,739,499 $10,226, % $7,400, % 2 Family Total Sales Volume $7,894,000 $14,431, % $8,964, % 3 Family Total Sales Volume $6,310,999 $9,526, % $7,425, % Grand Total Sales Volume $20,944,498 $34,185, % $23,791, % 15
16 SINGLE FAMILY DOWNTOWN JERSEY CITY TOWNHOMES - CLOSED TYPE ADDRESS LOT SIZE TOTAL BEDs DAYS ON MARKET CLOSING DATE ASKING PRICE SOLD PRICE % FROM ASK- ING One Family 333 7TH ST 12.5 x /17/2013 $499,000 $499, % One Family 339 8TH ST x /18/2013 $629,000 $637, % One Family 254 5TH ST 15 x /18/2013 $669,000 $645, % One Family 103 ERIE ST x /6/2013 $849,000 $840, % One Family 141 COLES ST x /28/2013 $911,000 $943, % One Family 300 8TH ST 16 x /14/2013 $990,000 $950, % One Family 296 8TH ST 16 x /3/2013 $1,150,000 $999, % One Family 22 WEST HAMILTON PL x /29/2013 $1,200,000 $1,225, % AVERAGE $862,125 $842, % TOTAL VALUE $6,739,499 16
17 TWO FAMILY DOWNTOWN JERSEY CITY TOWNHOMES - CLOSED TYPE ADDRESS LOT SIZE TOTAL BEDs DAYS ON MARKET CLOSING DATE ASKING PRICE SOLD PRICE % FROM ASK- ING Two Family 396 7TH ST x /10/2013 $269,000 $269, % Two Family 317 1/2 7TH ST x /14/2013 $579,000 $565, % Two Family 291 MONMOUTH ST x /5/2013 $800,000 $775, % Two Family TH ST 12.5 x /14/2013 $935,000 $825, % Two Family 405 MANILA AVE 27 x /7/2013 $899,000 $830, % Two Family 136 ERIE ST x /9/2013 $1,100,000 $950, % Two Family 130 MERCER ST 20 x /14/2013 $1,200,000 $976, % Two Family 526 MANILA AVE 18 x /5/2013 $1,189,000 $1,125, % Two Family 322 8TH ST 25 x /22/2013 $1,579,000 $1,579, % AVERAGE $950,000 $877, % TOTAL VALUE $7,894,000 17
18 THREE FAMILY DOWNTOWN JERSEY CITY TOWNHOMES - CLOSED TYPE ADDRESS LOT SIZE TOTAL BEDs DAYS ON MARKET CLOSING DATE ASKING PRICE SOLD PRICE % FROM ASK- ING Three Family 257 GROVE ST x /6/2013 $600,000 $522, % Three Family 436 2ND ST 20 x /1/2013 $599,000 $599, % Three Family 36 ERIE ST x /11/2013 $675,000 $665, % Three Family 136 ESSEX ST 25 x /26/2013 $945,000 $975, % Three Family 616 JERSEY AVE x /15/2013 $949,000 $999, % Three Family 115 SUSSEX ST x /25/2013 $1,349,000 $1,150, % Three Family 75 MORRIS ST x 80 IRR /2/2013 $1,499,000 $1,400, % AVERAGE $945,143 $901, % TOTAL VALUE $6,310,999 18
19 PREPARED BY: HUDSON REALTY GROUP AT HALSTEAD PROPERTY NJ LLC Matt Brown, EVP Peter Cossio, EVP Lindsey Brown Clare Cossio This information may not be copied, commercially used or distributed without Halstead Property s prior consent. This data includes all condos that were listed in within the Hudson County MLS, MLS records do not include some new construction developments. While information is believed true, no guaranty is made of accuracy. METRO NJ OFFICE: 79 Hudson Street, Hoboken NJ, Visit hudsonrealtygroup.com for access to all of our reports, listings, neighborhood information and more.
METRO NJ REAL ESTATE MARKET REPORT
 2H 2012 HOBOKEN AND DOWNTOWN JERSEY CITY MARKET RECAP The real estate market in Hoboken and Downtown Jersey City continued to rebound during the second half of 2012 with average selling prices, price/sf
METRO NJ REAL ESTATE MARKET REPORT
 2H 2010 HOBOKEN AND DOWNTOWN JERSEY CITY 100 Garden Street, Hoboken, NJ: $1,12,000 MARKET RECAP The second half of 2010 showed a decrease in sales activity due not only to the usual seasonal drop off but
METRO NJ REAL ESTATE MARKET REPORT
 2H 2011 HOBOKEN AND DOWNTOWN JERSEY CITY 95 Bloomfield Street, Hoboken, NJ: $1,00,000 MARKET RECAP The Hoboken and downtown Jersey City real estate market continued the pace of sales seen during the first
METRO NJ REAL ESTATE MARKET REPORT
 1H 2010 HOBOKEN AND DOWNTOWN JERSEY CITY 64 Madison St, Hoboken, NJ: $575,000 MARKET RECAP Hoboken and Jersey City Real estate sales started out with a bang in 2010 with a robust spring selling season
Third Quarter 2018 Market Report Brooklyn Residential
 Market Report Brooklyn Residential Data Highlights Cover Property: halstead.com WEB# 18921216# The median apartment price fell 3% in Brooklyn over the past year. Co-op prices rose in Brooklyn, while condo
BROOKLYN RESIDENTIAL MARKET REPORT
 2017 SECOND BROOKLYN RESIDENTIAL MARKET REPORT QUARTER Data Highlights Cover Property: halstead.com WEB# 13291164 While down from last quarter s record $947,732, the average apartment price in Brooklyn
BROOKLYN RESIDENTIAL MARKET REPORT
 2017 THIRD BROOKLYN RESIDENTIAL MARKET REPORT QUARTER Data Highlights Cover Property: halstead.com WEB# 15453135 The average apartment price fell for the second straight quarter in Brooklyn, but remained
First Quarter 2019 Market Report Manhattan Residential
 Market Report Manhattan Residential Data Highlights Cover Property: Halstead.com WEB# 19451837 The average price for a resale apartment declined 3% over the past year to $1,575,059. New development prices
Manhattan Residential. SECOND quarter
 2016 Manhattan Residential MARket Report SECOND quarter Data Highlights Cover Property: halstead.com WEB# 14786560 The average and median prices fell from last quarter s records, but remain higher than
BROOKLYN RESIDENTIAL MARKET REPORT
 2016 THIRD BROOKLYN RESIDENTIAL MARKET REPORT QUARTER Data Highlights Cover Property: halstead.com WEB# 15363401 Apartment prices reached new records, fueled by a surge of luxury new development closings
Manhattan Residential. THIRD quarter
 2015 Manhattan Residential MARket Report THIRD quarter Data Highlights Cover Property: halstead.com WEB# 13231035 $995,000 New record median price for Manhattan apartments. Reported sales up 9% from. halstead.com
MANHATTAN RESIDENTIAL MARKET REPORT THIRD QUARTER
 2017 MANHATTAN RESIDENTIAL MARKET REPORT THIRD QUARTER Data Highlights THIRD QUARTER 2017 Cover Property: halstead.com WEB# 15229338 The average apartment price dipped below $2 million for the first time
B R O W N S T O N E B R O O K LY N M A R K E T R E P O R T
 1Q18 B R O W N S T O N E B R O O K LY N MARKET REPORT BRENNAN 1Q18 BROWNSTONE BROOKLYN MARKET REPORT Overview We continue to expand our coverage of the neighborhoods we are actively working in with our
Fourth Quarter 2018 Market Report Manhattan Residential
 Market Report Manhattan Residential Data Highlights Cover Property: Halstead.com WEB# 19041474 A pickup in luxury new development closings pushed the average price higher than a year ago. The median apartment
QUARTERLY MARKET REPORT
 fourth QUARTER 2011 QUARTERLY MARKET REPORT Manhattan s and s Average and Median Sale Price Manhattan apartment prices averaged $1,391,745 in the fourth quarter of 2011, 3% less than a year ago. A leading
MANHATTAN RESIDENTIAL MARKET REPORT
 2017 FOURTH MANHATTAN RESIDENTIAL MARKET REPORT QUARTER Data Highlights FOURTH QUARTER 2017 Cover Property: halstead.com WEB# 17690202 The average apartment price fell for the second straight quarter,
HOBOKEN/DOWNTOWN JERSEY CIT Y MARKET REPORT THIRD QUARTER
 217 HOBOKEN/DOWNTOWN JERSEY CIT Y MARKET REPORT THIRD QUARTER Hoboken ALL APARTMENTS The average sale price of Hoboken apartments reached $815,, an increase of 6% over prior year. The median sale price
MANHATTAN RESIDENTIAL MARKET REPORT FOURTH QUARTER
 2016 MANHATTAN RESIDENTIAL MARKET REPORT FOURTH QUARTER Data Highlights Cover Property: halstead.com WEB# 15919235 Apartment prices averaged a record $2,110,566, fueled by new development closings Resale
SECOND QUARTER 2013 QUARTERLY MARKET REPORT
 SECOND QUARTER 2013 QUARTERLY MARKET REPORT Manhattan s and s Average and Median Sale Price Manhattan apartment prices averaged just over $1.4 million in the second quarter, 3% less than a year ago. A
QUARTERLY MARKET REPORT FIRST QUARTER 2013
 QUARTERLY MARKET REPORT FIRST QUARTER 2013 Manhattan s and s Average and Median Sale Price While the average apartment price fell 16% over the past year in Manhattan, the decline was due to the rush of
Manhattan Residential. FOURTH quarter
 2015 Manhattan Residential MARket Report FOURTH quarter Data Highlights FOURTH Quarter 2015 Cover Property: halstead.com WEB# 13676219 The average and median price for all apartments set new records in
March 2019 Inventory Report Manhattan Apartments
 March 019 Inventory Report Manhattan Apartments March 019 Highlights Manhattan had an.-month supply of apartments for sale in March, 33% higher than a year ago. At 7. months, the supply for coops remains
MANHATTAN RESIDENTIAL MARKET REPORT SECOND QUARTER
 2017 MANHATTAN RESIDENTIAL MARKET REPORT SECOND QUARTER Data Highlights SECOND QUARTER 2017 Cover Property: halstead.com WEB# 16183475 New records were set for average and median apartment prices, as high-end
Third Quarter Market Report I Hoboken/Downtown Jersey City
 Third Quarter 2018 Market Report I Hoboken/Downtown Jersey City Hoboken ALL APARTMENTS $833,000 $703,000 $848,000 $770,000 $877,000 $770,000 $813,000 $750,000 $810,000 $743,000 0 239 165 210 240 The average
QUARTERLY MARKET REPORT
 First QUARTER 2010 QUARTERLY MARKET REPORT Manhattan s and s Average and Median Sale Price Although the number of sales rose dramatically, both the average and median price for apartments remained below
Second Quarter 2018 Market Report Brooklyn Residential
 Market Report Brooklyn Residential Data Highlights Cover Property: BrownHarrisStevens.com WEB# 18689997 Brooklyn apartment prices averaged $869,587 in the second quarter, 4% less than a year ago. New development
HOBOKEN/DOWNTOWN JERSEY CIT Y MARKET REPORT SECOND QUARTER
 217 HOBOKEN/DOWNTOWN JERSEY CIT Y MARKET REPORT SECOND QUARTER Hoboken ALL APARTMENTS The average sale price of Hoboken apartment sales reached $814,, an increase of 11%. The median sale price also rose
2nd Quarter Flatbush Fort Greene Brooklyn. A comprehensive analysis of the residential real estate market in Brooklyn.
 Prospect Park South Red Hook Sheepshead Bay Sunset Park Williamsburg Windsor Terrace Bath Beach Bensonhurst Bay Ridge Bedford - Stuyvesant Boerum Hill Brooklyn Heights Bushwick Carroll Gardens Clinton
QUARTERLY MARKET REPORT SECOND QUARTER 2010
 QUARTERLY MARKET REPORT SECOND QUARTER 2010 Manhattan s and s Average and Median Sale Price Manhattan apartment closings rose 81% compared to a year ago, reaching their highest level since the third quarter
3rd Quarter Flatbush Fort Greene Brooklyn. A comprehensive analysis of the residential real estate market in Brooklyn.
 Prospect Park South Red Hook Sheepshead Bay Sunset Park Williamsburg Windsor Terrace The Corcoran Report Bath Beach Bensonhurst Bay Ridge Bedford - Stuyvesant Boerum Hill Brooklyn Heights Bushwick Carroll
Third Quarter 2018 Market Report Brooklyn Residential
 Market Report Brooklyn Residential Data Highlights Cover Property: BrownHarrisStevens.com WEB# 18360052 The median apartment price fell 3% in Brooklyn over the past year. Co-op prices rose in Brooklyn,
ESSEX COUNT Y, NEW JERSEY MARKET REPORT THIRD QUARTER
 2017 ESSEX COUNT Y, NEW JERSEY MARKET REPORT THIRD QUARTER Montclair The average sale price reached $786,000, an increase of 5% over prior year. The median sale price also rose ending at $735,000 or 4%
MANHATTAN RESIDENTIAL MARKET REPORT FIRST QUARTER
 2018 MANHATTAN RESIDENTIAL MARKET REPORT FIRST QUARTER Data Highlights FIRST QUARTER 2018 Cover Property: halstead.com WEB# 18230107 The average price for all apartments fell 8% from a year ago to $1,987,045,
Fourth Quarter 2017 BROOKLYN RESIDENTIAL MARKET REPORT
 Fourth Quarter 2017 BROOKLYN RESIDENTIAL MARKET REPORT Data Highlights Cover Property: BrownHarrisStevens.com WEB# 16254860 The average apartment price fell 5% in Brooklyn from a year ago, as buyers favored
FOURTH QUARTER 2009 QUARTERLY MARKET REPORT
 FOURTH QUARTER 2009 QUARTERLY MARKET REPORT Manhattan s and s Average and Median Sale Price While both the average and median sale price for Manhattan apartments fell compared to the fourth quarter of
Fourth Quarter 2018 Market Report Brooklyn Residential
 Market Report Brooklyn Residential Data Highlights Cover Property: BrownHarrisStevens.com WEB# 19024015 The average apartment price in Brooklyn was slightly lower than a year ago. Prices were higher over
Peter Comitini Senior VP Associate Broker The Corcoran Group
 Sutton Area TriBeCa Upper East Side Upper West Side Washington Heights West Village Battery Park City Beekman Carnegie Hill Central Park South Chelsea Flatiron Clinton East Harlem East Village Financial
New Development Year-End Report
 New Development Year-End Report 2017 MANHATTAN $ 2,610 $ 2,282 $ 2,133 0.9% YoY PER SQ. FT. ACTIVE 2.2% YoY PER SQ. FT. CONTRACT SIGNED 2.3% YoY PER SQ. FT. CLOSED BROOKLYN $ 1,440 PER SQ. FT. ACTIVE $
December 2018 Absorption Report Manhattan Apartments
 ember 01 Absorption Report Manhattan Apartments ember 01 Highlights The Manhattan absorption rate dipped from last month, to a 7.3-month supply of available units. At. months, condo absorption rates remained
OCTOBER 2017 ABSORPTION REPORT MANHATTAN APARTMENTS
 OCTOBER 17 ABSORPTION REPORT MANHATTAN APARTMENTS ober 17 Highlights Manhattan had a -month supply of apartments for sale at the beginning of ober, up % from a year ago. At 7. months, the condo absorption
BROOKLYN NEW DEVELOPMENT REPORT 2012 FIRST QUARTER 1 MNS 115 EAST 23 RD STREET, NEW YORK, NY MNS.
 TM BROOKLYN NEW DEVELOPMENT REPORT 2012 FIRST QUARTER 1 TABLE OF CONTENTS Introduction 3 Market Snapshot 4 Neighborhood Price Trends Bay Ridge 9 Bed-Stuy 10 Brooklyn Heights 11 Boerum-Cobble Hill 12 Bushwick
First Quarter 2019 Market Report Manhattan Residential
 Market Report Manhattan Residential Data Highlights Cover Property: BrownHarrisStevens.com WEB# 19429295 The average price for a resale apartment declined 3% over the past year to $1,575,059. New development
QUARTERLY MARKET REPORT FIRST QUARTER 2012
 QUARTERLY MARKET REPORT FIRST QUARTER 2012 Manhattan s and s A surge in sales over $10 million led the average Manhattan apartment price 9% higher over the past year, to $1,483,591. Closings over $10 million
QUARTERLY MARKET REPORT FOURTH QUARTER 2012
 QUARTERLY MARKET REPORT FOURTH QUARTER 2012 Manhattan s and s Average and Median Sale Price A sharp increase in highend sales brought both the average and median apartment price higher than during 2011
New Development Year-End Report
 New Development Year-End Report MANHATTAN 2,775 PER SQ. FT. ACTIVE 2,268 BROOKLYN 1,34 PER SQ. FT. ACTIVE 1,335 PER SQ. FT. CONTRACT SIGNED PER SQ. FT. CONTRACT SIGNED 1,98 1,167 PER SQ. FT. CLOSED PER
BROOKLYN NEW DEVELOPMENT REPORT 2012 SECOND QUARTER 1 MNS 115 EAST 23 RD STREET, NEW YORK, NY MNS.
 TM BROOKLYN NEW DEVELOPMENT REPORT 2012 SECOND QUARTER 1 TABLE OF CONTENTS Introduction 3 Market Snapshot 4 Neighborhood Price Trends Bay Ridge 9 Bed-Stuy 10 Brooklyn Heights 11 Boerum-Cobble Hill 12 Bushwick
JANUARY ABSOR P TION R EPORT
 JANUARY 1 ABSOR P TION R EPORT M A N H AT TA N A PA R T M EN TS JANUARY 1 Highlights The absorption rate fell to 5.1 months in January, but remained 11% higher than a year ago. At 3.9 months, the absorption
First Quarter 2016 BROOKLYN RESIDENTIAL MARKET REPORT
 First Quarter 2016 BROOKLYN RESIDENTIAL MARKET REPORT Data Highlights Cover Property: BrownHarrisStevens.com WEB# 14381790 Apartment prices averaged 5% more than a year ago BrownHarrisStevens.com WEB#
Alan M. Voorhees Transportation Center TOD Research in NJ: HBLRT Selected Stations & Other Efforts
 TOD Research in NJ: HBLRT Selected Stations & Other Efforts Martin E. Robins Director Emeritus October 31, 2009 Rail~Volution Conference Boston, MA Outline of Presentation Findings from 2008 HBLRT selected
New Development Report
 New Development Report 2017 Third Quarter MANHATTAN $ 2,537 PER SQ. FT. ACTIVE $ 2,138 PER SQ. FT. CONTRACT SIGNED $ 2,096 PER SQ. FT. CLOSED BROOKLYN $ 1,468 PER SQ. FT. ACTIVE $ 1,423 PER SQ. FT. CONTRACT
MARKET AREA UPDATE Year: 2017 Report as of: 1Q 2Q 3Q 4Q
 MARKET AREA UPDATE Year: 2017 Report as of: 1Q 2Q 3Q 4Q Market Area (City, State): Essex, Hunterdon, Middlesex, Morris, Somerset & Union Provided by (Company / Companies): BHHS New Jersey Properties Provided
New Development Report
 New Development Report 2018 First Quarter MANHATTAN $ 2,513 $ 2,185 $ 2,152 3.7% YoY PER SQ. FT. ACTIVE PER SQ. FT. CONTRACT SIGNED PER SQ. FT. CLOSED 1% YoY 4.1% YoY BROOKLYN $ 1,475 PER SQ. FT. ACTIVE
Average and Median Sale Price
 F O U R T H q u a rt e r 2 0 1 4 m a n h att a n m a r k e t r e p ort Manhattan All s & s* and Median Sale $1,603,877 $870,000 $1,700,581 $910,000 $1,674,206 $905,000 $1,649,631 $900,000 $1,728,831 $960,000
May 2013 April 2013 May 2012 Manhattan Condo Index 2,106 2, % 1, %
 Market Report NOTICE: StreetEasy is pleased to present our 2013 Q2 Quarterly Report on the residential market. This preview version of the report is based on over 1,000 broker sources and will provide
2007 Sales (thru September)
") Third Quarter Market Report Challenges, Opportunities, and Surprises, Oh My! By Dave Phillips, CEO Charlottesville Area Association of REALTORS Someone named Anonymous once said, "Many an opportunity is
Third Quarter Market Report Challenges, Opportunities, and Surprises, Oh My! By Dave Phillips, CEO Charlottesville Area Association of REALTORS Someone named Anonymous once said, "Many an opportunity is
236 Lexington Avenue Jersey City, NJ
 236 Lexington Avenue Jersey City, NJ 07304 201.780.7884 Executive Summary LOCATION: BUILDING/ UNITS: 236 Lexington Ave between Mallory Ave and Marcy Ave, Jersey City, NJ 07304 Six (6) Apartments PROPERTY
New Development Year-End Report
 New Development Year-End Report MANHATTAN $ 2,215 AVERAGE PRICE PER SQ. FT. CONTRACT SIGNED BROOKLYN $ 1,129 AVERAGE PRICE PER SQ. FT. CONTRACT SIGNED $ 2,86 $ 997 AVERAGE PRICE PER SQ. FT. CLOSED AVERAGE
North Central Jersey Association of REALTORS
 MARKET DATA REPORT North Central Jersey Association of REALTORS Provided for the month of (973) 425-0110 http://ncjar.com/ 910 Mt Kemble Ave Morristown, NJ 07960 Listings Trends The key metrics for residential
THE UA TAKE FIRST QUARTER 2017: LOW SUPPLY HIGH DEMAND HIGHER PRICES THE CYCLE CONTINUES
 THE UA TAKE FIRST QUARTER 2017: LOW SUPPLY HIGH DEMAND HIGHER PRICES THE CYCLE CONTINUES A drop in new home sales from one quarter to another or year over year can usually be attributed to lower demand
Hoboken Real Estate. Report. Brian Murray cell office
 ` Hoboken Real Estate 2016 Report Brian Murray 201-232-4568 cell 201-792-4300 office brian.murray@hobokenhomefinder.com www.hobokentotheburbs.com This free report is created by The Murray-Filipps Team,
5005 PALISADE AVE. 30-UNIT MULTIFAMILY RESIDENTIAL LUXURY RENTAL BUILDING 5005 Palisade Ave., West New York, New Jersey
 5005 PALISADE AVE. 30-UNIT MULTIFAMILY RESIDENTIAL LUXURY RENTAL BUILDING 5005 Palisade Ave., West New York, New Jersey ASKING PRICE $10,750,000 BLOCK, LOT 104, 25 LOT DIMENSIONS 150 X 140 LOT SQ/ FT BUILDING
RENTAL PROPERTY $ 2, % 3.0 % SINGLE-FAMILY NOT FOUND 1,208 NOT FOUND mi. SMALLER THAN 42 % This report provides an in-depth
 RENTAL BENCHMARKS This report provides an in-depth comparison of and other properties in the area. Powered by RentRange, this report gives you valuable insight for discerning investment property analysis.
SECOND QUARTER 2007 QUARTERLY MARKET REPORT
 SECOND QUARTER 2007 QUARTERLY MARKET REPORT QUARTERLY MARKET REPORT Manhattan The average sale price for Manhattan apartments set a new record in the second quarter, reaching $1,300,212. This figure was
Office Units Available
 Office Units Available Colgate Waterfront Corporate Campus Colgate Ferry 15 Exchange Place Exchange Place Station Grand Hyatt Outstanding Location with a Variety of Transportation Options Take advantage
Manhattan Residential Market Report FOURTH QUARTER
 2017 Manhattan Residential Market Report FOURTH QUARTER Data Highlights Cover Property: BrownHarrisStevens.com WEB# 17742845 The average apartment price fell for the second straight quarter, reaching $1,921,671.
Monthly Indicators. June Monthly Snapshot + 5.0% % + 6.6%
 Monthly Indicators 2017 Although sales have been robust locally, there has been a general slowdown in sales across much of the country, and this cannot be blamed on negative economic news. Wage growth,
The Everbach Group - Realty Executives Associates - - Copyright 2018 All Rights Reserved
 Blount County Market Overview Research Provided by Jason Everbach and Vicki Everbach August 2018 The Blount County real estate market hot-streak continues making August another excellent month! The average
THE UA TAKE FIRST QUARTER 2017:
 THE UA TAKE FIRST QUARTER 2017: SIGNS OF LIFE After experiencing generally flat conditions through much of 2016, the new multi-family home sector of Calgary s residential market showed some signs of life
Montgomery Residential Report February 2018
 Montgomery Residential Report February 2018 Monthly Indicators Recent Figures Trends Total Home Sales Current Month February 2018 274 vs. Prior Month January 2018 239 14.6% vs. Last Year February 2017
These Shattered Real Estate Records Confirm That Brooklyn Is Booming
 November 12, 2013 These Shattered Real Estate Records Confirm That Brooklyn Is Booming It s no secret that Brooklyn has changed dramatically in recent years, with hot new restaurants and an NBA basketball
The Corcoran Report 3Q17 MANHATTAN
 The Corcoran Report 3Q17 MANHATTAN Contents Third Quarter 2017 4/7 12/23 3 Overview 8 9 10 Market Wide 11 Luxury 24 4 Sales / Days on Market 5 Inventory / Months of Supply 6 7 Market Share Resale Co-ops
Mobile Residential Sales Report February 2019
 Mobile Residential Sales Report February 2019 Total Residential Sales Current Month February 2019 343 Mobile residential* sales for February '19 totaled 343 units, an increase of 12.1 percent when compared
Monthly Indicators. Monthly Snapshot. September % % - 1.2%
 Monthly Indicators 2017 Every market is unique, yet the national sentiment has given rise to the notion that housing markets are stalling. Although desirous buyers are out on an increasing number of showings,
M A N H AT T A N N E W D E V E L O P M E N T R E P O R T S E C O N D Q U A R T E R
 TM M A N H AT TA N N E W D E V E L O P M E N T R E P O R T 2012 SECOND QUARTER 1 MNS 1 1 5 E A S T 2 3 RD S T R E E T, N E W Y O R K, N Y 1 0 0 1 0 212.475.9000 INFO@MNS.COM MNS.COM TABLE OF CONTENTS Introduction
Presented to Membership of the Lake Gaston Association. Christine Thompson. June 10, 2014
 Presented to Membership of the Lake Gaston Association Christine Thompson June 10, 2014 About your speaker Christine Thompson Real Estate Sales & Service at Lake Gaston for 13+ years Advanced training
Q brooklyn. the corcoran report. peter comitini comitini.comsm
 Q2. brooklyn the corcoran report peter comitini comitini.comsm peter@comitini.com 212. 444.7844 MID YEAR brooklyn snapshot Brooklyn has seen a more modest increase in compared to the exuberant early part
Monthly Indicators. Monthly Snapshot. March % % 0.0%
 Monthly Indicators 2017 We can comfortably consider the first quarter to have been a good start for residential real estate in 2017. There was certainly plenty to worry over when the year began. Aside
generations from creating their own wealth and prohibiting them from enhancing our community by their prolonged residence in the city.
 March 15, 2017 Amy Aschenbrenner and Kyle Snyder proudly submit our 2016 Longmont Housing Affordability Review. While this is not an all- encompassing statistical analysis, it is a year over year comparison
Approved Project in Downtown Jersey City Close to Grove St. Path. Asking $1,200, Monmouth, Jersey City, Hudson County, NJ 07302
 Approved Project in Downtown Jersey City Close to Grove St. Path Asking $1,200,000 417 Monmouth, Jersey City, Hudson County, NJ 07302 LIMITING CONDITIONS This Offering Memorandum is prepared for the use
Single Family Sales Maine: Units
 Maine Home Connection 19 Commercial St Portland, Maine 04101 MaineHomeConnection.com Office: (207) 517-3100 Email: Info@MaineHomeConnection.com For the fourth consecutive year, Maine home sales set a new
Brooklyn Rental Market Report August 2015 mns.com
 Brooklyn Rental Market Report August 2015 TABLE OF CONTENTS 03 Introduction 04 A Quick Look 05 Mean Brooklyn Rental Prices 10 Brooklyn Price Trends 11 Neighborhood Price Trends 11 Bay Ridge 12 Bedford-Stuyvesant
September 2017 Market Statistics
 tember 2017 ket Statistics for Ada and Canyon Counties Monthly Analysis Despite rising home prices, today s housing market doesn t have much else in common with the market we saw prior to the recession.
THE LONG ISLAND CITY CONDOMINIUM REPORT
 THE LONG ISLAND CITY CONDOMINIUM REPORT By Patrick W. Smith Cover photo taken from the roof deck of 10-50 Jackson Avenue. THE MIDYEAR 2017 LONG ISLAND CITY CONDOMINIUM REPORT August 2017 Dear Readers,
Real Estate Market Report
 Volume II, Issue X $129.00 Value, not for resale Real Estate Market Report West Austin Properties A comprehensive report on the Austin and Central Texas real estate market. www.westaustinmarketplace.com
Brooklyn Rental Market Report September 2015 mns.com
 Brooklyn Rental Market Report September 2015 TABLE OF CONTENTS 03 Introduction 04 A Quick Look 05 Mean Brooklyn Rental Prices 10 Brooklyn Price Trends 11 Neighborhood Price Trends 11 Bay Ridge 12 Bedford-Stuyvesant
MANHATTAN NEW DEVELOPMENT REPORT 2012 FIRST QUARTER 1 MNS 115 EAST 23 RD STREET, NEW YORK, NY MNS.
 TM MANHATTAN NEW DEVELOPMENT REPORT 2012 FIRST QUARTER 1 TABLE OF CONTENTS Introduction 3 Market Snapshot 4 Neighborhood Price Trends Harlem 9 Upper West Side 10 Upper East Side 11 Midtown West 12 Midtown
YTD TOTAL VOLUME YTD SOLD PROPERTIES Q: WHAT IS YOUR HOME WORTH? A: CALL ME. SOLD DOM
 SOLD DOM 2012-13 2013-14 2014-15 306 387 324 Q: WHAT IS YOUR HOME WORTH? A: CALL ME. YTD SOLD PROPERTIES YTD TOTAL VOLUME CONDO & TOWN CONDO MEDIAN HOME SALES MEDIAN PRICE SALES PRICE 2013 2014 2015 2013
Manhattan Residential Market Report SECOND QUARTER
 2017 Manhattan Residential Market Report SECOND QUARTER Data Highlights Cover Property: BrownHarrisStevens.com WEB# 16612140 New records were set for average and median apartment prices, as high-end closings
Strong Q4 Condo Apartment Sales and Price Growth
 Condo Market Report Fourth Quarter 2013 Economic Indicators Real GDP Growth i Q3 2013 t 2.7% Toronto Employment Growth ii December 2013 t 1.7% Toronto Unemployment Rate December 2013 t 8.4% Inflation (Yr./Yr.
Chittenden, Addison, Franklin & Grand Isle Counties.
 Third Quarter 2017 market results & trends to watch in Chittenden, Addison, Franklin & Grand Isle Counties. VermontMarketReport.com South Burlington Vergennes Franklin vermontmarketreport.com Mountain
See Full Corridor Study Volumes I and II as separate attachments.
 See Full Corridor Study Volumes I and II as separate attachments. See Housing Values 2000-2010 and 2000-2013 as separate attachments. 2013 2 nd Quarter and Mid-Year Market Report The voice of real estate
December 2018 Absorption Report Manhattan Apartments
 ember 01 Absorption Report Manhattan Apartments ember 01 Highlights The Manhattan absorption rate dipped from last month, to a 7.3-month supply of available units At. months, condo absorption rates remained
Ottawa Residential Unit Sales
 Ottawa Residential Unit Sales The chart above compares the monthly residential MLS unit sales for the current year to those of the previous year. The light grey line shows the residential sales trend by
BONDREPORT QTR BONDREPORT QTR BONDNEWYORK.COM
 BONDREPORT QTR 4 2017 WELCOME TO THE 19 TH EDITION OF THE BOND REPORT It has been quite the year on many fronts, and by all indications, 2017 has no intention of going quietly. The market has continued
Morningside Heights Harlem. Peter Comitini Senior VP Associate Broker The Corcoran Group
 Sutton Area TriBeCa Upper East Side Upper West Side Washington Heights West Village The Corcoran Report Battery Park City Beekman Carnegie Hill Central Park South Chelsea Flatiron Clinton East Harlem East
Baldwin County Condo Report February 2019
 Baldwin County Condo Report February 2019 Total Condo Sales Current Month February 2019 93 vs. Prior Month January 2019 73 27.4% vs. Last Year February 2018 113-17.7% vs. 5-Yr Avg February 14-'18 120-22.2%
Baldwin County Condo Report January 2019
 Baldwin County Condo Report January 2019 Total Condo Sales Current Month January 2019 73 vs. Prior Month December 2018 97-24.7% vs. Last Year January 2018 101-27.7% vs. 5-Yr Avg January 14-'18 97-25.1%
Monthly Indicators. December Monthly Snapshot - 0.7% + 7.5% - 5.3%
 Monthly Indicators 2014 Monthly Snapshot + 7.5% - 5.3% - 0.7% It was another recovery year in 2014, although not quite to the level of 2013. With a broad pattern of rising prices and stable to improving
Transit Villages: Success & Sustainability
 Transit Villages: Success & Sustainability Martin E. Robins Director Emeritus Alan M. Voorhees Transportation Center NJ State League of Municipalities Convention November 17, 2010 New Jersey TOD Successes
January 2019 Absorption Report Manhattan Apartments
 January 019 Absorption Report Manhattan Apartments January 019 Highlights The absorption rate fell to.3 months in January, but remained % higher than a year ago. The absorption rate for condos rose 0%