Anna Maria Luxury Real Estate January 2019 Newsletter
|
|
|
- Claire Cameron
- 5 years ago
- Views:
Transcription
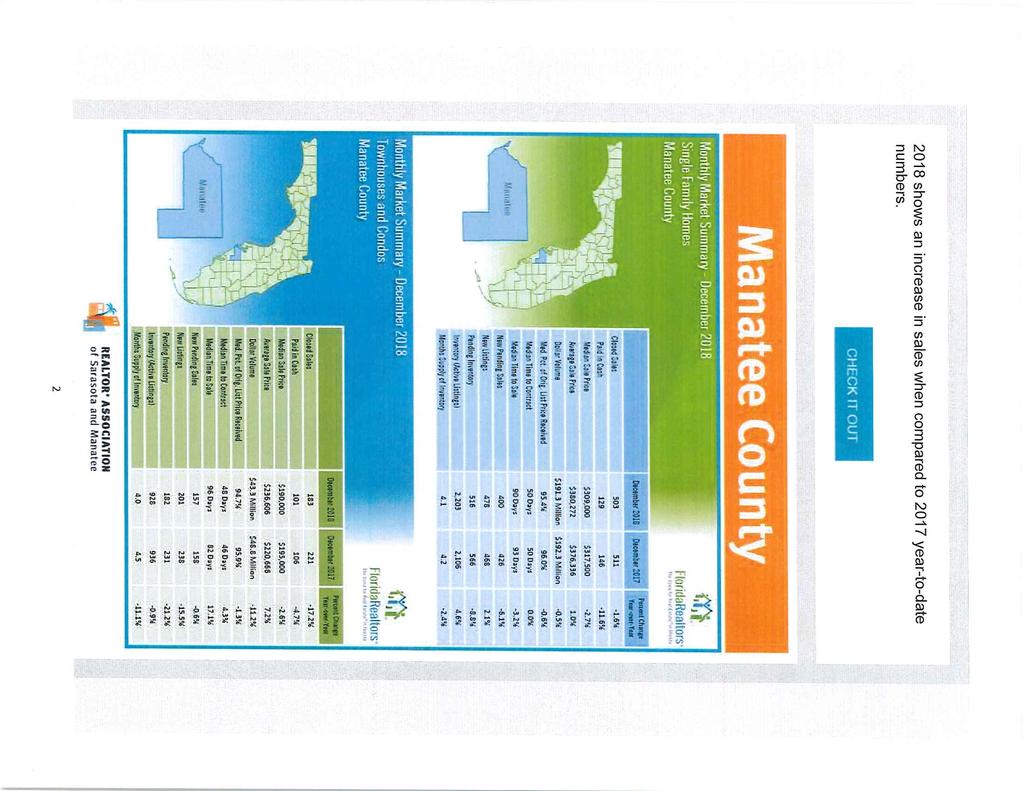
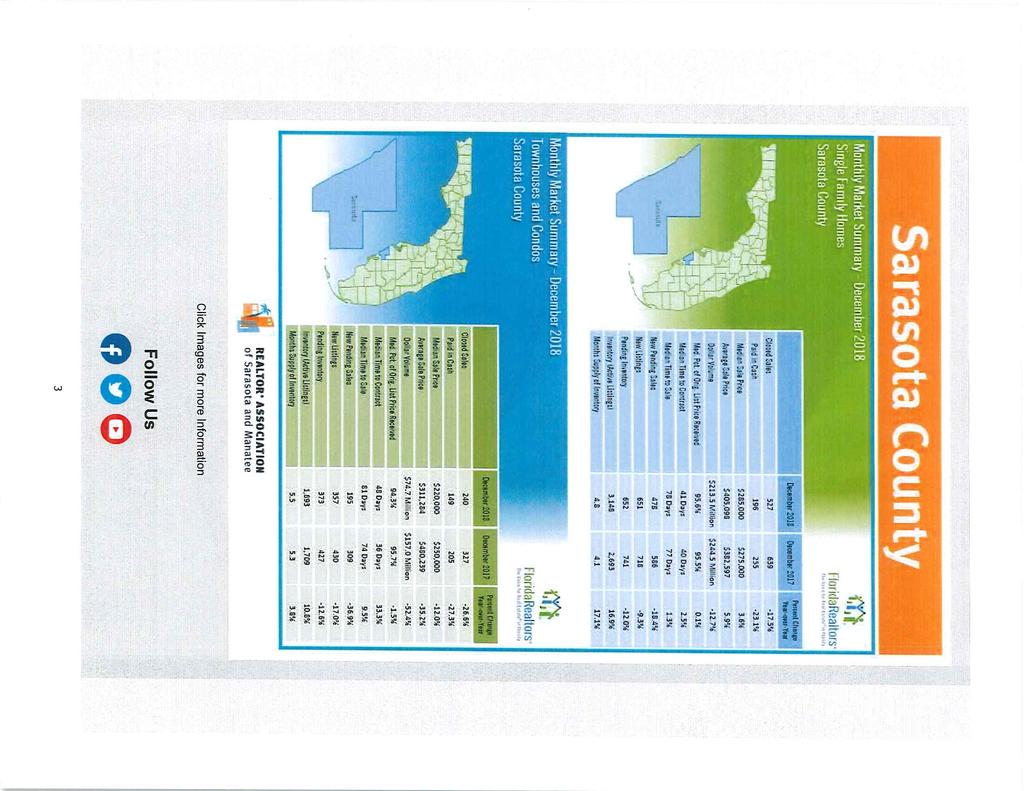
1 Anna Maria Luxury Real Estate January 219 Newsletter Real Estate Sales on Anna Maria Island for 218 were a little under 217. December 31, 218 Y-T- D AMI sales were 397(SF-234, Con-131, Dup-223, & Lot-9) down 1% from December 31, 217 Y-T-D at 43 (SF-225, Con-135, Dup-25 & Lot-18). Sales in December 218 for Anna Maria City, Holmes Beach and Bradenton Beach were 18 (SF-12, Con-6, Dup- & Lot-) down 3% below December 217 at 26 (SF-16, Con-7, Dup-2 & Lot-1). Of the 218 sales only.7% or 3 (SF-1, Con-1, Dup-1 & Lot-) were distressed properties (bank owned or short sales) compared to 1.5% or 6 (SF-4, Con-1, Dup-1 & Lot-) for 217. As you can see by the charts below the numbers since 21, which was where the market bottomed from the peak of 25, the annual sales continue to be strong in either the high 3 s or low 4 s. The inventory continues to be very low and remains below 3 this month again for the eighth month in a row and for seventeen of the last twenty months. The average inventory over most of the past 3 years has been 4-45 properties for sale at any one time. Inventory is currently at 291 (SF-179, Con-73, Dup-23 & Lot-16). Inventory for the previous thirteen months were 257, 249, 231, 214, 223, 24, 254, 267, 297, 297, 31, 29, 298 as you can see all below 3 every month but one. Low inventory with strong demand means it s more of a sellers market. There is something for everybody on Frank, Scott & Al s Great Buy s list this month. If you re looking for a starter property in a Gulf Front complex, then 568 Gulf Drive #12 is for you. The unit has new tile flooring and bright light décor and overlooks the tennis court and pool. If you re looking for a unique condo that is also a very good rental, then 67 Gulf Dr. #7 is the one for you. This 1,6 sq. ft. 3bedroom/2bath direct gulf front condo is the ultimate in beach living with panoramic views of the gulf. Walk right off your lanai onto the sand. Although it hasn t been rented by its current owner, Vacasa projected it would do $9K-$1K in gross annual rental. See these and more properties below. Call me for more information on these or other real estate opportunities. We can put you on your own automatic search for properties with your specific criteria Alan@AlanGalletto.com Scott@AlanGalletto.com
2 To summarize the Anna Maria Island real estate market for 218, we ended up down 1% compared to 217 which was one of the strongest sales years since 21 as you can see from the charts below. Pended properties (properties under contract) are at 3 (SF-19, Con-9, Dup-2 & Lot-) which is about average. Distressed properties continue to be non-existent with again this month no distressed properties for sale on the island and non in the last six months. The distribution of the single family properties currently for sale on AMI has dramatically skewed upward with only (5) 3% <$5K, (34) 19% 5K-75K, (44) 24% between $75K and $1 million and (97) 54% over $1 million. The distribution for Condos currently for sale has bumped up a little from last year and was (39) 51% <$5K, (21) 28% $5K-$75K, (7) 9% $75K - $1 million and (9) 12% >$1 million. You can see that 78% of the single family prices are over $75K while 51% of the condos were below $5K. The lower prices on condos is due to the fact that most of the condos on the island were built in the 7 s and 8 s and are 2 bedroom/2 bath. Of the current inventory of 179 single family homes the lowest priced is $395, and the highest is $5,75,. Of the current inventory of 73 condos the lowest priced is $219,9 and the highest $2,6,. Of the single-family properties sold in 218, the average sale was $1,47,533 and the median sale $835, and for condos the average sale was $454,941 and median sale $377,5. In 217 the average sale for single family homes was $1,6,886 and the median sale was $81, while the average condo sale was $434,963 and median sale was $352,. Over the last year on Anna Maria Island average and median single-family sales were up -2% and 3% respectively while average and median condo prices were up 1% & 7% respectively. Longboat Key current inventory is 455 (SF- 137, Con- 278, Dup- 4 & Lot- 36) up significantly from 386 last month and from the six previous months at 314, 276, 277, 37, 32 and 377. Of the current inventory of 137 single family homes the average sales price is $1,96,32 and the median sale price is $1,2,. The lowest priced single family home on Longboat Key is $299, and the highest is $22,5,. For the 278 condos for sale the average and median prices respectively are $773,889 & $544,5 with the lowest $169,9 and highest $6,1,. Keep those calls and s coming! We love hearing from you Alan, Scott, Frank & Lynn Alan@AlanGalletto.com Scott@AlanGalletto.com
3 DECEMBER 217 VS. DECEMBER 218 STATS ON ANNA MARIA ISLAND # Sld 12/217 #Sld 12/218 Pending Inventory HOMES CONDOS M/FAMILY LOTS 1 16 TOTAL Jan 1, Dec 31, 217 SALES ON ANNA MARIA ISLAND # Sold Lowest Highest Avg. Sale Price Median Sale Price HOMES 225 $192, $4,5, $1,6,886 $81, CONDOS 135 $ 165, $1,7, $434,963 $352, DUPLEXES 25 $238,35 $1,325, $74,514 $695, LOTS 18 $225, $1,899, $67,94 $475, TOTAL 43 Jan 1, 218 Dec 31, 218 SALES ON ANNA MARIA ISLAND # Sold Lowest Highest Avg. Sale Price Median Sale Price HOMES 234 $265, $5,, $1,47,533 $835, CONDOS 131 $22,5 $1,999, $ 454,941 $377,6 DUPLEXES 23 $49, $1,575, $ 7,478 $62, LOTS 9 $25, $1,45, $ 69,389 $515, TOTAL 397 SALES SF CON DUP LOTS TOT Alan@AlanGalletto.com Scott@AlanGalletto.com
4 UNITS CLOSED ON THE ISLAND FROM Single Fam Condo Multi Fam Lot Total Single Fam Condo Multi Fam Lot 1219 Jan ' Jan' Feb ' Feb' Mar ' Mar' April ' Apr' May ' May' June ' Jun' July ' Jul' Aug ' Aug' Sept ' Sep' Oct ' Oct' Nov ' Nov' Dec ' Dec' Jan ' Jan' Feb ' Feb' Mar ' Mar' April ' Apr' May ' May' June ' Jun' July ' Jul' Aug ' Aug' Sept ' Sep' Oct ' Oct' Nov ' Nov' Dec ' Dec' Jan ' Jan' Feb ' Feb' Mar' Mar' Apr' Apr' May' May' Jun' Jun' Jul' Jul' Aug' Aug' Sep' Sep' Oct' Oct' Nov' Nov' Dec' Dec' Jan' Jan' Feb' Feb' Mar' Mar' Apr' Apr' May' May' Jun' Jun' Jul' Jul' Aug' Aug' Sep' Sep' Oct' Oct' Nov' Nov' Dec' Dec' Source: Manatee MLS FIRST COLUMN TOTAL nd Column TOTAL 2535
5 UNITS CLOSED ON THE ISLAND FROM Single Fam Condo Multi Fam Lot Total Single Fam Condo Multi Fam Lot Total Jan' Jan' Feb' Feb' Mar' Mar' Apr' Apr' May' May' Jun' Jun' Jul' July' Aug' Aug' Sep' Sep' Oct' Oct' Nov' Nov' Dec' Dec' Jan' Jan' Feb' Feb' Mar' Mar' Apr' Apr' May' May' Jun' Jun' Jul' Jul' Aug' Aug' Sep' Sep' Oct' Oct' Nov' Nov' Dec' Dec' Jan' Feb' Mar' Apr' May' Jun' Jul' Aug' Sep' Oct' Nov' Dec' Jan' Feb' Mar' Apr' May' Jun' July' Aug' Sep' Oct' Nov' Dec' Source: Manatee MLS 482 4th Column TOTAL 4879


6 AVG $ Sold AVG $ Sold 5% 4% 3% 2% 1% % -1% -2% -3% -4% Average Sale Price Year over Year % Change Condos Residential Multi-Family Residential 7% App Line $1,2 $1, $8 $6 $4 $2 $- AVG Sales Price- Residential ($ 's) (7% appreciation line added) Condos Multi-Family $1, $8 $6 $4 $2 $- AVG Sales Price ($ 's) Condo & Multi- Family Anna Maria Island Inventory Breakdown Residential Condo Mulit-Family Land 1% 28% 1% 51%

7 Q1-5 Q2-5 Q3-5 Q4-5 Q1-6 Q2-6 Q3-6 Q4-6 Q1-7 Q2-7 Q3-7 Q4-7 Q1-8 Q2-8 Q3-8 Q4-8 Q1-9 Q2-9 Q3-9 Q4-9 Q1-1 Q2-1 Q3-1 Q4-1 Q1-11 Q2-11 Q3-11 Q4-11 Q1-12 Q2-12 Q3-12 Q4-12 Q1-13 Q2-13 Q3-13 Q4-13 Q1-14 Q2-14 Q3-14 Q4-14 Q1-15 Q2-15 Q3-15 Q4-15 Q1-16 Q2-16 Q3-16 Q4-16 Q1-17 Q2-17 Q3-17 Q4-17 Q1-18 Q2-18 Q3-18 Q4-18 Months of Inventory Inventory Inventory vs. Absorption Rate Inventory Months Inventory
8 FRANK, SCOTT & AL S GREAT BUYS Great Entry Level Island Property: Gulf Drive Condo Unit #12 ($489,9) Just reduced This elevated 2 bed/2 bath condo is 2 steps to the Gulf of Mexico in a direct gulf front complex with an elevator. The unit has new tile flooring and bright light décor. It overlooks the tennis court and pool. A must see to appreciate. Great Location & Potential Rental Income: Gulf Drive #4 Vista Grande ($2,6,) Simply the best Gulf Front Condo on Anna Maria Island one of only 4 units in this complex 3- bedroom 3 bath, 1848 sq. ft. Living space and 852 sq. ft. of balconies. Built with high density concrete and 16MPH rated windows & doors. This unit has not been rented but the unit next to it does about $2K of gross annual rental income. A great second home and/or rental Gulf Dr. Holmes Beach ($714,999) Gulf of Mexico beaches are just down the street from this rare duplex or home with in-law apartment however you want to use it. Sold turnkey furnished, this side by side 2 bedrooms/1 bath has a private pool. This property does about $5, in gross annual rental income Concord Ln. Holmes Beach ($1,5,) Boaters dream home in graceful Key Royale neighborhood with dock and boat lift PLUS 2 additional docks for fishing, sunning or launching kayaks or paddle boards. Over 21 feet of seawall to pull a boat up to! No bridges to Tampa Bay or the Gulf of Mexico. 2,533 sq. ft. well maintained home.come see this property. Condos: Gulf Dr. (Gulfplace) #7 Holmes Beach ($1,299,9) One of a kind Luxury Gulf Front Townhouse/Condo 3bed/2 bath, 1,6 sq. ft. Walk out of your unit onto your lanai, down 7 steps to the white beach. A great second home or investment property. This is a property you must see to appreciate. Click on the property address to bring up the information & virtual tour or Call me for more information on these or other great properties Alan (941) Alan@AlanGalletto.com Scott@AlanGalletto.com Island Real Estate, 611 Marina Drive, Holmes Beach, FL
9 Q1-25 Q3-25 Q1-26 Q3-26 Q1-27 Q3-27 Q1-28 Q3-28 Q1-29 Q3-29 Q1-21 Q3-21 Q1-211 Q3-211 Q1-212 Q3-212 Q1-213 Q3-213 Q1-214 Q3-214 Q1-215 Q3-215 Q1-216 Q3-216 Q1-217 Q3-217 Q1-218 Q3-218 Unit Sales # of Transactions 3 # of Transactions (218 Extrapolated) Condos Multi-Family Residential Land Sales by Qtr (Transactions) Unit Sales 5yr Historical Avg Sales by Year - Transactions (218 extrapolated)
10 Single Family Condo Duplex Land Single Family Condo Duplex Land Median Sold Anna Maria Island Average Sold Anna Maria Island
11 ISLAND HOMESTEADS Homesteads Anna Maria Bradenton Beach Holmes Beach AMI Total Statistics on Anna Maria Island & Longboat Key City Population Avg Age Units Owner Occ Rented Vacant AM HB BB LBK Source: 21 Federal Census.

12
13
14
15
Anna Maria Luxury Real Estate March 2018 Newsletter
 Anna Maria Luxury Real Estate March 218 Newsletter Two months into 218 looks to be another good start for the year. February 28, 21 Y.T.D. Anna Maria Island property sales were; 58(Single Family Homes
Anna Maria Luxury Real Estate June 2018 Newsletter
 Anna Maria Luxury Real Estate June 218 Newsletter Sales on Anna Maria Island two months into the second quarter of 218 show Y-T-D sales again up 9% at 198 (SF-12, Con-64, Dup-8 & Lot-6) compared to the
Anna Maria Luxury Real Estate August 2018 Newsletter
 Anna Maria Luxury Real Estate August 218 Newsletter Sales on Anna Maria Island one months into the third quarter of 218 show Y-T-D sales again up 5% at 277 (SF-164, Con-9, Dup-14 & Lot-9) compared to the
MLS of Greater Cincinnati - Charts for the Month: November 2017
 MLS of Greater Cincinnati - Charts for the Month: November 2017 The following charts provide an overview of what has occurred in the MLS over the past month. Each chart provides a historical trend. The
California Housing Market Update. Monthly Sales and Price Statistics September 2018
 California Housing Market Update Monthly Sales and Price Statistics September 2018 Sales Had the Largest Decline since March 2014 California, September 2018 Sales: 382,550 Units, -3.3% YTD, -12.4% YTY
California Housing Market Update. Monthly Sales and Price Statistics October 2018
 California Housing Market Update Monthly Sales and Price Statistics October 2018 Sales Had the 2 nd Largest Drop in the Last 6 Months California, October 2018 Sales: 397,060 Units, -3.7% YTD, -7.9% YTY
Greater Las Vegas Snapshot by Sale Type
 9.% Closed Sales Trend by Type December Closings by Type 8.% 7.% 6.% 8% Short Sales 1% 5.% 4.% 3.% Traditional Equity 82% 2.% 1.%.% Greater Las Vegas Snapshot by Sale Type - SFR Only Available List Price
California Housing Market Update. Monthly Sales and Price Statistics December 2018
 California Housing Market Update Monthly Sales and Price Statistics December 2018 Sales Reached the Lowest Level since Jan 2015 California, December 2018 Sales: 372,260 Units, -5.2% YTD, -11.6% YTY 700,000
California Housing Market Update. Monthly Sales and Price Statistics August 2018
 California Housing Market Update Monthly Sales and Price Statistics August 2018 Sales Declined for the 4 th Consecutive Month California, August 2018 Sales: 399,600 Units, -2.1% YTD, -6.6% YTY 700,000
Monthly Indicators % + 9.7% %
 Monthly Indicators 2016 Percent changes calculated using year-over-year comparisons. New Listings were up 11.1 percent for single family homes and down 30.8 percent for townhouse-condo properties. Pending
SFR Condo Residential Lot Sales Inventory Sales Inventory Sales Inventory. Month YTD Month Month YTD Month Month YTD Month
 Grand Strand Market Report 2017 capped off a great year for the Grand Strand as full year SFR sales volume and median sales price were up 9.8% and 4.3%, respectively. Condo sales activity increased 3.0%
California Housing Market Update. Monthly Sales and Price Statistics November 2018
 California Housing Market Update Monthly Sales and Price Statistics November 2018 Home Sales: Largest Decline Since 2014 California, November 2018 Sales: 381,400 Units, -4.6% YTD, -13.4% YTY 700,000 600,000
Monthly Indicators % % %
 Monthly Indicators 2016 Percent changes calculated using year-over-year comparisons. New Listings were down 27.6 percent for single family homes and 41.8 percent for townhouse-condo properties. Pending
Monthly Indicators + 4.8% - 3.5% %
 Monthly Indicators 2015 New Listings were up 45.0 percent for single family/duplex homes but decreased 44.1 percent for townhouse-condo properties. Pending Sales increased 14.3 percent for single family/duplex
California Housing Market Update. Monthly Sales and Price Statistics May 2018
 California Housing Market Update Monthly Sales and Price Statistics May 2018 Sales Lost Momentum as Mortgage Rates Continued to Climb California, May 2018 Sales: 409,270 Units, +0.3% YTD, -4.6% YTY 700,000
Monthly Indicators % % - 3.5%
 Monthly Indicators 2017 New Listings were up 6.3 percent for the category but decreased 33.1 percent for the category. Pending Sales increased 5.0 percent for but decreased 1.3 percent for. The Median
September 2018 MLS Statistical Report
 September 218 MLS Statistical Report Total Sales Blame it on Hurricane Florence but overall, sales dropped drastically in August - down 17%. Total Sales Sept'18 172-17% Sept'17 26-2% Sept'16 211 7% 3 2
Monthly Indicators % % - 9.2%
 Monthly Indicators 2016 New Listings were down 1.4 percent for single family/duplex homes and 25.0 percent for townhouse-condo properties. Pending Sales increased 58.3 percent for single family/duplex
Monthly Indicators + 7.3% + 6.6% + 8.3% Single-Family Market Overview Condo Market Overview New Listings Pending Sales.
 Monthly Indicators 2018 The three most prominent national market trends for residential real estate are the ongoing lack of abundant inventory, the steadily upward movement of home prices and year-over-year
FOR IMMEDIATE RELEASE Contact: David B. Bennett President & CEO Phone:
 FOR IMMEDIATE RELEASE Contact: David B. Bennett President & CEO Phone: 727-216-32 Email: dbennett@tampabayrealtor.com Real Estate Statistics for September 216 At this time of year everyone starts to get
FALLON CHURCHILL COUNTY, NEVADA RESIDENTIAL REAL ESTATE TRACKING REPORT
 FALLON CHURCHILL COUNTY, NEVADA RESIDENTIAL REAL ESTATE TRACKING REPORT 3rd QUARTER 15 BOB GETTO, C.R.S. & S.F.R. Nevada real estate broker, Lic # 16039 Council of Residential Specialists certified, National
Scott Market Report Stronger Sales Continue
 June 20 Scott Market Report Stronger Sales Continue The Outer Banks real estate market is seeing good signs in most market segments. After a somewhat slow start to 20, sales agreements picked up significantly
FALLON CHURCHILL COUNTY, NEVADA RESIDENTIAL REAL ESTATE TRACKING REPORT
 FALLON CHURCHILL COUNTY, NEVADA RESIDENTIAL REAL ESTATE TRACKING REPORT 1st QUARTER 2016 BOB GETTO, C.R.S. & S.F.R. Nevada real estate broker, Lic # 16039 Council of Residential Specialists certified,
FOR IMMEDIATE RELEASE Contact: David B. Bennett President & CEO Phone:
 FOR IMMEDIATE RELEASE Contact: David B. Bennett President & CEO Phone: 727-216-32 Email: dbennett@tampabayrealtor.com Real Estate Statistics for September 217 September s numbers are out, and it comes
May 2008 MLS Month in Review
 May 28 MLS Month in Review The Albuquerque Market continues to improve, and it s evident that finally, the negative media is turning into positive media. This month s TOP Selling Price Range is $2K to
SE Michigan Residential Real Estate Recovery Are we there yet or is it over?
 SE Michigan Residential Real Estate Recovery Are we there yet or is it over? Changing View of Residential Transactions Changing View of Residential Transactions 2015 Short Sales 3% Leases Bank 11% Owned
FOR IMMEDIATE RELEASE Contact: David B. Bennett President & CEO Phone:
 FOR IMMEDIATE RELEASE Contact: David B. Bennett President & CEO Phone: 727-216-32 Email: dbennett@tampabayrealtor.com Real Estate Statistics for December 217 wrapped up a sizzling 217 with a steady month
AAug ugust 2017
 August 17 17 Housing recovery a balancing act Growth in new listings outpaced sales preventing inventory declines City of Calgary, September 1, 17 Sales posted a modest gain in August, but a rise in new
Monthly Market Watch for the Prescott Quad City Area. Provided by Keller Williams Check Realty Statistics from August 2012 Prescott MLS
 August 2012 Monthly Market Watch for the Prescott Quad City Area Provided by Keller Williams Check Realty Statistics from August 2012 Prescott MLS Report Overview: This report includes MLS data for the
BONDREPORT QTR BONDREPORT QTR BONDNEWYORK.COM
 BONDREPORT QTR 4 2017 WELCOME TO THE 19 TH EDITION OF THE BOND REPORT It has been quite the year on many fronts, and by all indications, 2017 has no intention of going quietly. The market has continued
Demand down with net migration
 July 1 Demand down with net migration City of Calgary, August, 1 In step with City census data on declining net migration levels, housing sales activity totaled 1,71 units in July, a 1. per cent decrease
July 2012 was $162,256. ($153,956). was $314,607. was $172,488. ($164,426). Kansas City Region Average Sales Price - Existing Homes
. was $314,607. was $172,488. ($164,426). Kansas City Region Average Sales Price - Existing Homes") July 212 Kansas City Regional Real Estate Market Report Average Sales Price The average exis ng home sale price in July 212 was $162,256. 25 Kansas City Region Average Sales Price - Existing Homes July
July 212 Kansas City Regional Real Estate Market Report Average Sales Price The average exis ng home sale price in July 212 was $162,256. 25 Kansas City Region Average Sales Price - Existing Homes July
LUXURY MARKET REPORT. - January
 LUXURY MARKET REPORT - January 2018 - www.luxuryhomemarketing.com THIS IS YOUR LUXURY MARKET REPORT MAP OF LUXURY RESIDENTIAL MARKETS Welcome to the Luxury Market Report, your guide to luxury real estate
Victoria Real Estate Market Statistics for August Sept 1, 2017
 Victoria Real Estate Market Statistics for August 27 Sept, 27 A total of 736 properties sold in the Victoria Real Estate Board region this August, 6.6 per cent fewer than the 883 properties sold in August
M onthly arket. July Table of Contents. Monthly Highlights
 Table of Contents Market Inventory...2 www.gaar.com Monthly Highlights The median sale price of single-family, detached homes climbed to $190,000 in July 2014, the highest level since August 2008. Market
Provided by Keller Williams Realty Professional Partners Statistics from September 2010 MLS
 Monthly Market Watch for Maricopa County An overview of what is happening in the Maricopa County real estate market (using September 2010 statistics) Report overview: This report includes MLS data for
Annual Report on the Coastal Carolinas Housing Market RESIDENTIAL REAL ESTATE ACTIVITY IN THE COASTAL CAROLINAS
 Annual Report on the Coastal Carolinas Housing Market RESIDENTIAL REAL ESTATE ACTIVITY IN THE COASTAL CAROLINAS RESIDENTIAL REAL ESTATE ACTIVITY IN THE COASTAL CAROLINAS There is an ongoing and undeniable
Monthly Indicators % % %
 Monthly Indicators 2018 Percent changes calculated using year-over-year comparisons. New Listings were down 12.9 percent for single family homes and 21.3 percent for townhouse-condo properties. Pending
Annual Report on the Charleston Area Housing Market FOR RESIDENTIAL REAL ESTATE ACTIVITY FROM THE CHARLESTON TRIDENT ASSOCIATION OF REALTORS MLS
 Annual Report on the Charleston Area Housing Market FOR RESIDENTIAL REAL ESTATE ACTIVITY FROM THE CHARLESTON TRIDENT ASSOCIATION OF REALTORS MLS FOR RESIDENTIAL REAL ESTATE ACTIVITY FROM THE CHARLESTON
Santa Clara County Real Estate Market Overview Dynamics
 Santa Clara County Real Estate Market Overview Dynamics Data from sources deemed reliable, but may contain errors and subject to revision. All numbers should be considered approximate. Jan-90 Sep-90 May-91
LUXURY MARKET REPORT. - March
 LUXURY MARKET REPORT - March 2018 - www.luxuryhomemarketing.com THIS IS YOUR LUXURY MARKET REPORT MAP OF LUXURY RESIDENTIAL MARKETS Welcome to the Luxury Market Report, your guide to luxury real estate
S Sep eptember 2016
 September Detached prices stabilize in soft market, October, The segment of Calgary s housing market with the greatest influence on the overall market is showing signs of pricing stability. The detached
August 1, Victoria Housing Market Still Finding Its Balance
 August, 28 PRESIDENT Kyle Kerr PRESIDENT ELECT Cheryl Woolley SECRETARY TREASURER David Langlois PAST PRESIDENT Ara Balabanian DIRECTORS Jackie Adkins Sandi-Jo Ayers Bill Ethier Karen Dinnie-Smyth Andrew
September 4, Victoria s Real Estate Market Simmers at the End of Summer
 PRESIDENT Kyle Kerr PRESIDENT ELECT Cheryl Woolley SECRETARY TREASURER David Langlois PAST PRESIDENT Ara Balabanian DIRECTORS Jackie Adkins Sandi-Jo Ayers Bill Ethier Karen Dinnie-Smyth Andrew Plank EXECUTIVE
Monthly Market Watch for Maricopa County An overview of what is happening in the Maricopa County real estate market
 Monthly Market Watch for Maricopa County An overview of what is happening in the Maricopa County real estate market Provided by Susan Kraemer of Prudential Arizona Properties Report overview: This report
Information sheet A Data
 House prices: Statistics activity House prices change over time, but do so at different rates in different places. In this activity you will use statistical diagrams and measures to compare house prices
Tri-Cities Insider September 2015
 Tri-Cities Insider Your Current Real Estate Market 1 Go to: http://grouponetricities.com click on this logo to view market info each month. 2 3 Yearly Comparisons- Real Trends July/June 2015 Housing Market
Pikes Peak area housing Market Statistics (As of: 9/30/2018)
") $156,25 $184, $174,697 $177,2 $21,53 $185,83 $173, $178,29 $172,25 $212,75 $21,95 $226,692 $197,5 $199, $196, $28, $25, $223,95 $216,75 $29,527 $234,9 $218,82 $229,74 $235,518 $231,457 $255, $259,11 $269,98
$156,25 $184, $174,697 $177,2 $21,53 $185,83 $173, $178,29 $172,25 $212,75 $21,95 $226,692 $197,5 $199, $196, $28, $25, $223,95 $216,75 $29,527 $234,9 $218,82 $229,74 $235,518 $231,457 $255, $259,11 $269,98
South Bay Market Intelligence Report Vol. 4 October 2018
 South Bay Market Intelligence Report Vol. 4 October Designed to give you the facts & trends overview of the most relevant market activities as they unfold in the South Bay real estate community This Sales
2017 RESIDENTIAL REAL ESTATE MARKET REPORT
 2017 RESIDENTIAL REAL ESTATE MARKET REPORT Published January 26, 2018 Our market reports have been focused on the effects of low inventory on our housing market and for good reason. December 2017 marked
Victoria Real Estate Market Continues to Sizzle in Summer Months. August , Victoria, BC
 Victoria Real Estate Market Continues to Sizzle in Summer Months August 16, Victoria, BC A total of 97 properties sold in the Victoria Real Estate Board region this July, an increase of per cent compared
Residential Market Update
 Residential Market Update 2016 Quarter 4 Information Proudly Provided by your Business Development Managers: Nancy Pierson Biltmore / nancyp@eta-az.com / 602-769-1438 Maggie Clark Scottsdale / maggiec@eta-az.com
LUXURY MARKET REPORT. - May
 LUXURY MARKET REPORT - May 2018 - www.luxuryhomeing.com THIS IS YOUR LUXURY MARKET REPORT MAP OF LUXURY RESIDENTIAL MARKETS Welcome to the Luxury Report, your guide to luxury real estate market data and
October 1, Victoria Real Estate Market Continues to Stabilize
 PRESIDENT Kyle Kerr PRESIDENT ELECT Cheryl Woolley SECRETARY TREASURER David Langlois PAST PRESIDENT Ara Balabanian DIRECTORS Jackie Adkins Sandi-Jo Ayers Bill Ethier Karen Dinnie-Smyth Andrew Plank EXECUTIVE
Jackson County Residental Market Trends. February Pending Sales New Listings
 Jackson County Residental Market Trends February 2017 Pending Sales..2 New Listings..3 Overall activity trends are not a measure of pricing or value for individual properties. Small Sampling sizes can
 Palos Verdes Peninsula Market Intelligence Report Vol. 4 October Designed to give you the facts & trends overview of the most relevant market activities as they unfold in the South Bay real estate community
MONTHLY STATISTICS PACKAGE. City of Calgary. May creb.com
 MONTHLY STATISTICS PACKAGE City of Calgary May 1 creb.com Housing supply swells in cool spring market MONTHLY STATISTICS PACKAGE City of Calgary May 1 City of Calgary, June 1, 1 Calgary s housing inventory
MONTHS OF SUPPLY AND PRICE CHANGES. Home improvement November marks a rise in sales. MONTHLY STATISTICS PACKAGE City of Calgary. Nov.
 November 17 17 Home improvement November marks a rise in sales. City of Calgary, December 1, 17 The November housing market was spurred by a rise in sales, particularly in the lower price ranges. Sales
MARKET IN A MINUTE A SUMMARY OF MARKET CONDITIONS FOR SEPTEMBER & 3rd QUARTER 2017
 STATPAK LOUDOUN COUNTY OCTOBER 2017 McEnearney.com MARKET IN A MINUTE A SUMMARY OF MARKET CONDITIONS FOR SEPTEMBER & 3rd QUARTER 2017 Contract activity in September 2017 was up just 0.6% from September
Luxury 4 Bedroom Condo in River Run - 2 Minute Walk From the Gondola!
 Luxury 4 Bedroom Condo in River Run - 2 Minute Walk From the Gondola! Summary 4 BR 4 Bath Condo - sleeps up to 10 Description 202 Mill Creek (72 River Run Road) - a SkyRun Keystone Property -- Sleeps up
2019 Housing Market Forecast. Palos Verdes Peninsula AOR January 8, 2019 Jordan G. Levine Senior Economist
 2019 Housing Market Forecast Palos Verdes Peninsula AOR January 8, 2019 Jordan G. Levine Senior Economist Overview Good News: Economic fundamentals solid Homeownership still the dream Rates might not go
Josephine County Residental Market Trends. January Pending Sales New Listings
 Josephine County Residental Market Trends January 217 Pending Sales..2 New Listings..3 Overall activity trends are not a measure of pricing or value for individual properties. Small Sampling sizes can
Housing market feels the chill as oversupply continues Feb. 2019
 February 19 19 MONTHLY STATISTICS PACKAGE Housing market feels the chill as oversupply continues 19, March 1, 19 The effects of Calgary s economic climate continue to create weak sales activity and elevated
Dec December 2018
 December MONTHLY STATISTICS PACKAGE Job market weakness and lending restrictions a common thread in s housing market, January, 19 As oversupply continues in Calgary s housing market, December prices eased
Pikes Peak area housing Market Statistics (As of: 2/28/2018)
") Jan-1-1 -1-1 Jan-2-2 -2-2 Jan-3-3 -3-3 -4-4 -4-5 -5-5 -6-6 -6-7 -7-7 -8-8 -8-9 -9-9 -1-1 -1-11 -11-11 -12-12 -12-13 -13-13 -14-14 -14-15 -15-15 -16-16 -16-17 -17-17 Jan-1-1 -1-1 Jan-2-2 -2-2 Jan-3-3 -3-3
Jan-1-1 -1-1 Jan-2-2 -2-2 Jan-3-3 -3-3 -4-4 -4-5 -5-5 -6-6 -6-7 -7-7 -8-8 -8-9 -9-9 -1-1 -1-11 -11-11 -12-12 -12-13 -13-13 -14-14 -14-15 -15-15 -16-16 -16-17 -17-17 Jan-1-1 -1-1 Jan-2-2 -2-2 Jan-3-3 -3-3
California Housing Market Update. Monthly Sales and Price Statistics January 2018
 California Housing Market Update Monthly Sales and Price Statistics January 2018 Sales Started with a Slight Decrease California, Jan. 2018 Sales: 388,800 Units, -2.9% YTD, -2.9% YTY 700,000 600,000 500,000
November 1, The Victoria real estate market s return to balance not linear, but also not unexpected
 PRESIDENT Kyle Kerr PRESIDENT ELECT Cheryl Woolley SECRETARY TREASURER David Langlois PAST PRESIDENT Ara Balabanian DIRECTORS Jackie Adkins Sandi-Jo Ayers Bill Ethier Karen Dinnie-Smyth Andrew Plank EXECUTIVE
Victoria Real Estate Market responds as expected to the changing market conditions of 2018
 PRESIDENT Cheryl Woolley PRESIDENT ELECT & TREASURER Sandi-Jo Ayers PAST PRESIDENT Kyle Kerr DIRECTORS Jackie Adkins Sheila Aujla Karen Dinnie-Smyth David Langlois Andrew Plank Graden Sol EXECUTIVE OFFICER
657 S Belvoir South Euclid, OH Mark Khuri
 657 S Belvoir South Euclid, OH 44121 Overview Property Type: Multi-Family Size: 6,612 sq ft Sale Price: $499,000 # of Units: 8 Year Built: 1972 # of Stories: 2 Construction: Brick Parking Type: Covered
Jackson County Residental Market Trends. November Pending Sales New Listings
 Jackson County Residental Market Trends November 2017 Pending Sales..2 New Listings..3 Overall activity trends are not a measure of pricing or value for individual properties. Small Sampling sizes can
LUXURY MARKET REPORT. - February
 LUXURY MARKET REPORT - February 2018 - www.luxuryhomeing.com THIS IS YOUR LUXURY MARKET REPORT MAP OF LUXURY RESIDENTIAL MARKETS Welcome to the Luxury Report, your guide to luxury real estate market data
Atlanta Housing Economic Trends
 Atlanta Housing Economic Trends October 2011 Note: This information is deemed accurate but not guaranteed. It is intended for the personal use of HBA members only. Market Update With Smart Numbers Steve
A A p p r ril 2017
 April 17 17 Housing market retains momentum in April Citywide prices hold steady as labour market improves City of Calgary, May 1, 17 Calgary s housing market continued to show signs of stability in April.
Aug. Aug 2018 ust 2018
 August 18 MONTHLY STATISTICS PACKAGE City of Calgary Unemployment rate slows housing market recovery 18 City of Calgary, September, 18 Easing sales, gains in new listings and elevated inventory levels
Bella Luna Gorgeous 3 Bedroom 3 Bath Condo - New Owners!!
 Bella Luna 202 - Gorgeous 3 Bedroom 3 Bath Condo - New Owners!! Summary 3 Bedroom 3 Bath Luxury Condo Description The Bella Luna is one of the finest places to stay in Orange Beach! This complex is not
LUXURY MARKET REPORT. - March
 LUXURY MARKET REPORT - March 2018 - www.luxuryhomeing.com THIS IS YOUR LUXURY MARKET REPORT MAP OF LUXURY RESIDENTIAL MARKETS Welcome to the Luxury Report, your guide to luxury real estate market data
While a project is typically acquired on a specific date
 A Presentation of the National Association of Home Builders While a project is typically acquired on a specific date Building rehab (if there are multiple buildings) is typically completed building by
Large 3 bedroom condo in West Keystone
 Large 3 bedroom condo in West Keystone Summary 3 BR 2 Bath Condo - sleeps up to 8 Description 1638 Quicksilver - a SkyRun Keystone Property Welcome to 1638 Quicksilver! Our newest 3 bedroom in Quicksilver;
June 2008 MLS Month in Review
 June 28 MLS Month in Review The Greater Albuquerque Real Estate Market continues to be strong. REALTORS put 1,769 homes under contract in the month of June. For our Market Area, sales are up 9.5% for Detached
Patience required in Calgary's housing market recovery Jul. 2018
 July 18 MONTHLY STATISTICS PACKAGE City of Calgary Patience required in Calgary's housing market recovery 18 City of Calgary, August 1, 18 Recent struggles in the job market, accompanied by yet another
2017 IN REVIEW THE BLUE MTS. REAL ESTATE MARKET REPORT LOCATIONS ROYAL LEPAGE S 2016 BROKERAGE OF THE YEAR FOR ONTARIO.
 THE BLUE MTS. REAL ESTATE MARKET REPORT IN REVIEW WE RE PROUD AND GRATEFUL TO HAVE BEEN CHOSEN AS ROYAL LEPAGE S BROKERAGE OF THE YEAR FOR ONTARIO OVERVIEW RECORD VOLUME SALES, HIGHER PRICES, SHORTER SALE
Weak sales persist in Calgary and beyond Jun. 2018
 June 218 MONTHLY STATISTICS PACKAGE City of Calgary Weak sales persist in Calgary and beyond 218 City of Calgary, July 3, 218 Many Canadian energyrelated municipalities within Alberta and Saskatchewan
45 Court Street New Haven, CT 06511
 PROFESSIONAL OFFICE BUILDING SALE - LEASE BACK AVAILABLE 45 Court Street New Haven, CT 06511 14,194 SF Office Building Presently owner occupied w/ 2 tenants willing To sign long-term leases Also willing
New year kicks off with slow sales Jan. 2019
 January 19 19 MONTHLY STATISTICS PACKAGE New year kicks off with slow sales 19, February 1, 19 As economic challenges linger into 19, housing markets remain on a sluggish pace. January sales totalled 8
FOR SALE. Treasure Island Waterfront Quadruplex th Avenue, Treasure Island, FL 33706
 Barkett Realty 615 9th Street N St. Petersburg, FL 33701 barkettrealty.com Executive Summary PROPERTY OVERVIEW Barkett Realty is pleased to present a waterfront quadruplex apartment building in the desirable
BONDREPORT QTR BONDNEWYORK.COM
 BONDREPORT QTR 4 2018 BONDREPORT QTR 4 2018 WELCOME TO THE 23RD EDITION OF THE BOND REPORT Looking back on 2018, the year can perhaps best be described as a consistent movement towards corrections. After
November 2012 October 2012 November 2011 Manhattan Condo Index 1,974 1, % 1, %
 Market Report StreetEasy is pleased to present our 2012 Q4 Quarterly Report on the residential market. The bulk of the report is based on approximately 3,600 estimated recorded sales for this quarter as
Pinellas Beaches & Commercial
 Waterfront Equity & Investment Property Wizard Pinellas Beaches & Commercial Vol. 1-16 YOUR FINEST REAL ESTATE EXPERIENCE...GUARANTEED! Donna Reichenbach, GRI, CIPS, TRC Waterfront Property Specialist
Outlook for Median Home Selling Prices. United States data are useless for us.
 Outlook for Median Home Selling Prices Outline United States Data Unobserved Prices The Future of California s Median Home Price Bill Watkins August 28, 28 2.% Existing Single-family Housing Sales percent
January 2018 Austin Real Estate Market Report
 January 2018 Austin Real Estate Market Report A comprehensive report on the Austin and Central Texas real estate market. Volume 1, Issue XIII Year to Date Sales January 2018 3 1 Year to data sales in Austin
NORTHERN VIRGINIA MARCH 2017
 STATPAK NORTHERN VIRGINIA MARCH 2017 McEnearney.com MARKET IN A MINUTE A SUMMARY OF MARKET CONDITIONS FOR FEBRUARY 2017 Contract activity in February 2017 was up 4.0% from February 2016, and there were
Economic Spotlight September 1, 2009
 Economic Spotlight September 1, 29 Update on Alberta s Housing Market Summary Alberta s housing market is beginning to show signs of recovery. Housing starts have rebounded from March lows and activity
May 2013 April 2013 May 2012 Manhattan Condo Index 2,106 2, % 1, %
 Market Report NOTICE: StreetEasy is pleased to present our 2013 Q2 Quarterly Report on the residential market. This preview version of the report is based on over 1,000 broker sources and will provide
Bureau of Business Research Webinar Series October 2016
 Bureau of Business Research Webinar Series October 2016 Presented by Eric Thompson W.W. Marshall Associate Professor of Economics Director, Bureau of Business Research Outline Importance of Affordable
STATPAK MARKET IN A MINUTE A SUMMARY OF MARKET CONDITIONS FOR JULY McEnearney.com CONTRACTS URGENCY INDEX INVENTORY INTEREST RATES AFFORDABILITY
 STATPAK LOUDOUN COUNTY AUGUST 2017 McEnearney.com MARKET IN A MINUTE A SUMMARY OF MARKET CONDITIONS FOR JULY 2017 Contract activity in July 2017 was down 8.7% from July 2016, and there were decreases in
STATPAK MARKET IN A MINUTE A SUMMARY OF MARKET CONDITIONS FOR FEBRUARY McEnearney.com CONTRACTS URGENCY INDEX INVENTORY INTEREST RATES
 STATPAK LOUDOUN COUNTY MARCH 2018 McEnearney.com MARKET IN A MINUTE A SUMMARY OF MARKET CONDITIONS FOR FEBRUARY 2018 Contract activity in February 2018 was almost unchanged, up just 0.2% from February
O O ct ct ober 2017
 October Status Quo for Calgary's Housing Market Prices remain similar to last year, but ease in October., November 1, 17 October s housing market conditions closely echoed previous month s trends with
Huge 2 Bedroom Condo with Private Hot Tub - Quick Walk to the Slopes!
 Huge 2 Bedroom Condo with Private Hot Tub - Quick Walk to the Slopes! Summary 2 BR 2 Bath Condo - sleeps up to 9 Description 221 Cinnamon Ridge I - a SkyRun Keystone Property -- Walking distance to Mountain
Sep September 2018
 18 September 18 MONTHLY STATISTICS PACKAGE City of Calgary Persistent buyers market continues 18 City of Calgary, October 1, 18 With no change in the economic climate, Calgary s sales activity totaled
England Occupancy Survey May 2017 SUMMARY OF RESULTS
 England Occupancy Survey 2017 SUMMARY OF RESULTS Room occupancy in 2017 increased +1% to 73%. Bedspace occupancy also increased +1% to 54%. Weekday room occupancy remained stable at 72% whilst weekend