Auckland Housing Accord FinalReport for Second Accord Year
|
|
|
- Aldous Barber
- 5 years ago
- Views:
Transcription

1 Auckland Housing Accord FinalReport for Second Accord Year October 2014 to September 2015 Based on: City-wide building consent data to month ended 30 September 2015 City-wide new sections data to month ended 30 September 2015 Housing Project Office consenting activity to 30 September
2 Contents Page Executive Summary city-wide 3 Special Housing Areas case studies 6 Executive Summary SHAs 9 Meeting Accord Targets 11 Dwellings 13 Sections 24 Special Housing Areas details 27 HPO Masterplanning and consenting 37 Land Supply 39 2
3 Executive summary City wide Excellent progress in Accord Year 2. The net number of new sections created and dwellings issued with building consents in Year 2 was 12,709, which is 97.8 per cent of the 13,000 target Exceeded the 2-Year combined target of 22,000 by 1,806(8.2%) City-wide results Year 2 Accord (October 2014 September 2015) show: 8,721 the number of new dwellings issued with building consents to September 2015 is the best in any 12-month period since 2005, a decade ago An 18% increase on the same period of the previous year (up by 1,318 from 7,403 in Accord Year 1) 3,755 dwellings in multi-unit buildings issued with building consents in the 12 months to September 2015, up by over 913 from 2,842 in the same period in the previous year More choice with multi-unit dwellings accounting for 43% of new dwellings issued with building consents in the 12 months to September In July 2015, there were 1,116 new dwellings issued with building consent. This is the first time monthly consents have exceeded 1,000 dwellings since March The land supply position continues to significantly improve owing to SHAs The supply of ready to go greenfield land is 6.15 years (1 year over the Auckland Plan minimum target of 5 years). SHAs are delivering a significant land supply pipeline with 4.19 years of Future Urban Zone land in SHAs over 2 Accord years. 3
4 Overview The net number of new sections created and dwellings issued with building consentsin Accord Year 1 (11,097) exceeded the target of 9,000. In the Accord Year 2 the net number of new sections created and dwellings issued with building consents(12,709) was 97.8% of the Year 2 target of 13,000. Net number of new dwellings with building consents and sections created Auckland; Oct 2014 September 2015; adjusted for dwelling /section combinations Accord targets (dwellings consented & sections created) Net number of new dwellings consented and sections created in monitoring period 17,000 11,097 13,000 12,709 9,000 Oct Sept 2014 Oct Sept 2015 Oct Sept 2016 Accord Year 1 Accord Year 2 Accord Year 3 4

5 Net total Dwellings and Sections in Accord Year 2 The number of new dwellings issued with building consents (8,721) and the number of new sections created (5,637) in the Accord Year 2 must each be adjusted for the 1,649 occasions on which they overlap. After adjustment there were net 12,709 dwellings issued with building consents and sections created in the Accord Year 2, 291 below target. Net number of new dwellings with building consents and sections created* Auckland; Oct 2014 September 2015; adjusted for dwelling/section combinations; Statistics NZ (dwellings); Land Information NZ (sections) Overlap * As illustrated in the graph above, the net total adjusts for any overlap between new sections created and the dwellings that are consented on those sections (i.e. it avoids double-counting). Where a newly created section has a dwelling consented on it, the section and dwelling are counted as one. If more than one dwelling is consented on the section, then the additional dwellings are also counted. 5
6 Special Housing Areas: Accelerating development (See case studies following) Special housing areas are successfully accelerating development of greenfield and brownfield sites with zoning and consenting 3 to 6 times faster than under RMA; 1226 dwellings with building consents issued over 2 years Under HASHAA, from the time of a request for an SHA, being received, all end-to-end planning processes are being completed and resource consents granted in as little as: 13 months for greenfield sites (including plan variations); and 11 months for brownfield sites which are able to use Unitary Plan zonings under the Accord to enable more intensive residential development without plan change Under the Resource Management Act 1991: the urban zoning and consenting of rural greenfield land can take between 3 to 6 times longer to complete before development starts than under HASHAA*. the rezoning of brownfield sites to enable more intensive development can take between 2 and 6 years** *Plan Change 24 Franklin -PokenoStructure Plan and Rezoning notified December 2008 Operative date, June 2011 *Plan Change 127 Huapai North Special Zone notified March 2010 Operative date, February 2013 **Plan Change 34 - Milford Residential Overlay notified October 2008 Operative date, December 2014 **Kensington Park Private Plan Change notified August 2010 Operative Date, September 2012 This excludes resource consenting which will add further delays 6
 RMA HASHAA RMA 3 6 times longer than HASHAA RMA PLAN CHANGE PROCESSES 2-4 YEARS CONSENTS HASAA 13 MONTHS Council 13-months Developer/builder")
7 Case study on accelerated greenfielddevelopment WhenuapaiVillage SHA Developer Oyster Capital Limited. Home building - Fletcher Residential (Stage 1, 78 lots) RMA HASHAA RMA 3 6 times longer than HASHAA RMA PLAN CHANGE PROCESSES 2-4 YEARS CONSENTS HASAA 13 MONTHS Council 13-months Developer/builder 17+ months WhenuapaiVillage SHA requested 9 January 2014 SHA Gazetted 3 July 2014 Plan Variation and qualifying development resource consent lodged 17/18 August 2014 Plan variation and qualifying development approved 19/24 February 2015 Development commenced February 2015 earthworks, civils, planting, sections formed by December 2015 Sections available December 2015 Likely building consents applied for/issued Feb2016 Stage 1 homes built from Feb 2016 (5+ months) First homes to be completed July 2016-July 2017 SHA establishment 6-months Rezoning and consenting 7- months Land development 10-months (sections available) Building Consents applied for/issued 2 months Homes built 5+ months 17+ mths 7

8 RMA 3 6 times longer than HASHAA Case study on accelerated brownfielddevelopment Khyber Pass Road SHA Apartment for 57 units RMA HASHAA RMA PLAN CHANGE PROCESSES 2-4 YEARS CONSENTS HASAA 11 MONTHS Council 11-months Developer 21 months Khyber Pass Road SHA requested 15 August 2013 SHA Gazetted 12 December 2013 Pre-application lodged 7 January 2014 Qualifying development resource consent lodged 23 May 2014 Qualifying development resource consent granted on 6 August Construction underway Building Consent (foundation works) lodged 25 Nov 2014 Building consent issued 15 Apr 2015 Foundation construction underway Building Consent (above ground) lodged 5 Sep 2015 Completion estimated by developer mid months SHA establishment / PAUP Zoning 4-months Qualifying Development consenting 7-months Foundation, Basement to ground floor stage approx 8 months Construction of apartment (above ground) 21 mths 8
9 Executive summary - Special Housing Areas The number of dwellings issued with building consents has acceleratedin special housing areas including Hobsonville, Flat Bush, Northern Tamaki, Weymouth and Hingaia during Accord Year 2. As well, a significant pipeline of sections and dwellings have been consented in the Housing Project Office (HPO). At the end of the Accord Year 2: 228 pre-applications for qualifying development resource consents had been lodged or processed by the HPO for 29,284 dwellings/ sections The HPO was progressing 9 plan variations for 7,800 dwellings/ sections at Flat Bush, Hingaia(3 variations), Huapai Triangle, Oraha Road, Oruarangi Road, Scott Point and Whenuapai Village (second variation) 2 SHA plan variations had been approved for 5,150 dwellings/sections at WhenuapaiVillage and Wesley College 116 qualifying development resource consents were under assessment by the HPO for 2,221 dwellings/ sections 172 qualifying development resource consents had been approved by the HPO for 2,374 dwellings/ sections. Within two years of the start of the Accord, homes are being delivered in SHAs like Weymouth and Northern Tamaki and sections delivered in special housing areas like Whenuapai Village, processes that would normally have taken 4 or more years. 9

 All known forecast supply other than SHAs Forecast dwelling supply from SHAs * Known developments understate dwelling supply, as these figures")
10 Cumulative long term dwelling supply forecast: increasing impact of SHAs Over the next 11 years, over 85,000 new greenfield and brownfield dwellings and sections are known to be in the pipeline. From 2016 the SHAs will play a significant role in housing supply. Number of new dwellings that developers are known to be planning* Auckland; ; cumulative; calendar years; Auckland Council (Housing Supply Inventory) All known forecast supply other than SHAs Forecast dwelling supply from SHAs * Known developments understate dwelling supply, as these figures only capture known developments of 5 or more dwellings. 10
11 Meeting Accord targets 11
12 Targets The Auckland Housing Accord targets are based on the net number of new dwellings issued with building consents and sections created in Auckland each year. Auckland Housing Accord Paragraph 26 The agreed goals, set out below, include all new dwellings and new sites consented under existing regulations or through the application of the new tools enabled through this Accord and are based on new building and subdivision consents in greenfield and brownfield areas. Dwellings The number of new dwellings that receive building consent, as recorded in the monthly building consent data available from Statistics New Zealand. Sections The number of new residential sections of up to 5,000m 2 that are legally created in the land register, as recorded weekly by Land Information New Zealand. 12
13 13 Dwellings


14 New dwellings issued with building consents monthly In Accord Year 2, October 2014 September 2015, 8,721 new dwellings issued with building consents, up from 7,403in the Accord Year 1. The medium-term trend line in new dwelling consents remains positive. Number of new dwellings that received building consent Auckland; October 2012 September 2015; monthly total; Statistics New Zealand (Infoshare) Accord Year 1 7,403 dwellings Accord Year 2 8,721 dwellings 14
15 New dwellings issued with building consents long term trends Accord Year 1 recorded the highest annual total in new dwellings issued with building consents (7,403) since 2006 (7,442). The new dwellings consented in Accord Year 2 (8,721) exceeded the numbers in Accord Year 1 by 1, Number of new dwellings that received building consent Auckland; January 2000 September 2015; monthly total; Statistics New Zealand (Infoshare) Accord Year 1 Accord Year Jan-00 Jun-00 Nov-00 Apr-01 Sep-01 Feb-02 Jul-02 Dec-02 May-03 Oct-03 Mar-04 Aug-04 Jan-05 Jun-05 Nov-05 Apr-06 Sep-06 Feb-07 Jul-07 Dec-07 May-08 Oct-08 Mar-09 Aug-09 Jan-10 Jun-10 Nov-10 Apr-11 Sep-11 Feb-12 Jul-12 Dec-12 May-13 Oct-13 Mar-14 Aug-14 Jan-15 June-15 15

16 New dwellings issued with building consents in multi-unit buildings* monthly In Accord Year 2, 3,755new dwellings in multi-unit buildings were issued with building consents up by 913from 2,842in Accord Year 1. Dwellings in multi-unit buildings accounted for 43% of new dwellings consented. 16
17 New dwellings in multi-unit buildings issued with building consents long term trends The total number of dwellings in multi-unit buildings issued with building consents for Accord Year 2 (3,755) is the highest annual total to September since 2005 (3,783), a decade ago Number of new dwellings in multi-unit buildings that received building consent Auckland; October 2012 September 2015; monthly total; Statistics New Zealand (Infoshare) Accord Year 1 Accord Year Jan-00 Jun-00 Nov-00 Apr-01 Sep-01 Feb-02 Jul-02 Dec-02 May-03 Oct-03 Mar-04 Aug-04 Jan-05 Jun-05 Nov-05 Apr-06 Sep-06 Feb-07 Jul-07 Dec-07 May-08 Oct-08 Mar-09 Aug-09 Jan-10 Jun-10 Nov-10 Apr-11 Sep-11 Feb-12 Jul-12 Dec-12 May-13 Oct-13 Mar-14 Aug-14 Jan-15 June-15 17


18 Location of new residential dwellings consented: October 2014 June
 is higher than in any 12-month period since September 2005 (746 per month), but this is still only 67% of the")

19 Monthly new dwellings issued with building consents -moving average The monthly average number of all new dwellings issued with building consents over the 12 months to September 2015 (727 per month) is higher than in any 12-month period since September 2005 (746 per month), but this is still only 67% of the previous peak 12-monthly average of 1,078 in June The 12-monthly average continues to increase steadily, now exceeding levels of a decade ago Moving monthly average new dwellings that received building consent in the last 12 months Auckland; June 1991 September 2015; Statistics New Zealand (Infoshare) 19
20 Yearly new dwellings issued with building consents More new dwellings (8,721) were issued with building consents in the 12 months to September 2015 than in any 12 month period to September since 2005 (8,956). However, this is still only 70% of the previous peak of 12,477 in June New dwellings in multi-unit buildings issued with building consentsin the year (3,755) was also the highest since 2005 (3,783); a decade ago. Number of new dwellings that received building consent in the previous 12 months Auckland; September 1992 September 2015; Statistics New Zealand (Infoshare) 20
21 New dwellings issued with building consents annual average growth on the previous year Since the Accord took effect in October 2013, the annual increase in new dwellings issued with building consents to the same month in the previous year, has averaged 27.5%, peaking in April 2014 when dwelling consents in the year to April 2014 exceeded dwelling consents in the year to April 2013 by almost 41%. For Accord Year 2 to September 2015, the annual increase in consented dwellings over Accord Year 1 was 17.8% Growth in consented new dwellings compared to the same month in the previous year Auckland; March 1992 September 2015: change in the number of consented dwellings; Statistics New Zealand (Infoshare) 21

22 Dwelling sales prices The Auckland median monthly house price in September 2015 increased to $771,000 from $615,000 in September Dwelling prices in Auckland continue to trend upwards, with the average median price for the 12 months to September 2015 increasing to $709,485 from $606,254 in the previous year. Median dwelling price Auckland; January 2002 September 2015; monthly median and 12-month moving average; Real Estate Institute of New Zealand 22
23 Dwelling sales prices growth The monthly annual growth rate in the median sales price for dwellings in Auckland trended downward from November 2013 to a low of 7.9% in September 2014 at the end of Accord Year 1. In the 12 months to September 2015, the monthly annual growth rate rose again to 25.4%. Growth in the median sales price compared to the same month in the previous year Auckland; January 2003 September 2015; change in the median sales price; Real Estate Institute of New Zealand 23
24 24 Sections


25 New residential sections monthly The average monthly number of new residential sections, under 5000m 2, created in Accord Year 1 increased from 428per month in the year prior to the Accord, to 460in Accord Year 1. In Accord Year 2, the monthly average was higher than in Year 1 at 470sections per month. There was a larger increase in new sections created in the last quarter of Accord Year 2, with monthly new sections averaging 597 per month. Number of new residential section titles created Auckland; monthly from Oct 2013 to September 2015; new sections < 5,000m2 in areas zoned for residential housing; Land Information New Zealand 25


26 Location of new residential sections created: October 2014 September
27 Special Housing Areas 27
28 28
29 Dwelling creation in special housing areas In Accord Year 1 to September 2014, 429new residential dwellings were consented under a building consent in Special Housing Areas. In Accord Year 2 to September 2015, a further 797dwellings were consented bringing total dwelling consents in SHAs since the start of the Accord to 1,226 (Source RIMU, Auckland Council). 1,400 Cumulative new dwellings consented in SHAs -Oct 2013 to September ,200 New dwellings consented 1, ,019 1,0931,1671,
30 Dwelling creation in special housing areas Most new dwelling consents continue to be issued in areas already under development such as Flat Bush, Northern Tamaki and Hobsonville. Dwelling consents are accelerating since the last Monitoring Report in areas like Weymouth, Hingaia, Silverdale and Otahuhu Coast. 350 New residential dwellings consented in Special Housing Areas -Oct 2013 to September New dwellings
31 Dwelling completions in Special Housing Areas Since the start of the Accord on 1 October 2013, 1,226 dwellings have been given building consents in the SHAs and approximately 500 dwellings have been completed. While a number of SHAs are in the planning process or are still having earthworks and site preparations undertaken and dwellings constructed, dwellings had been completed in 16 SHAs. 31
32 Section creation in special housing areas In Accord Year 1 to September 2014, 638new residential section titles under 5000m 2 were created in Special Housing Areas. In Accord Year 2 a further 605 sections were created, bringing total sections created in SHAs since the start of the Accord to 1,243 (Source RIMU, Auckland Council). 1,400 Cumulative new sections in SHAs -Oct 2013 to September ,200 New residential sections 1, ,055 1,243 32
33 Section creation in special housing areas Most section creation activity is from subdivisions already in progress at the start of Accord Year 1 in places like Flat Bush, Hingaiaand Silverdale. Section creation as a direct result of the Accord is now to be seen in places like Hobsonville (220), Weymouth (153), New Lynn (65) and Northern Tamaki (56) New residential sections in Special Housing Areas -Oct 2013 to September New sections


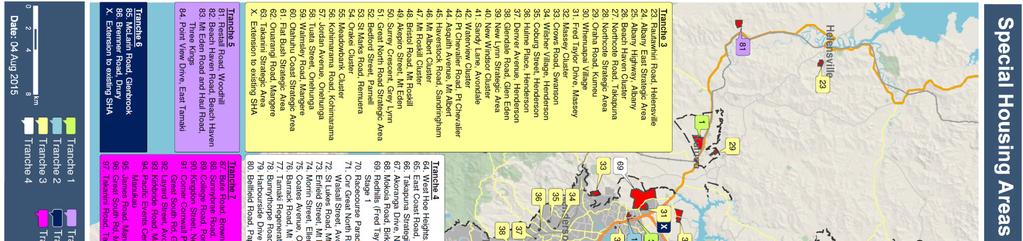
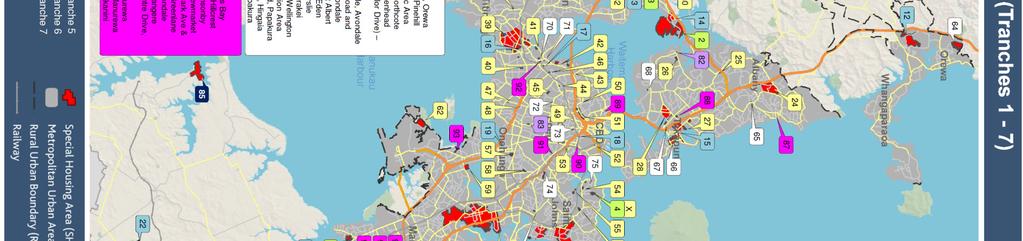
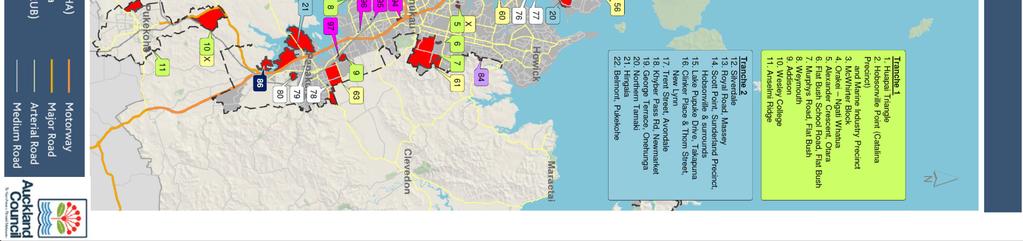
34 Special housing areas expected supply The 97 special housing areas in Tranches 1-7* are expected to supply about 10,000 dwellings or sections over the 3 years of the Accord. Over time, these could eventually deliver around 50,000 new dwellings. Actual yields may be lower or higher as plan variations and qualifying developments are progressed. In calendar year 2014, 849dwellings and sections were expected from SHAs. Data behind Slides 25 and 27 shows there were 504new dwellings consented and 710new sections created in SHAs, giving 1,214new dwellings/sections in the calendar year exceeding expected delivery. In calendar year 2015, 3,100 dwellings and sections are expected from SHAs (2,325 for the nine months to September). In the first 9 months of the calendar year to September 2015, 624 new dwellings were consented and 463 new sections created in SHAs, giving only 1087new dwellings/sections, below expectations. *Tranche 7 was announced by the Minister in August of Accord Year 2 34


35 Activity in SHAs At the end of Accord Year 2 September 2015 there were good levels of activity occurring in the 97 SHAs in Tranches 1-7 with: 21 SHAs having homes being built in them 15 SHAs having earthworks and site preparations underway another 42 SHAs in various stages of the planning process. 35


36 Yield expected from SHAs by degree of activity At the end of Accord Year 2 September 2015: Developers were building homes in SHAs capable of a final yield of just under 26,000 dwellings over years Earthworks and site preparations were underway in SHAs capable of a final yield of over 4,061 dwellings Over 4,970 sections/ dwellings were subject to lodged or approved Qualifying Developments 36
37 HPO Master planning and consenting 37
, HuapaiTriangle, OrahaRoad, Oruarangi Road, Scott Point and Whenuapai Village (second variation) 2 Plan")
38 HPO Master planning activity From the beginning of the Accord to 30 September 2015 At the end of the Accord Year pre-applications had been lodged or processed for 29,284 dwellings/ sections 9 Plan variations were underway for 7,800 dwellings/ sections at Flat Bush, Hingaia(3 variations), HuapaiTriangle, OrahaRoad, Oruarangi Road, Scott Point and Whenuapai Village (second variation) 2 Plan variations had been approved for 5,150 dwellings/sections at Whenuapai Village and Wesley College 116 Qualifying developments were in progress for 2,221 dwellings/ sections 172 Qualifying development consents had been approved for 2,374 dwellings/ sections. 38
39 39 Land supply
 were announced by the Minister on 27 August 2015 adding capacity for 1,595 dwellings to the final potential SHA yield.")

40 Special Housing Area - Establishment 86 Special Housing Areas (Tranches 1 6) had been gazetted as at 30 September 2015, the end of Accord Year Special Housing areas (Tranche 7) were announced by the Minister on 27 August 2015 adding capacity for 1,595 dwellings to the final potential SHA yield. Of these 97 SHAs the bulk of the final yield (68%) will come from greenfield sites. However, 68 brownfield locations account for 32% of yield (14,915 dwellings). On 23 Dec 2015 the Minister of Building & Housing and the Mayor of Auckland announced the approval of Tranche 9: a further 9 new SHAs and one extension to an existing SHA, taking the total number of SHAs to 106. Tranche 8, announced 23 November 2015, is expected to be gazetted in mid-december These tranches fall into Y3 of the Accord. 40
. This could accommodate around 200,000 people, close to the current population of Hamilton, New Zealand s fourth biggest city.")

41 SHAs and future urban land supply outside the 2010 MUL There are 10,508 ha of Future Urban Zoned land outsidethe 2010 Metropolitan Urban Limit (MUL), nearly 20% more than the extent of the current metropolitan area (53,775 ha). This could accommodate around 200,000 people, close to the current population of Hamilton, New Zealand s fourth biggest city. 16 of the 97 SHAs are outsidethe 2010 MUL and make up 1,737.6 ha (gross) of the Future Urban Zone. These SHAs could accommodate 20,417 dwellings. At the end of Accord Year 2, Auckland had between 6.15 years worth of G1 greenfield land supply land zoned and serviced with bulk infrastructure. Following plan variations under the Accord, a number of Future Urban Zoned SHAs will combine to provide another 4.19 years of G1 supply. 41


42 SHAs and future urban land supply outside the 2010 MUL 42
Auckland Housing Accord Second Report for Accord Year 2
 Auckland Housing Accord Second Report for Accord Year 2 October 2014 to March 2015 Based on: building consent data to month ended 31 March 2015 new sections data to month ended 31 March 2015 Housing Project
Auckland Housing Accord Third Quarterly Report for the Fourth Accord Year 1 April to 30 June 2017
 Auckland Housing Accord Third Quarterly Report for the Fourth Accord Year 1 April to 30 June 2017 Based on data to 30 June 2017 for: City-wide building consents and completions (Auckland Council and Statistics
Wellington Housing Accord Monitoring Report 4
 Wellington Housing Accord Monitoring Report 4 July 215 to June 216 Based on: building consent data to month ended June 216 new section data to month ended June 216 Executive Summary This monitoring report
Auckland Monthly Housing Update. December 2018
 Auckland Monthly Housing Update December 2018 Table of contents 1. Summary... 3 2. Highlights... 4 3. Dwellings consented... 5 4. Dwellings consented by type... 6 5. Dwellings consented inside 2010 MUL...
Christchurch Housing Accord Monitoring Report. For quarter ending June 2015
 Christchurch Housing Accord Monitoring Report For quarter ending June 2015 Executive Summary This report provides an overview of the Christchurch housing market and an update on priority Accord actions.
Auckland Monthly Housing Update. March 2018
 Auckland Monthly Housing Update March 2018 Table of contents 1. Summary... 3 2. Highlights... 4 3. Dwellings consented... 5 4. Dwellings consented by type... 6 5. Dwellings consented inside 2010 MUL...
Auckland Monthly Housing Update. Feburary 2018
 Auckland Monthly Housing Update Feburary 2018 Table of contents 1. Summary... 3 2. Highlights... 4 3. Dwellings consented... 5 4. Dwellings consented by type... 6 5. Dwellings consented inside 2010 MUL...
Monthly Indicators + 7.3% + 6.6% + 8.3% Single-Family Market Overview Condo Market Overview New Listings Pending Sales.
 Monthly Indicators 2018 The three most prominent national market trends for residential real estate are the ongoing lack of abundant inventory, the steadily upward movement of home prices and year-over-year
California Housing Market Update. Monthly Sales and Price Statistics September 2018
 California Housing Market Update Monthly Sales and Price Statistics September 2018 Sales Had the Largest Decline since March 2014 California, September 2018 Sales: 382,550 Units, -3.3% YTD, -12.4% YTY
SFR Condo Residential Lot Sales Inventory Sales Inventory Sales Inventory. Month YTD Month Month YTD Month Month YTD Month
 Grand Strand Market Report 2017 capped off a great year for the Grand Strand as full year SFR sales volume and median sales price were up 9.8% and 4.3%, respectively. Condo sales activity increased 3.0%
Dec December 2018
 December MONTHLY STATISTICS PACKAGE Job market weakness and lending restrictions a common thread in s housing market, January, 19 As oversupply continues in Calgary s housing market, December prices eased
Auckland Council Quarterly Monitoring Report
 Auckland Council Quarterly Monitoring Report for the National Policy Statement on Urban Development Capacity June 2018 2018 Auckland Council Prepared by the Land Use, Infrastructure Research and Evaluation
May 2008 MLS Month in Review
 May 28 MLS Month in Review The Albuquerque Market continues to improve, and it s evident that finally, the negative media is turning into positive media. This month s TOP Selling Price Range is $2K to
Information sheet A Data
 House prices: Statistics activity House prices change over time, but do so at different rates in different places. In this activity you will use statistical diagrams and measures to compare house prices
California Housing Market Update. Monthly Sales and Price Statistics November 2018
 California Housing Market Update Monthly Sales and Price Statistics November 2018 Home Sales: Largest Decline Since 2014 California, November 2018 Sales: 381,400 Units, -4.6% YTD, -13.4% YTY 700,000 600,000
MLS of Greater Cincinnati - Charts for the Month: November 2017
 MLS of Greater Cincinnati - Charts for the Month: November 2017 The following charts provide an overview of what has occurred in the MLS over the past month. Each chart provides a historical trend. The
California Housing Market Update. Monthly Sales and Price Statistics October 2018
 California Housing Market Update Monthly Sales and Price Statistics October 2018 Sales Had the 2 nd Largest Drop in the Last 6 Months California, October 2018 Sales: 397,060 Units, -3.7% YTD, -7.9% YTY
Scott Market Report Stronger Sales Continue
 June 20 Scott Market Report Stronger Sales Continue The Outer Banks real estate market is seeing good signs in most market segments. After a somewhat slow start to 20, sales agreements picked up significantly
Regulatory Impact Statement
 Regulatory Impact Statement Establishing one new special housing area in Queenstown under the Housing Accords and Special Housing Areas Act 2013. Agency Disclosure Statement 1 This Regulatory Impact Statement
Monthly Indicators % % - 9.2%
 Monthly Indicators 2016 New Listings were down 1.4 percent for single family/duplex homes and 25.0 percent for townhouse-condo properties. Pending Sales increased 58.3 percent for single family/duplex
Monthly Indicators % % %
 Monthly Indicators 2016 Percent changes calculated using year-over-year comparisons. New Listings were down 27.6 percent for single family homes and 41.8 percent for townhouse-condo properties. Pending
ECONOMIC CURRENTS. Vol. 3, Issue 1. THE SOUTH FLORIDA ECONOMIC QUARTERLY Introduction
 ECONOMIC CURRENTS THE SOUTH FLORIDA ECONOMIC QUARTERLY Introduction Economic Currents provides an overview of the South Florida regional economy. The report contains current employment, economic and real
Monthly Statistics Package November 2015
 Vancouver Island Real Estate Board Monthly Statistics Package November 2015 FOR IMMEDIATE RELEASE December 1, 2015 November Sales Activity Up Significantly From One Year Ago NANAIMO, BC November sales
California Housing Market Update. Monthly Sales and Price Statistics May 2018
 California Housing Market Update Monthly Sales and Price Statistics May 2018 Sales Lost Momentum as Mortgage Rates Continued to Climb California, May 2018 Sales: 409,270 Units, +0.3% YTD, -4.6% YTY 700,000
California Housing Market Update. Monthly Sales and Price Statistics December 2018
 California Housing Market Update Monthly Sales and Price Statistics December 2018 Sales Reached the Lowest Level since Jan 2015 California, December 2018 Sales: 372,260 Units, -5.2% YTD, -11.6% YTY 700,000
CALGARY REGIONAL HOUSING MARKET STATISTICS 12.14
 CALGARY REGIONAL HOUSING MARKET STATISTICS 12.14 Yearly records set as monthly sales see slight decline Condominium and townhouse sales set a new record for 214 Calgary, January 2, 215 It was a record
New year kicks off with slow sales Jan. 2019
 January 19 19 MONTHLY STATISTICS PACKAGE New year kicks off with slow sales 19, February 1, 19 As economic challenges linger into 19, housing markets remain on a sluggish pace. January sales totalled 8
Weak sales persist in Calgary and beyond Jun. 2018
 June 218 MONTHLY STATISTICS PACKAGE City of Calgary Weak sales persist in Calgary and beyond 218 City of Calgary, July 3, 218 Many Canadian energyrelated municipalities within Alberta and Saskatchewan
Sep September 2018
 18 September 18 MONTHLY STATISTICS PACKAGE City of Calgary Persistent buyers market continues 18 City of Calgary, October 1, 18 With no change in the economic climate, Calgary s sales activity totaled
MONTHS OF SUPPLY AND PRICE CHANGES. Home improvement November marks a rise in sales. MONTHLY STATISTICS PACKAGE City of Calgary. Nov.
 November 17 17 Home improvement November marks a rise in sales. City of Calgary, December 1, 17 The November housing market was spurred by a rise in sales, particularly in the lower price ranges. Sales
MonthlyStatistics DECEMBER 2017
 MonthlyStatistics DECEMBER 2017 FOR IMMEDIATE RELEASE January 2, 2018 VIREB Posts the Strongest December on Record NANAIMO, BC The Vancouver Island Real Estate Board (VIREB) reports that on a seasonally
July 2012 was $162,256. ($153,956). was $314,607. was $172,488. ($164,426). Kansas City Region Average Sales Price - Existing Homes
. was $314,607. was $172,488. ($164,426). Kansas City Region Average Sales Price - Existing Homes") July 212 Kansas City Regional Real Estate Market Report Average Sales Price The average exis ng home sale price in July 212 was $162,256. 25 Kansas City Region Average Sales Price - Existing Homes July
July 212 Kansas City Regional Real Estate Market Report Average Sales Price The average exis ng home sale price in July 212 was $162,256. 25 Kansas City Region Average Sales Price - Existing Homes July
Monthly Indicators % + 9.7% %
 Monthly Indicators 2016 Percent changes calculated using year-over-year comparisons. New Listings were up 11.1 percent for single family homes and down 30.8 percent for townhouse-condo properties. Pending
Monthly Indicators + 4.8% - 3.5% %
 Monthly Indicators 2015 New Listings were up 45.0 percent for single family/duplex homes but decreased 44.1 percent for townhouse-condo properties. Pending Sales increased 14.3 percent for single family/duplex
O O ct ct ober 2017
 October Status Quo for Calgary's Housing Market Prices remain similar to last year, but ease in October., November 1, 17 October s housing market conditions closely echoed previous month s trends with
Housing market report
 Capital city market report Prepared August Dr Andrew Wilson, Senior Economist Australian Property Monitors Buyer momentum rises through mid-winter housing markets National overview Buyer and seller momentum
AAug ugust 2017
 August 17 17 Housing recovery a balancing act Growth in new listings outpaced sales preventing inventory declines City of Calgary, September 1, 17 Sales posted a modest gain in August, but a rise in new
Monthly Indicators % % - 3.5%
 Monthly Indicators 2017 New Listings were up 6.3 percent for the category but decreased 33.1 percent for the category. Pending Sales increased 5.0 percent for but decreased 1.3 percent for. The Median
Housing market feels the chill as oversupply continues Feb. 2019
 February 19 19 MONTHLY STATISTICS PACKAGE Housing market feels the chill as oversupply continues 19, March 1, 19 The effects of Calgary s economic climate continue to create weak sales activity and elevated
Housing Bulletin Monthly Report
 January 21 1 Housing Bulletin Monthly Report Most new homes built in second half of 29 25, 2, 15, 1, 5, Dec 7 Jan 8 Feb 8 mar 8 apr 8 Alberta s 29 housing starts increased 72.8 per cent over 28, suggesting
Bureau of Business Research Webinar Series October 2016
 Bureau of Business Research Webinar Series October 2016 Presented by Eric Thompson W.W. Marshall Associate Professor of Economics Director, Bureau of Business Research Outline Importance of Affordable
Provided by Keller Williams Realty Professional Partners Statistics from September 2010 MLS
 Monthly Market Watch for Maricopa County An overview of what is happening in the Maricopa County real estate market (using September 2010 statistics) Report overview: This report includes MLS data for
New Zealand Property Market Report
 New Zealand Property Market Report August 20 Introduction What is the purpose of this report? This report is aimed at equipping you with the best and most up to date information to make sure you make the
Planning applications 3 Year Income vs Number of Applications
 APPENDIX 13 FEES AND CHARGES REPORT PLANNING SERVICES 1. Service description The Planning service has a number of Fees and s namely: Planning Application Fees Statutory set fees by Central Government and
While a project is typically acquired on a specific date
 A Presentation of the National Association of Home Builders While a project is typically acquired on a specific date Building rehab (if there are multiple buildings) is typically completed building by
METROPOLITAN TRACT PERFORMANCE REPORT For the Quarter Ended March 31, 2008
 F-5 METROPOLITAN TRACT PERFORMANCE REPORT For the Quarter Ended March 31, 2008 Finance, Audit & Facilities Committee June 12, 2008 CONSOLIDATED METROPOLITAN TRACT PROPERTIES Quarterly Summary Quarterly
Monthly Indicators % % %
 Monthly Indicators 2018 Percent changes calculated using year-over-year comparisons. New Listings were down 12.9 percent for single family homes and 21.3 percent for townhouse-condo properties. Pending
Tri-Cities Insider September 2015
 Tri-Cities Insider Your Current Real Estate Market 1 Go to: http://grouponetricities.com click on this logo to view market info each month. 2 3 Yearly Comparisons- Real Trends July/June 2015 Housing Market
Rightmove House Price Index
 Rightmove House Price Index The largest monthly sample of residential property prices January 2018 National edition Busy start to 2018 with increased home-hunter activity Early traffic data indicates a
Oversupply persists despite improved sales activity for affordable product Mar. 2019
 March 19 MONTHLY STATISTICS PACKAGE Oversupply persists despite improved sales activity for affordable product 19, April 1, 19 March saw a modest decline in city wide sales activity compared to last year.
Released: May 7, 2010
 Released: May 7, 2010 Commentary 2 The Numbers That Drive Real Estate 3 Recent Government Action 9 Topics for Home Buyers, Sellers, and Owners 11 Brought to you by: KW Research Commentary The economic
MonthlyStatistics AUGUST 2018
 MonthlyStatistics AUGUST 2018 FOR IMMEDIATE RELEASE September 4, 2018 Sales Bounce Back Slightly From July But Still Lower Than in 2017 NANAIMO, BC Sales of single-family homes in August were seven per
MonthlyStatistics MAY 2018
 MonthlyStatistics MAY 2018 FOR IMMEDIATE RELEASE June 1, 2018 Single-Family Benchmark Price Surpasses $500,000 in May NANAIMO, BC The benchmark price of a single-family home in the VIREB area broke the
Monthly Market Watch for the Prescott Quad City Area. Provided by Keller Williams Check Realty Statistics from August 2012 Prescott MLS
 August 2012 Monthly Market Watch for the Prescott Quad City Area Provided by Keller Williams Check Realty Statistics from August 2012 Prescott MLS Report Overview: This report includes MLS data for the
California Housing Market Update. Monthly Sales and Price Statistics August 2018
 California Housing Market Update Monthly Sales and Price Statistics August 2018 Sales Declined for the 4 th Consecutive Month California, August 2018 Sales: 399,600 Units, -2.1% YTD, -6.6% YTY 700,000
Aug. Aug 2018 ust 2018
 August 18 MONTHLY STATISTICS PACKAGE City of Calgary Unemployment rate slows housing market recovery 18 City of Calgary, September, 18 Easing sales, gains in new listings and elevated inventory levels
A A p p r ril 2017
 April 17 17 Housing market retains momentum in April Citywide prices hold steady as labour market improves City of Calgary, May 1, 17 Calgary s housing market continued to show signs of stability in April.
FOR IMMEDIATE RELEASE Contact: David B. Bennett President & CEO Phone:
 FOR IMMEDIATE RELEASE Contact: David B. Bennett President & CEO Phone: 727-216-32 Email: dbennett@tampabayrealtor.com Real Estate Statistics for September 216 At this time of year everyone starts to get
New Plymouth District Council 1 of 23
 New Plymouth District Council 1 of 23 Contents Executive Summary... 4 Introduction... 4 Purpose of this Quarterly Report... 4 First Quarterly Report... 5 New Plymouth District... 5 New Plymouth District
THE OUTLOOK FOR HOUSING IN ILLINOIS
 THE OUTLOOK FOR HOUSING IN ILLINOIS Jonathan Smoke Chief Economist January 25, 2017 NATIONAL TRENDS 2 2000.01 2000.05 2000.09 2001.01 2001.05 2001.09 2002.01 2002.05 2002.09 2003.01 2003.05 2003.09 2004.01
Puerto Rico Housing Finance Authority Housing Stimulus Programs
 Puerto Rico Housing Finance Authority Housing Stimulus Programs March 31, 2012 (Final with US Data) Total sales assisted by PRHFA stimulus from $240MM Fund Assignment As of March 31, 2012 Silent Second
September 2018 MLS Statistical Report
 September 218 MLS Statistical Report Total Sales Blame it on Hurricane Florence but overall, sales dropped drastically in August - down 17%. Total Sales Sept'18 172-17% Sept'17 26-2% Sept'16 211 7% 3 2
Monthly Market Watch for Maricopa County An overview of what is happening in the Maricopa County real estate market
 Monthly Market Watch for Maricopa County An overview of what is happening in the Maricopa County real estate market Provided by Susan Kraemer of Prudential Arizona Properties Report overview: This report
Multi-Family. Acknowledgements. Author. Data Analysis/ Layout. Financial Support. Disclosure. Charles Dalton. Real Data
 Multi-Family Acknowledgements Author Charles Dalton Data Analysis/ Layout Real Data Financial Support Disclosure The E. V. Williams Center for Real Estate and Economic Development (CREED) functions and
MONTHLY STATISTICS PACKAGE
 MONTHLY STATISTICS PACKAGE FEBRUARY 2019 FOR IMMEDIATE RELEASE March 1, 2019 Guideline B-20 Continues to Dampen Housing Sales NANAIMO, BC Sales of single-family homes in February board-wide dipped by 28
June 2008 MLS Month in Review
 June 28 MLS Month in Review The Greater Albuquerque Real Estate Market continues to be strong. REALTORS put 1,769 homes under contract in the month of June. For our Market Area, sales are up 9.5% for Detached
FOR IMMEDIATE RELEASE Contact: David B. Bennett President & CEO Phone:
 FOR IMMEDIATE RELEASE Contact: David B. Bennett President & CEO Phone: 727-216-32 Email: dbennett@tampabayrealtor.com Real Estate Statistics for December 217 wrapped up a sizzling 217 with a steady month
UDIA WA PROPERTY MARKET STATISTICS
 UDIA WA PROPERTY MARKET STATISTICS AUGUST 217 1 What s new in strata? Learn how community title schemes and leasehold strata are changing the strata game. Visit landgate.wa.gov.au/strata-reform Subscribe
SE Michigan Residential Real Estate Recovery Are we there yet or is it over?
 SE Michigan Residential Real Estate Recovery Are we there yet or is it over? Changing View of Residential Transactions Changing View of Residential Transactions 2015 Short Sales 3% Leases Bank 11% Owned
UDIA WA PROPERTY MARKET STATISTICS
 UDIA WA PROPERTY MARKET STATISTICS OCTOBER 217 1 IN THIS ISSUE KEY TRENDS INDUSTRY UPDATE 3 4 ECONOMY RESIDENTIAL LAND DEVELOPMENT RESIDENTIAL PROPERTY SETTLEMENTS RESIDENTIAL PROPERTY MARKET RESIDENTIAL
NOVEMBER 2018 Harrisonburg & Rockingham County Real Estate Market Report
 NOVEMBER 218 Real Estate Market Report An analysis of real estate activity through October 31, 218 provided courtesy of Scott P. Rogers, Funkhouser Real Estate Group Custom-Built Highland Park Home with
OCTOBER 2018 Harrisonburg & Rockingham County Real Estate Market Report
 OCTOBER 218 Real Estate Market Report An analysis of real estate activity through September 3, 218 provided courtesy of Scott P. Rogers, Funkhouser Real Estate Group Five Bedroom City Home with Finished
Achieving the Auckland Vision - The role of Housing
 PRES/32 Achieving the Auckland Vision - The role of Housing Beacon Symposium 11 September 2012 Raewyn Stone Manager Community & Cultural Strategy Auckland Council The challenge: rapid population growth
M onthly arket. July Table of Contents. Monthly Highlights
 Table of Contents Market Inventory...2 www.gaar.com Monthly Highlights The median sale price of single-family, detached homes climbed to $190,000 in July 2014, the highest level since August 2008. Market
UDIA WA PROPERTY MARKET STATISTICS
 UDIA WA PROPERTY MARKET STATISTICS APRIL 218 1 IN THIS ISSUE KEY TRENDS INDUSTRY UPDATE ECONOMY RESIDENTIAL LAND DEVELOPMENT RESIDENTIAL PROPERTY SETTLEMENTS RESIDENTIAL PROPERTY MARKET RESIDENTIAL CONSTRUCTION
MonthlyStatistics AUGUST 2017
 MonthlyStatistics AUGUST 2017 FOR IMMEDIATE RELEASE September 1, 2017 VIREB Housing Market Continues to Sizzle NANAIMO, BC The Vancouver Island Real Estate Board (VIREB) reports that single-family home
Jackson County Residental Market Trends. February Pending Sales New Listings
 Jackson County Residental Market Trends February 2017 Pending Sales..2 New Listings..3 Overall activity trends are not a measure of pricing or value for individual properties. Small Sampling sizes can
Pikes Peak area housing Market Statistics (As of: 9/30/2018)
") $156,25 $184, $174,697 $177,2 $21,53 $185,83 $173, $178,29 $172,25 $212,75 $21,95 $226,692 $197,5 $199, $196, $28, $25, $223,95 $216,75 $29,527 $234,9 $218,82 $229,74 $235,518 $231,457 $255, $259,11 $269,98
$156,25 $184, $174,697 $177,2 $21,53 $185,83 $173, $178,29 $172,25 $212,75 $21,95 $226,692 $197,5 $199, $196, $28, $25, $223,95 $216,75 $29,527 $234,9 $218,82 $229,74 $235,518 $231,457 $255, $259,11 $269,98
England Occupancy Survey May 2017 SUMMARY OF RESULTS
 England Occupancy Survey 2017 SUMMARY OF RESULTS Room occupancy in 2017 increased +1% to 73%. Bedspace occupancy also increased +1% to 54%. Weekday room occupancy remained stable at 72% whilst weekend
MARKET OUTLOOK FOR SAN MATEO
 MARKET OUTLOOK FOR SAN MATEO Jonathan Smoke Chief Economist August 2, 2016 NATIONAL TRENDS 2 JOB CREATION REBOUNDED IN JUNE 229,000 jobs created by month in 2015; 172,000 average this year Employment and
November 2012 October 2012 November 2011 Manhattan Condo Index 1,974 1, % 1, %
 Market Report StreetEasy is pleased to present our 2012 Q4 Quarterly Report on the residential market. The bulk of the report is based on approximately 3,600 estimated recorded sales for this quarter as
Foreclosure. Report Douglas County Property 3,000 2,680 2,500 2,403 2,180 2,000 1,856 1,500 1,258 1,279 1,000 1, ,062 1,051
 3, 2,68 2,5 2,43 2,18 2, Douglas County Property 1,856 1,5 Foreclosure 1,258 1, Report 21 8 912 1,64 992 1,62 1,51 1,279 652 5 415 212 27 2 21 22 23 24 25 26 27 28 29 21 Page 1 of 12 Table of contents
Josephine County Residental Market Trends. January Pending Sales New Listings
 Josephine County Residental Market Trends January 217 Pending Sales..2 New Listings..3 Overall activity trends are not a measure of pricing or value for individual properties. Small Sampling sizes can
2017 IN REVIEW THE BLUE MTS. REAL ESTATE MARKET REPORT LOCATIONS ROYAL LEPAGE S 2016 BROKERAGE OF THE YEAR FOR ONTARIO.
 THE BLUE MTS. REAL ESTATE MARKET REPORT IN REVIEW WE RE PROUD AND GRATEFUL TO HAVE BEEN CHOSEN AS ROYAL LEPAGE S BROKERAGE OF THE YEAR FOR ONTARIO OVERVIEW RECORD VOLUME SALES, HIGHER PRICES, SHORTER SALE
FOR IMMEDIATE RELEASE Contact: David B. Bennett President & CEO Phone:
 FOR IMMEDIATE RELEASE Contact: David B. Bennett President & CEO Phone: 727-216-32 Email: dbennett@tampabayrealtor.com Real Estate Statistics for September 217 September s numbers are out, and it comes
Patience required in Calgary's housing market recovery Jul. 2018
 July 18 MONTHLY STATISTICS PACKAGE City of Calgary Patience required in Calgary's housing market recovery 18 City of Calgary, August 1, 18 Recent struggles in the job market, accompanied by yet another
Monthly Statistics Package July 2016
 Vancouver Island Real Estate Board Monthly Statistics Package July 2016 FOR IMMEDIATE RELEASE August 2, 2016 Home Sales a Bit Cooler in July But Significantly Higher Than Last Year NANAIMO, BC Home sales
UDIA WA PROPERTY MARKET STATISTICS
 UDIA WA PROPERTY MARKET STATISTICS MAY 218 1 IN THIS ISSUE KEY TRENDS INDUSTRY UPDATE 3 4 ECONOMY RESIDENTIAL LAND DEVELOPMENT RESIDENTIAL PROPERTY SETTLEMENTS RESIDENTIAL PROPERTY MARKET RESIDENTIAL CONSTRUCTION
UDIA WA PROPERTY MARKET STATISTICS
 UDIA WA PROPERTY MARKET STATISTICS JUNE 218 1 IN THIS ISSUE KEY TRENDS INDUSTRY UPDATE ECONOMY RESIDENTIAL LAND DEVELOPMENT RESIDENTIAL PROPERTY SETTLEMENTS RESIDENTIAL PROPERTY MARKET RESIDENTIAL CONSTRUCTION
August 1, Victoria Housing Market Still Finding Its Balance
 August, 28 PRESIDENT Kyle Kerr PRESIDENT ELECT Cheryl Woolley SECRETARY TREASURER David Langlois PAST PRESIDENT Ara Balabanian DIRECTORS Jackie Adkins Sandi-Jo Ayers Bill Ethier Karen Dinnie-Smyth Andrew
UDIA (WA) Research Breakfast. Great expectations: The market in 2013
 Research Breakfast. Great expectations: The market in 2013") (WA) Research Breakfast Great expectations: The market in 2013 Presentation Overview Established property market activity Perth land development activity Housing construction activity What to expect in
(WA) Research Breakfast Great expectations: The market in 2013 Presentation Overview Established property market activity Perth land development activity Housing construction activity What to expect in
Housing Price Forecasts. Illinois and Chicago PMSA, December 2015
 Housing Price Forecasts Illinois and Chicago PMSA, December 2015 Presented To Illinois Association of Realtors From R E A L Regional Economics Applications Laboratory, Institute of Government and Public
MonthlyStatistics JANUARY 2018
 MonthlyStatistics JANUARY 2018 FOR IMMEDIATE RELEASE February 1, 2018 Sales Return to Seasonal Norms in January NANAIMO, BC Coming off the busiest December on record, sales in the VIREB area returned to
Jackson County Residental Market Trends. November Pending Sales New Listings
 Jackson County Residental Market Trends November 2017 Pending Sales..2 New Listings..3 Overall activity trends are not a measure of pricing or value for individual properties. Small Sampling sizes can
A Panel Discussion of Developments, Trends and Issues Affecting Commercial Property Iowa Commercial Real Estate Expo
 A Panel Discussion of Developments, Trends and Issues Affecting Commercial Property By Bryon Tack, MAI, CAE Polk County Deputy Assessor January 1 : Assessment of property (appraisal date) Historical data
Housing Bulletin Monthly Report
 October 21 1 Housing Bulletin Monthly Report Housing Starts show Slight improvement in September CANADA Housing Starts 2, 15, 1, 5, Sep 8 Oct 8 Nov 8 Dec 8 Preliminary Housing Starts in Alberta and Canada
RESIDENTIAL REVIEW. Better Technology Better Marketing BETTER RESEARCH Better Education Better Support
 RESIDENTIAL REVIEW Better Technology Better Marketing BETTER RESEARCH Better Education Better Support TABLE OF CONTENTS 3 Residential Resale Overview 4 Residential Investment Research 5 Better Technology
MONTHLY STATISTICS PACKAGE. City of Calgary. May creb.com
 MONTHLY STATISTICS PACKAGE City of Calgary May 1 creb.com Housing supply swells in cool spring market MONTHLY STATISTICS PACKAGE City of Calgary May 1 City of Calgary, June 1, 1 Calgary s housing inventory
News Release FOR IMMEDIATE RELEASE:
 News Release FOR IMMEDIATE RELEASE: sales exceed historical average VANCOUVER, BC November 2, Metro Vancouver* home sales exceeded typical historical levels in with the majority concentrated in the townhouse
Market Report. Manhattan Q Significant findings in Q3 2009
 ket Report Q3 StreetEasy is pleased to present our Q3 Quarterly Report on the residential market. The bulk of the report is based on approximately 3,300 recorded sales for this quarter as well as over